Article

Pooled Prediction of the Individual and Combined Impact of Extreme Climate Events on Crop Yields in China

1
Key Laboratory of Land Surface Pattern and Simulation, Institute of Geographic Sciences and Natural Resources Research, Chinese Academy of Sciences, Beijing 100101, China
2
University of Chinese Academy of Sciences, Beijing 100049, China
3
College of Oceanography and Ecological Science, Shanghai Ocean University, Shanghai 201306, China
*
Author to whom correspondence should be addressed.
Agronomy 2025, 15(10), 2319; https://doi.org/10.3390/agronomy15102319
Submission received: 25 August 2025 / Revised: 23 September 2025 / Accepted: 29 September 2025 / Published: 30 September 2025
(This article belongs to the Section Farming Sustainability)

Abstract

The increasing frequency of extreme climate events (ECEs) is expected to significantly affect crop yields in the future, threatening regional and global food security. However, uncertainties in yield projections persist due to regional variability, model differences, and scenario assumptions. Leveraging historical agricultural disaster and meteorological data from China (1995–2014), this study employs the vulnerability curve assessment to determine the most appropriate models for assessing crop yields affected by different ECEs (drought, extreme precipitation, extreme low temperature, and extreme wind) across six regions. By integrating multi-model and multi-scenario (SSP1-2.6, SSP3-7.0, SSP5-8.5) future climate data from Coupled Model Intercomparison Project Phase 6 (CMIP6), we conducted pooled prediction of the individual and combined impacts of different ECEs on crop yields for the near-term (2020–2040) and mid-term (2041–2060). The median of multi-model prediction of crop yield reductions in China was −16.0% (range: −32.5% to −2.6%), with more severe losses in Northeast, Northwest, and North China, particularly under higher radiative forcing scenarios. Drought is the most destructive of the four types of ECEs. These results will aid decision-makers in identifying high-risk zones for crop yields affected by ECEs and provide a scientific basis for the developing targeted adaptation strategies in various regions.

1. Introduction

The increasing frequency of extreme climate events (ECEs) poses a significant threat to global food security, making it critical to assess and predict their impacts on crop yields to ensure stability and adapt food systems to future climate change [1,2]. ECEs including droughts, heavy rains, frosts and extreme heat have significantly contributed to food yield losses in recent decades [3,4], accounting for 18–43% of the observed global crop yield anomalies [5]. Notably, most studies predict that future global warming will increase the frequency, intensity and spatial extent of ECEs [6,7], which will have a greater impact on the stability of the global food systems [8,9]. Additionally, future global food demand is projected to rise by 30–62% by the 2050s [10], so there is an urgent need to predict the impacts of different ECEs on crop yields, which can help policymakers understand the expected changes in crop yields at local and regional scales and develop effective disaster risk management [11].
Although climate change, particularly ECEs, is widely predicted to result in lower crop yields [12], there are still large uncertainties in the magnitude and even the direction of the effects of different single extreme events on crop yields [11,13]. Current prediction of crop yield changes primarily relies on process-based crop modeling and regression-based statistical approaches [14,15]. Although process-based crop models can effectively predict yield changes under average climate change conditions [16,17], mainstream crop models have poor simulation performance due to their inability to directly identify extreme climatic events [18,19]. Furthermore, the prediction results suffer from large biases due to the limited resolution of the input data [20] and the localization of agricultural management parameters [21]. Traditional regression models can predict the impact of climate extremes on crop yields, but most studies typically use regionally aggregated yield data and single indicators of ECEs, examining only linear relationship between crop yields and impact variables [9], which could not accurately reflect non-linear relationships [22]. At the same time, spatial aggregation may obscure localized impacts of extreme climate events [23]. There is considerable variability in crop yield responses to different ECEs across regions, influenced by factors such as socio-economic development and disaster preparedness [11].
China uses less than 9% of the world’s land to produce about a quarter of the world’s food and feed a fifth of the world’s population [24,25], while also being one of the most natural disaster-prone countries in the world. Therefore, there is an urgent need for high-resolution and diverse data to improve the accuracy of crop yields affected by future ECEs. The updated CMIP6 data have shown significant improvements in modeling the impacts of ECEs on agricultural production [6,26,27], with the variability between models being much smaller than that of CMIP5 [28,29]. Uncertainties in different climate models are likely to cause greater errors in regions sensitive to climate change, such as China, where warming is significantly higher than the global average. There is currently a lack of multi-model ensemble studies assessing the impact of ECEs on changes in crop yields [1,3,4]. Therefore, utilizing the latest CMIP6 climate data to predict the individual and combined possible effects of ECEs on crop yields is expected to reduce modeling uncertainty.
This study aims to comprehensively predict the individual and combined impacts of ECEs on crop yield changes in China, and to develop multi-model and multi-scenario ensemble predictions to reduce uncertainty. The study will (1) identify the characteristics of major ECEs indicators (drought, extreme precipitation, extreme low temperature, and extreme wind) and crop yield variability across six regions of China during the historical period; (2) select the most appropriate models for crop yield variability in different regions affected by different ECEs based on vulnerability curve assessments; (3) measure the impacts of different climatic modes and different SSP scenarios; and (4) predict and simulate the individual and combined impacts of different ECEs on crop yields in China in the near term and medium term. This study will identify high-risk zones for changes in crop yields influenced by ECEs, providing a reference for developing relevant adaptation and mitigation strategies.

2. Materials and Methods

2.1. Data Sources

In order to investigate the individual and combined impacts of ECEs on crop yields in China, we collected historical meteorological station observation data, meteorological prediction data and agricultural disaster data from different provinces in China. The meteorological observation data were obtained from the National Meteorological Science Data Center of China Meteorological Administration (CMA), which included day-by-day maximum and minimum temperatures, precipitation, sunshine hours, relative humidity, wind speed and other climatic variable from 2412 meteorological stations nationwide (Figure 1). The meteorological prediction data come from the Interdisciplinary International Impact Model Comparison Program (ISIMIP), based on the output of CMIP6 under the New Generation Scenario (SSP-RCP), which contains five Global Climate Models (GCMs) (Supplementary Material Table S1). The data were bias-corrected using a parametric quantile mapping method and downscaled by the MBCnSD algorithm, which reduces the spatial resolution of all GCMs data to 0.5° × 0.5°, to ensure the uniformity and reliability of the prognostic data [30,31]. Agricultural disaster data were obtained from the National Bureau of Statistics (NBS) (https://data.stats.gov.cn/), including crop damage caused by drought, extreme precipitation, extreme low temperature, and extreme wind in different provinces.

2.2. Definition of Historical Crop Yield Reduction Rates

We developed a model to assess the impact of ECEs on crop yields using historical disaster data and meteorological observations. This approach employs statistical methods to establish the relationship between disaster-causing factors and crop damage, which is known as the vulnerability curve assessment method and increasingly used in studies of ECEs’ effects on crops [3,32,33]. As our study focuses on exploring the impact of ECEs on crop yields, the dependent variable of the model is defined as the rate of change of crop yields. We collected crop disaster data from various provinces during the baseline period (1995–2014), considering both affected area and disaster-affected area as statistical criteria from 1995 for historical disaster data (data.stats.gov.cn). The affected area is the sown area where crop yields have decreased by 10% to 30% compared to normal years due to disasters, while the disaster-affected area refers to the sown area with yield reductions ranging from 30% to 80% compared to normal years. Areas with reductions exceeding 80% were not considered due to data limitations. Applying the mean values of the affected areas, which are 20% and 55% [3,34,35] respectively, we calculated the rate of change in crop yields by:
Y i t =   A i t × A T i t   +   D i t × D T i t S A i t
where Y i t is the rate of change in crop yields in province t in the year i, A i t is the affected area, A T i t is the rate of yield loss for the affected area, D i t is the disaster-affected area, D T i t is the rate of yield loss for the disaster-affected area, and S A i t is the total sown area of crops. It should be noted that since the crop damage statistics only include drought, extreme precipitation, extreme low temperature and extreme wind.

2.3. Definition of Frequency and Intensity of Four ECEs

The ECEs is considered to have occurred when a specific climatic element exceeds a given threshold [36,37]. Considering the significant inter-provincial differences in China, our study adopted the relative threshold method to carry out the analyses. The thresholds for extreme precipitation and extreme wind were set as the values of the 95th quartile in ascending order of daily precipitation, and daily wind speed during the baseline period (1995–2014). Above this threshold, an extreme event was considered to have occurred. The threshold for extreme low temperature was set to the value of the 5th percentile in ascending order of daily minimum temperature during the baseline period, below which an extreme low temperature was considered to have occurred. Unlike the three extreme events mentioned above, drought event was assessed by using the 12-month Standardized Precipitation Evapotranspiration Index (SPEI) as the indicator. The SPEI was calculated following the methods outlined by current classic studies [38,39].
After defining the thresholds and indicators of extreme events, the frequency (fre) and intensity (ins) of ECEs were further calculated. The frequency of ECEs is defined as the number of days in a year when daily climate values exceeded (fell below) the upper (lower) threshold for ECEs (for drought events, the frequency is measured by the number of months in which the SPEI was <−0.5 [40,41]). The intensity of ECEs is defined as the sum of daily climate values at the ECEs occurring in each year (for drought events, the intensity is calculated by the sum of SPEI values for months with SPEI < −0.5).

2.4. Selection of the Most Suitable Model for the Impact of ECEs on Crop Yields

In selecting the independent variables for our models, we compare the effects of each extreme event and their explanatory power by several combinations of different ECEs. Early studies often used the frequency or intensity of ECEs separately as independent variables to establish a linear relationship with disaster-related outcomes. However, more recent research has highlighted the non-linear relationship between the negative impacts of ECEs and their frequency and intensity, leading to attempts to fit these impacts using quadratic functions [22,42]. Both frequency and intensity could be considered as important indicators for characterizing ECEs from different perspectives. Therefore, we consider the influence of ECEs in both frequency and intensity, constructing eight linear and nonlinear models to assess the effects of drought, extreme precipitation, extreme low temperatures, and extreme wind on crop yields across six regions of China (Table 1). We select the optimal model to accurately represent the impact of each extreme event on crop yields in each region.
Based on the selected indicators of ECEs, we calculated the frequency and intensity of ECEs for each year at meteorological stations across the country during the historical period. The provincial-level frequency and intensity were aggregated by averaging the data from all stations within each province. By combining the yield change data and ECEs data of provinces within each region, we fitted the model using eight different formulas and analyzed their fitting effects. The selection of the best-fit model for the impact of ECEs on crop yields was based on the significance test [43], the AIC criterion [44] and the BIC criterion [45]. We prioritized the model with the smallest AIC value and the largest BIC value. For significance, models that passed the 0.1 significance level were considered weakly significant, while those passing the 0.05, 0.01, and 0.001 levels were regarded as strongly significant.

2.5. Pooled Prediction of the Impact of Four ECEs on Crop Yields in China

We calculated the changes in the frequency and intensity of the four ECEs (Supplementary Material Figure S1–S8) under the two periods (2021–2040, 2041–2060) of the three scenarios (SSP1-2.6, SSP3-7.0, SSP5-8.5) based on the climate prediction data from the five CMIP6 models. The three scenarios SSP1-2.6, SSP3-7.0 and SSP5-8.5 represent low, medium and high radiative forcing, respectively. Assuming that anthropogenic management measures remain the same as in the baseline period, we input the changes in frequency and intensity into the selected optimal model for assessing yield impacts of ECEs in different regions to analyze the future temporal changes in crop yields in different regions under the effects of each ECE. We used the median value of the 15 outcomes projected by the multi-model multi-scenario ensemble to represent the individual impacts of different ECEs on crop yields in the near term (2020–2040) and medium term (2041–2060). On this basis, we measured the median of the individual impacts of the four ECEs to represent the combined impacts, and analyzed the spatial and temporal patterns of the combined impacts on crop yields across different regions under different future scenarios.

3. Results

3.1. Optimal Modeling of the Impact of Different Extreme Climate Events on Crop Yields in Different Regions

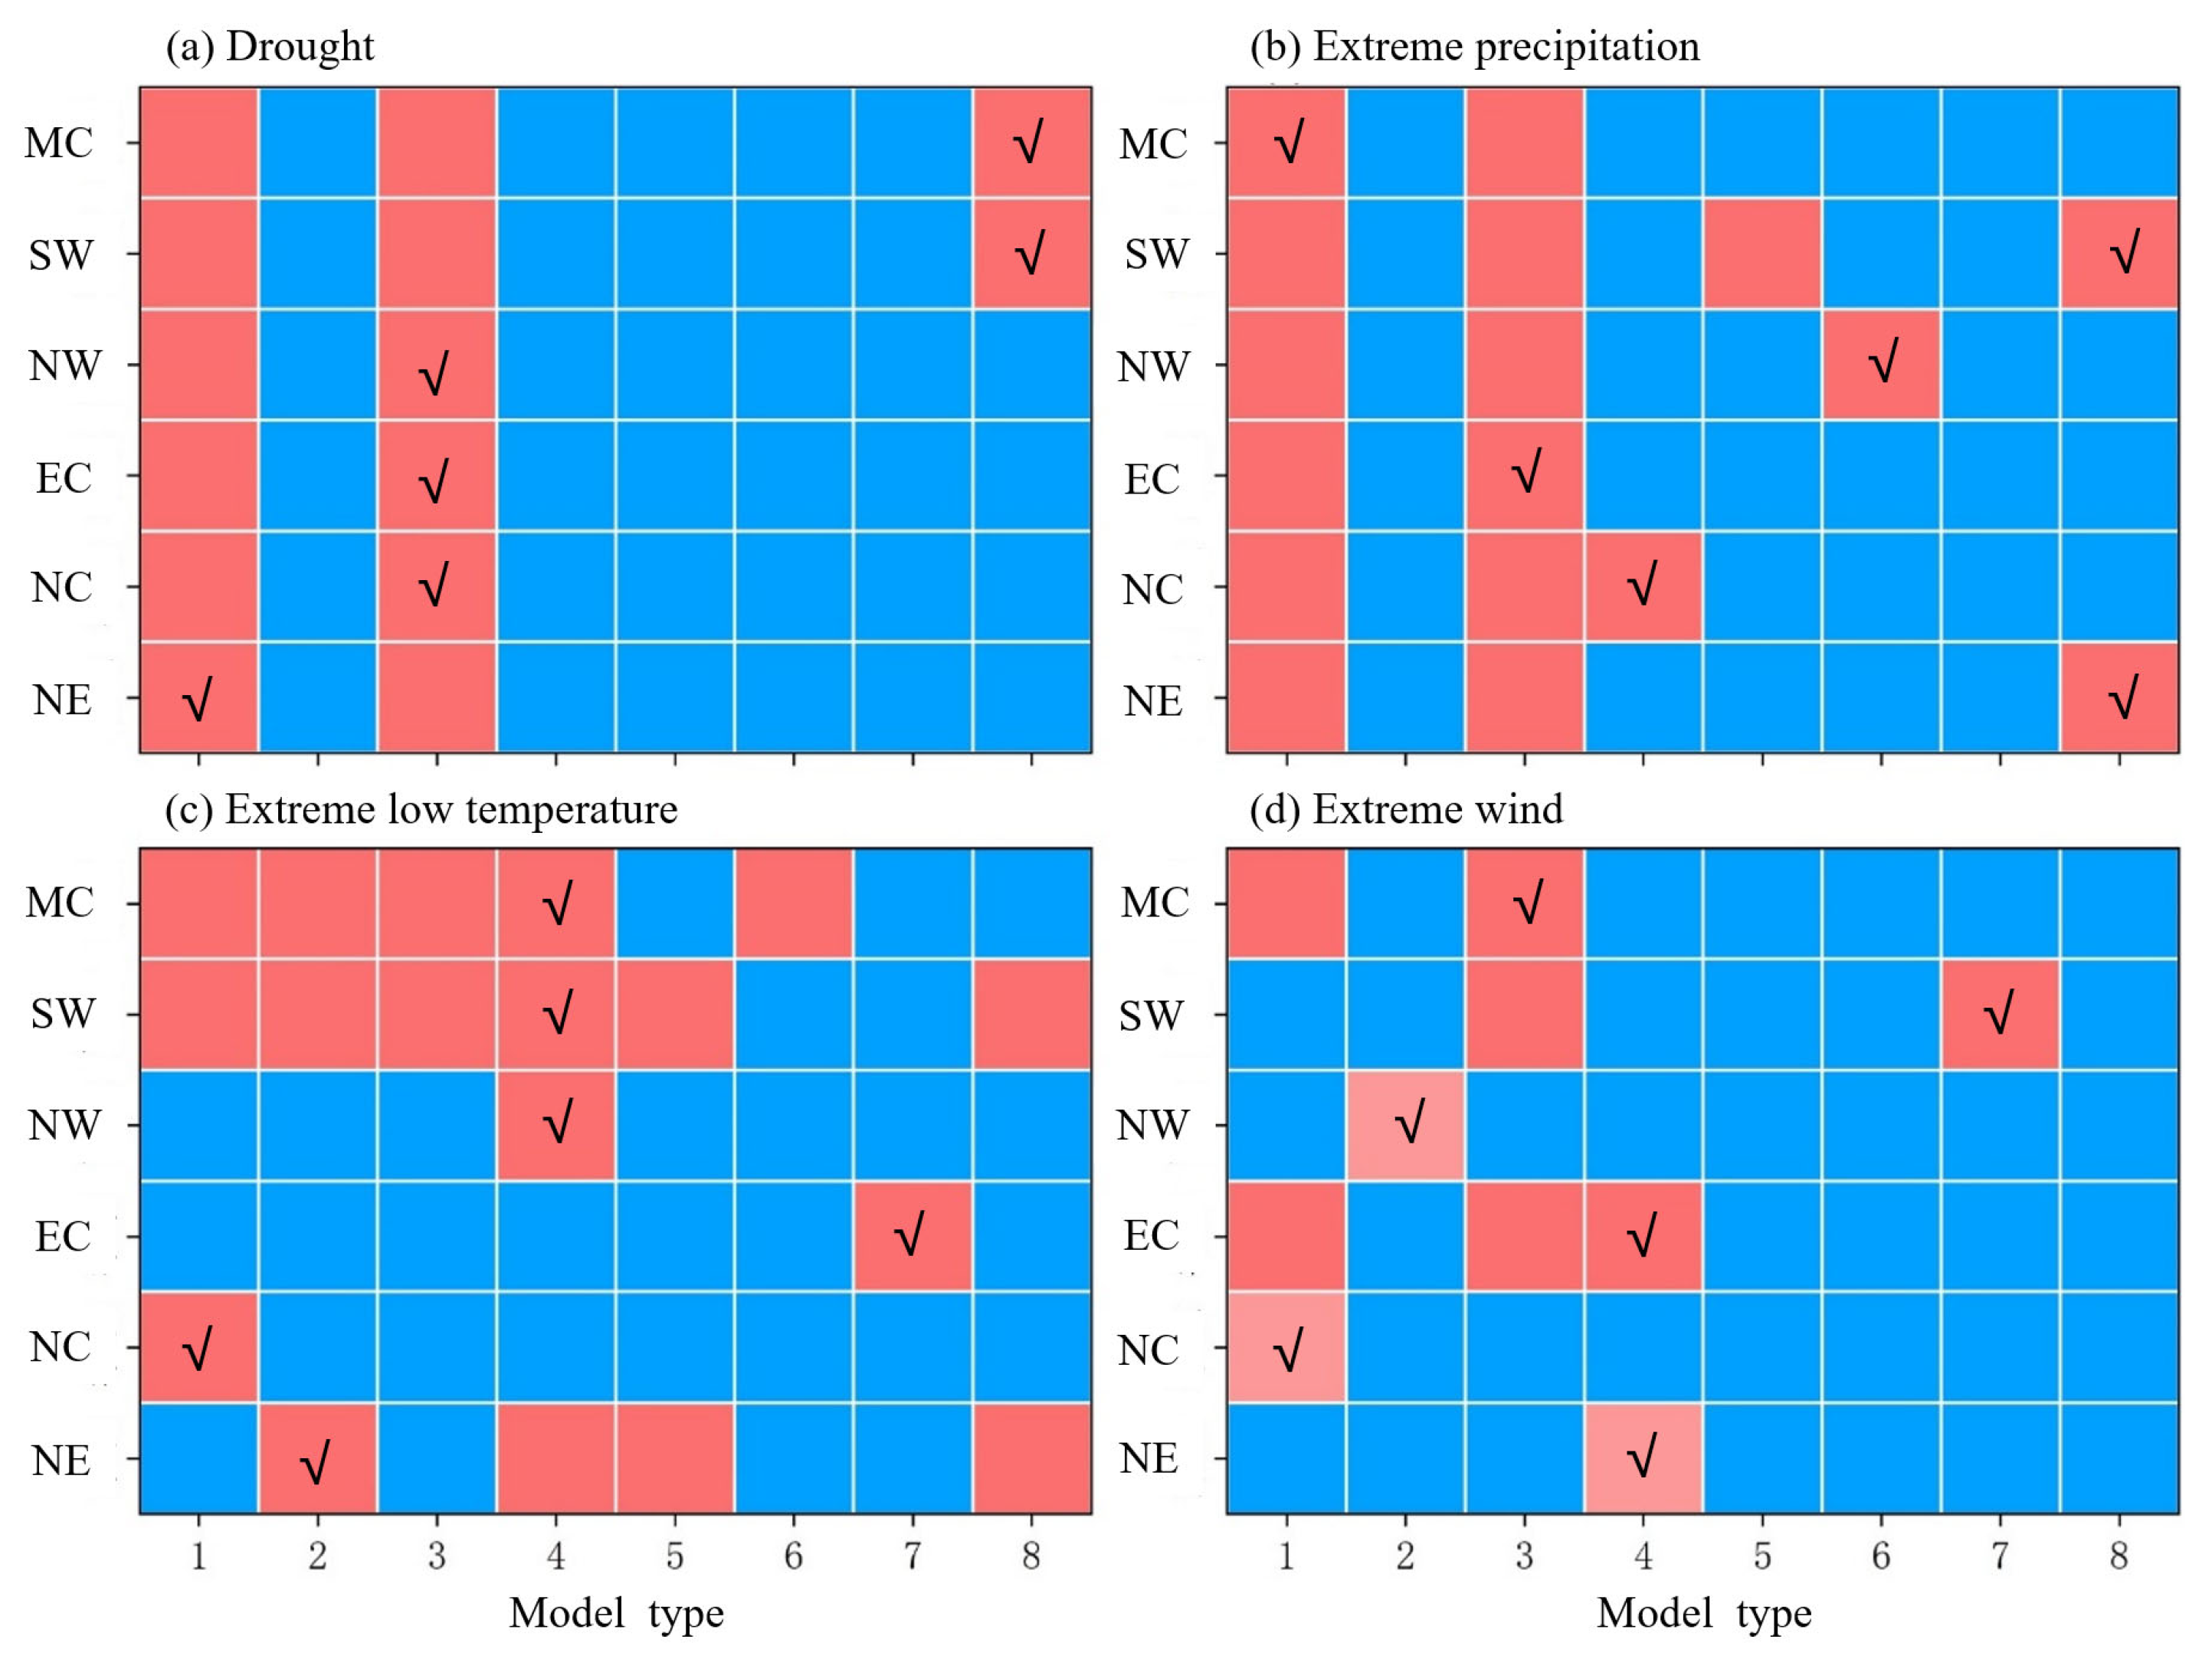
Combining the results of the significance test (Figure 2), AIC criterion and BIC criterion (Supplementary Material Tables S2–S5), the final selection of the optimal model for each extreme event in each region is shown in Figure 2 and Supplementary Material Table S6. The results show that there are notable regional differences in the crop yields response to the same ECEs in different regions. For example, the response of crop yields to drought in EC and NW is primarily related to the intensity of drought, but the sensitivity coefficient in EC is lower than that in NW, which may be mainly due to two factors. Firstly, EC benefits from abundant precipitation and sufficient irrigation, allowing crops affected by drought to be supplemented with the water, and secondly, EC’s more developed economy enhances its adaptation to drought and risk management capabilities. In addition, within the same region, the response of crop yields to different ECEs varies significantly, which may be due to a combination of reasons, such as the crop mechanistic process responding to different ECEs, as well as occurrence timing, and differences in the frequency and intensity of occurrence. The results of model construction and selection fully demonstrate the necessity of constructing and selecting the most suitable models for different regions and ECEs on crop yields.

3.2. Relative Changes in Crop Yields Due to Individual Impacts of Extreme Climate Events

3.2.1. Relative Changes in Crop Yields Under the Individual Impacts of Drought

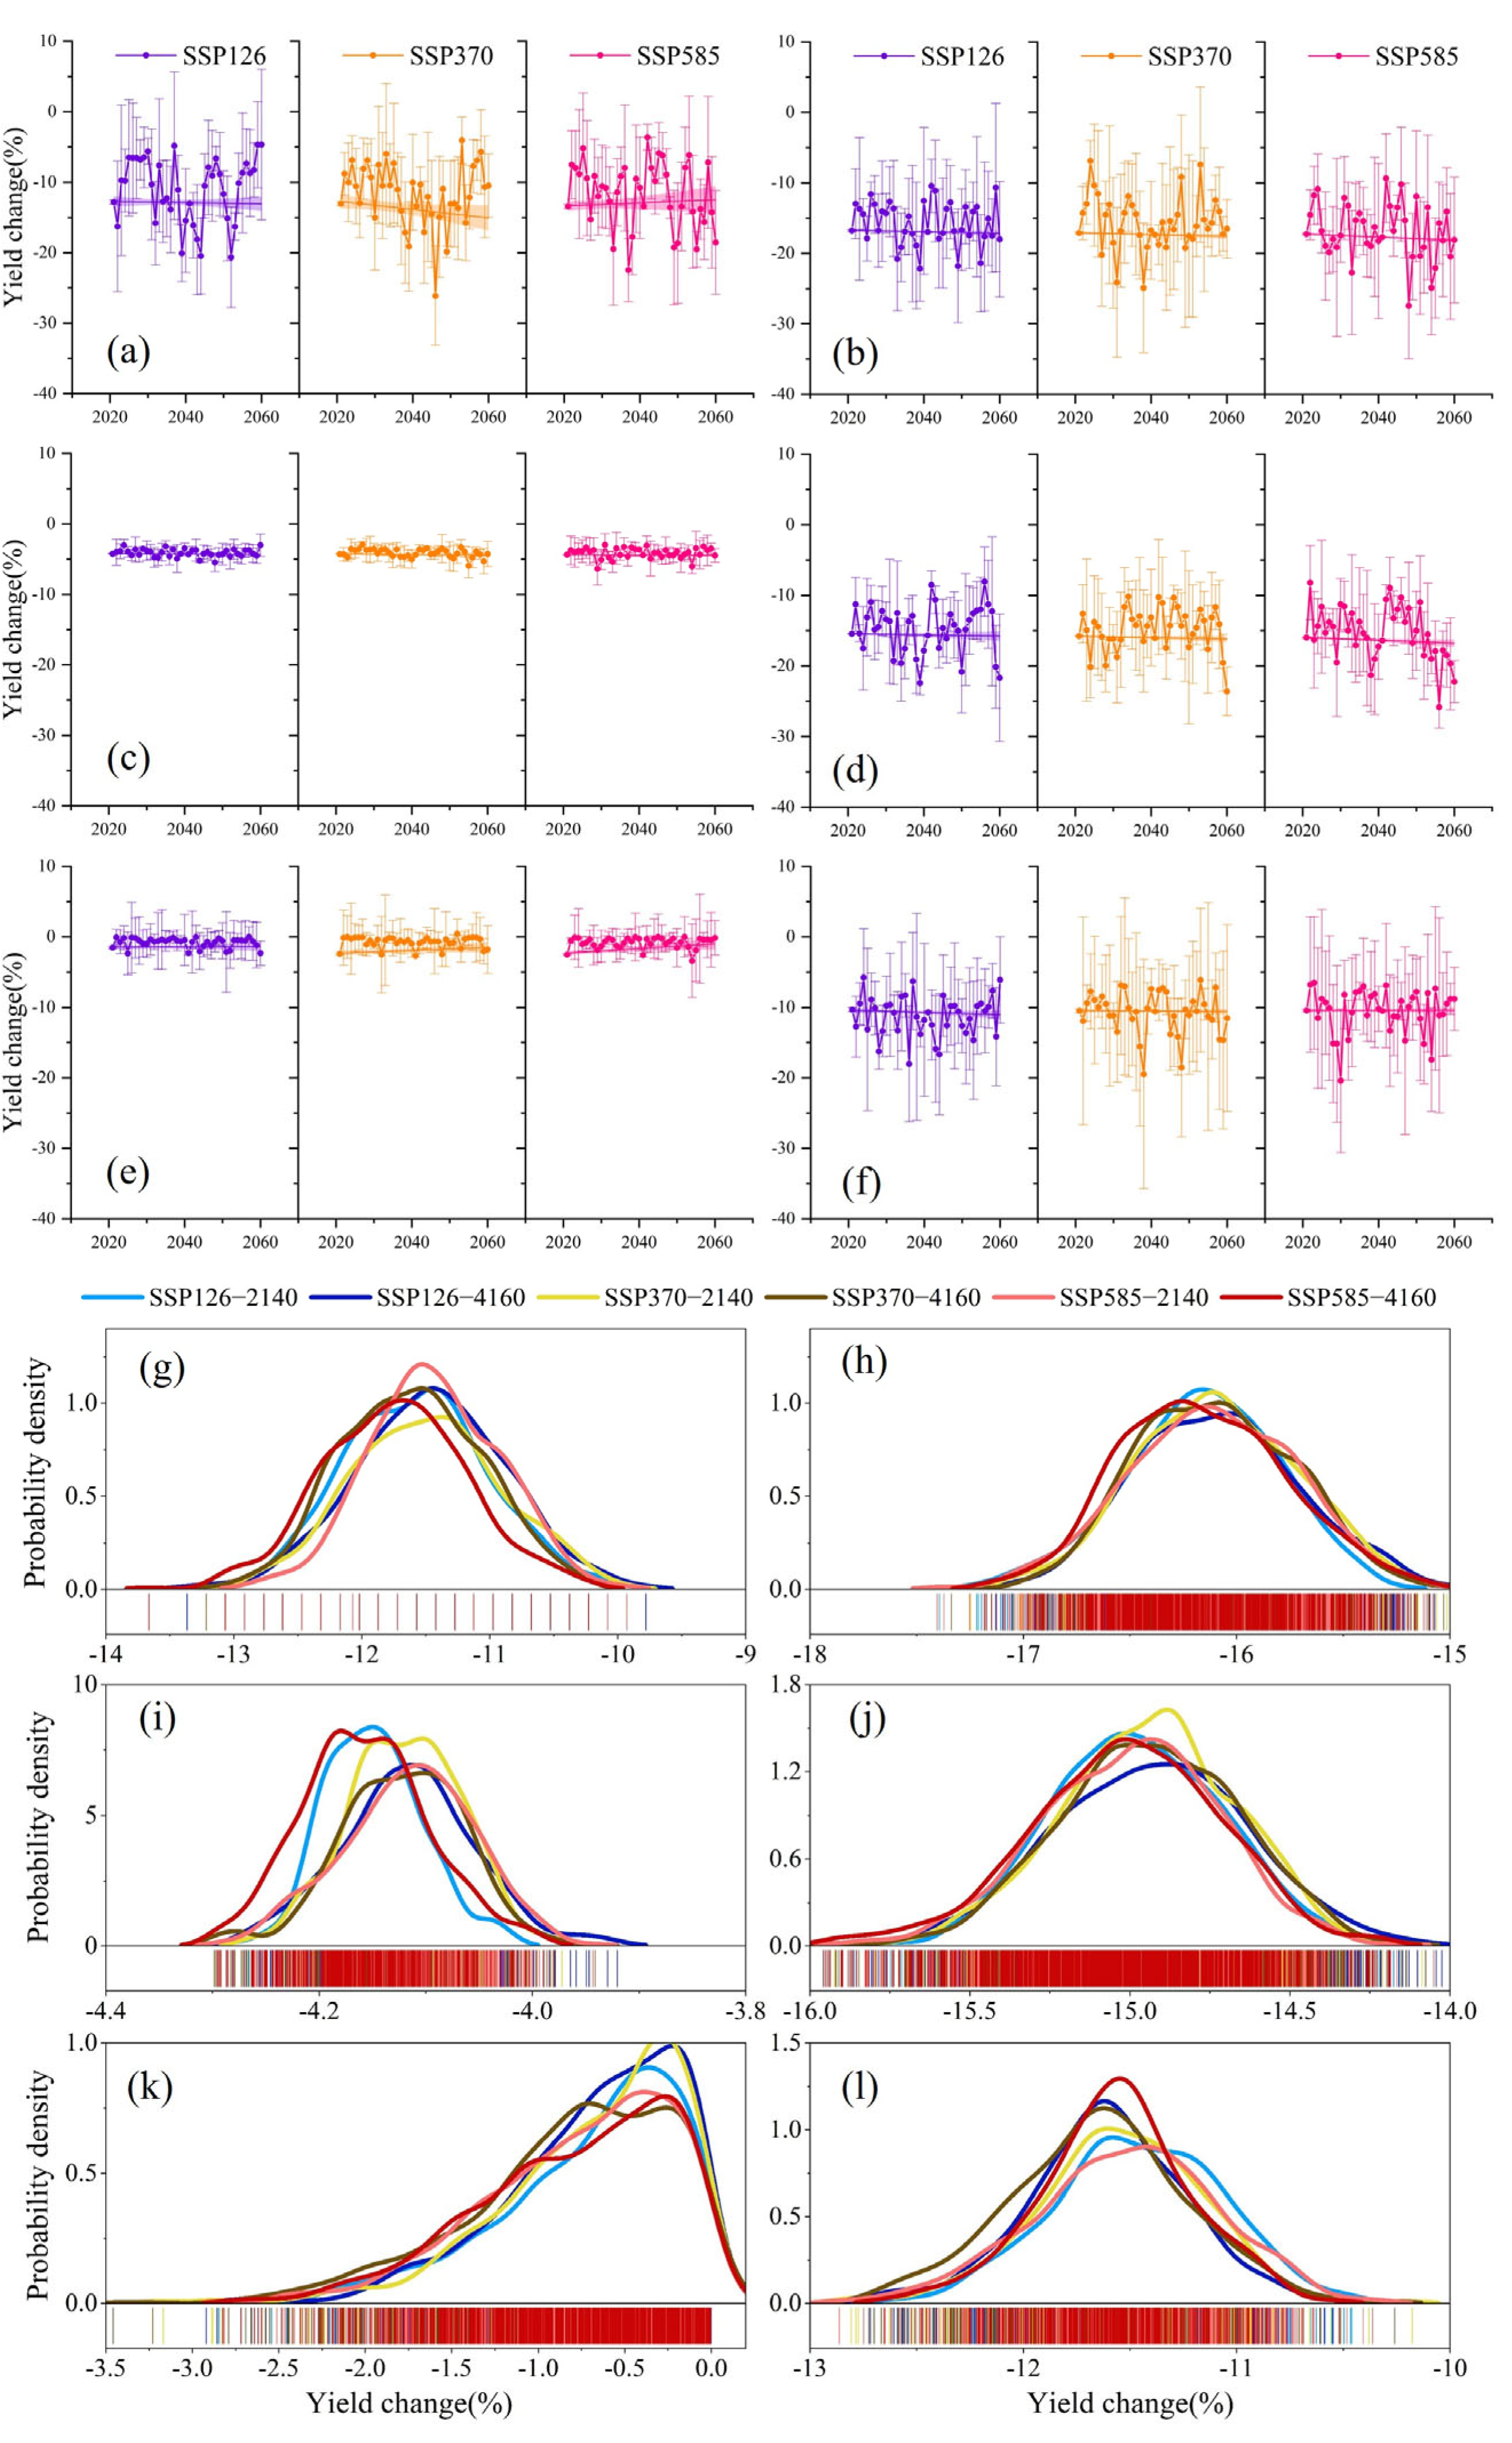
The changes in crop yields influenced by drought across the six regions of China under the three future scenarios generally exhibit fluctuating downward trends (Figure 3a–f). The magnitude of yield reduction due to drought is positively correlated with radiative forcing. In the same region, variations in the frequency and intensity of droughts, caused by differences in radiative forcing, lead to differences in the scenarios of changes in crop yields (Supplementary Material Figures S1 and S5). The magnitude of drought-affected crop yield reduction and inter-model variability varied among regions, with the largest yield reductions exceeding 20% in NE, NC, and NW (Figure 3g,h,j), while drought-affected yield reductions in EC and SW are less than 10% (Figure 3i,k,l), with the smallest variations in simulation predictions across models. Crop yields in the northern regions (NC, NW, and NE) are more negatively affected by drought than those in the southern regions (CS, EC, and SW) under the future scenario. Crop production in NC is the most affected, with yields declining by more than 15% from the base period under all scenarios and time periods, while yields in SW decline by less than 4% due to the drought.
The pattern of spatial distribution of changes in crop yields under the impact of drought is mainly caused by regional differences in crop response to drought (Figure S9). The differences may come from variations in the types of crops cultivated, specific varieties of the same crop, and regions’ capacities to cope with drought disasters. Overall, drought leads to more pronounced yield declines and spatial heterogeneity within regions over time. For example, in the same scenario, yields in EC and CS for 2041–2060 are lower than those for 2021–2040, and the range of yields within regions increases significantly, implying that the probability of substantial drought-induced yield reductions will increase significantly over time.

3.2.2. Relative Changes in Crop Yields Under the Individual Impacts of Extreme Precipitation

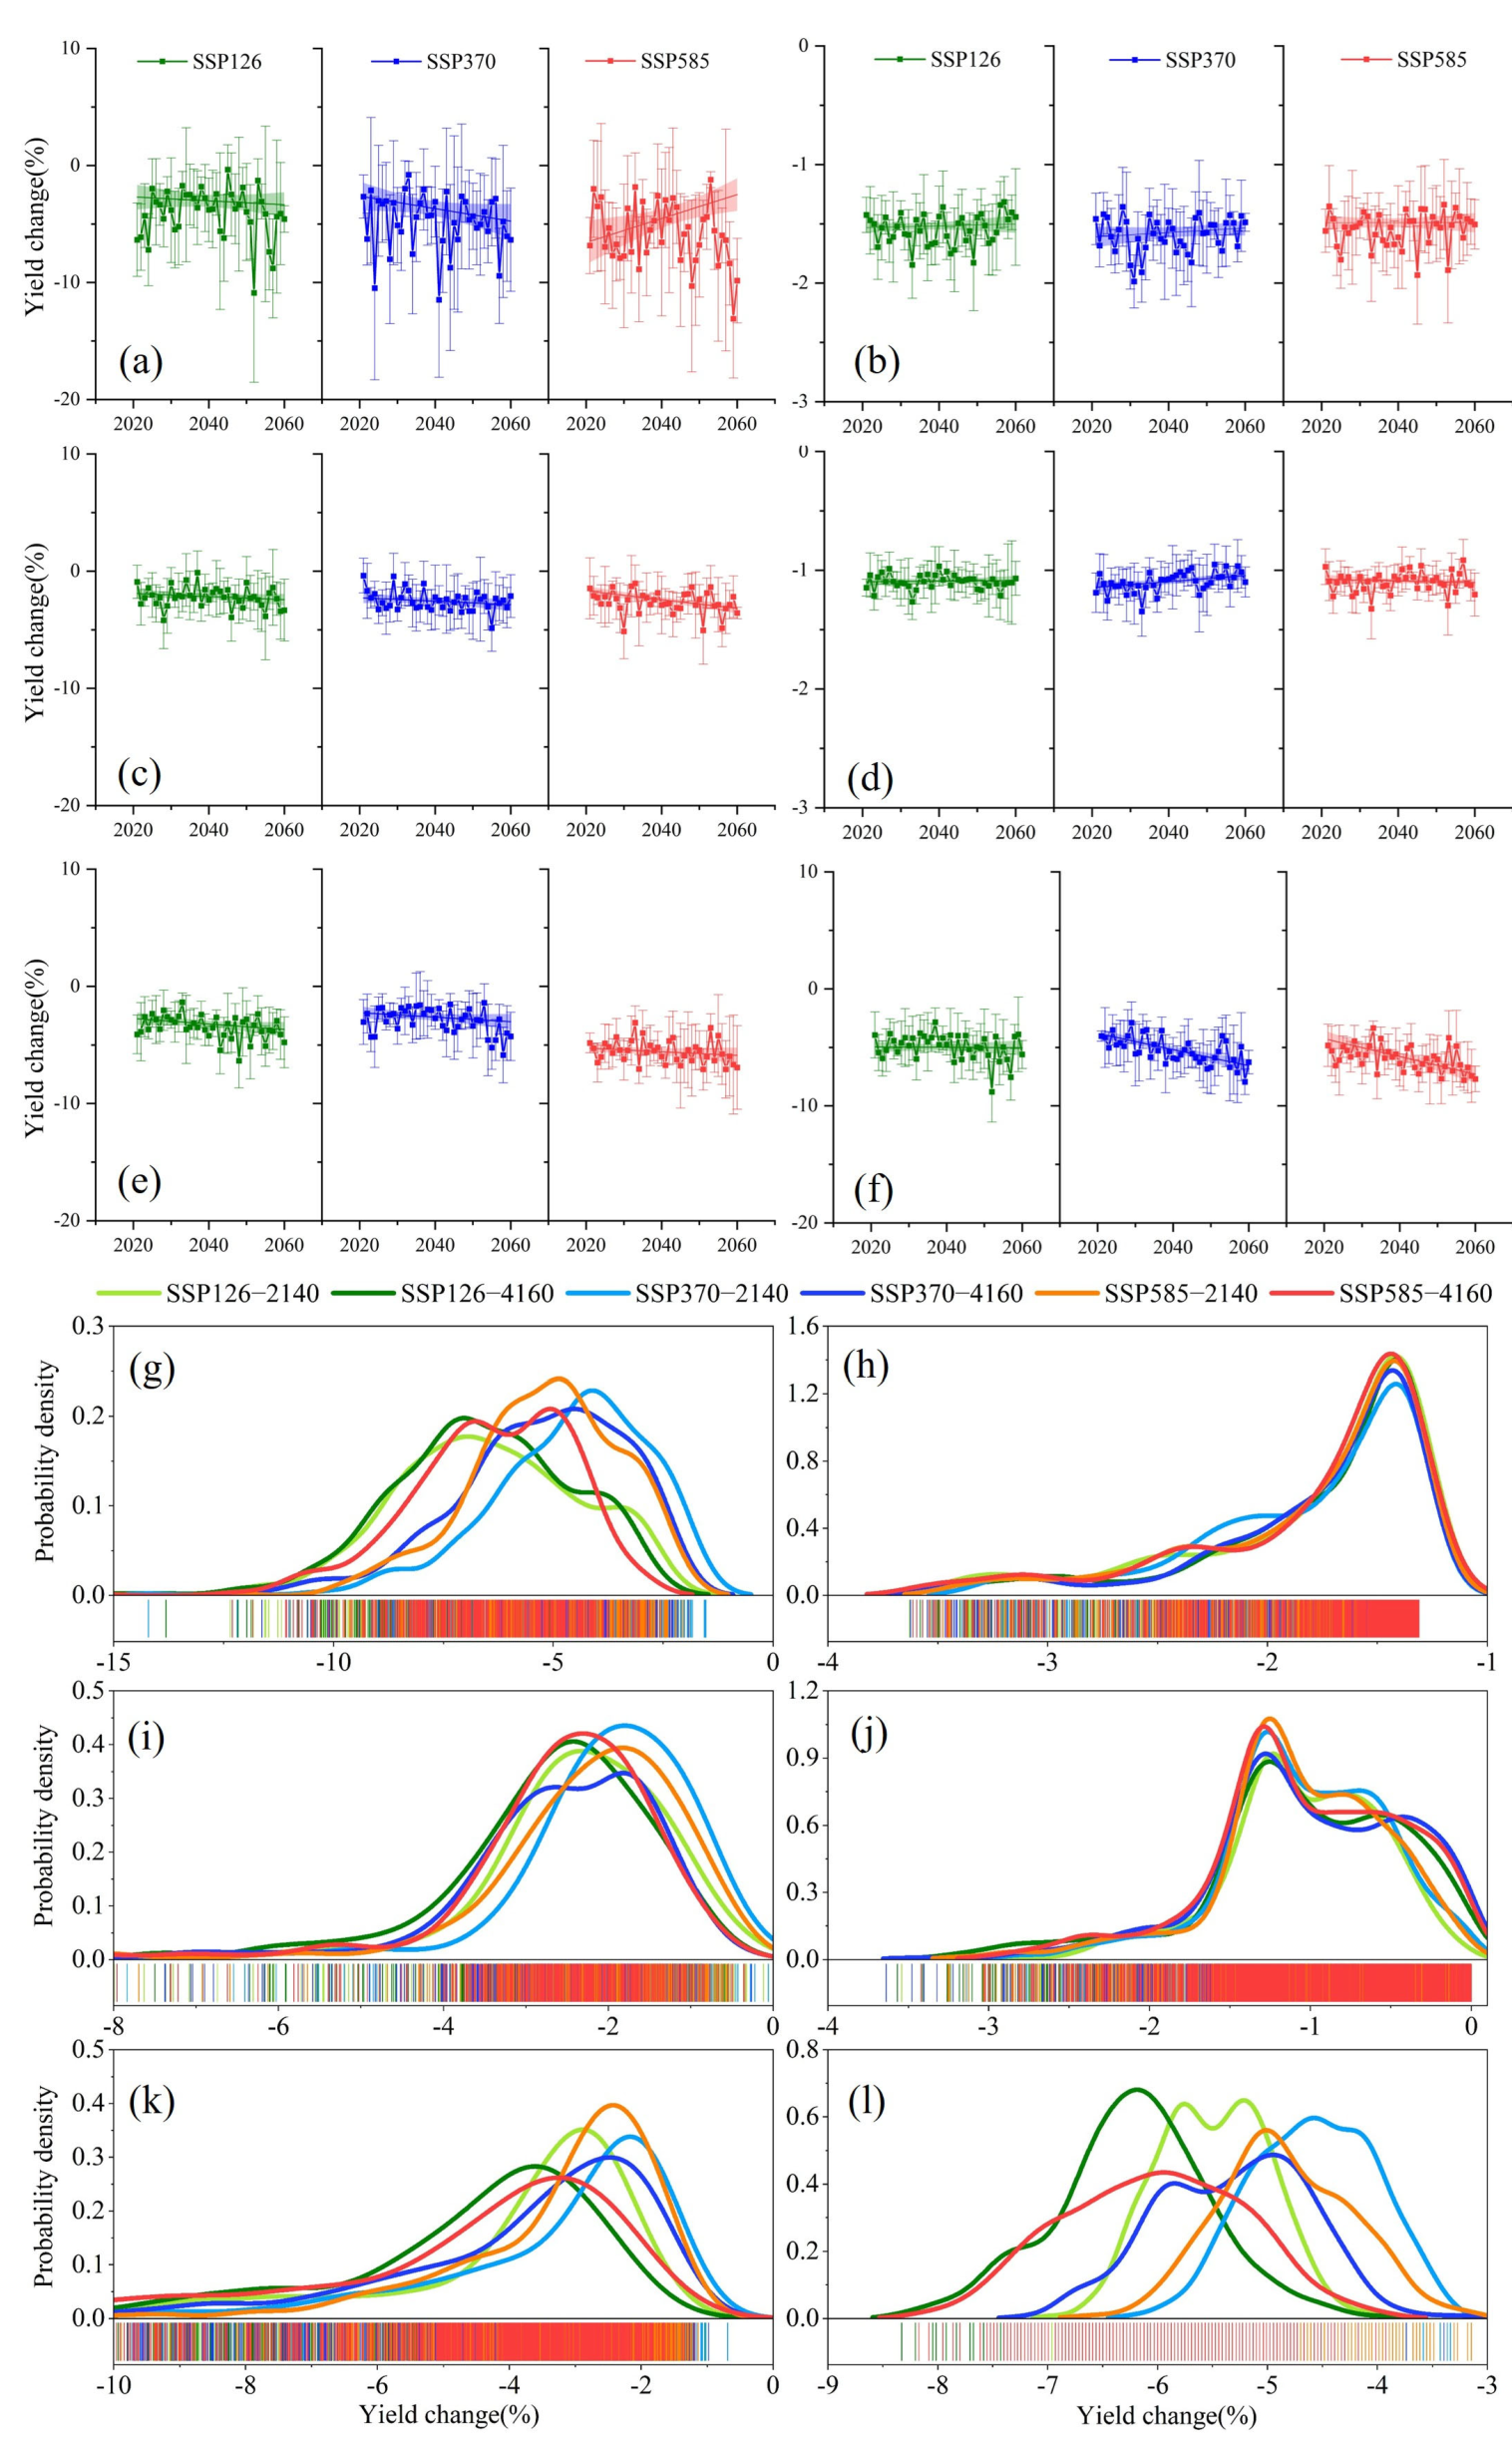
Under the future climate change scenarios, extreme precipitation has varying negative impacts on crop production across different regions of China, with divergence in yield change trends (Figure 4a–f). Specifically, crop yields in the SW and CS regions indicate significant decreasing trends in all three SSP-RCP scenarios. In contrast, the yields in NE and EC decrease slightly less in magnitude and rate compared to those in SW and CS regions. NC demonstrates a slight upward trend in yields under all three scenarios, and NW also show an upward trend under the SSP3-7.0 and SSP5-8.5. Differences in the trends of future extreme precipitation events in different regions are the main reason for the inconsistent direction of yield change trends (Supplementary Material Figures S2 and S6). Overall, the impact of extreme precipitation on crop yields is slightly smaller than that of drought, with NE being the most severely affected, experiencing a maximum decline of over 10%, while NC and NW are the least affected by extreme precipitation (Figure 4g–l).
Due to the complexity and uncertainty of precipitation predictions in future scenarios, all regions exhibit more pronounced pattern differences in crop yield changes. The impact of extreme precipitation on future changes in crop yields in China as a whole shows a longitudinal pattern, decreasing from the coast to the interior (Figure S10). Crop yields in the northwestern region of Xinjiang and western Qinghai, and in northwestern Gansu are the least affected by extreme precipitation, with reduction of no more than 1% under all scenarios and time periods. These regions are located in the interior of the continent, far from the oceans, where precipitation is scarce and water supply is the main limiting condition for crop growth. Therefore, crop production in these regions is much more affected by drought than extreme precipitation. In contrast, the southern regions with relatively abundant precipitation, such as Guangdong, Guangxi, and Hainan, are more susceptible to extreme precipitation. The spatial distribution is consistent with the annual precipitation pattern in China. In addition, the negative impacts of extreme precipitation on crop yields intensify over time, and the differences in yield changes in different time periods becoming increasingly apparent with the increase in radiative forcing. For example, under the SSP1-2.6 scenario, the difference in the range of crop yields between the two time periods is insignificant in most regions, while the probability of yields exceeding 5% in the northeastern, southwestern, and south-central regions in the 2041–2060 scenario is higher than that in the 2021–2040 scenario.

3.2.3. Relative Changes in Crop Yields Under the Individual Impacts of Extreme Low Temperature and Extreme Wind

Compared to drought and extreme precipitation, the impact of extreme low temperatures on crop yields in China is relatively minor, with a maximum yield reduction of about 6% across all regions and under all scenarios (Figure 5a–f). In terms of time scale, the impact of extreme low temperature on crop yields shows a decreasing change, which is mainly due to the climate change, mainly characterized by warming, which results in a reduced frequency and intensity of extreme low temperatures in the future. Therefore, their negative impact on crop yields is also decreasing (Supplementary Material Figures S3 and S7). The extent of the impact of extreme low temperatures on crop yields decreases with increasing radiative forcing. All six regions, with the exception of NE, which shows a slight upward trend, exhibit a declining trend. Changes in yields under future scenarios in all regions show a significant upward trend. Comparing the degree of impact of extreme low temperatures on crop yields in different regions, the NW is more affected than others, while the SW is the least impacted. The reasons for these regional differences could be due to the cropping patterns in these areas. In the NE, crops such as spring wheat, middle-season rice, and spring maize are sown in spring and harvested in summer or autumn. In contrast, winter wheat in certain southern areas of the NW is sown in autumn and harvested in the following summer. Thus, while both regions are at higher latitudes where low-temperature and cold damage events are common in winter, crops in the NW are more vulnerable to extreme low-temperature events due to their exposure during critical growth periods.
Extreme wind has the least impact on crop yields in our analysis. The maximum future reduction in crop yields across the six regions under the influence of extreme wind does not exceed 3% (Figure 6a–f). Under different climate change scenarios, the impact of extreme wind on crop yields exhibits a decreasing time-varying trend, which is more similar to the trend under the impact of extreme low temperatures. Only EC and CS under the SSP5-8.5 scenario and NW under the SSP3-7.0 scenario exhibited increasing temporal trends in the impact of extreme wind on crop yields. This is mainly because the frequency and intensity of extreme wind in China are generally declining under future scenarios (Supplementary Material Figures S4 and S8), though the frequency and intensity in the NW and southern regions under the medium- and high-emission scenarios show a certain increasing trend. Under the influence of extreme wind, future changes in China crop yields showed a zonal pattern that increases with latitude. Crop yields in NW, NC and NE are expected to decrease more than those in EC, SW and CS regions. The overall impact of extreme wind on crop yields in China is low, with NC and NW being slightly more negatively affected by extreme wind than other regions.

3.3. Estimation of the Combined Impact of Extreme Climate Events on the Crop Yield Change

Under the combined effects of the major ECEs in the future, crop yields in all regions of China are projected to decline significantly by −16.0% [range: −32.5%, −2.6%] compared with the baseline period, with variations in the temporal trends of yields in different regions (Figure 7). Specifically, NE, EC, and SW show a decreasing trend in crop yields under all scenarios, while the decline in crop yields in NC and NW is slightly mitigated under the low-emission scenario SSP1-2.6, but the degree of adverse impacts of the ECEs under the medium- to high-emission scenarios will still be deepened over time. The adverse impacts of ECEs on crop production will intensify with increasing radiative forcing, with decreasing and enhancing temporal trends in yield changes under the SSP5-8.5 scenarios for the NE, NW, and SW regions. Comparing the extent of impact from ECEs, EC and SW are the least affected, with maximum yield declines of about 10%, whereas the other four regions are more deeply affected by ECEs, with greater fluctuations between years and maximum yield declines of more than 30%.
Under the combined effects of drought, extreme precipitation, extreme low temperatures and extreme wind, future changes in crop yields in China show significant spatial variability. Crop yields in the NW, NC and NE regions will decrease more than those in the EC, SW and CS regions, with the degree of crop yields decline increasing with time and rising radiative forcing (Figure 8). Previous analyses reveal that there are scenario and temporal divergence in the impacts of different ECEs on crop yields. In particular, the negative impacts of drought and extreme precipitation on crop yields intensify with time and increasing radiative forcing, while the impacts of extreme low temperatures on crop yields decrease with time and increasing radiative forcing. Comparison of the magnitude of the effects of the four ECEs on crop yields shows that drought has the greatest impact on crop yields, followed by extreme precipitation, with extreme low temperatures and extreme wind contributing relatively little to the reduction in yields. Consequently, crop yields under the combined effect of all ECEs will still face the greatest threat in the middle of the twenty-first century (2041–2060) under the high-emission scenario (SSP5-8.5). The spatial distribution of future changes in crop yields in China under the combined effects of ECEs are also more consistent with the spatial distribution under the effects of drought. The findings suggest that an effective response to drought is essential to reduce the negative impact of ECEs on crop yields.

4. Discussion

In this study, we constructed and selected the optimal model for selecting the impact of ECEs on crop yields based on meteorological observations and historical disaster data. We then predicted the individual and combined impacts of the four ECEs on crop yields in the near and medium term under the three future SSP scenarios across most regions. The results indicate a decrease in crop yields in the future, highlighting some issues worth discussing.
Concerning the construction and selection of the optimal model, several factors can lead to significant variations in predicted changes in crop yields, including the selection of parameters (such as the type of ECEs, thresholds, frequency, and intensity), the accuracy of the data used to fit the model (including issues like small sample sizes, imprecise spatial extents, and missing data), and the uncertainty in output data across different climate models. In order to reduce the uncertainty of the study, we used relative thresholds with SPEI indices to characterize each ECE, which has the advantage of effectively reflecting regional differences in geographic features. In terms of data use, day-by-day observation data from 2412 meteorological stations and year-by-year crop damage data from each province were used to ensure the sample size for model construction. Besides, the country is divided into six regions to construct the model to clarify the regional differences in the response of crop yields to ECEs within the country. In the selection of model parameters, some studies have used only one of the frequency or intensity of ECEs to construct loss models for ECEs in a simplistic approach [42,46], our study considered the possible differences in the impacts of different ECEs in different regions by constructing both linear and non-linear regression models, and selected the optimal model to maximize the impacts of each ECEs on each region.
The study found that ECEs are expected to lead to a 16.0% reduction in crop yields in China, which is basically consistent with the direction of the impacts of related studies, but with a higher magnitude. This may be due to the fact that some studies only considered a single linear model, a single extreme climate event, a single climate scenario, and a single crop for assessment [1,9]. In contrast, our study utilized multi-scenario ensembled climate data to conduct the analysis, selecting the median from multiple models to examine the spatial and temporal patterns of future changes and used the standard deviation of the five model predictions to quantify the uncertainty, providing greater reliability compared to predictions derived from a single model [28,47]. It is worth noting that drought caused the largest reduction in crop yields, followed by extreme precipitation and extreme low temperature, and extreme wind that caused the smallest reduction in crop yields, which is also consistent with the spatial and temporal patterns of ECEs in China, where drought and heavy rainfall as ECEs have posed threats to future development [3]. Although the negative impacts of extreme low temperatures and extreme wind show a decreasing temporal trend, the impacts of drought and extreme precipitation on crop yields remain significantly higher. Therefore, crop yields will continue to decline under the impacts of these two events in the future, combining the impacts of all the ECEs, with reduction deepening from the near to middle of the twenty-first century. Policy makers must adopt measures such as adjusting sowing dates and replacing varieties with those better suited to extreme climate events to mitigate future risks in severely affected areas, including arid regions in the Northwest and areas experiencing heavy rainfall in the Northeast.
This study still has some limitations. First, only drought, extreme precipitation, extreme low temperature, and extreme wind were modeled, while other ECEs that may affect crop yields were not included due to the lack of data, such as extreme high temperatures. In fact, extreme high temperature can disrupt photosynthesis, increase water loss, and lead to cell death, ultimately leading to the yellowing and death of crops [48,49]. High-temperature stress can shorten the rice filling period, increase the rate of empty grains, cause wheat to experience green-drying and early maturity, and lead to delayed male flowering and poor pollination in maize, all of which significantly affect yields [50,51]. The frequency and intensity of extreme high temperatures in China are expected to increase significantly in the future, and neglecting the importance of the extreme high temperature impact is likely to underestimate the possible impact of future ECEs on crop yields. In addition, the prerequisite for applying the model constructed based on historical measured data to the future estimation of changes in crop yields is the assumption that anthropogenic management measures do not change under the future scenarios and remain consistent with the baseline period. This implies that only the influence of ECEs is taken into account, which is in line with the objective of our study, focusing on the quantification of the impact of climate change on crops and their economic impacts, whereas through implementing intervention measures such as adjusting sowing dates, adopting improved crop varieties or cultivars (with slower maturation and greater adaptability), and optimizing irrigation and soil moisture management to mitigate the adverse effects of extreme weather events on crop yields [52,53], the extent of yield reduction under future scenarios will be lower than the predicted results of this study [54]. Moreover, the failure to distinguish the impact of specific crops under particular conditions, coupled with the fact that crops previously unaffected by extreme weather may not necessarily escape its effects in future, may both diminish the accuracy of model predictions. Finally, this study only considered the impacts of single ECEs and lacked consideration of compound ECEs, which may introduce additional uncertainty in the results [36]. The compound dry-hot events significantly reduce wheat and maize yields across most regions globally [55,56]. These factors should be considered in future studies to improve the accuracy of the predictions with high-precision data and local-scale regional analyses.

5. Conclusions

Based on multi-scenario and multi-model data from CMIP6, this study quantitatively predicted the individual and combined impacts of different ECEs on the relative change of crop yields in China. The findings indicate that (1) extreme climate events are expected to lead to a 16.0% [−32.5%, −2.6%] reduction in crop yields in China and that (2) the impacts of droughts and extreme precipitation on crop yields are more serious. The negative impact of drought on crop yield in the north is greater than that in the south, and the yield reduction rate in NC is more than 15%. The impact of extreme precipitation gradually decreases from the coast to the inland, with yield reduction rate in the inland areas of NW not being more than 1%. The impacts of extreme low temperature and extreme wind are relatively minor. (3) The crop yield reductions in NW, NC, and NE will be larger than that in EC, SW, and CS. Additionally, the crop yield reduction in each region will expand with the increase of time and radiative forcing, with the maximum yield reduction in NE, EC, and SW exceeding 30%. Under the high-emission scenario (SSP5-8.5), crop yields in the middle of the twenty-first century (2041–2060) will remain most threatened by the combined effects of all extreme events.

Supplementary Materials

The following supporting information can be downloaded at: https://www.mdpi.com/article/10.3390/agronomy15102319/s1, Figure S1: Spatial distribution of drought intensity under different SSP-RCP scenarios; Figure S2: Spatial distribution of extreme precipitation intensity under different SSP-RCP scenarios; Figure S3: Spatial distribution of extreme low-temperature intensity under different SSP-RCP scenarios; Figure S4: Spatial distribution of extreme wind intensity under different SSP-RCP scenarios; Figure S5: Spatial distribution of drought frequency under different SSP-RCP scenarios; Figure S6: Spatial distribution of extreme precipitation frequency under different SSP-RCP scenarios; Figure S7: Spatial distribution of extreme low-temperature frequency under different SSP-RCP scenarios; Figure S8: Spatial distribution of extreme wind frequency under different SSP-RCP scenarios; Figure S9: Spatial distribution of crop yield changes under the influence of drought; Figure S10: Spatial distribution of crop yield changes under the influence of extreme precipitation; Table S1: Basic information of 5 GCMs selected in this study; Table S2: Model fitting effect of drought on crop yields; Table S3: Model fitting effect of extreme precipitation on crop yields; Table S4: Model fitting effect of extreme temperature on crop yields; Table S5: Model fitting effect of extreme wind on crop yields; Table S6: Optimal models for the effects of different extreme climate events on crop yields in different regions.

Author Contributions

Conceptualization, Y.L. and J.L.; methodology, J.L. and J.C.; software, J.L. and J.C.; validation, Y.L. and J.L.; formal analysis, Y.L., J.L. and J.C.; data curation, J.L. and Z.S.; writing—original draft, Y.L., J.L. and J.C.; writing—review and editing, S.H., E.Z. and T.P.; visualization, Z.S., J.L. and J.C. All authors have read and agreed to the published version of the manuscript.

Funding

This research was funded by the National Key R&D Program of China (Grant No. 2024YFD1501604), the National Science Fund for Excellent Young Scholars (Grant No. 42122003), the Strategic Priority Research Program of the Chinese Academy of Sciences (Grant No. XDA28060200), the National Natural Science Foundation of China (Grant No. 42301087), and the Shanghai Sailing Program (Grant No. 23YF1416400).

Data Availability Statement

Data will be made available on request.

Acknowledgments

We thank the National Meteorological Science Data Center of China Meteorological Administration, the National Bureau of Statistics, and the Inter-Sectoral Impact Model Intercomparison Project for providing data support.

Conflicts of Interest

The authors declare no conflicts of interest.

References

  1. Fu, J.; Jian, Y.; Wang, X.; Li, L.; Ciais, P.; Zscheischler, J.; Wang, Y.; Tang, Y.; Müller, C.; Webber, H.; et al. Extreme rainfall reduces one-twelfth of China’s rice yield over the last two decades. Nat. Food 2023, 4, 416–426. [Google Scholar] [CrossRef]
  2. Lacoste, M.; Cook, S.; McNee, M.; Gale, D.; Ingram, J.; Bellon-Maurel, V.; MacMillan, T.; Sylvester-Bradley, R.; Kindred, D.; Bramley, R.; et al. On-farm Experimentation to transform global agriculture. Nat. Food 2022, 3, 11–18. [Google Scholar] [CrossRef]
  3. Shi, W.; Wang, M.; Liu, Y. Crop yield and production responses to climate disasters in China. Sci. Total Environ. 2021, 750, 141147. [Google Scholar] [CrossRef] [PubMed]
  4. Xu, Q.; Liang, H.; Wei, Z.; Zhang, Y.; Lu, X.; Li, F.; Wei, N.; Zhang, S.; Yuan, H.; Liu, S.; et al. Assessing climate change impacts on crop yields and exploring adaptation strategies in northeast China. Earth’s Future 2024, 12, e2023EF004063. [Google Scholar] [CrossRef]
  5. Vogel, E.; Donat, M.G.; Alexander, L.V.; Meinshausen, M.; Ray, D.K.; Karoly, D.; Meinshausen, N.; Frieler, K. The effects of climate extremes on global agricultural yields. Environ. Res. Lett. 2019, 14, 054010. [Google Scholar] [CrossRef]
  6. Hasegawa, T.; Sakurai, G.; Fujimori, S.; Takahashi, K.; Hijioka, Y.; Masui, T. Extreme climate events increase risk of global food insecurity and adaptation needs. Nat. Food 2021, 2, 587–595. [Google Scholar] [CrossRef] [PubMed]
  7. Liu, Y.; Chen, J.; Pan, T.; Liu, Y.; Zhang, Y.; Ge, Q.; Ciais, P.; Penuelas, J. Global socioeconomic risk of precipitation extremes under climate change. Earth’s Future 2020, 8, e2019EF001331. [Google Scholar] [CrossRef]
  8. Kornhuber, K.; Lesk, C.; Schleussner, C.F.; Jägermeyr, J.; Pfleiderer, P.; Horton, R.M. Risks of synchronized low yields are underestimated in climate and crop model projections. Nat. Commun. 2023, 14, 3528. [Google Scholar] [CrossRef]
  9. Lesk, C.; Rowhani, P.; Ramankutty, N. Influence of extreme weather disasters on global crop production. Nature 2016, 529, 84–87. [Google Scholar] [CrossRef]
  10. van Dijk, M.; Morley, T.; Rau, M.L.; Saghai, Y. A meta-analysis of projected global food demand and population at risk of hunger for the period 2010–2050. Nat. Food 2021, 2, 494–501. [Google Scholar] [CrossRef] [PubMed]
  11. Abramoff, R.Z.; Ciais, P.; Zhu, P.; Hasegawa, T.; Wakatsuki, H.; Makowski, D. Adaptation strategies strongly reduce the future impacts of climate change on simulated crop yields. Earth’s Future 2023, 11, e2022EF003190. [Google Scholar] [CrossRef]
  12. Rezaei, E.E.; Webber, H.; Asseng, S.; Boote, K.; Durand, J.L.; Ewert, F.; Martre, P.; MacCarthy, D.S. Climate change impacts on crop yields. Nat. Rev. Earth Environ. 2023, 4, 831–846. [Google Scholar] [CrossRef]
  13. Asseng, S.; Ewert, F.; Rosenzweig, C.; Jones, J.W.; Hatfield, J.L.; Ruane, A.C.; Boote, K.J.; Thorburn, P.J.; Rötter, R.P.; Cammarano, D.; et al. Uncertainty in simulating wheat yields under climate change. Nat. Clim. Change 2013, 3, 827–832. [Google Scholar] [CrossRef]
  14. Lobell, D.B.; Asseng, S. Comparing estimates of climate change impacts from process-based and statistical crop models. Environ. Res. Lett. 2017, 12, 015001. [Google Scholar] [CrossRef]
  15. Yin, X.; Leng, G. Observational constraint of process crop models suggests higher risks for global maize yield under climate change. Environ. Res. Lett. 2022, 17, 074023. [Google Scholar] [CrossRef]
  16. Sun, T.; Hasegawa, T.; Liu, B.; Tang, L.; Liu, L.; Cao, W.; Zhu, Y. Current rice models underestimate yield losses from short-term heat stresses. Global Change Biol. 2021, 27, 402–416. [Google Scholar] [CrossRef] [PubMed]
  17. Xiao, L.; Liu, B.; Zhang, H.; Gu, J.; Fu, T.; Asseng, S.; Liu, L.; Tang, L.; Cao, W.; Zhu, Y. Modeling the response of winter wheat phenology to low temperature stress at elongation and booting stages. Agric. For. Meteorol. 2021, 303, 108376. [Google Scholar] [CrossRef]
  18. Mo, F.; Sun, M.; Liu, X.-Y.; Wang, J.-Y.; Zhang, X.-C.; Ma, B.L.; Xiong, Y.-C. Phenological responses of spring wheat and maize to changes in crop management and rising temperatures from 1992 to 2013 across the Loess Plateau. Field Crops Res. 2016, 196, 337–347. [Google Scholar] [CrossRef]
  19. Ostberg, S.; Schewe, J.; Childers, K.; Frieler, K. Changes in crop yields and their variability at different levels of global warming. Earth Syst. Dynam. 2018, 9, 479–496. [Google Scholar] [CrossRef]
  20. Guo, Y.; Fu, Y.; Hao, F.; Zhang, X.; Wu, W.; Jin, X.; Robin Bryant, C.; Senthilnath, J. Integrated phenology and climate in rice yields prediction using machine learning methods. Ecol. Indic. 2021, 120, 106935. [Google Scholar] [CrossRef]
  21. Leng, G.; Hall, J.W. Predicting spatial and temporal variability in crop yields: An inter-comparison of machine learning, regression and process-based models. Environ. Res. Lett. 2020, 15, 044027. [Google Scholar] [CrossRef]
  22. Ruane, A.C.; Phillips, M.; Jägermeyr, J.; Müller, C. Non-linear climate change impacts on crop yields may mislead stakeholders. Earth’s Future 2024, 12, e2023EF003842. [Google Scholar] [CrossRef]
  23. Ray, D.K.; Gerber, J.S.; MacDonald, G.K.; West, P.C. Climate variation explains a third of global crop yield variability. Nat. Commun. 2015, 6, 5989. [Google Scholar] [CrossRef]
  24. Zhang, E.; Liu, Y.; Zhang, J.; Shi, Z.; Huang, S.; Liu, J.; Pan, T. Uncovering the large increases of thermal units during crop phenological phases in China since 1981. Eur. J. Agron. 2025, 170, 127721. [Google Scholar] [CrossRef]
  25. Piao, S.; Ciais, P.; Huang, Y.; Shen, Z.; Peng, S.; Li, J.; Zhou, L.; Liu, H.; Ma, Y.; Ding, Y.; et al. The impacts of climate change on water resources and agriculture in China. Nature 2010, 467, 43–51. [Google Scholar] [CrossRef]
  26. Jägermeyr, J.; Müller, C.; Ruane, A.C.; Elliott, J.; Balkovic, J.; Castillo, O.; Faye, B.; Foster, I.; Folberth, C.; Franke, J.A.; et al. Climate impacts on global agriculture emerge earlier in new generation of climate and crop models. Nat. Food 2021, 2, 873–885. [Google Scholar] [CrossRef]
  27. Zhu, H.; Jiang, Z.; Li, L. Projection of climate extremes in China, an incremental exercise from CMIP5 to CMIP6. Sci. Bull. 2021, 66, 2528–2537. [Google Scholar] [CrossRef] [PubMed]
  28. Chen, H.; Sun, J.; Lin, W.; Xu, H. Comparison of CMIP6 and CMIP5 models in simulating climate extremes. Sci. Bull. 2020, 65, 1415–1418. [Google Scholar] [CrossRef] [PubMed]
  29. Grose, M.R.; Narsey, S.; Delage, F.P.; Dowdy, A.J.; Bador, M.; Boschat, G.; Chung, C.; Kajtar, J.B.; Rauniyar, S.; Freund, M.B.; et al. Insights from CMIP6 for Australia’s future climate. Earth’s Future 2020, 8, e2019EF001469. [Google Scholar] [CrossRef]
  30. Cannon, A.J. Multivariate quantile mapping bias correction: An N-dimensional probability density function transform for climate model simulations of multiple variables. Clim. Dyn. 2018, 50, 31–49. [Google Scholar] [CrossRef]
  31. Lange, S. Trend-preserving bias adjustment and statistical downscaling with ISIMIP3BASD (v1.0). Geosci. Model Dev. 2019, 12, 3055–3070. [Google Scholar] [CrossRef]
  32. Chen, F.; Jia, H.; Pan, D. Risk Assessment of Maize Drought in China Based on Physical Vulnerability. J. Food Qual. 2019, 2019, 9392769. [Google Scholar] [CrossRef]
  33. Yue, Y.; Wang, L.; Li, J.; Zhu, A.x. An EPIC model-based wheat drought risk assessment using new climate scenarios in China. Clim. Change 2018, 147, 539–553. [Google Scholar] [CrossRef]
  34. Shi, W.; Tao, F. Spatio-temporal distributions of climate disasters and the response of wheat yields in China from 1983 to 2008. Nat. Hazard. 2014, 74, 569–583. [Google Scholar] [CrossRef]
  35. Simelton, E. Food self-sufficiency and natural hazards in China. Food Secur. 2011, 3, 35–52. [Google Scholar] [CrossRef]
  36. Lesk, C.; Anderson, W.; Rigden, A.; Coast, O.; Jägermeyr, J.; McDermid, S.; Davis, K.F.; Konar, M. Compound heat and moisture extreme impacts on global crop yields under climate change. Nat. Rev. Earth Environ. 2022, 3, 872–889. [Google Scholar] [CrossRef]
  37. Zscheischler, J.; Martius, O.; Westra, S.; Bevacqua, E.; Raymond, C.; Horton, R.M.; van den Hurk, B.; AghaKouchak, A.; Jézéquel, A.; Mahecha, M.D.; et al. A typology of compound weather and climate events. Nat. Rev. Earth Environ. 2020, 1, 333–347. [Google Scholar] [CrossRef]
  38. Zhou, Z.; Zhang, L.; Chen, J.; She, D.; Wang, G.; Zhang, Q.; Xia, J.; Zhang, Y. Projecting global grought risk under various SSP-RCP scenarios. Earth’s Future 2023, 11, e2022EF003420. [Google Scholar] [CrossRef]
  39. Vicente-Serrano, S.M.; Beguería, S.; López-Moreno, J.I. A multiscalar drought index sensitive to global warming: The standardized precipitation evapotranspiration index. J. Clim. 2010, 23, 1696–1718. [Google Scholar] [CrossRef]
  40. Wei, X.; He, W.; Zhou, Y.; Cheng, N.; Xiao, J.; Bi, W.; Liu, Y.; Sun, S.; Ju, W. Increased sensitivity of global vegetation productivity to drought over the recent three decades. J. Geophys. Res. Atmos. 2023, 128, e2022JD037504. [Google Scholar] [CrossRef]
  41. He, Q.; Wang, M.; Liu, K.; Wang, B. High-resolution Standardized Precipitation Evapotranspiration Index (SPEI) reveals trends in drought and vegetation water availability in China. Geogr. Sustain. 2025, 6, 100228. [Google Scholar] [CrossRef]
  42. Wei, T.; Liu, C.; Dong, W.; Yu, H.; Yang, S.; Yan, Q.; Hao, Z. Reduction in extreme climate events and potential impacts by the use of technological advances. Int. J. Climatol. 2021, 41, 2495–2508. [Google Scholar] [CrossRef]
  43. Leng, G.; Hall, J. Crop yield sensitivity of global major agricultural countries to droughts and the projected changes in the future. Sci. Total Environ. 2019, 654, 811–821. [Google Scholar] [CrossRef] [PubMed]
  44. Akaike, H. Likelihood of a model and information criteria. J. Econom. 1981, 16, 3–14. [Google Scholar] [CrossRef]
  45. Schwarz, G. Estimating the dimension of a model. Ann. Stat. 1978, 6, 461–464. [Google Scholar] [CrossRef]
  46. Ciscar, J.-C.; Iglesias, A.; Feyen, L.; Szabó, L.; Van Regemorter, D.; Amelung, B.; Nicholls, R.; Watkiss, P.; Christensen, O.B.; Dankers, R.; et al. Physical and economic consequences of climate change in Europe. Proc. Natl. Acad. Sci. USA 2011, 108, 2678–2683. [Google Scholar] [CrossRef]
  47. Zhou, T.; Yu, R. Twentieth-century surface air temperature over China and the globe simulated by coupled climate models. J. Clim. 2006, 19, 5843–5858. [Google Scholar] [CrossRef]
  48. Fahad, S.; Bajwa, A.A.; Nazir, U.; Anjum, S.A.; Farooq, A.; Zohaib, A.; Sadia, S.; Nasim, W.; Adkins, S.; Saud, S.; et al. Crop production under drought and heat stress: Plant responses and management options. Front. Plant Sci. 2017, 8, 1147. [Google Scholar] [CrossRef]
  49. Telfer, P.; Edwards, J.; Bennett, D.; Ganesalingam, D.; Able, J.; Kuchel, H. A field and controlled environment evaluation of wheat (Triticum aestivum) adaptation to heat stress. Field Crops Res. 2018, 229, 55–65. [Google Scholar] [CrossRef]
  50. Dubey, R.; Pathak, H.; Chakrabarti, B.; Singh, S.; Gupta, D.K.; Harit, R.C. Impact of terminal heat stress on wheat yield in India and options for adaptation. Agric. Syst. 2020, 181, 102826. [Google Scholar] [CrossRef]
  51. Liu, Y.; Zhang, E.; Pan, T.; Chen, J.; Gao, Y.; Peñuelas, J. Anthropogenic adaptation measures expand suitable area for highland barley in Tibetan Plateau. Sci. Bull. 2025, 70, 1504–1512. [Google Scholar] [CrossRef] [PubMed]
  52. Ahmad, S.; Abbas, G.; Ahmed, M.; Fatima, Z.; Anjum, M.A.; Rasul, G.; Khan, M.A.; Hoogenboom, G. Climate warming and management impact on the change of phenology of the rice-wheat cropping system in Punjab, Pakistan. Field Crops Res. 2019, 230, 46–61. [Google Scholar] [CrossRef]
  53. Battisti, R.; Sentelhas, P.C.; Parker, P.S.; Nendel, C.; Câmara, G.M.D.S.; Farias, J.R.B.; Basso, C.J. Assessment of crop-management strategies to improve soybean resilience to climate change in Southern Brazil. Crop Pasture Sci. 2018, 69, 154–162. [Google Scholar] [CrossRef]
  54. Zhang, E.; Liu, Y.; Tan, Q.; Chen, J.; Pan, T. Projected changes in future wheat yield across China under CMIP6 climate simulations and agricultural management scenarios. J. Cleaner Prod. 2025, 145570. [Google Scholar] [CrossRef]
  55. Feng, S.; Hao, Z. Quantifying likelihoods of extreme occurrences causing maize yield reduction at the global scale. Sci. Total Environ. 2020, 704, 135250. [Google Scholar] [CrossRef]
  56. Zhao, H.; Zhang, L.; Kirkham, M.B. U.S. winter wheat yield loss attributed to compound hot-dry-windy events. Nat. Commun. 2022, 13, 7233. [Google Scholar] [CrossRef] [PubMed]
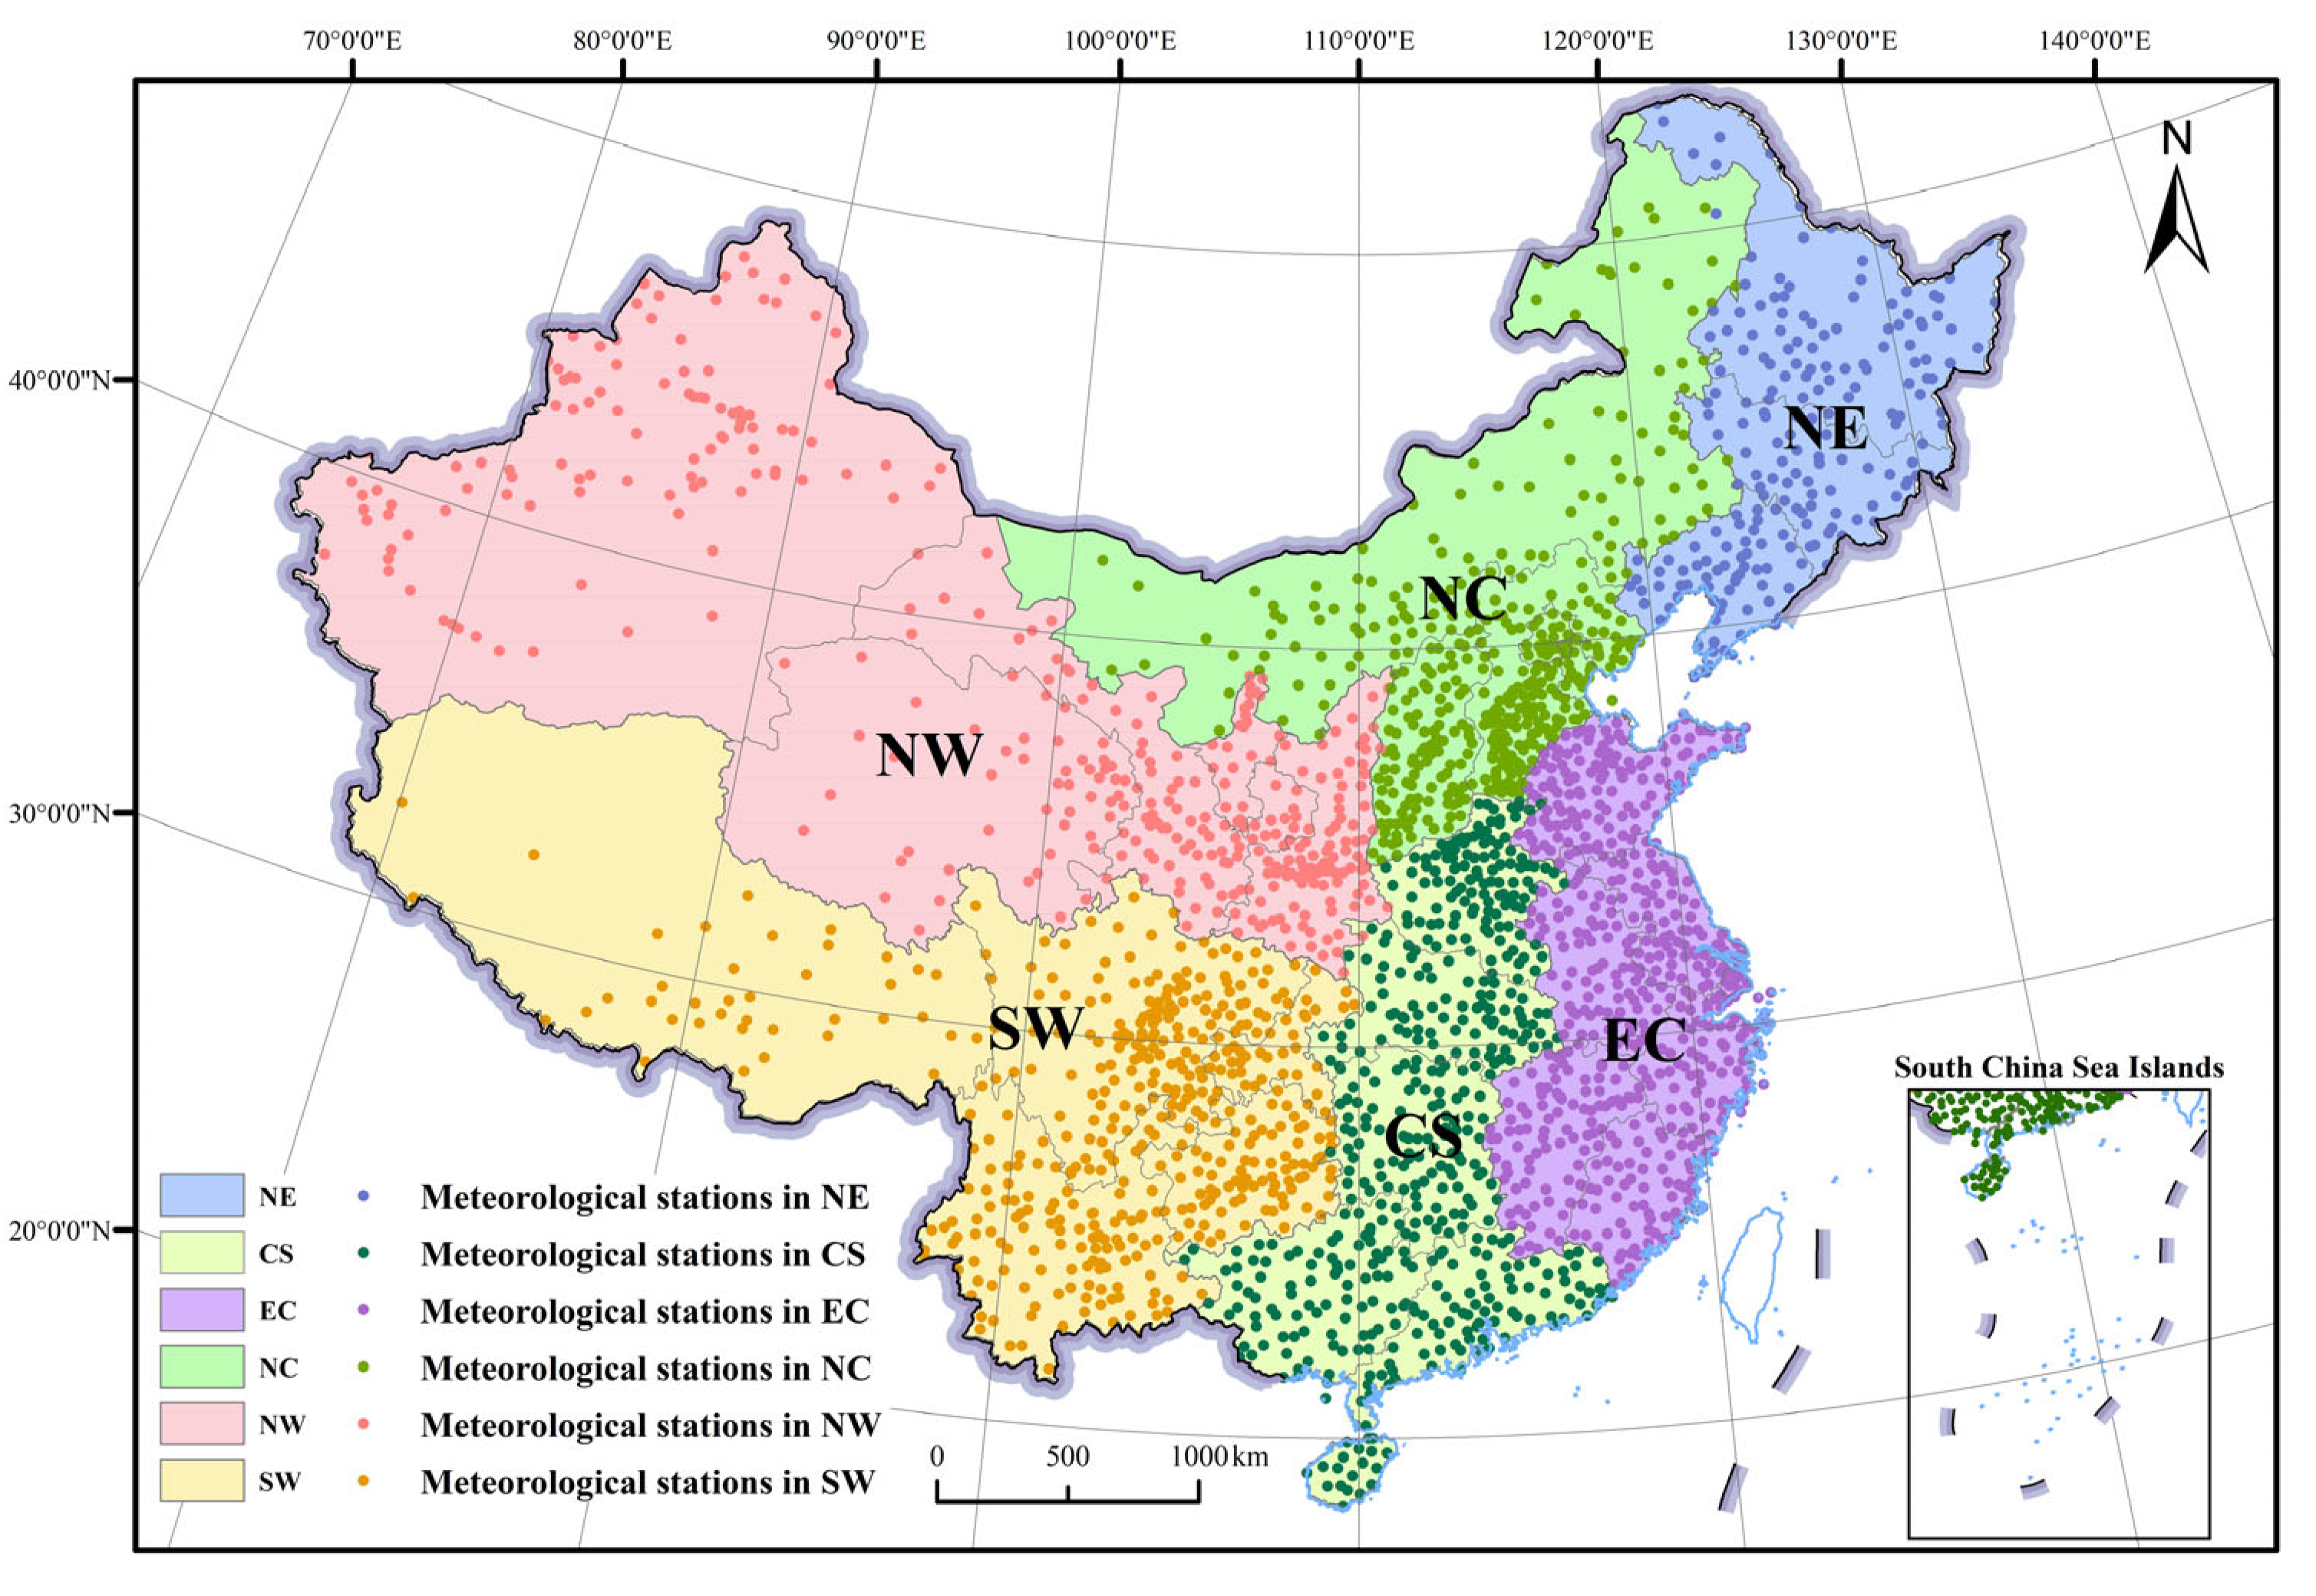
Figure 1. Overview of study area and spatial distribution of meteorological stations. With reference to the physical geography of China (https://www.resdc.cn/data.aspx?DATAID=276 (accessed on 28 September 2025)), the 34 provincial-level administrative regions of China (excluding Hong Kong, Macao, and Taiwan due to lack of data) were divided into 6 regions, including Northeast China (NE), North China (NC), East China (EC), Northwest China (NW), Southwest China (SW), and Central and South China (CS).
Agronomy 15 02319 g001
Figure 2. The significance test results of the impact of different extreme climate events on crop yields in six regions based on 8 models (blue indicates not significant; light red indicates p < 0.05; dark red indicates p < 0.05). NE: Northeast China; NC: North China; EC: East China; NW: Northwest China; SW: Southwest China; MC: Middle China. The optimal model chosen is denoted by “√”.
Agronomy 15 02319 g002
Figure 3. Temporal patterns and probability distribution of crop yield changes affected by drought under SSP-RCP scenarios (based on multi-model ensemble medians). (a,g): NE; (b,h): NC; (c,i): EC; (d,j): NW; (e,k): SW; (f,l): CS. Trend lines represent a single linear fit of the median, and the error bars are the standard deviation of the estimated results for different models.
Agronomy 15 02319 g003
Figure 4. Temporal patterns and probability distribution of crop yield changes affected by extreme precipitation under SSP-RCP scenarios (based on multi-model ensemble medians). (a,g): NE; (b,h): NC; (c,i): EC; (d,j): NW; (e,k): SW; (f,l): CS. Trend lines represent a single linear fit of the median, and the error bars are the standard deviation of the estimated results for different models.
Agronomy 15 02319 g004
Figure 5. Spatial distribution of crop yield changes under the influence of extreme low temperature (based on multi-model ensemble medians). (a): SSP1-2.6/2021–2040; (b): SSP1-2.6/2041–2060; (c): SSP3-7.0/2021–2040; (d): SSP3-7.0/2041–2060; (e): SSP5-8.5/2021–2040; (f): SSP5-8.5/2041–2060.
Agronomy 15 02319 g005
Figure 6. Spatial distribution of crop yield changes under the influence of extreme wind (based on multi-model ensemble medians). (a): SSP1-2.6/2021–2040; (b): SSP1-2.6/2041–2060; (c): SSP3-7.0/2021–2040; (d): SSP3-7.0/2041–2060; (e): SSP5-8.5/2021–2040; (f): SSP5-8.5/2041–2060.
Agronomy 15 02319 g006
Figure 7. Regional differentiation of climate extreme event change impact on crop yields (based on multi-model ensemble medians). (a): NE; (b): NC; (c): EC; (d): NW; (e): SW; (f): CS.
Agronomy 15 02319 g007
Figure 8. Spatial distribution of crop yields changes under the combined impact of extreme climate events (based on multi-model ensemble medians). (a): SSP1-2.6/2021–2040; (b): SSP1-2.6/2041–2060; (c): SSP3-7.0/2021–2040; (d): SSP3-7.0/2041–2060; (e): SSP5-8.5/2021–2040; (f): SSP5-8.5/2041–2060. Regions with reductions greater than 25% are highlighted with red circles.
Agronomy 15 02319 g008
Table 1. Model construction of the impact of climate extreme events on crop yields.
Model TypeModel Construction
1∆Y ~ fre
2∆Y ~ fre2
3∆Y ~ ins
4∆Y ~ ins2
5∆Y ~ fre × ins
6∆Y ~ fre × ins + fre/ins
7∆Y ~ fre2 + ins2
8∆Y ~ fre2 + ins2 + fre + ins + fre/ins
Disclaimer/Publisher’s Note: The statements, opinions and data contained in all publications are solely those of the individual author(s) and contributor(s) and not of MDPI and/or the editor(s). MDPI and/or the editor(s) disclaim responsibility for any injury to people or property resulting from any ideas, methods, instructions or products referred to in the content.