Article

Genome-Wide Association Study and Transcriptome Analysis Identify QTL and Candidate Genes Involved in Nitrogen Response Mechanisms in Sorghum

1
College of Resources and Environment, Shanxi Agricultural University/Key Laboratory of Sustainable Dryland Agriculture of Shanxi Province, Jinzhong 030801, China
2
Sorghum Research Institute, Shanxi Agriculture University, Jinzhong 030600, China
3
College of Agriculture, Shanxi Agricultural University, Jinzhong 030899, China
*
Authors to whom correspondence should be addressed.
Agronomy 2025, 15(10), 2250; https://doi.org/10.3390/agronomy15102250
Submission received: 6 August 2025 / Revised: 12 September 2025 / Accepted: 19 September 2025 / Published: 23 September 2025
(This article belongs to the Section Crop Breeding and Genetics)

Abstract

Nitrogen is an essential macronutrient for crop growth. Although sorghum can tolerate poor soils, its low-nitrogen (LN) tolerance mechanisms remain underexplored. We conducted a genome-wide association study (GWAS) and RNA sequencing (RNA-seq) to dissect LN tolerance mechanisms in a diverse panel of 232 sorghum accessions. Phenotypic analyses revealed extensive variation in nitrogen-use efficiency traits, with shoot dry weight and shoot nitrogen accumulation in (SNAcc) showing the highest diversity. GWAS identified 10 quantitative trait loci harboring pleiotropic single-nucleotide polymorphisms (SNPs), including q1 (Chr3: 8.59–8.68 Mb), which is associated with biomass and nitrogen accumulation. Transcriptome profiling under LN stress revealed 6208 differentially expressed genes, with nitrate transporters showing genotype-specific regulation. Integration prioritized SORBI_3004G286700, where Hap2 accessions (14.66%) showed superior agronomic performance under LN conditions. We also identified pivotal transcription factors (TFs) that govern LN tolerance in sorghum, notably bHLH35 (SORBI_3007G051800) and three WRKY TFs, demonstrating constitutive upregulation in tolerant genotypes, whereas three previously uncharacterized TFs (MYB, bZIP, and B3) exhibited > 5-fold genotype-specific induction under LN. The integration of GWAS and transcriptome analyses offers an effective strategy for exploring candidate genes and elucidating nitrogen adaptation mechanisms in sorghum, while providing actionable molecular targets for precise breeding of nitrogen-efficient cultivars.

1. Introduction

Nitrogen is essential for the synthesis of key phytocompounds, including proteins, nucleic acids, chlorophyll, enzymes, and hormones, underpinning its role in material cycling and energy metabolism [1]. Nitrogen deficiency impairs cell formation, retards growth, prolongs developmental cycles, and reduces yields [2]. Although increased nitrogen fertilization commonly enhances crop productivity [3], its long-term excessive application reduces nitrogen-use efficiency (NUE), risks the erosion of genetic resources for low-nitrogen (LN) tolerance, elevates production costs, and ultimately hinders sustainable agriculture [4,5].
As the fifth largest grain crop globally, Sorghum (Sorghum bicolor L. Moench) possesses multiple stress-resistance traits. It is commonly cultivated by farmers on marginal soils with poor fertility, and it has abundant genetic resources for adaptation to nutrient deficiency [6]. Given that 79% of arable land in China comprises low-to-medium-yielding fields [7], leveraging the tolerance of sorghum to screen its germplasm for high NUE and LN resilience is highly valuable. Deciphering the genetic mechanisms of NUE in sorghum will accelerate the breeding of NUE-optimized varieties and enhance NUE for improved food security and environmental sustainability.
NUE is a complex trait influenced by both genetic and environmental factors, commonly defined as biomass production per unit nitrogen uptake, and is a polygenic trait. NUE-related traits are polygenic and environmentally sensitive, exhibiting continuous variation typical of quantitative traits. Identifying the underlying quantitative trait loci (QTL) facilitates genetic improvement of NUE and provides a foundation for marker-assisted breeding [8]. Although genetic mapping enables QTL localization [9], studies on rice [10,11], maize [12], and barley [13] have often yielded broad genomic intervals, limiting the successful cloning of causal genes. Genome-wide association studies (GWAS) are widely used to map QTL associated with LN tolerance and NUE due to their high mapping resolution and ability to identify trait-associated genomic regions and candidate genes [14]. Liu et al. (2021) performed a GWAS on 230 rice accessions under LN (90 kg·ha−1) and normal nitrogen (NN; 180 kg·ha−1) conditions, identifying 15 SNPs significantly associated with the nitrogen response of tillering. Allelic variations in OsTCP19 and OsNAC42 explained low nitrogen responsiveness [4]. Similarly, Poudel et al. (2025) evaluated 96 indica genotypes across different nitrogen levels and detected nitrogen-modulated loci (chromosomes 1 and 3) that regulate root length and grain number. The chromosome [15].
Extensive linkage disequilibrium (LD) surrounding loci in GWAS often obscures causal genes and increases false-positive risks due to the sensitivity to population structure [16]. RNA sequencing (RNA-seq) overcomes this limitation by decoding gene regulatory networks, providing functional annotations and mechanistic insights into GWAS-derived genetic variants [17]. RNA-seq enables the comprehensive profiling of crop responses to LN stress. To demonstrate this integration, Li et al. (2022) combined a GWAS of 230 diverse rice accessions with LN-responsive transcriptomics [18]. The study identified 411 trait-associated genes across five QTL regions and 2722 LN-induced differentially expressed genes (DEGs), revealing novel QTL and candidate genes for LN tolerance via a joint analysis.
Plants deploy multiple mechanisms to mitigate LN stress, including the uptake of soil nitrogen via nitrate transporters (NRTs) and ammonium transporters (AMTs) [19,20]. Under LN conditions, the expression and activity of these transporters can be upregulated to enhance NUE. Concurrently, transcription factors (TFs) associated with growth and development, such as AHL, GRAS, WRKY, and zinc-finger proteins, mediate the regulation of gene expression, thereby modulating nitrogen uptake, plant development, and stress responses [19].
Integrated approaches employing GWAS and RNA-seq represent powerful strategies for rapidly dissecting the genetic architecture of quantitative traits under abiotic stress [20]. These methodologies enable comprehensive elucidation of the genetic basis of NUE, yet their application remains scarcely reported in NUE research on sorghum. In the present study, 12 LN-responsive traits were evaluated in a hydroponically cultured association panel comprising 232 globally diverse sorghum accessions under NN and LN conditions. Through integrated GWAS and transcriptome analyses, we aimed to assess phenotypic variations in the 12 LN-responsive traits under NN and LN regimes and to identify LN-responsive QTL associated with LN adaptation.

2. Materials and Methods

2.1. Plant Materials and Growth Conditions

A total of 232 sorghum accessions collected from diverse geographical regions were used in this study. The collection comprised 156 accessions from China; 30 from India; 19 from the Americas; 13 from Africa; and 14 from other regions, including Australia, Mexico, Korea, Syria, and the Republic of Yemen. The Source and providing institutions are listed in Supplementary Table S1. Based on population structure analysis, all accessions were classified into three distinct subgroups, consistent with previous characterization [21].
Seeds exhibiting uniform size and plumpness were selected for the experiments. The selected seeds were surface-sterilized in a 10% (v/v) sodium hypochlorite solution for 20 min, followed by three rinses with sterile distilled water. The seeds were then placed on germination trays and germinated in darkness at 28 °C until they reached the two-leaf stage. Following embryo removal, the seedlings were transplanted at a density of two seedlings per hole into black hydroponic incubators (50 × 34 × 14 cm) containing 6 L of a nutrient solution. Seedlings were acclimatized for three days in half-strength Hoagland nutrient solution before being transferred to the experimental hydroponic culture solution. The standard nutrient solution contained: 2.0 mM Ca(NO3)2, 0.75 mM K2SO4, 0.65 mM MgSO4, 0.1 mM KCl, 0.25 mM KH2PO4, 1 × 10⁻³ M H3BO3, 1 × 10⁻³ M MnSO4, 1 × 10⁻⁴ M CuSO4, 1 × 10⁻³ M ZnSO4, 5 × 10⁻⁶ M (NH4)6Mo7O24, and 0.1 mM Fe-EDTA, adjusted to pH 6.0. For the LN treatment, 2.0 mM Ca(NO3)2 was replaced with 0.02 mM Ca(NO3)2 plus 1.98 mM CaCl2. Nutrient solutions were renewed every three days, and the pH was maintained at 6.0 ± 0.5 via titration with diluted NaOH or HCl [12]. Plants were cultivated in a controlled-environment greenhouse at the Sorghum Research Institute, Shanxi Agricultural University (Jinzhong, China), from May–August 2024. Growth conditions consisted of a 16 h light (28 °C)/8 h dark (20 °C) photoperiod and 70% relative humidity. The experiment employed a completely randomized design with two nitrogen levels and three replicates.

2.2. Trait Assessment and Derivation of Indices

Phenotypic measurements were conducted 20 days after the initiation of LN treatment. For each sorghum accession, three seedlings were harvested per replicate. The plants were then separated into shoots and roots. Plant height (PH) was measured from the stem base to the apical meristem using a ruler while maintaining a natural upright orientation to prevent stretching or bending. SPAD (chlorophyll content) was quantified on the second fully expanded leaf from the apex using a SPAD-502 meter (Konica Minolta, Tokyo, Japan). Five measurements were taken per leaf (avoiding the major veins) and averaged. Shoot dry weight (SDW) and root dry weight (RDW) were determined after oven-drying at 80 °C to a constant mass and weighing to 0.0001 g precision. Total dry weight (TDW) was calculated as SDW + RDW, and the root-to-shoot (RS) ratio as RDW/SDW.
The dried shoot and root tissues were ground to a fine powder using a 100-mesh sieve for nitrogen analysis. Total nitrogen content in the roots (RNC) and shoots (SNC) was determined using a FOSS Kjeltec 8400 analyzer (FOSS Analytical A/S, Höganäs, Sweden), following the Kjeldahl method [22]. The results are expressed as the percentage of nitrogen on a dry weight basis (n = 5 biological replicates). Shoot nitrogen accumulation (SNAcc) and root nitrogen accumulation (RNAcc) were calculated as SDW × SNC and RDW × RNC, respectively. Total nitrogen accumulation (TNAcc) was determined as SNAcc + RNAcc, and NUE as SDW/TNAcc. The nitrogen response coefficient (NRC) for each phenotype was computed as follows: NRC = (value under LN treatment)/(value under NN treatment). Statistical analyses were performed using R v.4.3.0 (R Foundation for Statistical Computing, Vienna, Austria). Treatment effects were assessed via two-way ANOVA with the nitrogen level and genotype as factors, followed by Tukey’s HSD post hoc test (significance threshold: p < 0.05).

2.3. GWAS Analysis

A total of 232 diverse sorghum accessions were used for whole-genome resequencing and genotyping. All DNA accessions were extracted using the CTAB method and sequenced on an Illumina Hi-seq system (Illumina Inc., San Diego, CA, USA). The quality of the sequencing data was assessed using Fastp v0.20.0 (https://github.com/OpenGene/fastp, accessed on 14 April 2025) and visualized using R v.4.3.0 (R Foundation for Statistical Computing, Vienna, Austria). The raw data were saved in a paired-end FASTQ format, and the quality of the bases was assessed based on their quality (Q-value). Raw sequencing data were filtered using Fastp v0.20.0 to obtain high-quality data. The bwa (0.7.12-r1039) mem program (https://github.com/lh3/bwa, accessed on 14 April 2025) was used to align the high-quality data obtained after filtering to the reference genome (https://ftp.ncbi.nlm.nih.gov/genomes/all/GCF/000/003/195/GCF_000003195.3_Sorghum_bicolor_NCBIv3, accessed on 14 April 2025). GATK v3.8 (https://github.com/broadinstitute/gatk/releases, accessed on 14 April 2025) software was used for SNP detection. In total, 3,629,268 high-quality SNPs were used for the GWAS analysis. Population structure was assessed using ADMIXTURE v.1.3.0, with optimal clustering (K = 3) determined through minimal cross-validation error and confirmed using principal component analysis. LD decay was estimated using PopLDdecay v.3.42 (r2 measure).
Best linear unbiased predictions for the NRC per accession were calculated using a linear mixed model. A GWAS for the 12 NRC traits was performed using EMMAX (beta-07Mar2010), testing associations against all SNPs. Significant associations were defined as SNPs with −log10(P) ≥ −6.58 that were clustered within distinct peak regions. The results were visualized using Manhattan and Q-Q plots. The genome-wide linkage disequilibrium (LD) decay distance in the sorghum natural population used in this study was estimated to be approximately 44 kb, the 44 kb interval around a significant SNP site was defined as the QTL region, and adjacent significant SNP site within a distance less than 44 kb was merged into a single QTL. The genes near the significant SNP locus were selected as candidate genes and annotated according to the NCBI database (https://ftp.ncbi.nlm.nih.gov/genomes/all/GCF/000/003/195/GCF_000003195.3_Sorghum_bicolor_NCBIv3, accessed on 5 August 2025).

2.4. RNA-seq Analysis

Based on contrasting nitrogen responsiveness, two genotype sets were selected: LN-responsive (Yikeerli, Jinan, China) and LN-tolerant (LiaonianB-1, Shenyang, China) accessions. These genotypes were maintained in hydroponic systems under both NN and LN conditions, following identical protocols for nutrient solution composition, environmental controls, and plant husbandry, as detailed in Section 2.1. Root and shoot tissues were sampled 14 days after treatment initiation for transcriptome analysis.
Total RNA was extracted from root and leaf tissues of the selected sorghum accessions under both nitrogen treatments. For each tissue–treatment–genotype combination, equal quantities of RNA from three biological replicates were pooled to generate composite samples. This yielded eight experimental groups: LN-RL (leaves: LN-responsive under LN), NN-RL (leaves: LN-responsive under NN), LN-RR (roots: LN-responsive under LN), NN-RR (roots: LN-responsive under NN), LN-TL (leaves: LN-tolerant under LN), NN-TL (leaves: LN-tolerant under NN), LN-TR (roots: LN-tolerant under LN), and NN-TR (roots: LN-tolerant under NN). Immediately after collection, all tissues were flash-frozen in liquid nitrogen and stored at −80 °C until RNA extraction. The experimental design comprised three biological replicates per condition, resulting in 24 distinct biological samples prior to pooling.
Total RNA was isolated from samples using TRIzol reagent (Thermo Fisher Scientific, Waltham, MA, USA). RNA concentration and purity were measured using a NanoDrop spectrophotometer, and RNA integrity was assessed with a Qsep400 high-throughput bio-fragment analyzer. Poly(A)-selected mRNA libraries were prepared and sequenced (PE150) on an Illumina platform. After obtaining the raw sequences, Fastp v0.23.2 software was used to filter the sequencing data to obtain clean data for further analysis. The filtering involved removal of sequences with adapters at the 3′ end, and removal of reads with an average quality score < Q20. Clean reads were aligned to the S. bicolor reference genome (https://ftp.ensemblgenomes.org/pub/plants/release-52/fasta/sorghum_bicolor/dna/, accessed on 5 August 2025). using HISAT2 (v.2.1.0) software. HTSeq statistical comparison of the Read Count value of each gene, as the original expression of the gene, was performed using fragments per kilobase per million fragments (FPKM) to normalize the expression. Differential gene expression analysis between the LN and NN groups was performed using DESeq2 (v.1.38.3). DEGs were defined as those with |log2(fold change [FC])| > 1 and an adjusted p-value < 0.05. Kyoto Encyclopedia of Genes and Genomes (KEGG) analyses were performed using cluster Profiler (v4.6.0) with significance defined as FDR < 0.05 (Benjamini–Hochberg correction).

2.5. Haplotype Analysis

Based on the whole-genome resequencing data, SNPs encompassing the coding sequences were extracted from the genomic regions of the candidate genes. The major haplotypes were identified, and the accessions were grouped accordingly. Phenotype–haplotype associations were tested using ANOVA with Tukey’s HSD post hoc test (p < 0.05). Genes that exhibited significant phenotypic differences across haplotypes were identified as key candidates.

3. Results

3.1. Phenotypic Variation of 232 Sorghum Accessions in Response to LN

To evaluate the effects that LN stress exerts on growth parameters across a diverse sorghum panel, we measured the following traits: PH, SPAD, SDW, RDW, TDW, RS ratio, SNC, RNC, SNAcc, RNAcc, TNAcc, and NUE. Significant phenotypic variation in NUE-related traits was evident among accessions grown under both NN and LN conditions (Table 1 and Table S1).
The coefficients of variation (CVs) ranged from 11.06% for SPAD to 51.80% for SDW under NN conditions; from 8.76% for RN to 40.93% for SDW under LN conditions; and from 14.40% for RN to 74.93% for SNAcc under the NRC (Table 1). The CV of SDW and SNAcc was relatively high under both NN and LN treatments, as well as for the NRC. Notably, SDW and SNAcc consistently exhibited high CV values across all treatments. This pronounced variability indicates substantial genotypic divergence for these traits within the sorghum population.
Trait records for treated plants showed continuous variations under both NN and LN conditions, the distributions of which exhibited QTL regions suitable for GWAS analysis. All 12 evaluated seedling traits—PH, SPAD, SDW, RDW, TDW, RS ratio, SNC, RNC, SNAcc, RNAcc, TNAcc, and NUE—exhibited highly significant variation (p < 0.01) (Figure 1; Table S1). Notably, the RS ratio and NUE were higher under NN than under LN.
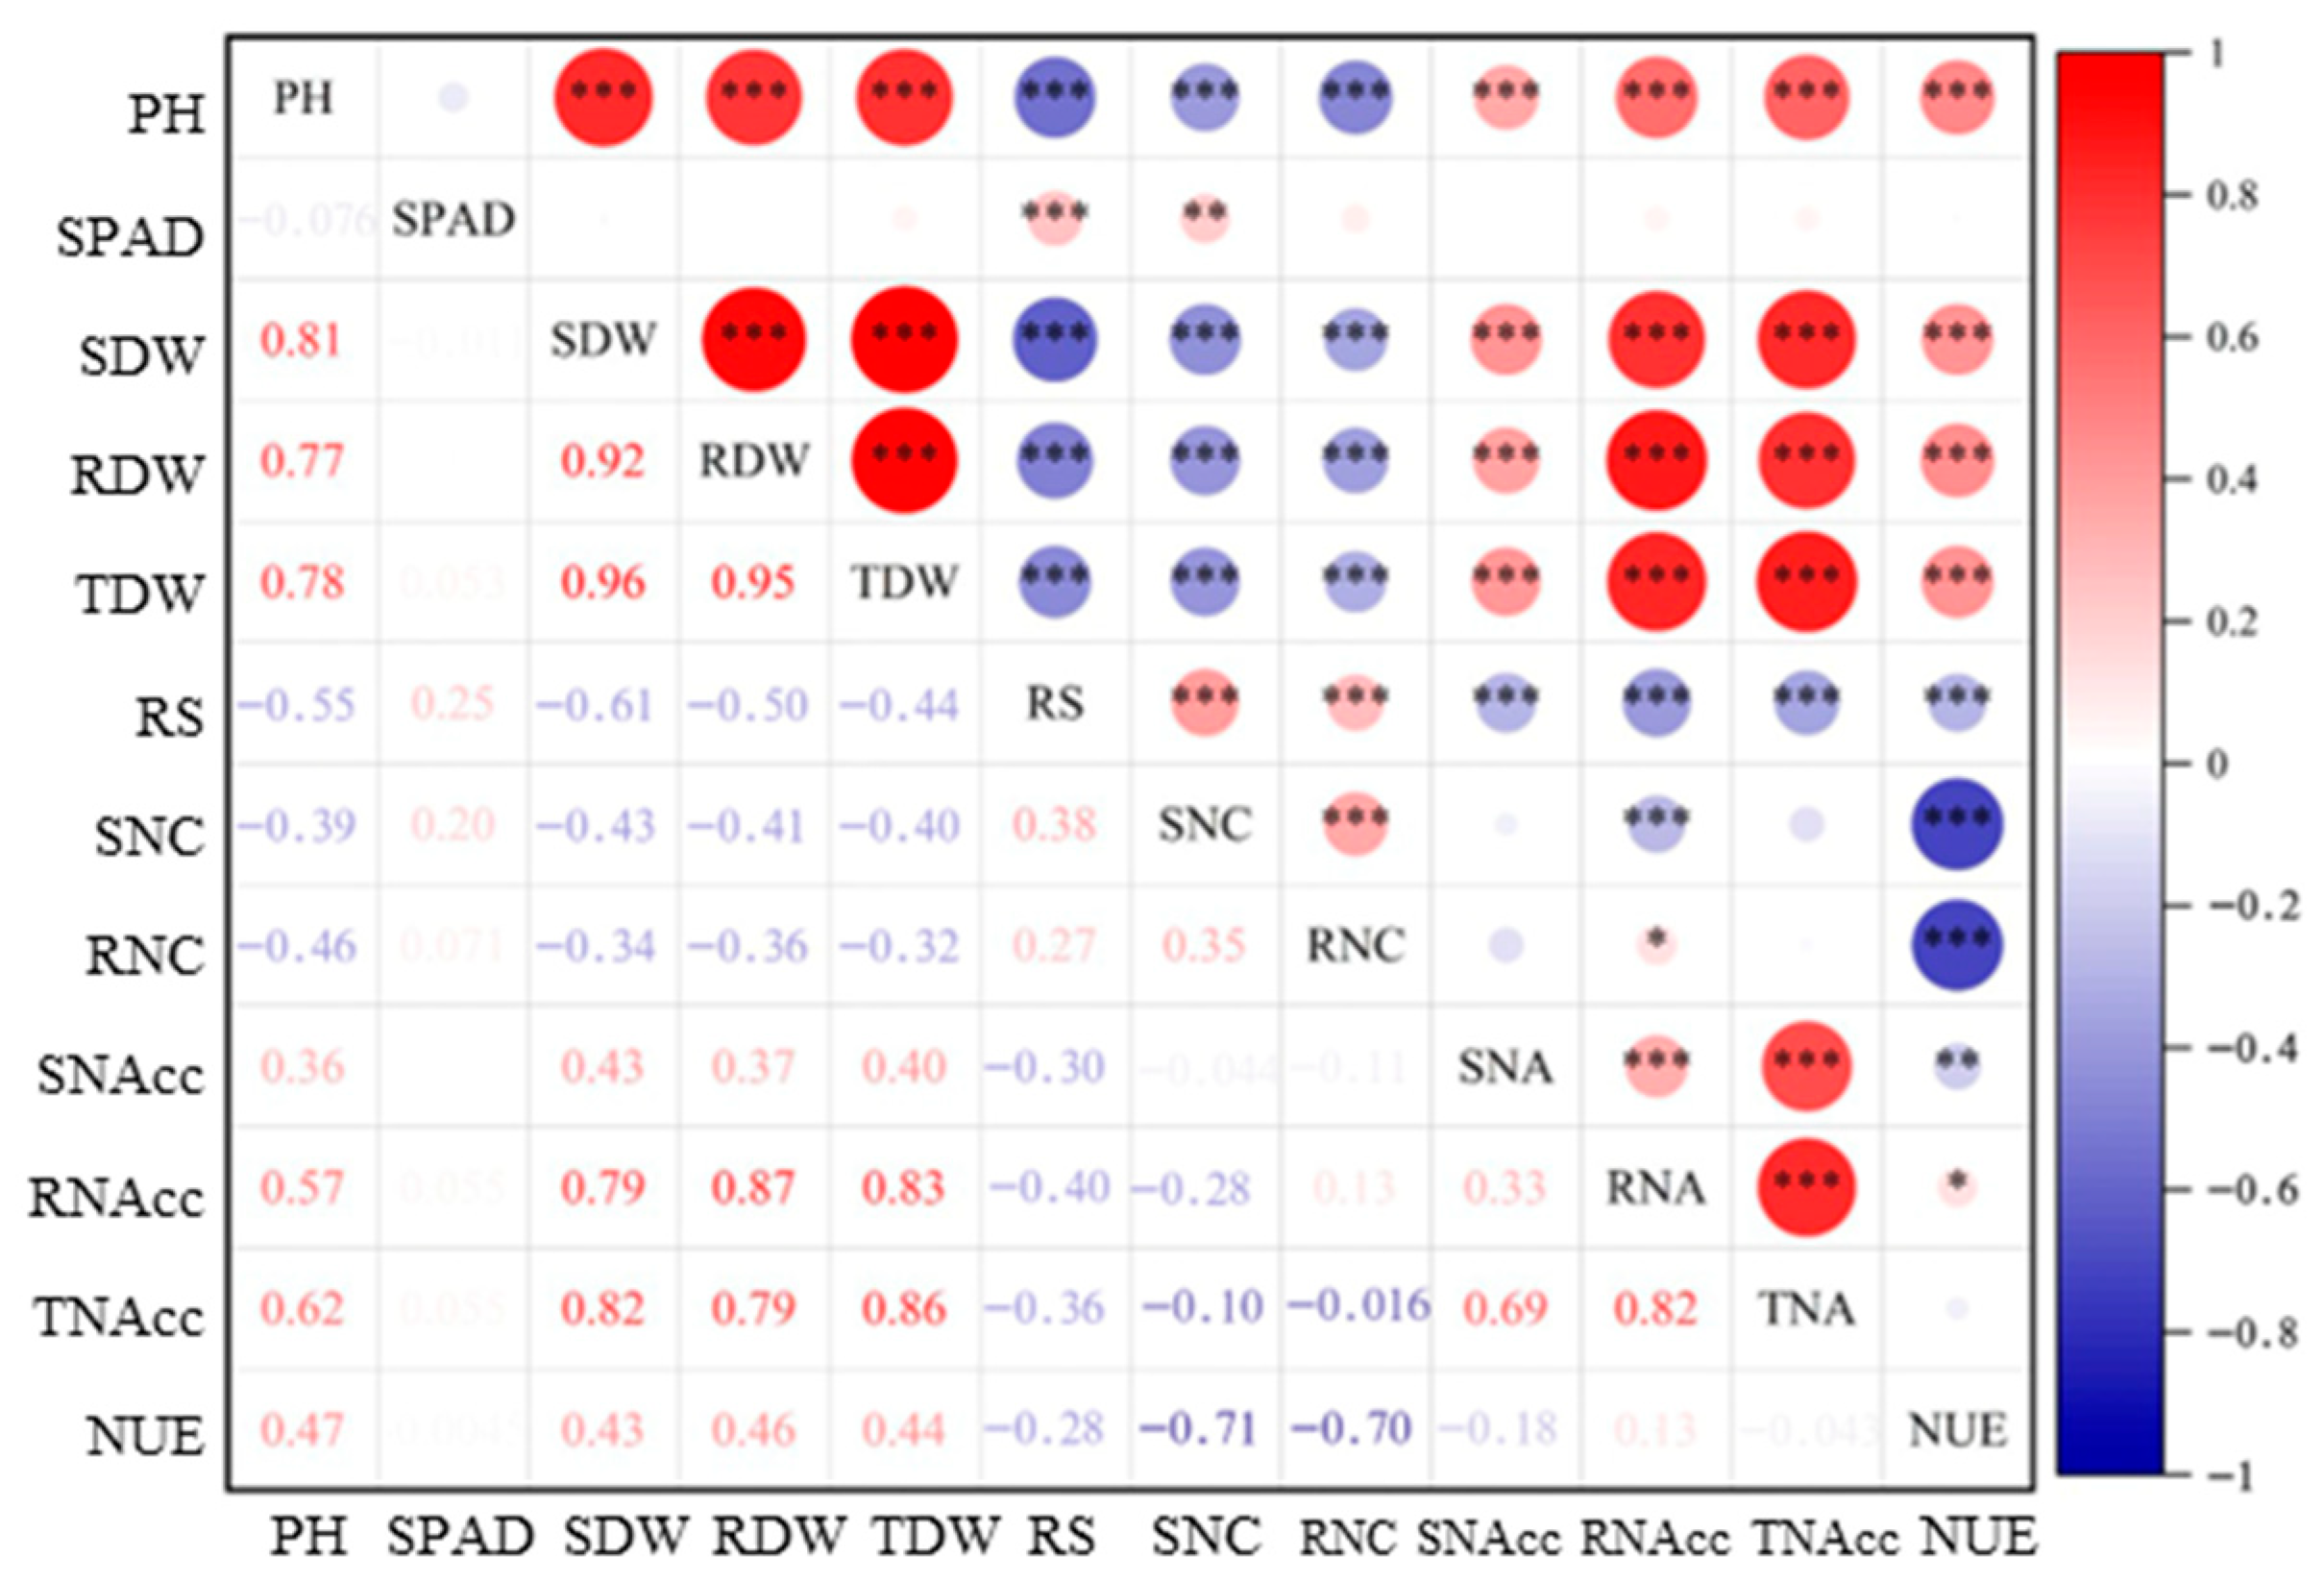
Correlation analyses revealed extensive interdependence among most LN tolerance-related traits. Significant associations (p < 0.05) were observed for most trait pairs, except for SPAD vs. PH, SDW, RDW, TDW, RNC, SNAcc, RNAcc, TNAcc, and NUE; SNC vs. SNAcc and TNAcc; RNC vs. SNAcc and TNAcc; and TNAcc vs. NUE. Strong positive correlations emerged between TDW and SDW (r = 0.96) and between RDW and SDW (r = 0.95) (Figure 2). Given the complex, multivariate nature of LN tolerance in sorghum—characterized by these substantial trait correlations—a multi-trait, integrative evaluation approach is essential. This strategy enhances confidence in the detected QTL regions, where genomic regions repeatedly associated with multiple correlated traits indicate robust pleiotropic loci.

3.2. Identification of QTL Regions and Significant Loci Involved in LN Response at the Seedling Stage via GWAS

Population structure of 232 sorghum accessions analysis using ADMIXTURE indicated that the optimal number of subpopulations was three (K = 3), as determined by the low cross-validation error (Figure S1). LD decay analysis revealed an average LD decay distance (r2 < 0.2) of 44 kb, indicating sufficient genetic diversity within this association panel for GWAS. Furthermore, analysis of the genomic relationship matrix, calculated using Gmatrix (Ver2) based on genome-wide markers (Figure S2), confirmed the low relatedness among individuals within the natural population. This population structure, combined with the observed LD decay and low relatedness, confirmed the suitability of this panel for GWAS.
Following quality filtering of the genotype data from 232 sorghum accessions, 3,629,268 high-quality SNP markers were retained for GWAS. To identify loci associated with NRCs, we performed a GWAS on 12 seedling-stage traits using the EMMAX mixed linear model (Figure S3). A significance threshold of −log10(P) > 6.5 identified 17 significant SNPs associated with NRCs (Table 2). These SNPs were distributed on chromosomes 3, 4, 6, and 8, and they corresponded to associations with the following traits: PH (1 SNP), SDW (7 SNPs), RDW (3 SNPs), TDW (10 SNPs), RS ratio (2 SNPs), RNC (1 SNP), SNAcc (6 SNPs), RNAcc (1 SNP), TNAcc (4 SNPs), and NUE (2 SNPs). Notably, multiple SNPs were associated with more than one trait, indicating potential pleiotropic effects or tightly linked loci (Table S2). For instance, SNP chr3-8637974 was associated with SDW, TDW, TNAcc, and SNAcc; chr3-8637978 with SDW, TDW, TNAcc, RDW, and SNAcc; and chr3-60352480 with SDW, TDW, SNAcc, and TNAcc. Six additional SNPs (chr4-62886807, chr4-62886832, chr4-62886912, chr4-63207939, chr6-42546320, and chr10-34207226) were each associated with at least two traits. This multi-trait association significantly enhances the reliability of these loci as key genetic determinants of the LN response in sorghum.
Based on LD decay analysis, candidate regions for significant trait associations were defined as genomic intervals spanning 44 kb upstream and downstream of each significant SNP, exceeding the suggestive threshold. Collectively, the 17 significant SNPs delineated 10 QTL regions designated q1–q10 (Table 2). The number of SNPs within the genes per QTL ranged from 2 to 112, with q4 harboring the highest number. Stable trait associations were consistently detected within specific QTL regions across chromosomes—chromosome 3 (q1: 8,593,974–8,681,996 bp): associations with SDW, RDW, TDW, TNAcc, and SNAcc; chromosome 3 (q2: 60,308,480–60,396,480 bp): associations with SDW, TDW, SNAcc, and TNAcc; chromosome 4 (q3: 62,842,807–62,932,412 bp): associations with SDW, RDW, TDW, and SNAcc; chromosome 4 (q5: 63,163,939–63,251,939 bp): associations with SDW, TDW, and SNAcc; chromosome 6 (q6: 42,502,320–42,590,320 bp): associations with SNAcc and TNAcc; and chromosome 10 (q9: 34,163,226–34,251,226 bp): associations with RNAcc and TDW (Table 2).
Candidate genes within QTL regions were annotated using the sorghum reference genome. A total of 73 annotated genes were identified, including 10, 10, 8, 12, 6, 8, 2, 1, 4, and 9 in q1–q10, respectively (Table S2), as well as qNRC9 (4) and qNRC10 (9). Notable functional annotations included SORBI_3003G267300 and SORBI_3003G267100 in q2, which encode ABC transporter B (ABCB) family members. ABCB proteins facilitate phytohormone transport and represent one of the largest membrane transporter families in plants, regulating development, stress responses, and secondary metabolism [23]. In q3, SORBI_3004G286700 and SORBI_3004G286800 encode GDSL esterase/lipases critical for plant development and abiotic stress adaptation [24]. In q5, SORBI_3006G290800 and SORBI_3006G291000 were annotated as scarecrow-like (SCL) TFs within the GRAS family, which are known regulators of root architecture [25]. Additionally, 22 genes encoding uncharacterized proteins represented novel putative regulators of LN tolerance in sorghum (Table S2).

3.3. Differentially Expressed Genes Between LN-Responsive and LN-Tolerant Sorghum Accessions

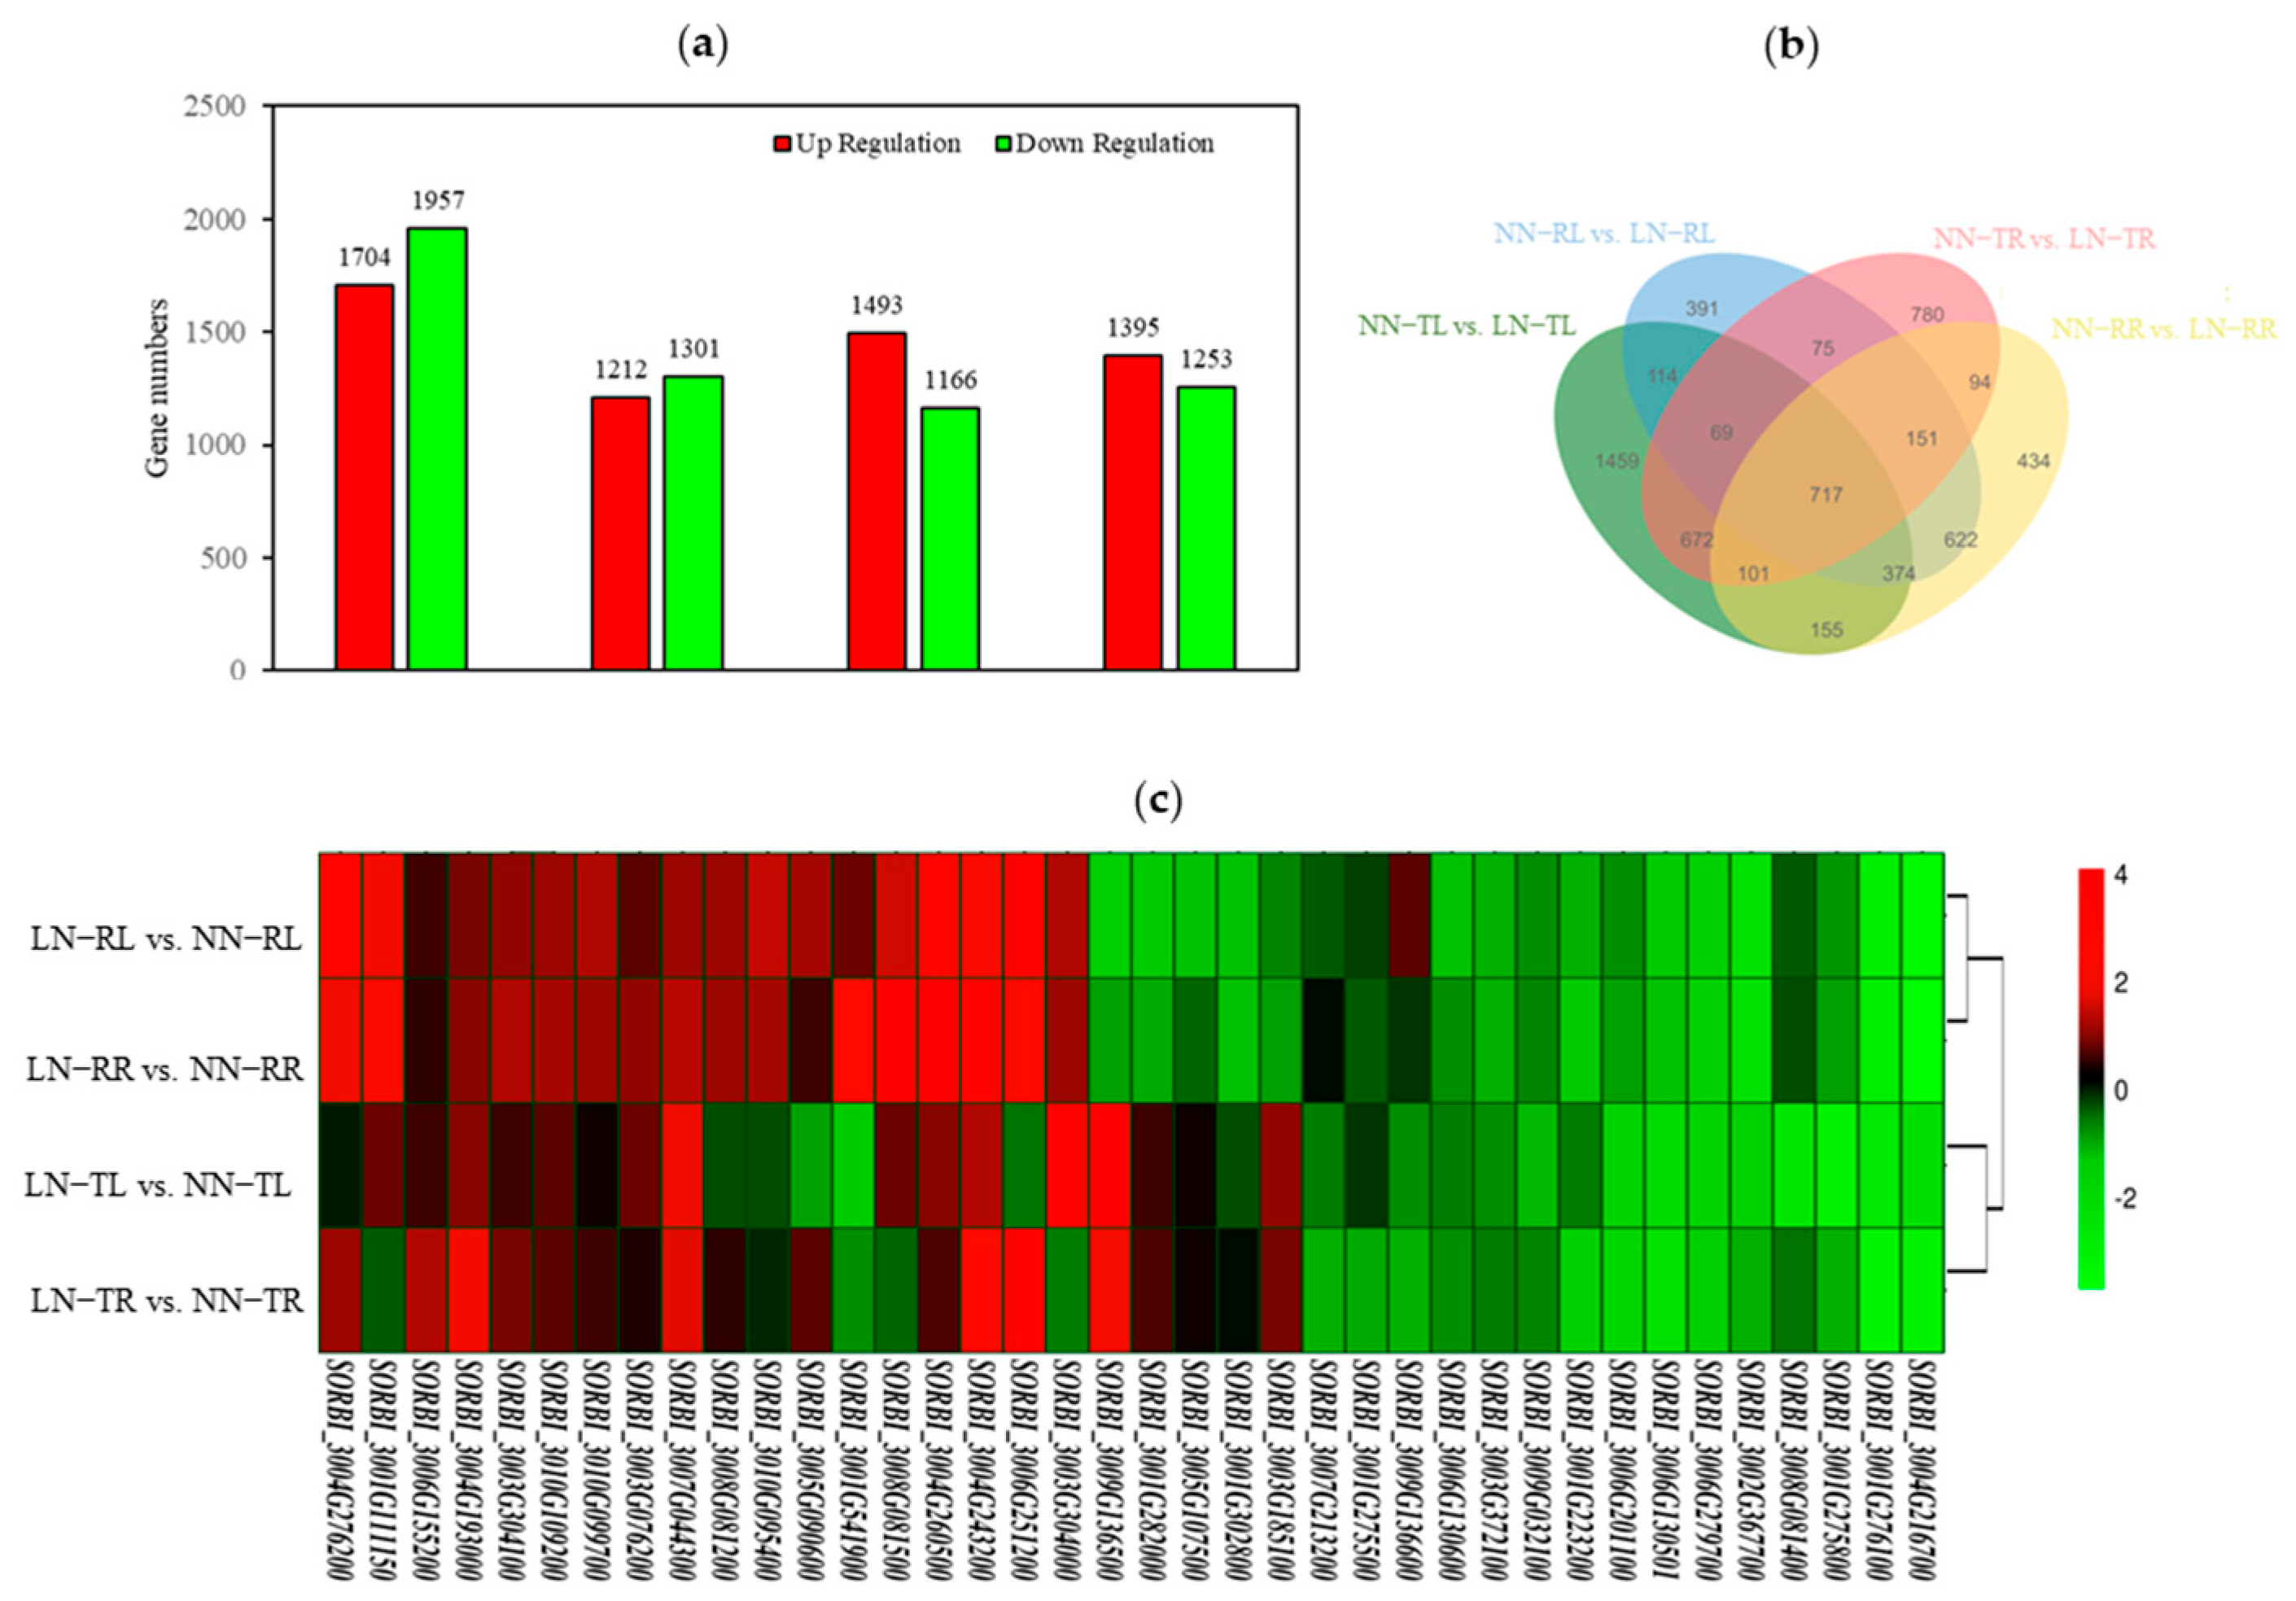
LN-responsive and LN-tolerant sorghum accessions were used as experimental materials. We used RNA-seq to identify nitrogen deficiency-responsive genes in sorghum. A total of 24 cDNA libraries constructed from plants under LN stress and NN conditions were subjected to high-throughput RNA-seq. This yielded between 36,563,914 and 54,974,248 filtered clean reads per library. The Q30 base percentage exceeded 94.77%, and the GC content ranged from 50.74–51.92%, indicating a high sequencing quality (Table S3). DEGs were identified using thresholds of p-adjust < 0.05 and |Log2FC| > 1. Comparative analysis revealed distinct transcriptional responses—LN-RL vs. NN-RL: 2513 DEGs (1212 upregulated, 1301 downregulated); LN-TL vs. NN-TL: 3661 DEGs (1704 upregulated, 1957 downregulated); LN-RR vs. NN-RR: 2648 DEGs (1395 upregulated, 1253 downregulated); and LN-TR vs. NN-TR: 2659 DEGs (1493 upregulated, 1166 downregulated) (Figure 3 and Figure S5). We also observed that the number of downregulated genes consistently exceeded that of the upregulated genes in sorghum leaves across both accessions under LN conditions. Conversely, in the roots, the number of upregulated genes was greater than that of downregulated genes. Detailed information on the DEGs from all four comparison groups is provided in Tables S4–S7.
Comparative analysis revealed a substantial overlap in the transcriptional responses to LN conditions across sorghum accessions and tissues. Among the 1274 DEGs common to both comparisons (LN-RL vs. NN-RL and LN-TL vs. NN-TL), 536 exhibited consistent upregulation, 664 showed consistent downregulation, and 71 displayed opposite regulatory directions across the test conditions (Table S8). A total of 1274 DEGs were common to both LN-RL vs. NN-RL and LN-TL vs. NN-TL comparisons. Among these common DEGs, 536 exhibited co-upregulation, 664 exhibited co-downregulation, and 74 were inversely regulated (Table S9). Similarly, 1063 DEGs were commonly expressed in the LN-RR vs. NN-RR and LN-TR vs. NN-TR comparisons, with 515 co-upregulated, 481 co-downregulated, and 67 inversely regulated genes. Further analysis identified 1864 commonly expressed DEGs between the LN-RL vs. NN-RL and LN-RR vs. NN-RR comparisons, comprising 896 co-upregulated, 966 co-downregulated, and two inversely regulated genes (Table S10). Finally, 1559 DEGs were common to both the LN-TL vs. NN-TL and LN-TR vs. NN-TR comparisons (across tissues within tolerant accessions), including 813 co-upregulated, 712 co-downregulated, and 34 inversely regulated genes (Table S11). These shared transcriptional signatures across distinct comparisons suggest the involvement of core regulatory pathways in the adaptation of sorghum to LN stress. Furthermore, DEGs were subjected to GO enrichment analysis. In the root tissues, the significantly enriched GO terms for both LN-RL vs. NN-RL and LN-TL vs. NN-TL included iron ion binding, transition metal ion binding, metal ion binding, and cation binding. In contrast, significantly enriched terms in leaf tissues, both under LN-RR vs. NN-RR and LN-TR vs. NN-TR, were related to catalytic activity and oxidoreductase activity (Figure S6).
Based on established literature [26], we further investigated the expression of nitrogen metabolism-associated gene families. Of the 6208 DEGs, we identified 38 genes associated with nitrogen utilization. Among these 38 genes, SORBI_3003G185100 (NRT1/PTR family 6.2), SORBI_3005G107500 (NRT1/PTR family 4.5-like), SORBI_3001G282000 (NRT1/PTR family 8.3 isoform X1), and SORBI_3009G136500 (NRT1/PTR family 3.1) exhibited significantly higher expression levels in LN-responsive sorghum accessions than in LN-tolerant ones. Conversely, SORBI_3001G541900 (NRT1/PTR family 6.3), SORBI_3010G095400 (urea-proton symporter DUR3), and SORBI_3008G081200 (NRT1/PTR family 4.3) exhibited opposite patterns (Figure 3c; Table S12).
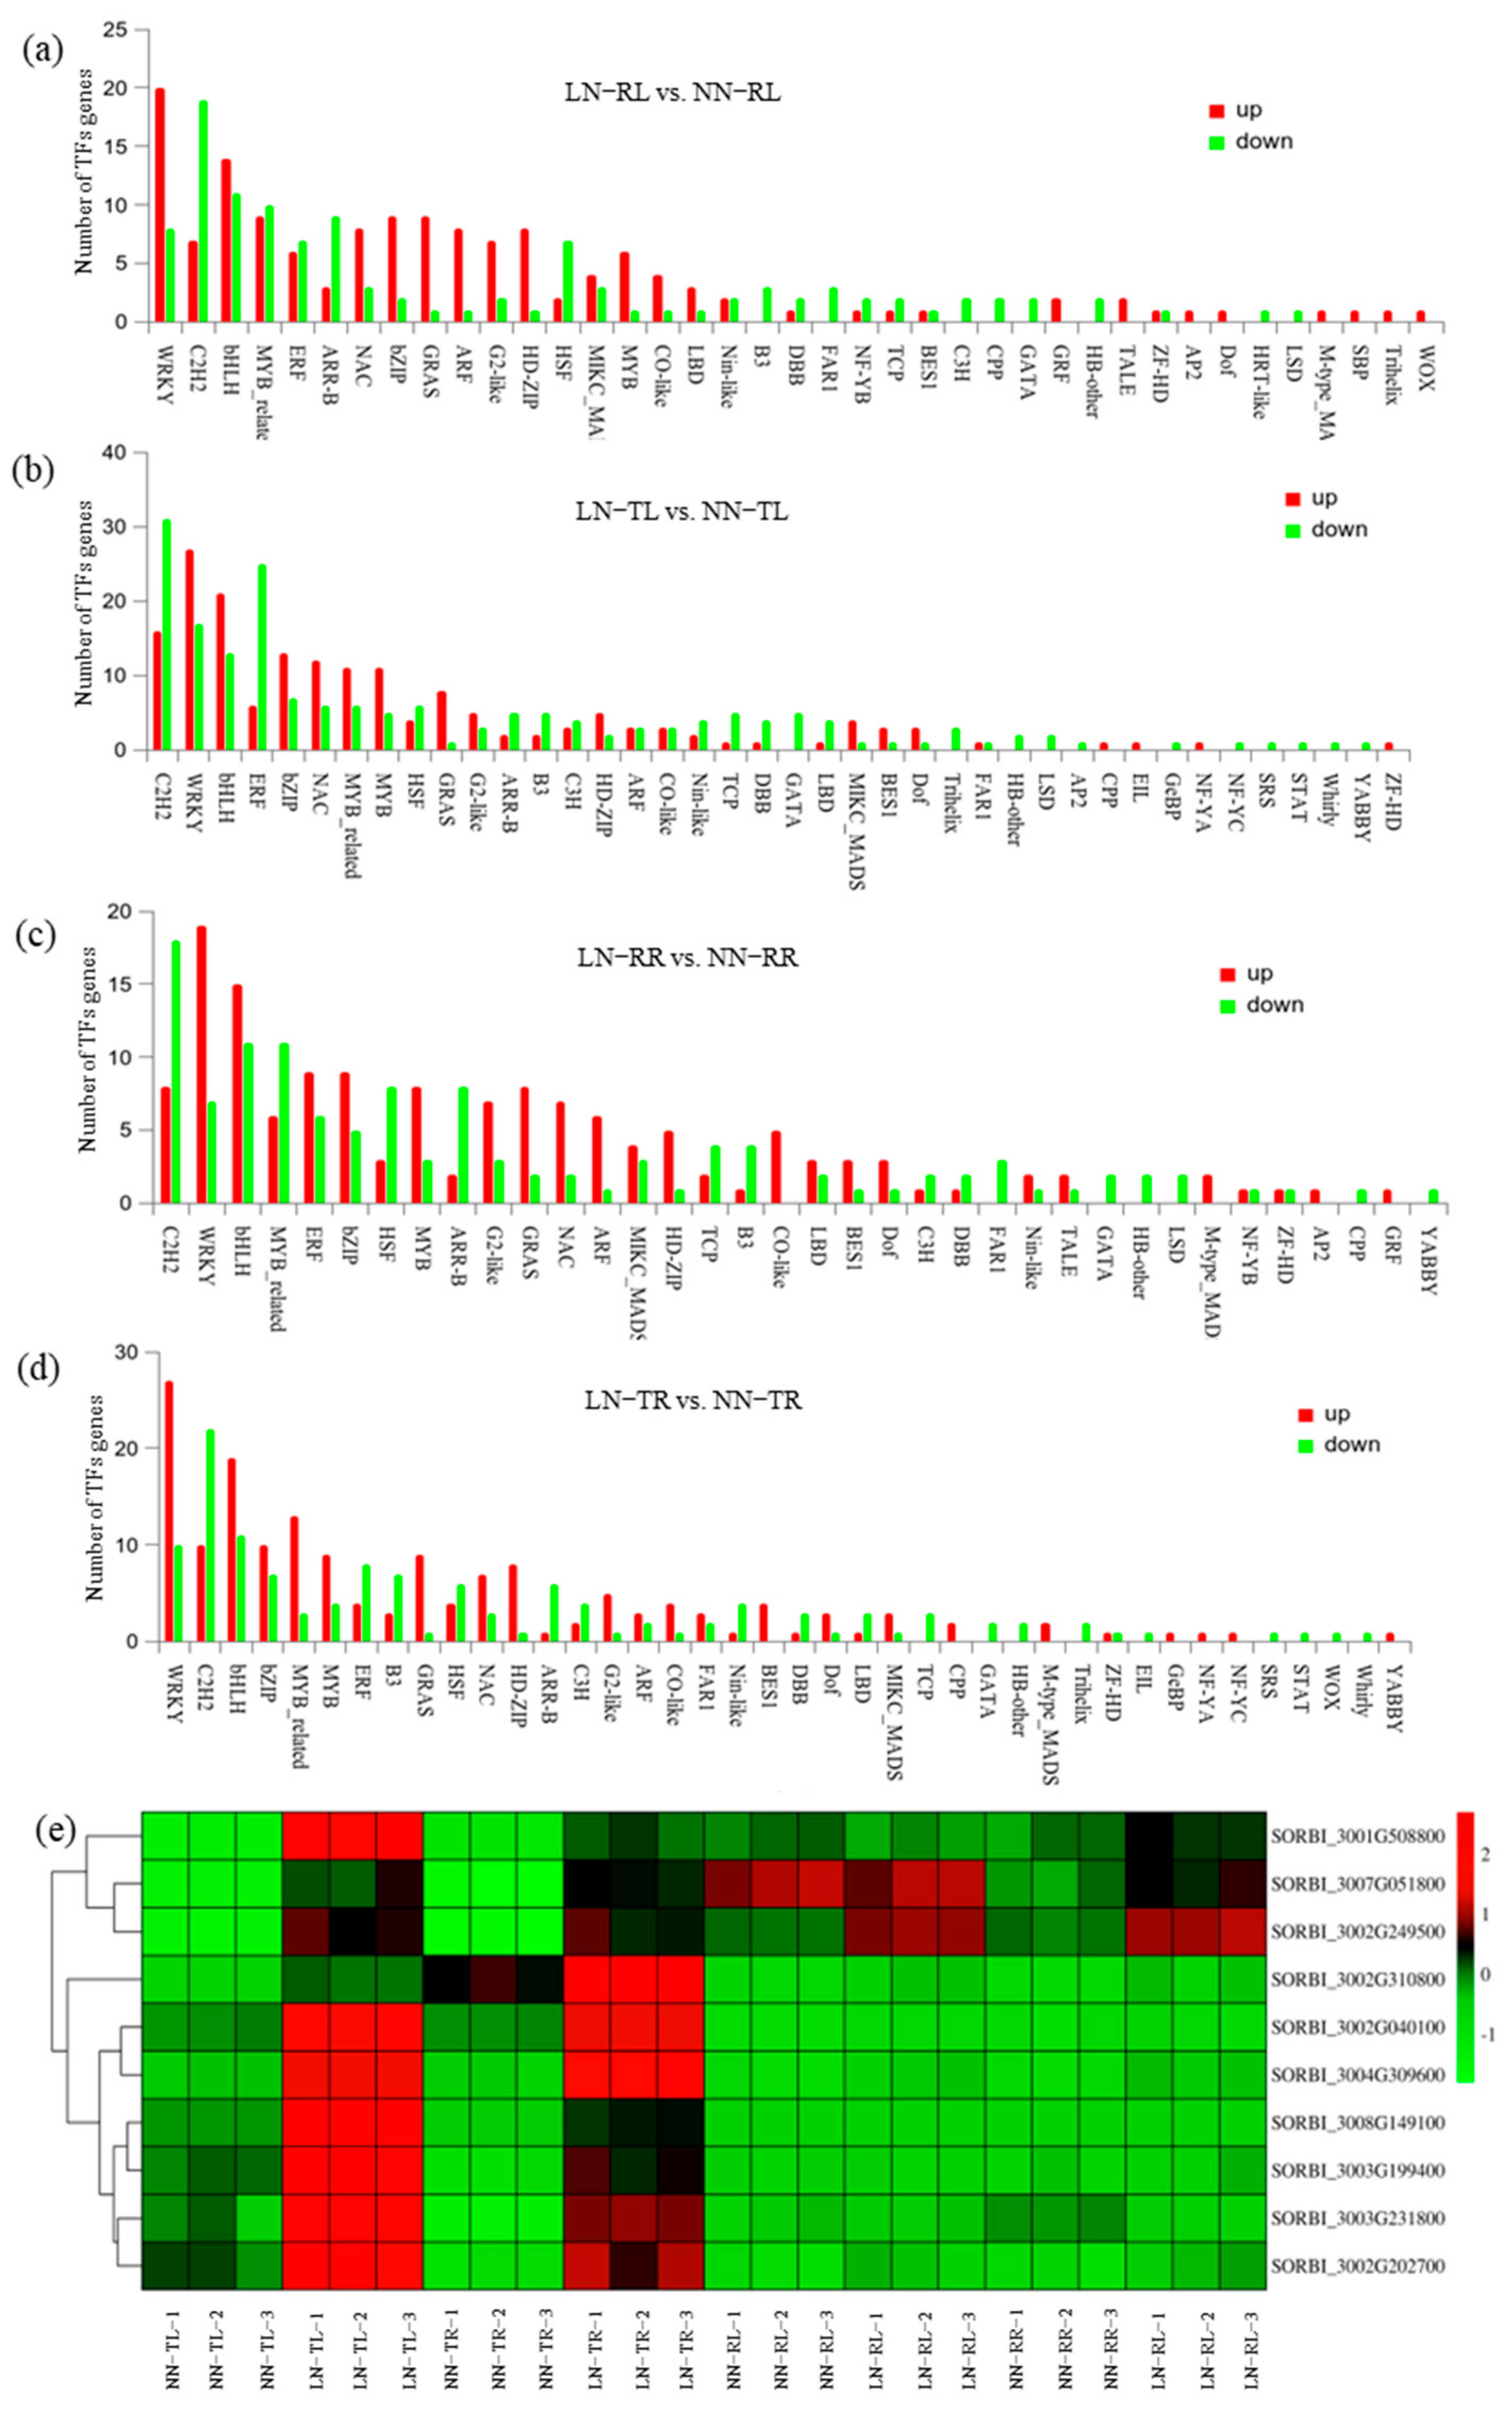
Many TFs play pivotal roles in nitrogen metabolism. In this study, 651 TFs were detected among the DEGs belonging to 43 TF families. The major TF families identified included WRKY (12.4%), C2H2 (12.1%), MYB (9.8%), bHLH (9.7%), ERF (7.4%), NAC (4.5%), GRAS (4.0%), bZIP (5.4%), and HD-ZIP (2.6%). We identified TFs that exhibited upregulated expression exclusively in LN-tolerant accessions under LN stress, with no differential expression observed in the LN-responsive genotypes. These tolerance-associated TFs represent candidate regulators that confer adaptive responses to nitrogen limitation (Figure 4a–d).
The expression of transcription factors that are highly expressed in the LN-tolerant accession, SORBI_3007G051800, which encodes the TF, bHLH35, was upregulated by 6.06-fold and 3.43-fold in LN-TR and LN-TL, respectively. Previous studies have indicated that BnaC9bHLH35 is induced under nitrate deficiency and enhances NUE by directly regulating nitrate uptake and assimilation genes [27]; these results confirm the conserved role that bHLH35 plays in the nitrogen stress response. Notably, SORBI_3002G040100 of the bHLH family was upregulated by 2.18-fold and 2.50-fold in LN-TR and LN-TL, respectively, suggesting a previously uncharacterized role for SORBI_3002G040100 in sorghum nitrogen adaptation. Three WRKY TFs (encoded by SORBI_3002G202700, SORBI_3003G199400, SORBI_3002G310800) also showed a marked induction. They were upregulated by 3.83-fold and 2.27-fold, 5.33-fold and 2.91-fold, and 2.18-fold and 2.44-fold in LN-TR and LN-TL, respectively. SORBI_3003G231800 from the MYB-related family, SORBI_3002G249500 from the C3H family, SORBI_3004G309600 from the bZIP family, SORBI_3001G508800 from the BES1 family, and SORBI_3008G149100 from the B3 family were upregulated by 3.51-fold and 2.10-fold, 6.17-fold and 4.39-fold, 2.91-fold and 2.38-fold, 1.67-fold and 1.99-fold, and 10.94-fold and 7.83-fold in LN-TR and LN-TL, respectively (Figure 4e).

3.4. Integrating GWAS and RNA-seq Data to Prioritize Candidate Genes

To narrow down the range of candidate genes, we used GWAS and RNA-seq to prioritize candidate genes. Fourteen DEGs were identified in the GWAS-associated regions, including 3, 3, 2, 2, 1, 1, 1, and 1 distributed in the QTL regions of q1, q2, q3, q4, q5, q6, q8, and q10, respectively (Table 2 and Table S2).
We identified three genes (SORBI_3003G098200, SORBI_3004G291500, and SORBI_3003G266600) that were simultaneously downregulated or upregulated in the LN-TL vs. NN-TL and LN-TR vs. NN-TR comparisons. Additionally, four genes (SORBI_3004G287400, SORBI_3003G097900, SORBI_3004G286200, and SORBI_3004G286400) shared concurrent upregulation in the LN-RL vs. NN-RL and LN-RR vs. NN-RR comparisons. Among these genes, SORBI_3003G098200, SORBI_3004G286200, and SORBI_3004G286400 encode uncharacterized proteins, whereas the others are putatively associated with critical biological processes, including plant developmental regulation, metabolic homeostasis, and stress response pathways (Table 3).
Following expression screening (FPKM ≥ 10), haplotype analysis of candidate genes was performed using nonsynonymous SNPs, excluding variants with a minor allele frequency < 5%. As shown in Table S13, these genes exhibited limited haplotype diversity (2–4 haplotypes) within the natural population. Transcriptional profiling under LN stress revealed that both SORBI_3004G286700 and SORBI_3003G266600 exhibited significant upregulation in LN-tolerant accessions but showed no significant change in LN-responsive ones (Table S13). This genotype-specific induction pattern demonstrated a significant positive correlation with LN tolerance in sorghum (p < 0.05), indicating that both genes are key functional regulators involved in LN adaptation. Haplotype analysis supported the functional significance of these genes. In SORBI_3004G286700, accessions carrying the minor haplotype, Hap2 (frequency = 14.66%), significantly outperformed those carrying the predominant haplotype, Hap1 (frequency = 83.19%), under LN stress across multiple traits: RDW (p = 3.31 × 10⁻²), TDW (p = 4.13 × 10⁻²), RN (p = 4.26 × 10⁻²), RNA (p = 1.53 × 10⁻³), and TNAcc (p = 4.53 × 10⁻²). A conserved nonsynonymous variant motif (Chr03:62908839 C→A; Chr03:62908840 A→G) in the Hap2 coding sequence, which results in distinct amino acid substitutions compared with those of Hap1, suggests a molecular basis for this functional divergence (Figure 5; Table S13). Similarly, for SORBI_3003G266600, Hap2 carriers (frequency = 13.36%) exhibited a significantly higher RDW (p = 3.65 × 10⁻²) than the Hap1 accessions (frequency = 63.36%) did under LN conditions. A conserved nonsynonymous variant (Chr03:60350404 A→G) in Hap2 is proposed to contribute to this phenotypic advantage (Figure 5; Table S13).

4. Discussion

4.1. Effects of LN Stress Conditions on Sorghum Phenotype

Genetic dissection of LN tolerance remains challenging due to its polygenic architecture and environmental dependencies [4]. Therefore, we employed seedling-based phenotyping as the most effective evaluation strategy, leveraging accelerated growth cycles, precise nutrient control, and high reproducibility [28] to identify consistent stress-response phenotypes across environments.
This study comprehensively evaluated the phenotypic responses of a diverse panel of 232 sorghum accessions to LN stress at the seedling stage. Our analysis revealed substantial genotypic variation in key NUE-related traits under both NN and LN conditions, highlighting the genetic potential of the sorghum germplasm for improving NUE. High CV values for SDW (51.80% under NN, 40.93% under LN) and SNAcc (74.93% for the NRC) indicated substantial genetic diversity in shoot biomass and nitrogen accumulation under NL stress. Notably, the NRC for SNAcc displayed an exceptionally high CV of 74.93%. The wide variation observed is a prerequisite for successful genetic dissection and marker-assisted selection because it suggests a rich reservoir of allelic diversity governing biomass production and NUE in shoots under LN availability [29,30]. The continuous distribution observed for all 12 sorghum traits assessed under both NN and LN conditions further confirms their quantitative nature, making this population highly suitable for GWAS aimed at identifying underlying QTL [31].
Correlation analysis indicated a strong positive correlation between TDW and both SDW (r = 0.96) and RDW (r = 0.95). This suggests that under nitrogen-deficiency stress, the accumulation of overall biomass is closely coordinated with stem and root growth. The significant increase in the RS ratio and NUE under LN conditions compared with that under NN conditions aligns with known adaptive strategies; plants often allocate more resources to root growth to enhance soil exploration under nutrient stress (increasing RS ratio) and improve the physiological efficiency of nitrogen utilization for biomass production (increasing NUE) [32]. According to the correlation diagram (Figure 2), the LN tolerance of sorghum is regulated by a complex physiological network and requires a comprehensive assessment based on multiple indicators. A single trait cannot be used as the basis for a high nitrogen utilization rate [33]. Phenotypic complexity necessitates multi-trait selection for breeding because co-localized QTL enhance reliability.

4.2. Candidate Genes Identified in the Detected QTL Regions Under LN Conditions

Although GWAS can effectively identify abiotic stress-response genes across crops [34], its limitations, including inconsistent SNP–trait associations and potential false-positives, necessitate complementary validation approaches [4]. Integrating GWAS with transcriptomic profiling significantly enhances candidate gene discovery. By combining GWAS-identified genomic regions with RNA-seq-derived DEGs under NN and LN conditions, we could precisely pinpoint genes directly governing nitrogen-stress adaptation. This integrated GWAS–RNA-seq strategy provides enhanced resolution for complex trait dissection [18,21].
This study identified 17 significant SNPs associated with LN response coefficients across 12 seedling stage traits in a diverse panel of 232 sorghum accessions, defining 10 QTL regions (q1–q10) on chromosomes 3, 4, 6, 8, and 10. The genetic diversity of the panel provided robust resolution for GWAS. Notably, our GWAS identified chromosome 3 as a critical genomic region, and multiple SNPs exhibited pleiotropic effects, with chr3-8637974, chr3-86379788, and chr3-60352480 being associated with five key traits (SDW, TDW, TNAcc, SNAcc, and RDW), significantly enhancing confidence in these loci as core genetic regulators of LN tolerance in sorghum.
This study delineated significant genomic regions and candidate genes governing the response of sorghum seedlings to LN stress.
Several QTL harbored functionally compelling candidate genes, such as SORBI_3003G267300 and SORBI_3003G267100 in q2 (Chr3: 8.59–8.68 Mb), which encode ABCB members; SORBI_3004G286700 and SORBI_3004G286800 in q3 (Chr3: 60.31–60.40 Mb), which were annotated as GDSL esterase/lipases; and SORBI_3004G290800 and SORBI_3004G291000 in the q5 region (Chr4: 63.16–63.25 Mb), which encode SCL TFs belonging to the GRAS family. According to previous reports, ABCB transporters are known to facilitate auxin transport, which influences root architecture and nutrient uptake [30,35], indicating that under LN conditions, sorghum may modulate the expression of ABCB genes in response to changes in external nitrogen availability. This is supported by findings in other cereals [36]. Our transcriptome data revealed that two GDSL lipases (encoded by SORBI_3004G286700 and SORBI_3004G286800) induced a >8-fold increase in nitrogen-tolerant lines. Given their established roles in root plasticity and hormone signaling [37,38], these enzymes may optimize root foraging under nitrogen limitation through analogous ethylene response pathways. Therefore, a detailed functional analysis of these candidate genes is essential to elucidate the precise regulatory mechanisms underlying sorghum’s adaptation to low nitrogen stress.
Integrated GWAS and RNA-seq analyses identified 14 DEGs that co-localized with LN stress-responsive QTL. Based on the integration of multiple methods, including haplotype-dependent expression under LN conditions, phenotypic variation significantly associated with haplotypes, and physical colocalization with adaptive QTLs, SORBI_3004G286700 and SORBI_3003G266600 were identified as key genes regulating nitrogen adaptation in sorghum. Notably, SORBI_3004G286700 exhibited pronounced functional divergence between its haplotypes. Hap2 carriers demonstrated statistically superior performance across multiple LN-responsive traits—including root biomass, total biomass, and nitrogen accumulation metrics—when compared with the predominant Hap1 carriers (Figure 5; Table S13), suggesting that its allelic variation drives phenotypic adaptation to nitrogen limitation.

4.3. Nitrogen Transporter Family Members and Differential TFs Regulating LN Stress Responses

The expression of NRTs (NRT1/PTR) and AMTs [39], combined with altered developmental gene expression (CesA, XTHs, and DIR1) and phytohormone signaling (GA, SL, IAA, and ABA), collectively modulate nitrogen acquisition, utilization, and stress tolerance.
Our study identified 38 nitrogen transporter family members from 6208 DEGs, revealing a distinct expression dichotomy in NRTs (NRT1/PTR family) between LN-tolerant (LiaonianB-1) and LN-sensitive (Yikeerli) sorghum accessions. Notably, SORBI_3010G095400 (urea symporter DUR3) and SORBI_3008G081200 (NRT1/PTR 4.3) were significantly downregulated in the LN-sensitive genotypes but upregulated in the tolerant lines (p < 0.01) (Figure 3a). This functional conservation parallels the findings in rapeseed, where BnaC07g22450 (NRT1/PTR homolog) is induced in nitrogen-efficient cultivars to enhance nitrate uptake during nitrogen deficiency [27].
We detected 651 TFs (43 families) that were responsive to LN stress, with bHLH, WRKY, and MYB dominating the regulatory landscape (Table 1). Among these, SORBI_3007G051800 (bHLH35) and three WRKY TFs (SORBI_3002G202700, SORBI_3003G199400, and SORBI_3002G310800) were uniquely upregulated in the tolerant accessions. This aligns with functional studies of orthologous BnaC9bHLH35 in rapeseed, which directly binds to the promoters of NRT (BnaNRT) and nitrate reductase (BnaNR) genes to enhance nitrate assimilation, thereby increasing primary root length by 30%, lateral root density by 200%, and nitrogen uptake efficiency [27]. Notably, the three novel TFs, SORBI_3003G231800 (MYB-related), SORBI_3004G309600 (bZIP), and SORBI_3008G149100 (B3), showed >5-fold induction exclusively in tolerant genotypes (p < 0.001), suggesting that they play lineage-specific regulatory roles during nitrogen adaptation in sorghum. However, their specific roles warrant further investigation.

5. Conclusions

In this study, GWAS and transcriptomic analyses were integrated to dissect the genetic architecture of LN tolerance in sorghum seedlings, revealing substantial genetic variation and identifying 10 QTL regions involved in the LN response, with chromosome 3 harboring key pleiotropic loci. Prioritization of candidate genes within these QTL highlighted the functionally important players, including ABCB transporters, GDSL esterase/lipases, and multi-validated regulators. We also identified key TF families, suggesting their specialized roles in nitrogen adaptation in sorghum. These findings demonstrate that LN tolerance is governed by a complex multi-gene network that regulates nitrogen transport, root architecture, and stress signaling, providing valuable genetic targets and markers for accelerating the breeding of nitrogen-efficient sorghum cultivars.

Supplementary Materials

The following supporting information can be downloaded at: https://www.mdpi.com/article/10.3390/agronomy15102250/s1, Figure S1: Population structure of an association panel of 232 sorghum accessions; Figure S2: Heatmap of the genome-wide relationship matrix (GRM) based on genetic similarity; Figure S3: Manhattan plots for genome-wide association analysis; Figure S4: Q-Q plots for genome-wide association analysis; Figure S5: Volcano plot of DEGs between the transcriptome sequencing samples of LN-responsive and LN-tolerant sorghum accessions; Figure S6: Gene Ontology enrichment analysis of low nitrogen (LN)-responsive and LN-tolerant sorghum accessions. Table S1: Details of 232 accessions and their NRC for 12 traits; Table S2: Genes by GWAS; Table S3: Quality statistics of transcriptome; Table S4: DEGs in LN-RL vs. NN-RL; Table S5: DEGs in LN-TL vs. NN-TL; Table S6: DEGs in LN-RR vs. NN-RR; Table S7: DEGs in LN-TR vs. NN-TR; Table S8: Common DEGs in LN-RL vs. NN-RL and LN-TL vs. NN-TL; Table S9: Common DEGs in LN-RR vs. NN-RR and LN-TR vs. NN-TR; Table S10: Common DEGs in LN-RR vs. NN-RR and LN-RL vs. NN-RL; Table S11: Common DEGs in LN-TR vs. NN-TR and LN-TL vs. NN-TL; Table S12: Expression profiling of NRT gene family members among DEGs under low-nitrogen stress; Table S13: Haplotype analysis of 10 candidate genes for five important QTL regions.

Author Contributions

Conceptualization, F.F., H.Y., J.P. and X.J.; Data curation, Y.W. (Yubin Wang), X.L. and J.C.; Formal analysis, F.F., Y.W. (Yao Wang), R.L., L.J., X.L. and J.C.; Funding acquisition, F.F. and J.P.; Investigation, F.F., R.L., Y.W. (Yubin Wang) and X.L.; Methodology, F.F., L.J., H.N., J.P. and X.J.; Resources, F.F., H.Y., H.N. and J.P.; Software, F.F., Y.W. (Yao Wang), X.C. and R.L.; Supervision, J.P. and X.J.; Validation, L.J., H.Y. and X.J.; Visualization, F.F., Y.W. (Yao Wang), X.C., Y.W. (Yubin Wang), H.Y. and J.C.; Writing—original draft, F.F.; Writing—review and editing, Y.W. (Yao Wang), Y.W. (Yubin Wang), L.J., H.Y., H.N. and X.J. All authors have read and agreed to the published version of the manuscript.

Funding

This research was supported by the project of Shanxi Province key lab construction (no. Z135050009017-2-7), the Shanxi Province Science Foundation for Youths (no. 202303021212091), and the earmarked fund for CARS-06.

Data Availability Statement

All data supporting the findings of this study are available within the paper and within its Supplementary Materials published online. The raw sequence data reported in this paper have been deposited in the Genome Sequence Archive in the National Genomics Data Center, China National Center for Bioinformation/Beijing Institute of Genomics, Chinese Academy of Sciences (GSA: CRA030074), which are publicly accessible at https://ngdc.cncb.ac.cn/gsa.

Conflicts of Interest

The authors declare that the research was conducted in the absence of any commercial or financial relationships that could be construed as a potential conflict of interest.

References

  1. Liu, Y.; Zhuang, M.; Liang, X.; Lam, S.K.; Chen, D.; Malik, A.; Li, M.; Lenzen, M.; Zhang, L.; Zhang, R.; et al. Localized nitrogen management strategies can halve fertilizer use in Chinese staple crop production. Nat. Food. 2024, 5, 825–835. [Google Scholar] [CrossRef] [PubMed]
  2. Cheng, F.; Bin, S.; Iqbal, A.; He, L.; Wei, S.; Zheng, H.; Yuan, P.; Liang, H.; Ali, I.; Xie, D.; et al. High Sink Capacity Improves Rice Grain Yield by Promoting Nitrogen and Dry Matter Accumulation. Agronomy 2022, 12, 1688. [Google Scholar] [CrossRef]
  3. Ma, R.; Jiang, C.; Shou, N.; Gao, W.; Yang, X. An Optimized Nitrogen Application Rate and Basal Topdressing Ratio Improves Yield, Quality, and Water- and N-use Efficiencies for Forage Maize (Zea mays L.). Agronomy 2023, 13, 181. [Google Scholar] [CrossRef]
  4. Liu, Y.; Wang, H.; Jiang, Z.; Wang, W.; Xu, R.; Wang, Q.; Zhang, Z.; Li, A.; Liang, Y.; Ou, S.; et al. Genomic basis of geographical adaptation to soil nitrogen in rice. Nature 2021, 590, 600–605. [Google Scholar] [CrossRef]
  5. Yadav, M.R.; Kumar, S.; Lal, M.K.; Kumar, D.; Kumar, R.; Yadav, R.K.; Kumar, S.; Nanda, G.; Singh, J.; Udawat, P.; et al. Mechanistic Understanding of Leakage and Consequences and Recent Technological Advances in Improving Nitrogen Use Efficiency in Cereals. Agronomy 2023, 13, 527. [Google Scholar] [CrossRef]
  6. Moore, J.W.; Ditmore, M.; Tebeest, D.O. The effects of cropping history on grain sorghum yields and anthracnose severity in Arkansa. Crop Prot. 2009, 28, 737–743. [Google Scholar] [CrossRef]
  7. Moll, R.H.; Kamprath, E.J.; Jackson, W.A. Analysis and Interpretation of Factors Which Contribute to Efficiency of Nitrogen Utilization. Agron. J. 1962, 74, 562–564. [Google Scholar] [CrossRef]
  8. Chen, Z.; Li, L.; Halford, N.G.; Xu, H.; Huang, L.; Gao, R.; Lu, R.; Liu, C. Advances in Barley Breeding for Improving Nitrogen Use Efficiency. Agronomy 2022, 12, 1682. [Google Scholar] [CrossRef]
  9. Saini, D.K.; Chopra, Y.; Singh, J.; Sandhu, K.S.; Kumar, A.; Bazzer, S.; Srivastava, P. Comprehensive evaluation of mapping complex traits in wheat using genome-wide association studies. Mol Breed. 2022, 42, 1. [Google Scholar] [CrossRef]
  10. Yang, X.; Xia, X.; Zhang, Z.; Nong, B.; Zeng, Y.; Xiong, F.; Wu, Y.; Gao, J.; Deng, G.; Li, D. QTL Mapping by Whole Genome Re-sequencing and Analysis of Candidate Genes for Nitrogen Use Efficiency in Rice. Front. Plant Sci. 2017, 8, 1634. [Google Scholar] [CrossRef]
  11. Wei, D.; Cui, K.; Ye, G.; Pan, J.; Xiang, J.; Huang, J.; Nie, L. QTL mapping for nitrogen-use efficiency and nitrogen-deficiency tolerance traits in rice. Plant Soil 2012, 359, 281–295. [Google Scholar] [CrossRef]
  12. Li, P.; Chen, F.; Cai, H.; Liu, J.; Pan, Q.; Liu, Z.; Gu, R.; Mi, G.; Zhang, F.; Yuan, L. A genetic relationship between nitrogen use efficiency and seedling root traits in maize as revealed by QTL analysis. J. Exp. Bot. 2015, 66, 3175–3188. [Google Scholar] [CrossRef]
  13. Han, M.; Wong, J.; Su, T.; Beatty, P.H.; Good, A.G. Identification of Nitrogen Use Efficiency Genes in Barley: Searching for QTLs Controlling Complex Physiological Traits. Front. Plant Sci. 2016, 7, 1587. [Google Scholar] [CrossRef]
  14. Hu, B.; Wang, W.; Chen, J.; Liu, Y.; Chu, C. Genetic improvement toward nitrogen-use efficiency in rice: Lessons and perspectives. Mol. Plant 2023, 16, 64–74. [Google Scholar] [CrossRef]
  15. Poudel, A.; Phogat, S.; Roy, J.; Saini, M.R.; Shivaprasad, K.M.; Madhavan, J.; Chinnusamy, V.; Vinod, K.K.; Sevanthi, A.M.; Mandal, P.K. Unlocking genetic hotspots: GWAS reveals key nitrogen responsive genomic regions and key genes for root and yield traits in indica rice. Mol. Genet. Genom. 2025, 300, 53. [Google Scholar] [CrossRef]
  16. Wang, M.H.; Cordell, H.J.; Van Steen, K. Statistical methods for genome-wide association studies. Semin. Cancer Biol. 2019, 55, 53–60. [Google Scholar] [CrossRef]
  17. GTEx Consortium. The GTEx Consortium atlas of genetic regulatory effects across human tissues. Science 2020, 369, 1318–1330. [Google Scholar] [CrossRef]
  18. Li, Q.; Lu, X.; Wang, C.; Shen, L.; Dai, L.; He, J.; Yang, L.; Li, P.; Hong, Y.; Zhang, Q.; et al. Genome-wide association study and transcriptome analysis reveal new QTL and candidate genes for nitrogen-deficiency tolerance in rice. Crop J. 2022, 10, 942–951. [Google Scholar] [CrossRef]
  19. Zhao, L.; Cai, B.; Zhang, X.; Zhang, B.; Feng, J.; Zhou, D.; Chen, Y.; Zhang, M.; Qi, D.; Wang, W.; et al. Physiological and Transcriptional Characteristics of Banana Seedlings in Response to Nitrogen Deficiency Stress. Horticulturae 2024, 10, 290. [Google Scholar] [CrossRef]
  20. Li, G.; Yang, D.; Hu, Y.; Xu, J.; Lu, Z. Genome-Wide Identification and Expression Analysis of Nitrate Transporter (NRT) Gene Family in Eucalyptus grandis. Genes 2024, 15, 930. [Google Scholar] [CrossRef] [PubMed]
  21. Ju, L.; Liu, R.; Cheng, X.; Wang, Y.; Lv, X.; Chu, J.; Niu, H.; Yan, H.; Wang, Y.; Fan, F.; et al. Integrated transcriptome, GWAS, and metabolome revealed the mechanism of seed germination in sorghum. Front. Plant Sci. 2025, 16, 1601899. [Google Scholar] [CrossRef]
  22. Gautam, V.P.; Mishra, S.; Ahmed, H. Comparison of Total Nitrogen estimation by Kjeldahl Method and CHNS Analyzer in Dry Tropical Grassland. Int. J. Plant Environ. 2023, 9, 180–182. [Google Scholar] [CrossRef]
  23. Yun, P.; Kaya, C.; Shabala, S. Hormonal and epigenetic regulation of root responses to salinity stress. Crop J. 2024, 12, 1309–1320. [Google Scholar] [CrossRef]
  24. de Almeida, C.P.; Barbosa, R.R.; Ferraz, C.G.; de Castro, R.D.; Ribeiro, P.R. Genome-wide identification of the GDSL-type esterase/lipase protein (GELP) gene family in Ricinus communis and its transcriptional regulation during germination and seedling establishment under different abiotic stresses. Plant Physiol. Biochem. 2024, 214, 108939. [Google Scholar] [CrossRef]
  25. Qiao, X.; Yu, T.; Ruan, M.; Cui, C.; Chen, C.; Zhu, Y.; Li, F.; Wang, S.; Na, X.; Wang, X.; et al. Mitochondrial uncoupling protein contributes to the regulation of carbon and nitrogen metabolism and seed yield under low nitrogen stress in Arabidopsis. Cell. Mol. Life Sci. 2021, preprint. [Google Scholar] [CrossRef]
  26. Krapp, A.; David, L.C.; Chardin, C.; Girin, T.; Marmagne, A.; Leprince, A.-S.; Chaillou, S.; Ferrario-Méry, S.; Meyer, C.; Daniel-Vedele, F. Nitrate transport and signalling in Arabidopsis. J. Exp. Bot. 2014, 65, 789–798. [Google Scholar] [CrossRef] [PubMed]
  27. Fang, Q.-X.; Cheng, H.; Ma, Z.; Xu, Q.; Wang, H.; Yan, Y.; Sun, M.; Wang, R.; Liu, W.; Ullah, S.; et al. Rapeseed transcription factor BnaC9bHLH35 promotes root growth and improves nitrogen use efficiency under low nitrate conditions. Theor. Appl. Genet. 2025, 138, 162. [Google Scholar] [CrossRef]
  28. Shi, H.; Wang, W.; Gao, L.; Wu, J.; Hu, C.; Yan, H.; Shi, Y.; Li, N.; Ma, Y.; Zhou, Y.; et al. Genome-wide association study of seedling nitrogen-use efficiency-associated traits in common wheat (Triticum aestivum L.). Crop J. 2024, 12, 222–231. [Google Scholar] [CrossRef]
  29. Boopathi, N.M. Genetic Mapping and Marker Assisted Selection; Springer: Singapore, 2020; pp. 253–326. [Google Scholar] [CrossRef]
  30. Kadirvel, P.; Senthilvel, S.; Geethanjali, S.; Sujatha, M.; Varaprasad, K.S. Genetic Markers, Trait Mapping and Marker-Assisted Selection in Plant Breeding. In Plant Biology and Biotechnology; Bahadur, B., Venkat Rajam, M., Sahijram, L., Krishnamurthy, K., Eds.; Springer: New Delhi, India, 2015; pp. 65–88. [Google Scholar] [CrossRef]
  31. Huang, X.; Han, B. Natural variations and genome-wide association studies in crop plants. Annu. Rev. Plant Biol. 2014, 65, 531–551. [Google Scholar] [CrossRef]
  32. Gelli, M.; Mitchell, S.E.; Liu, K.; Clemente, T.E.; Weeks, D.P.; Zhang, C.; Holding, D.R.; Dweikat, I.M. Mapping QTLs and association of differentially expressed gene transcripts for multiple agronomic traits under different nitrogen levels in sorghum. BMC Plant Biol. 2016, 16, 16. [Google Scholar] [CrossRef]
  33. Liu, C.; Gu, W.; Li, B.; Feng, Y.; Liu, C.; Shi, X.; Zhou, Y. Screening key sorghum germplasms for low-nitrogen tolerance at the seedling stage and identifying from the carbon and nitrogen metabolism. Front. Plant Sci. 2024, 15, 1340509. [Google Scholar] [CrossRef]
  34. He, F.; Wei, C.; Zhang, Y.; Long, R.; Li, M.; Wang, Z.; Yang, Q.; Kang, J.; Chen, L. Genome-Wide Association Analysis Coupled with Transcriptome Analysis Reveals Candidate Genes Related to Salt Stress in Alfalfa. Front. Plant Sci. 2022, 12, 826584. [Google Scholar] [CrossRef]
  35. Ying, W.; Wang, Y.; Wei, H.; Luo, Y.; Ma, Q.; Zhu, H.; Janssens, H.; Vukašinović, N.; Kvasnica, M.; Winne, J.M.; et al. Structure and function of the Arabidopsis ABC transporter ABCB19 in brassinosteroid export. Science 2024, 383, eadj4591. [Google Scholar] [CrossRef] [PubMed]
  36. Du, L.; Ye, R.; Liu, X.; He, Q.; Qiao, J.; Charrier, L.; Geisler, M.; Gao, Z.; Qian, Q.; Qi, Y. The OsbHLH166-OsABCB4 module regulates grain length and weight via altering auxin efflux. Sci. Bull. 2025, 70, 2125–2136. [Google Scholar] [CrossRef] [PubMed]
  37. Hamada, S.; Hasegawa, Y.; Suzuki, Y. Identification of a GDSL-motif carboxylester hydrolase from rice bran (Oryza sativa L.). J. Cereal Sci. 2012, 55, 100–105. [Google Scholar] [CrossRef]
  38. Zhao, H.; Ma, B.; Duan, K.-X.; Li, X.-K.; Lu, X.; Yin, C.-C.; Tao, J.-J.; Wei, W.; Zhang, W.-K.; Xin, P.-Y.; et al. The GDSL Lipase MHZ11 Modulates Ethylene Signaling in Rice Roots. Plant Cell 2020, 32, 1626–1643. [Google Scholar] [CrossRef]
  39. Luo, J.; Hang, J.; Wu, B.; Wei, X.; Zhao, Q.; Fang, Z. Co-overexpression of genes for nitrogen transport, assimilation, and utilization boosts rice grain yield and nitrogen use efficiency. Crop J. 2023, 11, 785–799. [Google Scholar] [CrossRef]
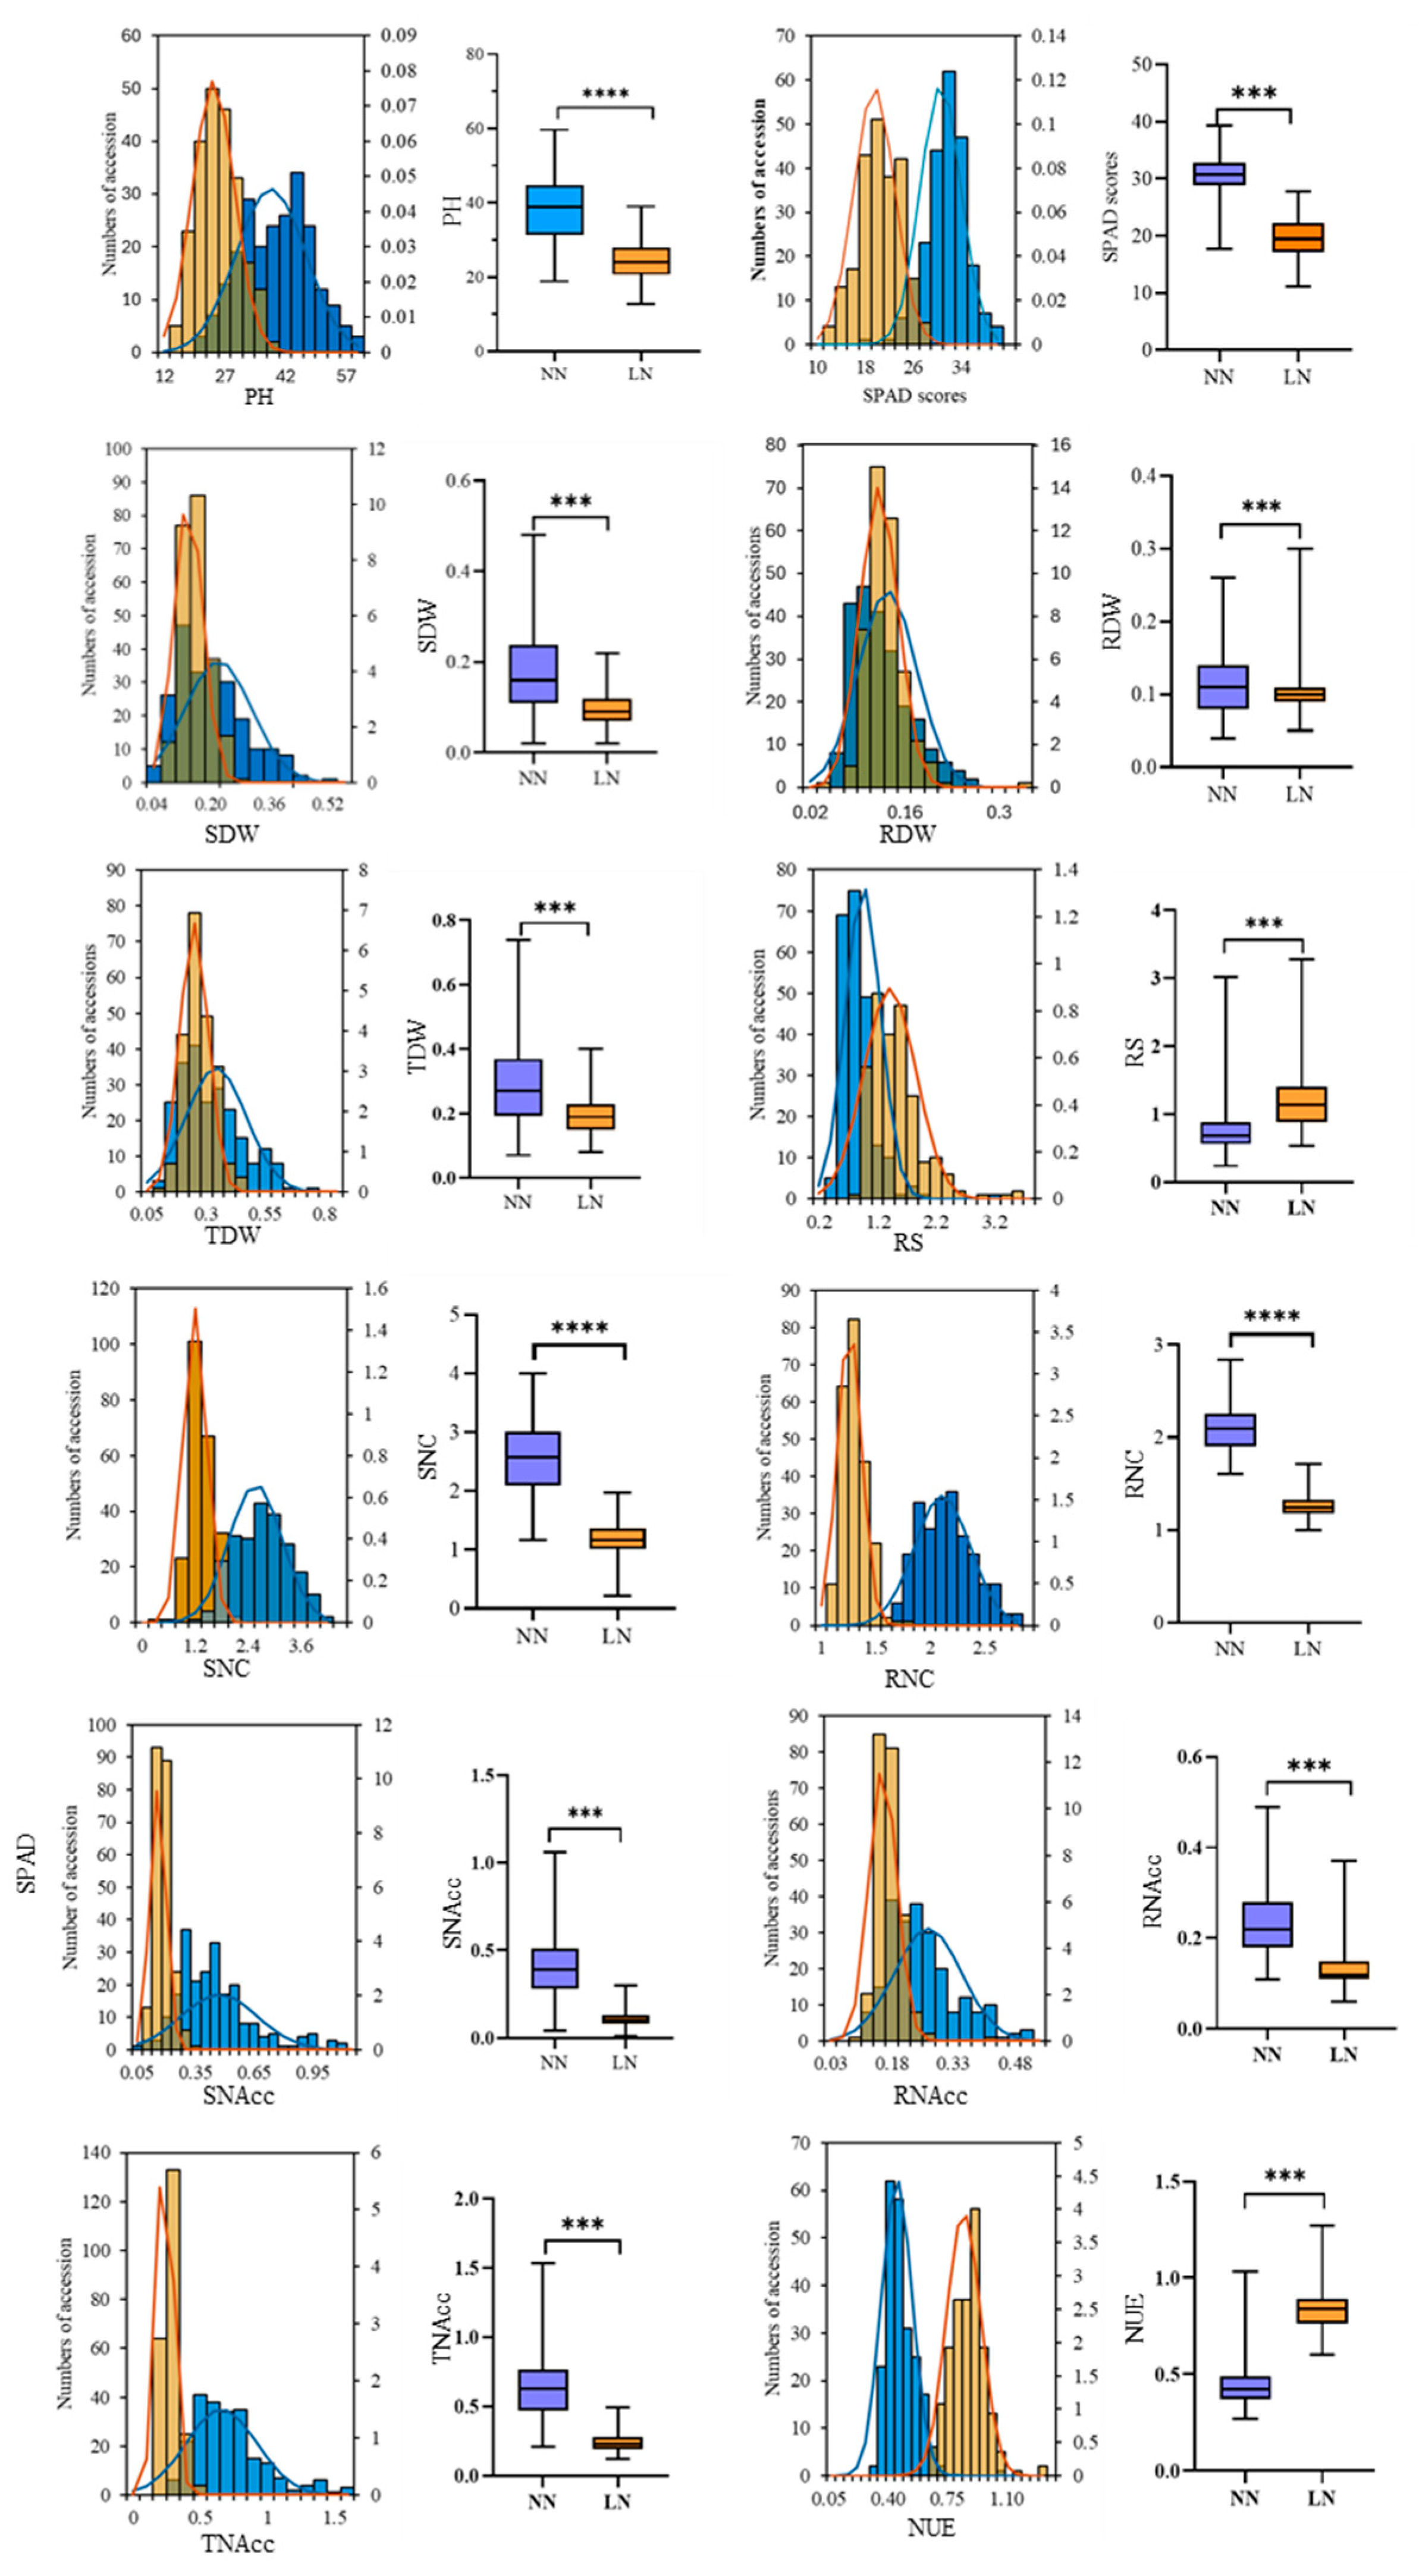
Figure 1. Phenotypic trait variations in 232 sorghum accessions grown under low-nitrogen (LN) and normal nitrogen (NN) conditions. *** p < 0.001, **** p < 0.0001. The orange bars/lines represent the LN treatment, while the blue bars/lines represent the NN treatment.
Agronomy 15 02250 g001
Figure 2. Correlation coefficients between traits related to nitrogen efficiency in sorghum. * p < 0.05, ** p < 0.01, *** p ≤ 0.001.
Agronomy 15 02250 g002
Figure 3. DEG analysis between the LN-responsive and LN-tolerant sorghum accession transcriptome sequencing samples: (a) bar chart analysis; (b) Venn diagram analysis; (c) fold change of DEGs involved in nitrogen utilization.
Agronomy 15 02250 g003
Figure 4. Number of DEGs distributed in different TF families (ad). (e) Distribution of transcription factor family genes among the DEGs of LN-responsive and LN-tolerant sorghum accessions.
Agronomy 15 02250 g004
Figure 5. Haplotype-dependent phenotypic variation in SORBI_3004G286700 under low-nitrogen stress. * p < 0.05, ** p < 0.01.
Agronomy 15 02250 g005
Table 1. Statistical analysis of seedling traits under different conditions.
TraitNNLNNRC
RangeMeanCV%RangeMeanCV%RangeMeanCV%
PH18.75–59.6038.4722.2312.13–39.0024.2923.610.38–1.020.6415.11
SPAD17.68–39.3530.5711.0611.05–27.7819.4717.510.38–0.890.6414.79
SDW0.02–0.480.1851.800.02–0.220.0940.930.18–1.710.6141.42
RDW0.04–0.260.1237.660.05–0.300.1027.790.45–1.810.9526.14
TDW0.07–0.740.2944.420.08–0.400.2030.330.28–1.720.7532.53
RS0.24–3.020.7539.840.53–3.281.2136.820.90–5.001.6832.38
SNC1.17–4.002.5823.400.21–1.971.2022.140.16–0.880.4718.88
RNC1.60–2.842.1112.271.00–1.711.268.760.00–0.840.6014.40
SNAcc0.04–1.060.4246.760.01–0.260.1138.180.02–3.180.2974.93
RNAcc0.11–0.490.2434.620.06–0.370.1326.410.27–1.140.5726.65
TNAcc0.21–1.530.6640.030.12–0.490.2426.880.17–0.950.3929.58
NUE0.27–1.030.4420.450.61–1.270.8312.100.83–2.801.9414.85
NN: normal nitrogen; LN: low nitrogen; NRC: the nitrogen response coefficient; PH: plant height; SPAD: chlorophyll; SDW: shoot dry weight; RDW: root dry weight; TDW: total dry weight; CHL: chlorophyll; RS: root–shoot ratio; SNC: the nitrogen content of the shoot; RNC: the nitrogen content of the root; SNAcc: shoot nitrogen accumulation; RNAcc: root nitrogen accumulation; TNAcc: total nitrogen accumulation of the whole plant; NUE: nitrogen utilization efficiency.
Table 2. GWAS regions associated with nitrogen efficiency-associated traits.
QTLChr.Significant SNP Position (nt)Physical RegionNo. of SNPs Within the GenesDetected Trait−log10(P)
q1386379748,593,974–8,681,97842SDW, TDW, TNAcc, SNAcc6.81, 7.29, 6.68, 6.78
q1386379788,593,974–8,681,978SDW, TDW, TNAcc, RDW, SNAcc7.07, 7.50, 6.81, 6.58, 6.94
q1386379948,593,974–8,681,996TDW6.78
q1386379968,593,974–8,681,996TDW6.78
q236035248060,308,480–60,396,48076SDW, TDW, SNAcc, TNAcc6.98, 7.35, 6.59, 6.84
q346288680762,842,807–62,930,91235SDW, TDW6.74, 6.58
q346288683262,842,807–62,930,912SDW, RDW, TDW7.46, 7.23, 7.42
q346288691262,842,807–62,930,912SDW, RDW, TDW7.03, 6.63, 6.88
q346288841262,844,412–62,932,412SNAcc6.58
q446294909862,905,098–62,993,098112PH7.12
q546320793963,163,939–63,251,93916SDW, TDW, SNAcc6.95, 7.17, 6.56
q664254632042,502,320–42,590,32048SNAcc, TNAcc6.62, 6.58
q7659562085,912,208–6,000,21412NUE6.56
q7659562145,912,208–6,000,214NUE6.91
q881518238115,138,381–15,226,3812RNC6.60
q9103420722634,163,226–34,251,2267RNAcc, TDW6.92, 6.78
q101020402391,996,239–2,084,23952RS6.85
Table 3. Details of DEGs in GWAS regions.
QTLLocus IDLog2(Fold Change) for DEGsNsSNP No.Haplotype No.Functional Annotation
LN-RL vs.
NN-RL
LN-TL vs.
NN-TL
LN-RR vs.
NN-RR
LN-TR vs.
NN-TR
q1SORBI_3004G286700Ns1.08 NsNs2 2 GDSL esterase/lipase At5g55050-like
q1SORBI_3004G287100Ns−1.37 NsNs1 2 tRNA pseudouridine synthase A, mitochondrial isoform X1
q1SORBI_3004G2874001.19 Ns1.15 Ns3 4 mechanosensitive ion channel protein 5
q2SORBI_3003G0979005.25 Ns4.63 Ns1 2 putative E3 ubiquitin-protein ligase SINA-like 6
q2SORBI_3003G098100NsNs2.97 2.69 3 4 aquaporin NIP4-1
q2SORBI_3003G098200Ns−1.63 Ns−1.19 3 3 uncharacterized protein LOC8079071
q3SORBI_3003G266600Ns1.06 Ns1.07 1 2 Phosphomethy lethanolamine N-methyltransferase
q3SORBI_3003G2673001.38 1.28 1.44 1.29 2 3 ABC transporter B family member 11
q4SORBI_3004G2862001.11 Ns1.43 Ns2 3 uncharacterized protein LOC8073918
q4SORBI_3004G2864001.06 Ns1.15 Ns1 2 uncharacterized protein LOC8076049
q5SORBI_3004G291500Ns−4.74 Ns−1.10 1 2 14 kDa proline-rich protein DC2.15
q6SORBI_3006G065900NsNsNs1.39 1 2 uncharacterized protein At4g22758
q8SORBI_3008G082200−4.02 NsNsNs protein TWIN SISTER of FT
q10SORBI_3010G024500Ns−1.05 NsNs probable LRR receptor-like serine/threonine-protein kinase At1g34110
Ns: no significant difference in DEGs between treatments.
Disclaimer/Publisher’s Note: The statements, opinions and data contained in all publications are solely those of the individual author(s) and contributor(s) and not of MDPI and/or the editor(s). MDPI and/or the editor(s) disclaim responsibility for any injury to people or property resulting from any ideas, methods, instructions or products referred to in the content.