Abstract
In the detection of the pests and diseases of flax, early wilt disease is elusive, yellow leaf disease symptoms are easily confusing, and pest detection is hampered by issues such as diversity in species, difficulty in detection, and technological bottlenecks, posing significant challenges to detection efforts. To address these issues, this paper proposes a flax pest and disease detection method based on an improved YOLOv8n model. To enhance the detection accuracy and generalization capability of the model, this paper first employs the Albumentations library for data augmentation, which strengthens the model’s adaptability to complex environments by enriching the diversity of training samples. Secondly, in terms of model architecture, a Bidirectional Feature Pyramid Network (BiFPN) module is introduced to replace the original feature extraction network. Through bidirectional multi-scale feature fusion, the model’s ability to distinguish pests and diseases with similar features and large scale differences is effectively improved. Meanwhile, the integration of the SimAM attention mechanism enables the model to learn information from three-dimensional channels, enhancing its perception of pest and disease features. Additionally, this paper adopts the EIOU loss function to further optimize the model’s bounding box regression, reducing the distortion of bounding boxes caused by high sample variability. The experimental results demonstrate that the improved model achieves a significant detection performance on the flax pest and disease dataset, with notable improvements in the detection accuracy and mean average precision compared to the original YOLOv8n model. Finally, this paper proposes a YOLOv8n model with a four-headed detection design, which significantly enhances the detection capability for small targets such as pests and diseases with a size of 4 × 4 pixels or larger by introducing new detection heads and optimizing feature extraction. This method not only improves the detection accuracy for flax pests and diseases but also maintains a high computational efficiency, providing effective technical support for the rapid and precise detection of flax pests and diseases and possessing an important practical application value.
1. Introduction
Flax, as a highly economically valuable and adaptable crop, plays a crucial role in multiple regions globally, especially in arid and semi-arid zones [1]. However, with the constant changes in planting environments and the increasing intensity of agricultural production, the problem of flax pests and diseases has become increasingly severe, posing a severe challenge to crop yield and quality. The early and accurate detection of pests and diseases is a key step in formulating effective prevention and control strategies to reduce losses [2]. Therefore, the development of efficient and precise detection technologies for flax pests and diseases is of great significance for ensuring the sustainable and healthy development of the flax industry.
Flax pests and diseases are numerous, including various insects (such as cotton bollworm and yellow-spotted lepidoptera) and diseases (such as wilt and yellow leaf disease), which affect the growth cycle of flax through different pathways. From seed germination to mature harvest, each stage may be subject to infestation. Traditional pest and disease detection methods mainly rely on manual observation, which is not only time-consuming and labor-intensive but also susceptible to subjective factors, making it difficult to achieve an early warning and the precise identification of pests and diseases [3]. Therefore, exploring and applying modern scientific and technological means, such as molecular biology, spectral analysis, and machine learning, for the rapid and accurate detection of flax pests and diseases has become a current research hotspot and difficulty [4].
In recent years, with the rapid development of computer vision and deep learning technologies, deep learning technologies, especially convolutional neural networks (CNNs) and their derivative models, have been widely used in plant pest and disease detection [5]. These models are mainly divided into two categories: image classification techniques and object detection algorithms. Image classification techniques mainly classify plant pests and diseases by recognizing features in leaf images. For example, Tadele, A.B. et al. [6] proposed a comparison between a self-developed CNN model and five off-the-shelf CNN models for the image classification and detection of sesame diseases in Sudan, with the self-developed model achieving an accuracy of 88.5% on the test set. Michael Gomez Selvaraj [7] proposed an AI banana pest and disease detection system based on DCNN and transfer learning, which found that the ResNet50 and InceptionV2 models performed excellently, with accuracies exceeding 90% after retraining different CNN architectures and utilizing pre-screened image datasets. Amanda Ramcharan [8] proposed a cassava disease detection model based on deep convolutional neural networks. Transfer learning was used to train cassava disease images in Tanzanian fields, identifying three diseases and two pest-induced damages. The detection accuracy reached 93–98%. Fan Xiangpeng [9] and others introduced a transfer learning mechanism through an improved VGG16 model to detect and classify five types of grape diseases and healthy leaves, with an average classification accuracy of 98.02%. Similarly, He Dongjian et al. [10] proposed an improved residual network for identifying grape downy mildew, achieving a recognition accuracy of 99.92%. In addition, Türkoğlu et al. [11] used CNNs to test the PlantVillage dataset, containing 54,306 leaf images of 14 crops, 26 diseases, and 38 categories, achieving an accuracy of 99.35%, proving the feasibility of CNN methods. Hongxing Ma [12] and others proposed YOLOv8s-KDT, a lightweight and fast plant detection system for complex desert grassland environments. After improvement, the model’s FLOPs decreased by 50.8%, accuracy increased by 4.5%, and mAP rose by 5.6%. Zheng Wang [13] and others proposed the E - YOLO model by taking advantage of the YOLOv8n model, innovatively labeled individual estrus cows, replaced the Complete Intersection over Union (CIoU) loss with the Normalized Wasserstein Distance (NWD) loss, and introduced the Context Information Augmentation Module (CIAM) and Triplet Attention Module (TAM). The model achieved an Average Precision of mounting (APm) of 95.70%, an F1 - score of 93.74%, a detection speed of 8.1 ms/frame, and had 3.04 million parameters. It performed better than models like YOLOv8. However, flax disease identification based on image classification techniques has high recognition accuracy but is mostly specific to certain diseases, making it difficult to accurately locate lesion areas.
In the field of plant disease and pest detection, the development of object detection technology has provided powerful support for the real-time monitoring and early warning of diseases and pests. Two-stage object detection models, such as Faster R-CNN, first generate candidate regions through a Region Proposal Network (RPN) and then perform fine-grained classification and location adjustment on these regions. This mechanism enables two-stage models to typically achieve a higher accuracy in complex backgrounds and multi-class object detection. Manzhou Li [14] proposed a plant disease and pest detection model that integrates YOLO with Faster R-CNN, using clustering and transfer learning methods to achieve an mAP (mean average precision) detection result of 85.2%. Additionally, a mobile application was developed for rapid agricultural applications. Zhao et al. [15] transferred the initial weights of the COCO dataset to a Faster R-CNN model for potato leaf disease detection, demonstrating a higher detection accuracy in specific scenarios compared to YOLO series models. Wang Jin [16] and colleagues proposed a detection method for small-target, stored-grain pests by improving the Faster R-CNN network and innovatively incorporating a Feature Pyramid Network (FPN) structure, thereby achieving a 2.21% improvement in the mean average precision. Kaur et al. [17] built an autonomous segmentation and detection model for tomato leaf diseases based on the Mask R-CNN algorithm. By adding Light-Head R-CNN and modifying the aspect ratios of anchors in the RPN (Region Proposal Network) to improve the detection accuracy, the model achieved a mean average precision (mAP) of 88.2%. These research achievements have significantly improved the accuracy and adaptability of pest and disease detection, effectively meeting the needs for basic pest and disease identification in practical applications.
However, two-stage models also face challenges such as relatively slower detection speeds and higher com putational complexity, making it difficult for them to meet scenarios with high real-time requirements and limited hardware resources. One-stage object detection models have been widely applied in crop disease and pest detection. Among them, the YOLO (You Only Look Once) series models have become research hotspots due to their efficiency and real-time performance. The YOLO model can simultaneously predict the category, location, and confidence of objects through a single forward pass, significantly improving detection speed. In flax disease and pest detection, YOLO series models have demonstrated significant advantages. For example, Danyan Xie [18] and others proposed a real-time strawberry pest and disease identification method based on the improved YOLOv8 algorithm. Detection is achieved through improvements to the convolutional block attention module, ultra-lightweight dynamic upsampling operator, and full-dimensional dynamic convolution. In this method, the accuracy of each improved algorithm in the experiment reached 97.519%, and the F1-score was 96.852%. Xueqiu Wang [19] and others proposed the BL-YOLOv8 model, optimized the neck structure of YOLOv8s, and introduced the SimSPPF module and the LSK-attention mechanism to improve the detection accuracy and efficiency for road defects. Experiments show that compared with the original model, the average precision of BL-YOLOv8 was increased by 3.3%, and the number of parameters and the computational load were reduced. Jie Wang [20] and others proposed the YOLOv8-MSS model for optimizing unmanned surface vehicle (USV) target detection tasks, improving the model’s detection accuracy and anti-interference ability for small targets by adding a small-target detection head, introducing C2f_MLCA and SENetV2, and adopting the SIoU loss function. The experimental results demonstrated significant improvements in mAP@0.5 and mAP@0.5:0.95 on the FloW-Img dataset with the improved algorithm. Jiaodi Liu [21] and others proposed an algorithm to improve the YOLOv8n model to meet the needs of enhancing the efficiency of sugarcane planting operations, etc. The improvements include replacing the backbone network, integrating the structure, introducing the mechanism, and adopting a new function. The experimental results show that the improved model reaches 96% in mAP@0.5 and 71.5% in mAP@0.5:0.95, which are higher than those of the original model. Moreover, compared with other models, it has higher accuracy and fewer parameters. Long Jiehua [22] and colleagues effectively identified diseases and pests at the different growth stages (flowering, fruit enlargement, green fruit, and maturity) of flax by improving the YOLO v4-CBAM model and introducing an attention mechanism. By integrating the attention mechanism to assign greater weights to target features, the model improved the detection accuracy. Specifically, the recognition accuracy rates during the flowering, fruit enlargement, and maturity stages reached 92.38%, 82.45%, and 92.31%, respectively. Although the recognition accuracy rate was slightly lower during the green fruit stage (68.01%), the model overall demonstrated a high detection performance. Gang Wang et al. [23] proposed the UAV-YOLOv8 small-target detection model, optimized using methods such as Wise-IoU, BiFormer, and Focal FasterNet. The experiments showed that this model achieves a 7.7% improvement in detection accuracy compared to the baseline model, demonstrating a superior performance.
Furthermore, YOLOv8 has demonstrated significant potential in sesame pest and disease detection due to its higher detection accuracy and speed [24]. Its ability to process high-resolution images and adapt to target-detection requirements in different environments makes it of great significance in the real-time monitoring and early warning of sesame pests and diseases.
Despite YOLOv8 performing remarkably well in general object detection tasks, it has significant limitations in detecting the subtle features of pests and diseases (such as early disease spots and minute pest traces) in the complex field environment of flax [25]. These features are often difficult to capture accurately due to factors such as lighting changes, cluttered backgrounds, and diverse pest and disease morphologies, resulting in a relatively high rate of missed detections and false alarms. Especially for early-stage or less obvious pests and diseases, its recall rate is significantly low [26]. In addition, there is a wide variety of flax pests and diseases, and the subtle differences in features among different pests and diseases pose higher requirements for the model’s generalization ability and feature discrimination ability.
Addressing the aforementioned limitations of YOLOv8 in sesame pest and disease detection, this study proposes a precise detection algorithm for sesame pests and diseases based on an improved YOLOv8 model. This algorithm integrates a series of innovative techniques aimed at enhancing the model’s sensitivity and recognition accuracy for pest and disease features in complex field environments. It first uses Albumentations for data augmentation, then introduces a Bidirectional Feature Pyramid Network (BiFPN) and a Similarity-Aware Activation Module (SimAM) to improve the feature discrimination and perception capabilities. Additionally, it adopts Enhanced Intersection over Union Loss (EIOU) to optimize the detection bounding boxes and innovatively designs a four-headed detection structure to enhance the detection of small targets. This method improves detection accuracy and efficiency, providing technical support for the precise detection of sesame pests and diseases and having an important application value.
The following is a summary and conclusion of the work in this paper:
- (1)
- In this study, the YOLOv8n model was improved for the detection of flax pests and diseases. An improved BiFPN module was introduced in the feature fusion layer to break through the interference in multi-scale detection. The SimAM attention mechanism was incorporated to strengthen feature extraction. EIOU was used to replace CIOU to optimize bounding box regression. A four-detection-head structure was designed to improve the detection efficiency. After the improvement, the accuracy of the model reached 92.1%, the recall rate was 91.6%, and the mAP was 94.5%, achieving accurate identification.
- (2)
- When the improved YOLOv8n model was compared with mainstream models, such as Faster R-CNN, SSD, YOLOv5, and the original YOLOv8n, the improved YOLOv8n model was superior in terms of indicators such as the accuracy, recall rate, and mAP.
- (3)
- A real-time flax pest and disease detection system was developed based on Pyqt5. The improved YOLOv8n model was integrated into this system, enabling fast and convenient detection.
2. Materials and Methods
2.1. Collection and Production of Sesame Disease Data
This study constructed a sesame pest and disease dataset. The dataset originates from the Oilseed Crops Station in Dingxi City, Gansu Province, China (34.5° N, 104.2° E). Images were captured using an iPhone 14 Pro, with a resolution of 4096 × 3072, a bit depth of 24 bits, and RGB three-channel color depth, and saved in JPG format to ensure a high image quality. During the shooting process, special consideration was given to factors such as shooting angles, weather conditions, and lighting conditions. Multiple angles, including overhead, side, and upward views, were employed, and photographs were taken under different weather conditions (sunny, cloudy, overcast, and rainy) and lighting conditions to comprehensively capture the characteristics of pests and diseases on sesame plants. The dataset contains images of three types of sesame pests and diseases, with sufficient sample sizes for each type, totaling 1462 images, to ensure the model’s generalization ability. Specific dataset samples are shown in Figure 1.
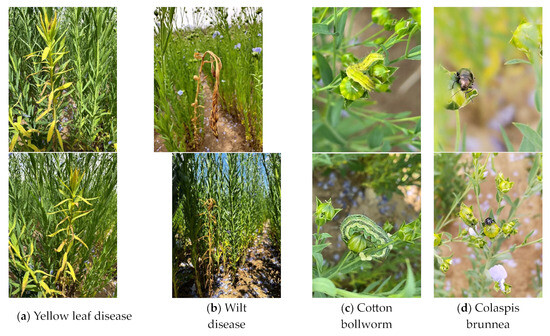
Figure 1.
Process of image preprocessing.
(a) Yellow leaf disease: The most prominent feature of flax yellow leaf disease is the yellowing of leaves, which gradually spreads from the leaf margins or local areas to the entire leaf. The growth of the plant is inhibited by the disease, with the plant height becoming shorter, the number of branches decreasing, and the growth potential weakening. As the disease worsens, it will severely damage the yield and quality of the flax. Yellow leaf disease is mainly caused by Fusarium oxysporum. Additionally, abiotic factors such as a lack of elements (such as iron, zinc, nitrogen, etc.), soil compaction, poor drainage leading to root hypoxia and rot, or damage from pesticides and fertilizers can also cause the yellowing of flax leaves.
Occurrence grades of flax yellow leaf disease:
Grade 0: No yellowing of leaves, and the plant grows healthily.
Grade 1: A small number of lower leaves turn yellow, with the proportion of yellow leaves being less than 10%. The plant growth is basically normal.
Grade 2: The lower and some middle leaves turn yellow, with the proportion of yellow leaves ranging from 11% to 30%. The plant height is 10–20% shorter, and the number of branches slightly decreases.
Grade 3: The middle leaves and most of the lower leaves turn yellow, with the proportion of yellow leaves ranging from 31% to 50%. The plant height is 21–40% shorter, the number of branches decreases by 20–30%, and some plants show mild wilting.
Grade 4: Most of the leaves turn yellow, with the proportion of yellow leaves being greater than 51%. The plant height is more than 41% shorter, the number of branches decreases by more than 31%, and many plants show obvious wilting or some die.
(b) Wilt disease: This disease can occur from the seedling stage to the adult plant stage. When seedlings are infected, the young stems wilt and fall over, and the leaves turn yellow and wither. When the stem is infected, it becomes gray-brown or brown, shrinks and constricts inward, rots at the base, wilts, and finally falls over and dies. The roots turn gray-brown and sometimes become constricted. In adult plants, the diseased plants are short and yellowed, wilt from the top down, and the roots are damaged and turn brown. When the diseased stem is cut open, the vascular bundles are seen to be brown. In severe cases, the whole plant wilts and dies.
Occurrence grades of flax wilt disease:
Grade 0: The plant shows no symptoms, grows normally, and there are no abnormalities in the leaves, stems, and roots.
Grade 1: A few (1–2) lower leaves turn slightly yellow without wilting. The plant grows basically normally. The base of the stem slightly changes color, and a small number of fine roots necrotize. The yield loss is within 5%.
Grade 2: Of the lower leaves, 10–25% turn yellow and show mild wilting. There are light brown lesions at the base of the stem, and some lateral roots necrotize. The growth of the plant is inhibited, and the yield loss is 5–15%.
Grade 3: One-third to one-half of the leaves turn yellow and wilt, and some wither. Dark brown lesions at the base of the stem encircle about half of it. Many lateral roots and some main roots necrotize. The growth is obviously hindered, and the yield loss is 15–35%.
Grade 4: More than half of the leaves turn yellow and wilt, and a large number wither. The lesions at the base of the stem nearly encircle it. The vascular bundles turn brown, most of the roots necrotize, the growth stops, and the yield loss is over 35%, or even a total crop failure.
(c) Cotton bollworm: The cotton bollworm is a distinctive pest. It has a body length of 30–42 mm. Its head is yellow and covered with brown reticular patterns. There are 12 tubercles on its body segments, with long bristles. The crochets of its abdominal feet are arranged in a double-row median band. Its body color is variable, including light green, green, yellow-white, light red, etc., and can change according to the environment of the host plant, serving as an excellent camouflage. Among them, all the specimens in Figure 1 are in the larval stage of the cotton bollworm. After verifying the dataset of this study, the ratio of yellow to green cotton bollworms is 4:6.
(d) Colasposoma dauricum: The adult Colasposoma dauricum is approximately 6 mm in length and about 3 mm in width, with an oval-shaped body. Its antennae are filiform, slightly longer than half of its body length. The end segments are thicker and slightly flattened, and its compound eyes are prominently protruding.
All the images underwent meticulous manual annotation using professional image annotation tools (such as LabelImg), with accurate bounding boxes and category information being labeled for the pest and disease regions, and were saved in YOLO-formatted .txt files.
2.2. Data Augmentation
In the task of sesame pest and disease detection, high-quality image data serve as the foundation for building an efficient model. However, image data collected in practice are often affected by various factors such as lighting conditions, weather, and shooting angles, resulting in an inconsistent image quality [27]. Additionally, the diversity of pest and disease types and the limited number of samples further exacerbate the imbalance in the dataset, making model training more challenging. To address these issues, this paper introduces the Albumentations library for data augmentation, aiming to improve the diversity and robustness of the dataset and thereby enhance the model’s generalization ability [28].
Albumentations is an efficient image processing library specifically designed for data augmentation [29]. It offers a rich set of image transformation functions, with each function equipped with multiple practical parameters. For example, in the random fog transformation, the “fog_coef_lower” parameter is set to 0.1 and the “fog_coef_upper” parameter is set to 0.5. These parameters are used to control the concentration range of the fog, enabling the addition of fog at different positions in the image and blurring the background. By adjusting these two parameters, one can precisely simulate the image effects in different levels of hazy weather. In the rain transformation, the “rain_type” parameter is used to specify the type of rain. Setting it to “drizzle” can simulate a light rain, while setting it to “heavy” can simulate a downpour. At the same time, setting the “rain_amount” parameter to a value between 0.3 and 0.8 can adjust the amount of rainfall, thus simulating various rainy-day images. This enhances the adaptability of the dataset to rainy-day environments and improves the model’s detection accuracy in rainy conditions. Additionally, the random sunlight transformation utilizes the “sun_flare_brightness” parameter in combination with natural light and light-adjustment techniques. Setting this parameter to a value between 1.5 and 3.0 can set the brightness of the sun flare, thereby simulating images with random sun flares and enriching the diversity of the dataset. These elaborate image transformations provide the model with more comprehensive and realistic training samples, significantly enhancing its recognition ability in complex environments [30]. These transformation functions can be flexibly combined to meet complex and diverse augmentation requirements. Additionally, Albumentations supports online data augmentation, which augments data in real-time during the model training process. The augmented dataset contains a total of 8772 images. In terms of dataset partitioning, the augmented dataset is divided into training, validation, and test sets at a ratio of 8:1:1 to facilitate the validation of model performance during training and the assessment of its generalization ability on new data after training. A 3-fold cross-validation approach is also adopted [31]. The images before and after enhancement are shown in Figure 2.
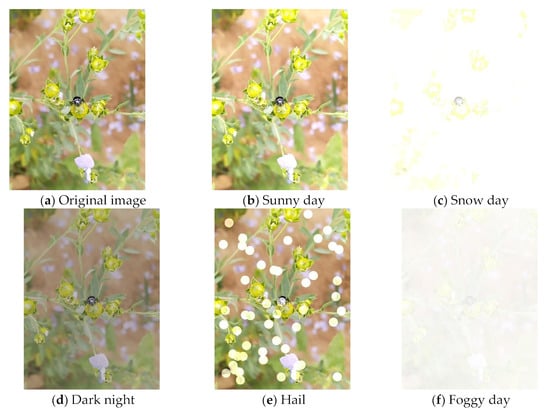
Figure 2.
Original images of flax diseases and pests and the effect images enhanced by Albumentations.
2.3. Improved YOLOv8 Netwoek
2.3.1. YOLOv8 Object Detection Model
YOLOv8 is the latest version of the YOLO (You Only Look Once) object detection model released by Ultralytics. This version offers models of various scales, ranging from Nano to Extra Large, to cater to different hardware and application requirements while maintaining high performance [32]. To enhance detection accuracy and adaptability to targets of different shapes and sizes, YOLOv8 introduces anchor-free detection heads, new loss functions, attention mechanisms (such as ECA and GAM), and deformable and dynamic convolution techniques. Meanwhile, it emphasizes lightweight design by integrating lightweight backbone networks and optimized detection heads, making the model lighter and more capable of learning, which is particularly suitable for resource-constrained devices, especially for real-time applications on edge devices [33]. Additionally, YOLOv8 innovates the backbone network by upgrading the C3 module to the C2f module, adjusting the parameters of the first convolutional layer, and adopting SPPF technology to improve SPP, reducing the computational complexity while maintaining excellent detection performance. Therefore, YOLOv8 has broad application prospects in various fields such as crop growth monitoring and smart agriculture. It is a deep learning, real-time object detection algorithm designed for efficiency, accuracy, and the ease of use [34].
During the feature fusion stage, YOLOv8’s neck network adopts an advanced PANet (Path Aggregation Network) structure, which integrates multi-level features through top-down path aggregation to enhance the ability to understand complex scenes. At the prediction layer, YOLOv8 introduces CIOU Loss and DFL (Distribution Focal Loss). DFL models the target bounding box position as a general distribution, guiding the network to focus on the target area. Through cross-entropy optimization and linear interpolation processing, it achieves high-precision target position prediction.
YOLOv8 leverages data augmentation techniques to enhance model robustness and supports training on multiple datasets, simplifying deployment. Experiments have demonstrated its excellent performance on standard datasets. As an open-source project, YOLOv8 enjoys widespread support from the community and can be customized and extended. In complex scenarios such as sesame pest and disease detection, the original YOLOv8n model has a relatively small number of network parameters and a low computational cost. Therefore, the object of this study is the lightweight and highly adaptable YOLOv8n model. The specific experiments are presented in Section 3, specifically Section 3.3. The improved YOLOv8n network structure from this study is shown in Figure 3.
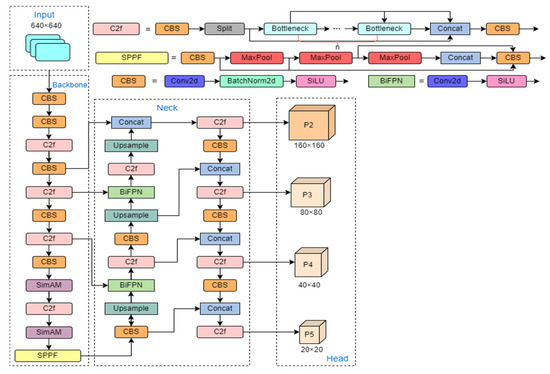
Figure 3.
Network structure diagram of the improved Yolov8 model.
2.3.2. SimAM Attention Mechanism
In the task of sesame pest and disease detection, certain pest and disease feature information occupies a relatively small proportion of the image, with a large amount of irrelevant feature information. Additionally, adjacent pixels in the image exhibit strong similarity, while the similarity between distant pixels is weak. Therefore, this paper introduces SimAM into the backbone of YOLOv8n to better refine features, enhance the network’s ability to extract global features, and remove background redundant information, thereby reducing the interference of sesame-texture-unrelated complex backgrounds on pest and disease detection. As a parameter-free, three-dimensional attention mechanism, SimAM can infer three-dimensional attention weights for intra-layer feature maps without increasing network parameters, thus improving model performance [35].
SimAM defines an energy function to measure the linear separability between the current neuron and other neurons, thereby obtaining the weight of each neuron. The calculation of the energy function is shown in Equation (1):
where represents the energy value of the target neuron t, denotes the variance of all neurons on the same channel, is a regularization coefficient, indicates the output value of the target neuron, and represents the mean value of all neurons on the same channel.
The calculations of the mean and variance are shown in Equations (2) and (3), respectively:
where represents the number of neurons on the channel, and represents all the neurons on the channel corresponding to the target neuron.
To avoid affecting the relative importance of each neuron, neurons with excessively large energy values are suppressed using the Sigmoid function. The application of the Sigmoid function is shown in Equation (4):
In this context, represents the result after applying weighted processing to the input features, sigmoid denotes the Sigmoid activation function, represents the sum of all across channel and spatial dimensions, and denotes the input feature map.
2.3.3. Weighted Bidirectional Feature Pyramid Network
In the detection of flax pests and diseases, due to the significant scale differences among targets such as pests, flax plants, and leaves in images, the model must possess robust multi-scale feature fusion capabilities. YOLOv8n incorporates the PANet (Path Aggregation Network) structure in its neck section. By introducing bottom-up feature fusion paths alongside top-down feature fusion, PANet effectively reduces information loss during transmission, thereby enhancing the model’s ability to detect multi-scale targets. Furthermore, through bidirectional fusion, low-level detailed information and high-level semantic information can be more effectively combined, which is crucial for improving the model’s detection accuracy and stability. However, while the PANet structure enhances the target detection performance, its information aggregation method is limited, and the computational efficiency needs to be improved. Additionally, there is still room for optimization in detecting small targets and those in complex backgrounds.
In order to overcome the limitations of the PANet structure, this study introduces the BiFPN structure to improve the neck part of the original YOLOv8n model. The BiFPN structure constructs a more flexible and efficient feature fusion framework. Feature stacking is carried out in channels. It is similar to integrating feature information from different perspectives in the same dimension, enabling the convergence of features such as pest and disease textures, plant morphologies, and leaf veins contained in each channel, thus enhancing the richness of features. During the feature fusion process, weight information is taken into account. That is, through a carefully designed weight-allocation strategy, according to the criticality of feature maps for flax pest and disease detection, feature maps in areas with obvious pest and disease features are assigned higher weights, while those in background areas have relatively lower weights. This highlights the information of great value for detection, enabling the model to focus on key features and improving the detection accuracy. Moreover, two-way, cross-scale feature fusion is achieved. The two-way cross-scale characteristic breaks the limitation of traditional feature fusion, which only occurs between adjacent scales [36]. For example, when processing feature maps with dual-input paths, if these feature maps have the same size, an additional path is introduced from the features of the backbone network to achieve fusion with the feature maps in the PAN (Feature Pyramid Network) [37]. This fusion process is shown in Figure 4. This fusion method allows leap-frogging information interactions between feature maps of different scales. For instance, the information of tiny pest and disease targets in low-level detailed feature maps can be quickly integrated with the information about the overall morphology of pests and diseases in high-level semantic feature maps. This enables the model to understand both local details and overall concepts simultaneously, greatly improving the model’s recognition sensitivity and accuracy for pest and disease targets of different scales in flax images. It effectively solves the problem of difficult multi-scale target detection in flax pest and disease detection, providing strong technical support for accurate pest and disease monitoring and control.
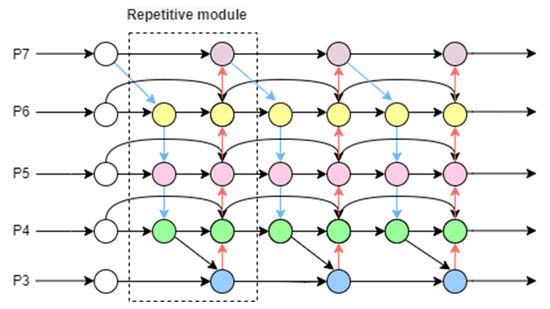
Figure 4.
Bidirectional Feature Pyramid Network (BiFPN) structure.
In the specific implementation, for each feature level, BiFPN performs upsampling, downsampling, and feature fusion to obtain enhanced feature maps. Assuming the input feature map is , and the output feature map after processing by the BiFPN module is , it can be expressed as in Equation (5):
where represents the upsampling operation, represents the weights of the cross-layer connections, is the maximum number of cross-layer connections in the BiFPN module, and represents the weight for feature enhancement.
2.3.4. EIOU Loss Function
In YOLOv8n, CIOU is used as the loss function for a wide range of object detection tasks, aiming to accelerate convergence and improve the localization accuracy by introducing an aspect ratio penalty term, achieving relatively good accuracy and efficiency. However, in the task of flax pest and disease detection, the CIOU loss function has the following limitations: The aspect ratio of the bounding box, used as a penalty term, is susceptible to changes in flax scale, leading to computational uncertainty and affecting model accuracy. The function fails to fully consider the shape differences between the predicted box and the ground truth box, especially the special shape features that flax may have, which may result in the poor performance of the model when detecting flax with special shapes. When dealing with complex datasets containing multiple flax samples and complex backgrounds, the model is affected by sample diversity and noise interference. Therefore, for the flax detection task, the CIOU loss function needs further optimization and improvement. This paper will analyze the shortcomings of the CIOU loss function and introduce the EIOU loss function to enhance the performance of the flax pest and disease detection model. First, EIOU conducts a more meticulous decomposition and optimization of the loss function calculation. Although CIOU takes into account the aspect ratio, in complex scenarios, such as the irregular deformation of flax leaves caused by pests and diseases, its effect on bounding box regression constraints is not satisfactory. EIOU divides the loss function into overlap loss, center-distance loss, and aspect-ratio loss, calculating and optimizing them separately. This facilitates the precise adjustment of each dimension of the bounding box during training. Secondly, influenced by factors such as shooting angles and plant growth postures, the aspect ratio of targets in flax pest and disease images varies widely. The aspect-ratio loss calculation method of CIOU is insufficiently adaptable to this situation. By introducing a new aspect-ratio penalty term, EIOU can better adapt to the diversity of target aspect ratios, reduce detection errors caused by inaccurate aspect ratios, and improve the positioning accuracy of pest and disease targets. The calculation process of EIOU is shown in Equation (6):
where and represent the width and height of the smallest enclosing bounding box that covers both the predicted box and the ground truth box, respectively.
The model using the EIOU loss function to replace the original CIOU loss function achieved a better performance in the flax pest and disease detection task, with a higher detection accuracy and faster convergence speed [38]. This provides powerful technical support for the precise detection and prevention of flax pests and diseases.
A schematic diagram of the EIOU loss is shown in Figure 5.
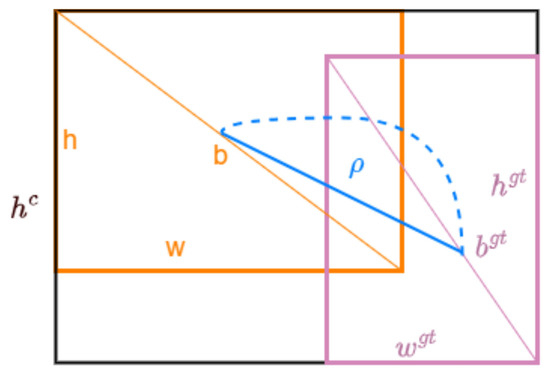
Figure 5.
Enhanced Intersection over Union Loss (EIOU) diagram.
In the diagram, the center point b represents the position of the predicted bounding box, while the center point bgt represents the position of the ground truth bounding box. ρ denotes the Euclidean distance between the center of the predicted bounding box and the center of the ground truth bounding box. The width and height of the predicted bounding box are denoted by w and h, respectively, while the width and height of the ground truth bounding box are denoted by wgt and hgt. Additionally, wc and hc refer to the width and height of the smallest enclosing rectangle that covers both the predicted bounding box and the ground truth bounding box.
2.3.5. Four Detection Heads
In the task of detecting pests and diseases on flax leaves, the diversity of pest and disease features and the difference in target scales significantly increase the difficulty of detection. For small targets especially, such as minute lesions and insect eggs on leaves, as their sizes often are smaller than 8 × 8 pixels they are prone to being lost during the downsampling process, resulting in a significant decrease in detection accuracy. Although the existing YOLOv8n model features a three-detection-head design, its smallest detection head corresponds to a feature map size of 80 × 80 × 256, primarily used for detecting small targets of 8 × 8 pixels and above, but it lacks sufficient capability for even-smaller targets. Based on these pain points, this paper proposes a four-detection-head design to enhance the detection capability for tiny pest and disease targets [39].
This study introduces a new detection head for detecting small targets, with an output feature map of 160 × 160 × 128. By extracting and upsampling the features of the P2 layer in the YOLOv8n backbone network, shallow and deep information is fused to achieve the precise representation of small targets. Specifically, the P2 layer feature map (160 × 160 × 128) is extracted from the backbone network and combined with the upsampled 160 × 160 × 256 feature map through channel concatenation to form a 160 × 160 × 384 feature map. After processing through the C2f module, the final 160 × 160 × 128 feature map is generated, significantly enhancing the feature representation capability for small targets. Subsequently, this feature map is connected to the FPN, together with the P3, P4, and P5 layers, to constitute a four-detection-head network, successfully achieving the effective detection of targets of 4 × 4 pixels and above. In the flax leaf pest and disease dataset, the analysis revealed that small targets (such as insect eggs and early lesions) with sizes smaller than 8 × 8 pixels account for approximately 5.6%. These targets are prone to being lost in the traditional three-detection-head design, resulting in an insufficient detection capability. The newly added tiny target detection head significantly improves the detection capability for targets ranging from 4 × 4 to 8 × 8 pixels by reducing the number of downsampling operations, directly extracting features at the P2 layer, and connecting them to BiFPN, while maintaining a high computational efficiency. Given that although small targets in the flax leaf pest and disease dataset account for a small proportion their detection is of great significance, the four-detection-head design effectively addresses the insufficient detection capability of traditional designs for small targets, providing reliable support for precise pest and disease management.
3. Results
3.1. Experimental Environment and Configuration
This study employs a high-performance computing platform configured with an RTX 4090 GPU (24 GB VRAM), an Intel Xeon Platinum 8352V CPU (12 vCPUs, 2.10 GHz), and 90 GB of RAM. The deep learning framework used is Python 3.9 and PyTorch 1.8.1, accelerated by CUDA. Models are trained on the dataset with a learning rate of 0.01, a batch size of 64, 300 training epochs, and the Adam optimizer selected.
3.2. Evaluation Metrics
In the task of sesame pest and disease detection, accurately assessing model performance is crucial for enhancing disease identification and control efficiency. This paper adopts a series of precise evaluation metrics to measure the performance of different detection models, including precision, recall, average precision (AP), and its mean value (mean average precision, mAP). These metrics provide a comprehensive and objective evaluation of the model’s performance in identifying sesame pests and diseases.
To comprehensively evaluate model performance in sesame pest and disease detection tasks, we utilize several key evaluation metrics. These include true positives (), which represent the number of cases where the model’s predictions match the true positive samples; false positives (), which indicate the number of cases where the model incorrectly identifies the disease category; False Negatives (FN), which represent the number of disease types missed by the model; and True Negatives (TN), which, although not directly used in this paper, aid in understanding other metrics. Based on these, this study defines two core metrics: precision and recall. Precision indicates the proportion of positive predictions that are correct, measuring the accuracy of the model’s positive predictions, calculated as shown in Equation (7):
Recall, on the other hand, represents the ratio of correctly predicted positive samples to all the actual positive samples. It reflects the model’s ability to identify all true disease instances, calculated as shown in Equation (8):
The two metrics are average precision (AP) and mean average precision (mAP). AP measures the model’s performance by calculating the integral value of precision as recall varies from 0 to 1, essentially the area under the precision–recall (P-R) curve. In practical applications, since the P-R curve is discrete, AP is typically calculated using interpolation methods. mAP, on the other hand, averages the AP values across all the categories to evaluate the overall performance in multi-class object detection, where represents the number of object classes that the model can detect, and denotes the average precision for the -th class. The calculation is as shown in Equation (9):
3.3. Comparison of YOLOv8 Baseline Models
In the research on sesame pest and disease detection, the baseline model of YOLOv8 refers to the original YOLOv8 model architecture without specific improvements or optimizations. Among them, YOLOv8n is lightweight, fast but with a relatively low accuracy, and suitable for scenarios where resources are limited and high real-time performance is required. YOLOv8s balances accuracy and speed, making it suitable for conventional detection. YOLOv8m has a moderate scale and complexity, with a higher accuracy than YOLOv8s but a slightly slower speed, suitable for scenarios with certain accuracy requirements. The YOLOv8l model is large, with a high accuracy but a slow speed, used in scenarios where high accuracy is required but real-time performance is not highly demanded. YOLOv8x is the largest, with the highest accuracy and the slowest speed, for scenarios with extremely high accuracy requirements. In the research on flax pest and disease detection, to determine which version of the YOLOv8 model is more suitable for the sesame pest and disease dataset, this study conducted comprehensive testing on these five models.
The test results are shown in Table 1. The analysis revealed that for the sesame pest and disease dataset, a higher number of model parameters and complexity do not necessarily lead to a better detection performance. Instead, as model complexity increases, the computation time also rises significantly [40]. After considering factors such as detection accuracy, parameter count, and computational cost, although YOLOv8 exhibited the best detection accuracy, its parameter count was approximately 40 M higher than other versions, resulting in excessively high computational costs. Therefore, we ultimately selected YOLOv8n as the baseline model for sesame pest and disease detection in this study.

Table 1.
Comparison of YOLOv8 baseline models: Yolov8n, Yolov8s, Yolov8m, Yolov8l, and Yolov8x.
3.4. Comparison of Mainstream Model Performance
In sesame pest and disease detection, we compared models like Faster R-CNN, SSD, YOLOv5, YOLOv8n, and an improved YOLOv8n (Table 2). Due to subtle features and complex backgrounds, high performance is required. Faster R-CNN consists of an RPN (Region Proposal Network) and Fast R-CNN. It first extracts features, then the RPN generates candidate regions, which are further processed by the Fast R-CNN. It has a high accuracy and is used for high-precision detection, but its speed is slow. SSD (Single Shot MultiBox Detector) is based on a convolutional network. It uses multi-scale feature maps and default boxes for detection, balancing its speed and accuracy. It is suitable for scenarios with real-time requirements, yet it has limitations in handling specific targets. YOLOv5 has components such as the input end. It divides the grid for training and outputs the category and location. It is fast, has good accuracy, is widely applied, and is flexible. YOLOv8n is a lightweight version of YOLOv8. It makes predictions based on grid-division and is suitable for resource-constrained devices and simple scenarios, but its accuracy is inferior to that of larger models. Addressing these issues, we improved YOLOv8n by introducing the SimAM attention mechanism and incorporating the BiFPN module into the neck network. The improved model significantly increased its accuracy in sesame pest and disease detection while maintaining fast detection speeds and a relatively small model size. When dealing with complex backgrounds and subtle features, the improved YOLOv8n demonstrated stronger robustness and generalization capabilities [41].
Table 2.
Comparison of mainstream models: Faster R-CNN, SSD, YOLOv5, YOLOv8n, and Improved YOLOv8n.
Therefore, the improved YOLOv8n model has better application prospects and practical value in sesame pest and disease detection, providing a useful reference for similar object detection tasks in complex backgrounds.
3.5. Analysis and Comparison of Different Attention Mechanisms
To investigate the specific impact of attention mechanisms on model detection performance, this study conducted a horizontal comparative analysis, including four attention mechanisms: SA, CBAM, ECA, and SimAM. SA is the spatial attention mechanism. It focuses on weighting the spatial location information of an image, helping to capture the location and distribution features of the target [42]. CBAM integrates channel and spatial attention. It weights the channels first and then the spatial dimensions, comprehensively exploring features to improve detection accuracy [43]. ECA is the Efficient Channel Attention mechanism. It efficiently calculates channel dependencies, highlights the features of key channels, and controls the computational cost [44]. SimAM is a simple parameter-free module. It automatically learns the weights of neurons, precisely focusing on feature information to facilitate detection [45]. In the experimental setup, all the attention mechanisms were added onto the BackBone module. The experimental results are detailed in Table 3.
Table 3.
Comparison of different attention mechanisms: SA, CBAM, ECA, and SimAM.
In the sesame pest and disease detection task, this study evaluated the impact of four attention mechanisms (SA, CBAM, ECA, and SimAM) on model performance. The introduction of these mechanisms did not significantly increase the model parameters, remaining within the range of 3.01 M to 3.21 M. In terms of mechanism characteristics, while the SA mechanism can enhance the modeling of inter-channel relationships, it performed moderately in this task; CBAM combines channel and spatial attention, achieving good precision and recall rates, but its mean average precision at 0.5 IoU (mAP@0.5) is slightly lower than that of SimAM; ECA captures inter-channel relationships through one-dimensional convolution, but the performance improvement is limited; SimAM, with its concise design, effectively captures both channel and spatial information, demonstrating optimal performance. It not only leads in precision and recall rates but also achieves an mAP value of 93.3%, significantly higher than the baseline model and other mechanisms. Therefore, SimAM is an effective attention mechanism choice for sesame pest and disease detection tasks.
3.6. Ablation Experiments
To assess the specific impact of the SimAM module, BiFPN module, and EIoU loss function on the performance of the YOLOv8n model, a series of ablation experiments were conducted. The baseline model employed the original YOLOv8n, with its performance serving as a comparison benchmark. The experimental results are shown in Table 4.
Table 4.
Results of ablation experiments.
For pest and disease detection, the addition of the SimAM attention mechanism enhances the model’s ability to recognize small insects and focus on leaf lesions. As a result, the precision of the model increases by 1.1%. The BiFPN module optimizes the fusion of lesion features at different scales, improving the accurate identification of pests of different sizes, and the precision of the model is increased by 2.9%. The EIoU loss function improves the accuracy of lesion location and the precision of pest location, enhancing the universality and accuracy of identification, and the recall of the model increases by 1.6%. The introduction of the four-detection-head structure further improves the overall performance of the model, especially when detecting multiple diseases and pests; by increasing the number of detection heads, the model can more effectively capture and distinguish different targets, and the recall of the model is increased by 1.7%. The results of these ablation experiments fully verify the effectiveness of each module in improving the performance of the YOLOv8n model for flax pest and disease detection. When these four modules are integrated, the model reaches the highest value in various performance indicators. Compared with the original model, the accuracy (P%) of the model is increased by 2.0%, the recall (R%) is increased by 2.7%, and the mean average precision (mAP%) is increased by 2.1%. This further demonstrates the synergistic effect of these modules in improving the performance of the model for flax pest and disease detection. This not only improves the detection efficiency but also optimizes the implementation of prevention and control measures, which is a great benefit to agricultural producers and helps to reduce the losses caused by pests and diseases.
3.7. Analysis and Comparison of Yolov8n Models with Different Improvement Methods
To evaluate the performance of the improved YOLOv8n, the model improved in this study was compared with several related studies that used methods similar to those in this research. Here, t/s represents the testing time, with the unit being seconds.
Table 5 shows the performance comparison of Yolov8n models with different improvement methods in these related studies across various indicators. Compared with Model 1, the accuracy of the model in this study increased by 1.2%, which benefits from the optimization of bounding box regression and feature selection after improving the EIOU loss function. Compared with Model 2, the recall rate of the model in this study is 0.5% higher, demonstrating the advantages of adding the four-detection-head structure and the SimAM attention mechanism in target capture. Compared with Model 3, the mAP@0.5 of the model in this study is 0.6% higher, indicating a stronger overall detection performance. In summary, the model in this study performs outstandingly in all indicators. The various improvement points cooperate with each other, not only effectively improving the detection accuracy, but also performing well in terms of running time control. Compared with other Yolov8n models with different improvement methods, it has more advantages in the detection of flax diseases and pests.
Table 5.
Performance comparison of Yolov8n models with different improvement methods.
Figure 6 compares the loss values during training between the original YOLOv8n model and the improved model. The original model converged slowly and exhibited fluctuations in the later stages, while the improved model converged quickly, had lower losses, and displayed a smooth curve, indicating overall superior performance without overfitting or underfitting. This suggests improvements in performance indicators such as detection accuracy. The linear regression chart compares the performance of the YOLOv8n model and its improved version during training. The horizontal axis represents the number of iterations, and the vertical axis represents the Perplexity value (lower is better). Initially, both had high Perplexity values, but as the iterations increased, the improved YOLOv8n quickly converged to a lower Perplexity value, demonstrating a superior performance.
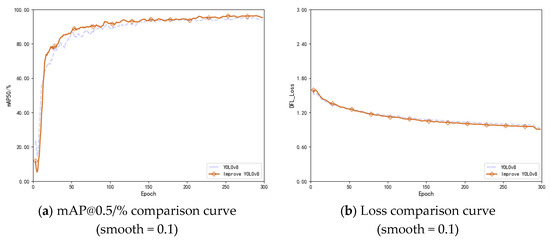
Figure 6.
Comparison curves of loss values and the mAP@0.5/% of the YOLOv8n model before and after improvement.
3.8. Visualization Analysis
After a series of experimental validations, the improved BiFPN module, optimized SimAM attention mechanism, and EIOU loss function integrated into the YOLOv8n model significantly enhanced the accuracy and efficiency of sesame disease and pest detection. The following section will provide a detailed demonstration of the effects of these improvements in practical applications through a visualization analysis.
A heatmap is a type of chart that presents data information in an intuitive and visual way. It uses variations in color intensity to map the magnitude or density distribution of data values. Regarding the use of colors in heatmaps, there are several common color-coding schemes. For example, the rainbow color scheme gradually transitions from cool colors (such as blue) to warm colors (such as red). The blue end represents lower data values or sparse data distribution areas. As the color transitions towards red, the data values gradually increase, or the data distribution becomes denser [46]. Another example is the red-green color scheme, where red is used to mark higher data values or dense distribution areas, and green corresponds to lower data values or sparse areas. Based on the red-green scheme, sometimes yellow is added as a transition, forming the red-yellow-green (RYG) color scheme. Yellow is between red and green, further refining the levels of data values or distribution densities. Through these different color-mapping mechanisms, users can quickly identify patterns, trends, and outliers in the data without having to analyze each value one by one, thus rapidly obtaining key information from large amounts of data. The heatmap in this study uses the rainbow color scheme. Figure 7 shows a comparison of the heatmaps of different models on flax leaves. The original YOLOv8n model exhibits dispersed attention and is susceptible to interference from background noise. In contrast, the improved YOLOv8n model demonstrates increased attention, better focusing on disease and pest features with reduced false attention. Consequently, the model’s localization is more precise, and its ability to recognize multi-scale disease and pest symptoms is enhanced. Furthermore, this study employed the EIOU loss function to optimize training, improving the convergence speed and the detection accuracy. The figures show that the improved model provides more accurate recognition, increased sensitivity to tiny diseases and pests, and stronger robustness, effectively addressing the issue of misdetections in complex backgrounds.
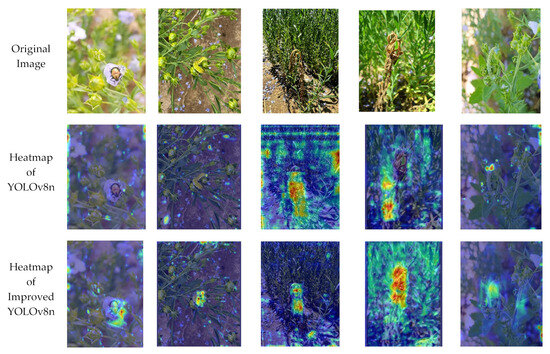
Figure 7.
Comparison of the heat maps of the YOLOv8n model before and after the improvement.
Figure 8 showcases a comparison of the performance between the original YOLOv8n model and the improved model in sesame disease and pest detection. The recognition results of the first and second groups of images in the vertical direction show that the original model has false detections of flax pests and diseases, while the improved model with the SimAM attention mechanism is more accurate in detection. Comparing the third and fourth groups of images, the original model has missed detections and misdetections. After adding the BiFPN feature fusion mechanism and the EIOU loss function, the improved model has a higher accuracy in identifying pests and diseases under complex backgrounds. Observing the last group of images, the original model has inaccurate detections and false detections for small- and medium-sized targets. The improved model with four detection heads is more sensitive to the detection of small- and medium-sized targets, effectively improving the overall detection effect. In summary, the improved model exhibits a superior performance in sesame disease and pest detection.
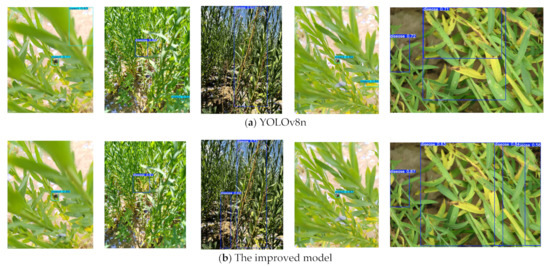
Figure 8.
Comparison charts of the detection effects of flax diseases and pests by the YOLOv8n model before and after improvement.
3.9. Analysis of Significant Differences
In the research on flax pest and disease detection, to determine whether there are significant differences in the impact of the improved YOLOv8n model on the detection results of flax diseases and pests, the Paired t-test was adopted. For the data collected from flax pest and disease experiments, the null hypothesis of the Paired t-test is that there is no difference in the recognition results of the two methods. If N represents the number of tests,
(i = 1,2, …, ) is the recognition accuracy of the basic model at different iteration times, is the recognition accuracy of the improved model at different iteration times, and = − , then the t-statistic is calculated as in Equation (10):
In this study, the t-statistics calculated for flax diseases and pests are tdisease = 6.2108 and tpest = 5.6813, respectively. When N =12 and the significance level α = 0.05, the critical value is 2.2011. For both flax diseases and pests, since their t-statistics, 6.2108 and 5.6813, are both greater than the critical value of 2.2011, the null hypothesis is rejected. This indicates that in the detection of flax pests and diseases, there is a significant difference between the improved model and the basic model. That is, the improved model can significantly enhance the detection effect of flax pests and diseases.
3.10. Design of Sesame Disease and Pest Detection System
Pyqt5 is a GUI (Graphical User Interface) programming framework for the Python language. Developed based on the Qt library, it combines the powerful functions of Qt with the simplicity and the ease-of-use of Python. With Pyqt5, developers can easily create various interactive application interfaces. It has a rich component library, enabling the effortless construction of interface elements such as buttons, text boxes, and image display areas. Moreover, it supports the signal-and-slot mechanism, which can efficiently handle user interaction events [47]. This study has designed a system based on PyQt5 for the real-time detection of sesame diseases and pests. The system interface is shown in Figure 9. This system has several important functions. Firstly, it allows users to select a pre-trained pest and disease identification model, providing a precise technical foundation for subsequent detection work. Secondly, once the user loads an image into the system and clicks the detection button, the system can quickly and accurately display the captured images of pests and diseases with their positions located. At the same time, it will also present the number of detected targets and the number of frames that can be processed per second. These data are of great significance for evaluating the detection efficiency and effectiveness. Additionally, the system supports the use of a camera for real-time sesame disease and pest detection.
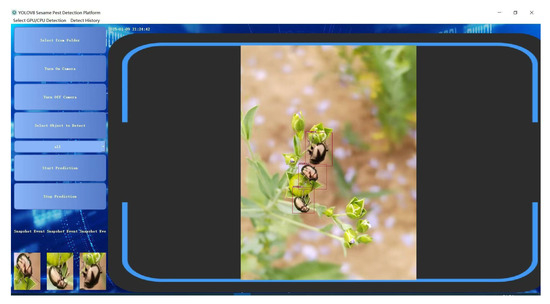
Figure 9.
Interactive interface of the flax disease and pest detection system.
4. Discussion
In this study, the YOLOv8n model was improved by integrating SimAM and BiFPN feature fusion. In the detection of small-target diseases and pests of flax, the accuracy rate reached 92.1%, the recall rate was 91.6%, and the mAP was 94.5%, which was significantly superior to the mainstream comparative models. This model enhanced its competitiveness through the introduction of the SimAM attention mechanism, BiFPN feature fusion, the EIOU loss function, and a four-detection-head structure, providing strong support for the prevention and control of flax diseases and pests.
However, this study has certain limitations. Although it has achieved good results on the current dataset of flax diseases and pests that covers different environmental and weather conditions, the complexity and diversity of the natural environment far exceed this. In practical applications, the robustness and adaptability of the model in rare scenarios such as extreme weather and special geographical environments remain to be verified. In addition, although the model has excellent accuracy, there is still room for optimization in terms of operational efficiency on devices with limited computing resources. For example, in a real-time detection system, the performance may decline as the detection tasks continue and the data volume increases.
Compared with previous relevant research, most of the previous flax disease and pest detection focused on large targets or the overall situation, and there was a lack of research on the identification of small targets in the natural environment. This study fills this gap and provides new technical ideas. In the future, it is necessary to evaluate data augmentation strategies using diverse datasets to improve the adaptability of the model. We may also explore model compression and lightweight technologies to improve the real-time processing capabilities of devices. It is also possible to combine technologies, such as UAV remote sensing, to build a comprehensive monitoring system and promote the development of precision agriculture.
5. Conclusions
This paper addresses the issue of sesame disease and pest detection by proposing a detection model based on an improved YOLOv8n model. Through the optimization and innovation of the traditional YOLOv8n network model, a dataset of flax pests and diseases considering different environmental conditions and weather conditions was established. The precise detection of sesame diseases and pests in complex environments and at different scales was achieved. The following summarizes the work and conclusions of this paper:
- (1)
- For the task of detecting flax pests and diseases, this study has made improvements to the YOLOv8n model in multiple aspects. An improved BiFPN module was introduced in the feature fusion layer, effectively resolving the interference problem in multi-scale target detection. The SimAM attention mechanism was introduced, enhancing the model’s ability to extract features of flax pests and diseases, enabling it to adaptively focus on important features and suppress irrelevant information. The EIOU loss function was adopted to replace CIOU, optimizing the bounding box regression effect and improving the accuracy of prediction boxes. A four-detection-head structure was designed, improving the detection effect and speed for different types of flax pests and diseases. The accuracy, recall rate, and mAP of the improved model are 92.1%, 91.6%, and 94.5% respectively, enabling the precise identification of flax pests and diseases.
- (2)
- When comparing the improved YOLOv8n model with mainstream models such as Faster R-CNN, SSD, YOLOv5, and the original YOLOv8n, our model performs better in terms of its accuracy, recall rate, and mAP. This indicates that the improvement measures proposed in this study have significantly enhanced the competitiveness of the model in the field of flax pest and disease detection. It can more effectively cope with complex flax pest and disease detection scenarios, providing more reliable technical support for pest and disease monitoring and prevention in the flax-growing industry.
- (3)
- A real-time detection system for flax pests and diseases was designed and developed based on Pyqt5. This system integrates the improved YOLOv8n model and can achieve the rapid and convenient detection of flax pests and diseases. The development of this system further expands the application scenarios of the model, helping flax growers to promptly detect and address pest and disease problems, reducing the impact of pests and diseases on the yield and quality of the flax.
The improved YOLOv8n model exhibits good application prospects in sesame disease and pest detection. By deploying this model on mobile or embedded devices, farmers can monitor and identify sesame diseases and pests in real-time, enabling timely and effective prevention and control measures, thereby improving agricultural production efficiency and stability. In future research, we will further optimize the model structure. With the vigorous development of edge computing technology, we will fully leverage its advantages by migrating some computing tasks from the cloud to edge devices closer to the data source or users, such as edge servers or smart gateways set up in the fields. This enables the YOLOv8n model to operate more efficiently on these devices, reducing data transmission latency and further enhancing the timeliness and accuracy of real-time monitoring. Additionally, we will train and test the model on sesame disease and pest datasets from different regions to verify its universality and applicability. Furthermore, we will also explore the combination of the model with the emerging hyperspectral imaging technology for the pest and disease detection of other crops. Hyperspectral imaging can capture more abundant spectral information on crops, providing a multi-dimensional data input for the model. Thus, it offers more powerful technical support for the intelligent and precise management of agriculture.
Author Contributions
Conceptualization, M.Z. and Y.L.; methodology, M.Z. and Y.G.; software, Y.L.; validation, M.Z., Y.L. and Y.G.; formal analysis, Y.G.; investigation, Y.L.; resources, M.Z.; data curation, Y.G.; writing—original draft preparation, M.Z.; writing—review and editing, Y.L. and Y.G.; visualization, Y.L.; supervision, M.Z.; project administration, Y.G.; funding acquisition, Y.L. All authors have read and agreed to the published version of the manuscript.
Funding
This research was jointly funded by the National Natural Science Foundation of China (grant numbers 32460443 and 32060437) and the Gansu Provincial Science and Technology Plan-Natural Science Foundation Key Program (grant number 23JRRA1403).
Data Availability Statement
The data in the article will be provided on request.
Conflicts of Interest
The authors declare no conflicts of interest.
References
- Heller, K.; Sheng, Q.C.; Guan, F.; Alexopoulou, E.; Hua, L.S.; Wu, G.W.; Jankauskienė, Z.; Fu, W.Y. A comparative study between Europe and China in crop management of two types of flax: Linseed and fibre flax. Ind. Crops Prod. 2015, 68, 24–31. [Google Scholar] [CrossRef]
- Barzman, M.; Bàrberi, P.; Birch, A.N.E.; Boonekamp, P.; Dachbrodt-Saaydeh, S.; Graf, B.; Hommel, B.; Jensen, J.E.; Kiss, J.; Kudsk, P.; et al. Eight principles of integrated pest management. Agron. Sustain. Dev. 2015, 35, 1199–1215. [Google Scholar] [CrossRef]
- Li, W.; Zheng, T.; Yang, Z.; Li, M.; Sun, C.; Yang, X. Classification and detection of insects from field images using deep learning for smart pest management: A systematic review. Ecol. Inform. 2021, 66, 101460. [Google Scholar] [CrossRef]
- Li, C.; Wang, M. Pest and disease management in agricultural production with artificial intelligence: Innovative applications and development trends. Adv. Resour. Res. 2024, 4, 381–401. [Google Scholar]
- Shrestha, G.; Das, M.; Dey, N. Plant disease detection using CNN. In Proceedings of the 2020 IEEE Applied Signal Processing Conference (ASPCON), Kolkata, India, 7–9 October 2020; IEEE: Piscataway, NJ, USA, 2020; pp. 109–113. [Google Scholar]
- Tadele, A.B.; Olalekan, S.A.; Ayalew, A.; Gebremariam, T.E. Sesame disease detection using a deep convolutional neural network. J. Electr. Electron. Eng. 2022, 15, 5–10. [Google Scholar]
- Selvaraj, M.G.; Vergara, A.; Ruiz, H.; Safari, N.; Elayabalan, S.; Ocimati, W.; Blomme, G. AI-powered banana diseases and pest detection. Plant Methods 2019, 15, 1–11. [Google Scholar] [CrossRef]
- Liu, J.; Wang, X. Plant diseases and pests detection based on deep learning: A review. Plant Methods 2021, 17, 1–18. [Google Scholar] [CrossRef]
- Fan, X.; Xu, Y.; Zhou, J.; Li, Z.; Peng, X.; Wang, X. Detection system for grape leaf diseases based on transfer learning and updated CNN. Trans. CSAE 2021, 37, 151–159. [Google Scholar]
- He, D.; Wang, P.; Niu, T.; Mao, Y.; Zhao, Y. Classification model of grape downy mildew disease degree in field based on improved residual network. Trans. Chin. Soc. Agric. Mach. 2022, 53, 235–243. [Google Scholar]
- Türkoğlu, M.; Hanbay, D. Plant disease and pest detection using deep learning-based features. Turk. J. Electr. Eng. Comput. Sci. 2019, 27, 1636–1651. [Google Scholar] [CrossRef]
- Ma, H.; Sheng, T.; Ma, Y.; Gou, J. An Improved Ningxia Desert Herbaceous Plant Classification Algorithm Based on YOLOv8. Sensors 2024, 24, 3834. [Google Scholar] [CrossRef] [PubMed]
- Wang, Z.; Hua, Z.; Wen, Y.; Zhang, S.; Xu, X. E-YOLO: Recognition of estrus cow based on improved YOLOv8n model. Expert Syst. Appl. 2024, 238, 122212. [Google Scholar] [CrossRef]
- Li, M.; Cheng, S.; Cui, J.; Li, C.; Li, Z.; Zhou, C.; Lv, C. High-performance plant pest and disease detection based on model ensemble with inception module and cluster algorithm. Plants 2023, 12, 200. [Google Scholar] [CrossRef] [PubMed]
- Zhao, Y.; Zhao, H.; Jiang, Y.; Ren, D.; Li, Y. Potato leaf disease detection method based on deep learning. Chin. J. Agric. Mech. 2022, 43, 183–189. [Google Scholar]
- Wang, J.; Li, Y.F.H.; Wang, A. Research on Small Target Grain Storage Pest Detection Based on Improved Faster R-CNN. Chin. J. Grain Oil 2021, 36, 164–171. [Google Scholar]
- Kaur, P.; Harnal, S.; Gautam, V.; Singh, M.P.; Singh, S.P. An approach for characterization of infected area in tomato leaf disease based on deep learning and object detection technique. Eng. Appl. Artif. Intell. 2022, 115, 105210. [Google Scholar] [CrossRef]
- Xie, D.; Yao, W.; Sun, W.; Song, Z. Real-Time Identification of Strawberry Pests and Diseases Using an Improved YOLOv8 Algorithm. Symmetry 2024, 16, 1280. [Google Scholar] [CrossRef]
- Wang, X.; Gao, H.; Jia, Z.; Li, Z. BL-YOLOv8: An improved road defect detection model based on YOLOv8. Sensors 2023, 23, 8361. [Google Scholar] [CrossRef]
- Wang, J.; Zhao, H. Improved YOLOv8 Algorithm for Water Surface Object Detection. Sensors 2024, 24, 5059. [Google Scholar] [CrossRef]
- Liu, J.; Zhang, B.; Xu, H.; Zhang, L.; Zhang, X. Method for Recognizing Disordered Sugarcane Stacking Based on Improved YOLOv8n. Appl. Sci. 2024, 14, 11765. [Google Scholar] [CrossRef]
- Long, J.; Guo, W.; Lin, S.; Wen, C.; Zhang, Y.; Zhao, C. Improved identification method of strawberry growth period in greenhouse environment of YOLO v4. Smart Agric. 2021, 3, 99–110. [Google Scholar] [CrossRef]
- Wang, G.; Chen, Y.; An, P.; Hong, H.; Hu, J.; Huang, T. UAV-YOLOv8: A small-object-detection model based on improved YOLOv8 for UAV aerial photography scenarios. Sensors 2023, 23, 7190. [Google Scholar] [CrossRef]
- Guo, B.; Ling, S.; Tan, H.; Wang, S.; Wu, C.; Yang, D. Detection of the grassland weed phlomoides umbrosa using multi-source imagery and an improved YOLOv8 network. Agronomy 2023, 13, 3001. [Google Scholar] [CrossRef]
- Liu, J.; He, C.; Jiang, Y.; Wang, M.; Ye, Z.; He, M. A High-Precision Identification Method for Maize Leaf Diseases and Pests Based on LFMNet under Complex Backgrounds. Plants 2024, 13, 1827. [Google Scholar] [CrossRef]
- Abbas, A.; Zhang, Z.; Zheng, H.; Alami, M.M.; Alrefaei, A.F.; Abbas, Q.; Naqvi, S.A.H.; Rao, M.J.; Mosa, W.F.A.; Abbas, Q.; et al. Drones in plant disease assessment, efficient monitoring, and detection: A way forward to smart agriculture. Agronomy 2023, 13, 1524. [Google Scholar] [CrossRef]
- Li, R.; Yu, J.; Li, F.; Yang, R.; Wang, Y.; Peng, Z. Automatic bridge crack detection using Unmanned aerial vehicle and Faster R-CNN. Constr. Build. Mater. 2023, 362, 129659. [Google Scholar] [CrossRef]
- Yu, Z.; Wang, Y.; Ye, J.; Liufu, S.; Lu, D.; Zhu, X.; Tan, Q. Accurate and fast implementation of soybean pod counting and localization from high-resolution image. Front. Plant Sci. 2024, 13, 20109. [Google Scholar] [CrossRef]
- Buslaev, A.; Iglovikov, V.I.; Khvedchenya, E.; Parinov, A.; Druzhinin, M.; Kalinin, A.A. Albumentations: Fast and flexible image augmentations. Information 2020, 11, 125. [Google Scholar] [CrossRef]
- Peng, M.; Cui, Y.; Xue, Q.; Yin, Y.; Yi, Z.; Zhang, W.; Li, F. A weed identification and localization model for seedling crops based on weather data augmentation and fine-tuning. China Agric. Sci. Technol. Her. 2024, 26, 125–134. [Google Scholar]
- Wei, G.; He, J.; Chang, B.; Yuan, P.; Zhao, X.; Wang, L. Research on Wheat Stripe Rust Grade Recognition Based on Improved S-ResNet34 Model. J. Nanjing Agric. Univ. 2025, 48, 230–236. [Google Scholar] [CrossRef]
- Redmon, J.; Divvala, S.; Girshick, R.; Farhadi, A. You only look once: Unified, real-time object detection. In Proceedings of the 2016 IEEE Conference on Computer Vision and Pattern Recognition(CVPR), Las Vegas, NV, USA, 27–30 June 2016; IEEE: Piscataway, NJ, USA, 2016; pp. 779–788. [Google Scholar]
- Ma, B.; Hua, Z.; Wen, Y.; Deng, H.; Zhao, Y.; Pu, L.; Song, H. Using an improved lightweight YOLOv8 model for real-time detection of multi-stage apple fruit in complex orchard environments. Artif. Intell. Agric. 2024, 11, 70–82. [Google Scholar] [CrossRef]
- Hussain, M. Yolov1 to v8: Unveiling each variant–a comprehensive review of yolo. IEEE Access 2024, 12, 42816–42833. [Google Scholar] [CrossRef]
- Xu, Y.; Du, W.; Deng, L.; Zhang, Y.; Wen, W. Ship target detection in SAR images based on SimAM attention YOLOv8. IET Commun. 2024, 18, 1428–1436. [Google Scholar] [CrossRef]
- Yu, H.; Wang, J.; Han, Y.; Fan, B.; Zhang, C. Research on an intelligent identification method for wind turbine blade damage based on CBAM-BiFPN-YOLOV8. Processes 2024, 12, 205. [Google Scholar] [CrossRef]
- Doherty, J.; Gardiner, B.; Kerr, E.; Siddique, N. BiFPN-YOLO: One-stage object detection integrating Bi-Directional Feature Pyramid Networks. Pattern Recognit. 2025, 160, 111209. [Google Scholar] [CrossRef]
- Tong, Z.; Chen, Y.; Xu, Z.; Yu, R. Wise-IoU: Bounding box regression loss with dynamic focusing mechanism. arXiv 2023, arXiv:2301.10051. [Google Scholar]
- Fan, X.; Chai, X.; Zhou, J.; Sun, T. Deep learning based weed detection and target spraying robot system at seedling stage of cotton field. Comput. Electron. Agric. 2023, 214, 108317. [Google Scholar] [CrossRef]
- Li, Y.; Ren, Z.; Wu, Z. Prediction and Control of Injection Molding Process Based on Deep Neural Network. J. Guangdong Univ. Technol. 2022, 39, 120–126+136. [Google Scholar]
- Yi, W.; Yang, J.; Yan, L. Research on Underwater Small Target Detection Technology Based on Single-Stage USSTD-YOLOv8n. IEEE Access 2024, 12, 69633–69641. [Google Scholar] [CrossRef]
- Fernandes, C.C.; Valente, S.; Figueiredo, E.; Polido, A. Stakeholder and social network analysis for understanding forest (fires) management—A contribution based on a systematic literature review. For. Policy Econ. 2025, 170, 103396. [Google Scholar] [CrossRef]
- Li, J.; Xie, S.; Zhou, X.; Zhang, L.; Li, X. Real-time detection of coal mine safety helmet based on improved YOLOv8. J. Real-Time Image Process. 2024, 22, 26. [Google Scholar] [CrossRef]
- Wang, Q.; Wu, B.; Zhu, P.; Li, P.; Zuo, W.; Hu, Q. ECA-Net: Efficient channel attention for deep convolutional neural networks. In Proceedings of the IEEE Computer Society Conference on Computer Vision and Pattern Recognition, Seattle, WA, USA, 13–19 June 2020; pp. 11531–11539. [Google Scholar]
- Zhang, C.; Liu, P.; Wang, H.; Jin, Y. A review of recent advance of ship detection in single-channel SAR images. Waves Random Complex Media 2023, 33, 1442–1473. [Google Scholar] [CrossRef]
- Babiker, I.; Bentahar, J.; Xie, W.-F. Dandelion center detection in perennial ryegrass with Heat maps using Convolutional Neural Networks. Appl. Soft Comput. 2025, 169, 112576. [Google Scholar] [CrossRef]
- Ren, A.; Li, S. Design of DRL Timing Simulation System for Signal—Controlled Intersections Integrating Vissim—Python and Qt. Comput. Appl. Softw. 2024, 41, 53–59+122. [Google Scholar]
Disclaimer/Publisher’s Note: The statements, opinions and data contained in all publications are solely those of the individual author(s) and contributor(s) and not of MDPI and/or the editor(s). MDPI and/or the editor(s) disclaim responsibility for any injury to people or property resulting from any ideas, methods, instructions or products referred to in the content. |
© 2025 by the authors. Licensee MDPI, Basel, Switzerland. This article is an open access article distributed under the terms and conditions of the Creative Commons Attribution (CC BY) license (https://creativecommons.org/licenses/by/4.0/).