Article

Effect of Experimental Warming on Forage Nutritive Value and Storage in Alpine Meadows at Three Different Altitudes of Nianqing Tanggula Mountain, Northern Tibet: A Long-Term Experience

1
College of Urban and Environmental Sciences, Hunan University of Technology, Zhuzhou 412007, China
2
Lhasa Plateau Ecosystem Research Station, Key Laboratory of Ecosystem Network Observation and Modeling, Institute of Geographic Sciences and Natural Resources Research, Chinese Academy of Sciences, Beijing 100101, China
3
Institute of Science and Technology Information Research of Xizang Autonomous Region, Lhasa 850000, China
4
Veterinary Station of the Agricultural and Rural Bureau of Dangxiong County, Dangxiong County 851500, China
5
Lhasa Agricultural Technology Extension Station, Lhasa 850000, China
6
Zhongba County Agriculture and Animal Husbandry Comprehensive Service Center, Zhongba County 858800, China
*
Author to whom correspondence should be addressed.
Agronomy 2025, 15(1), 186; https://doi.org/10.3390/agronomy15010186
Submission received: 6 December 2024 / Revised: 28 December 2024 / Accepted: 13 January 2025 / Published: 14 January 2025
(This article belongs to the Section Grassland and Pasture Science)

Abstract

:
Effects of climate warming on nutrition quality and storage of alpine grasslands are still controversial, which is not conducive to the management and utilization of alpine grasslands. A long-term warming experiment (with open-top chambers used to elevate temperature) was conducted at three elevations (relatively low, mid-, and high elevations with 4313, 4513, and 4693 m) of Northern Tibet in 2010 to compare the differences in forage nutritional quality and storage response to warming among three elevations and to explore the relationships between forage nutritional quality and production. In 2019, community surveys, observations of forage biomass and nutrition quality, and soil physicochemical properties were carried out. Forage nutrition quality included crude protein (CP), acid detergent fiber (ADF), neutral detergent fiber (NDF), ether extract (EE), crude ash (Ash), and water-soluble carbohydrate (WSC) content. Warming did not affect community aboveground biomass (AGB) at the three elevations. Warming improved community nutrition quality by increasing community CP content by 25.80% and decreasing community NDF content by 15.51% at the low elevation. In contrast, warming reduced community nutrition quality by increasing community CP, ADF, and NDF contents by 13.45%, 23.68%, and 17.43%, respectively, and decreasing Ash content by 39.50% at the high elevation. Warming did not affect community CP, ADF, NDF, EE, Ash, or WSC contents at the mid-elevation. Warming increased community nutrition storage by increasing community CP, ADF, and NDF storges by 74.69%, 88.18%, and 79.71%, respectively, at the high elevation. Warming did not affect community nutrition storages at the low or mid-elevations. Overall, forbs had higher CP, EE, Ash, and WSC contents and lower ADF and NDF contents compared with graminoids. Community EE content increased with community AGB, but community CP, ADF, NDF, EE, Ash, and WSC contents were not related to community AGB. Therefore, from the low to high elevation, the effects of warming on forage nutrition quality gradually changed from improving to inhibiting. Warming altered rangeland quality by affecting forage nutrition quality rather than forage production. There were no trade-offs between forage nutrition quality and forage production.

1. Introduction

Natural grasslands are important parts of global terrestrial ecosystems, and the rangeland quality is an important attribute of natural grasslands. Rangeland quality of natural grasslands includes two aspects: forage nutrition quality and forage production [1,2]. Forage production may mainly affect the size of rangeland livestock, while forage nutrition quality may mainly affect the community/population structure of rangeland livestock. Climate warming is an important aspect of climate change, and its impact on the rangeland quality of natural grasslands will have a certain impact on domestic animals and wildlife, thus affecting our human life. For this reason, many studies have been conducted on the impact of climate warming on the rangeland quality of natural grasslands and related driving mechanisms, and some research progresses have been made [3,4]. For example, climate warming will generally increase forage production of natural grasslands [5]. These research advances can provide important scientific basis for the improvement of natural grassland rangeland quality and rangeland management and utilization under climate warming.
However, these previous studies still have the following three deficiencies. Firstly, previous studies mainly focused on the effects of climate warming on rangeland quality based on forage production of natural grasslands [4], while the effects of climate warming on rangeland quality have been less frequently discussed from the perspective of forage nutrition quality [6], which may bring uncertainties to the evaluation of rangeland quality change under climate warming. Secondly, based on the nutrient element dilution theory [7], the increase of forage production caused by climate warming will be at the cost of reducing forage nutritional quality. In contrast, some other studies have suggested that climate warming will not reduce the nutritional quality of forage but improve it [1,8]. In other words, it is still controversial whether there is a trade-off relationship between forage production and nutrition quality in natural grasslands, and whether warming definitely reduces rangeland quality under climate warming [9,10]. These inconsistent results are probably related to differences in climatic conditions, soil physicochemical properties, plant α-diversity, and community composition. Thirdly, although biodiversity includes not only species diversity but also phylogenetic diversity, the current research mainly investigates the regulating effects of species diversity on forage nutrition quality rather than phylogenetic diversity under warming conditions. Moreover, phylogenetic diversity can actually explain the variation of forage nutrition quality [11]. These results indicate that the effects of plant species diversity on forage nutrition quality cannot fully reflect the ability of plant diversity to explain the changes in forage nutrition quality under climate warming. Therefore, in order to further quantify the impact of climate warming on the rangeland quality of natural grasslands, it is necessary to strengthen the experimental studies on the impact of climate warming on the nutrition quality of natural grasslands.
Due to the high altitude and large altitude drop of the Qinghai-Xizang Plateau, the climatic conditions and soil factors in different regions are significantly different, and 17 types of grassland have been further formed [12,13,14]. In any 1 of these 17 grassland types, the composition of plant community and soil microbial community are also likely to be significantly different. For example, in an alpine meadow area in Northern Tibet, although the altitude difference is only about 400 m, there are obvious differences in plant community composition, vegetation productivity, and soil microbial community composition [15,16]. The wide span of climate, soil, and plant community composition may have resulted in the diversity of forage yield and nutrition quality in natural grasslands on the Qinghai-Xizang Plateau, thus providing a natural ideal experimental field for exploring the change in forage nutrition quality and its driving mechanism, as well as the relationship between forage nutrition quality and yield. In addition, at least compared with the natural grasslands in Inner Mongolia, China, the nutrition quality of forage in the natural grasslands on the Qinghai-Xizang Plateau is higher [7], which may be related to the unique low-temperature climate conditions on the Qinghai-Xizang Plateau.
However, there are no consistent conclusions on how climate warming will affect forage nutrition quality of natural grasslands or the relationships between forage nutrition quality and yield [8,17]. Finally, it is well known that on the Qinghai-Xizang Plateau, graminoids are often regarded as high-quality forage, while forbs are considered as low-quality forage, which seems to indicate that the nutrition quality of graminoids is greater than that of forbs. However, some studies have shown that the nutrition quality of graminoids is lower than that of forbs [1]. Previous studies have found that the impact of climate warming on the yield of graminoids and forbs is controversial [18,19]. Therefore, it is necessary to further strengthen the research on the response of forage nutrition quality and storage to climate warming in the natural grasslands of the Qinghai-Xizang Plateau.
Based on a long-term warming experiment at three elevations in the Xizang Plateau, this study investigated the response of forage nutrition quality and storage of alpine meadows to climate warming. The main purposes of this study were to (1) compare the response differences of forage nutrition quality and storage to warming among the three elevations, and (2) explore the relationships between forage nutrition quality and production.

2. Materials and Methods

2.1. Study Area and Experiment Design

In May 2010, we set up a long-term warming experiment in three alpine meadow sites (relatively low elevation site with 4313 m, mid-elevation site with 4513 m, and high elevation site with 4693 m) in a south slope of the Nianqing Tanggula Mountain in Northern Tibet. All three sites have been fenced in 2008 to exclude grazing. Soil temperature (Ts), air temperature (Ta), vapor pressure deficit (VPD), and soil pH decreased, but soil moisture (SM), soil organic carbon (SOC), and total nitrogen (TN) increased with increasing elevation from the low to the high elevation site. The dominant species at the low and mid-altitudes are Stipa capillacea, Carex montis-everestii, and Kobresia pygmaea, and that at the high-altitude is Kobresia pygmaea.
Open-top chambers (OTCs) with an opening diameter of 1.00 m, a height of 0.40 m, and a bottom diameter of 1.45 m (Figure 1) were used to elevate soil and air temperatures. These chambers were made of polycarbonate. We fixed it by threading iron wires through the four small holes at the top, thus achieving year-round fixation (Figure 1). There were four OTCs and four control plots at each one of the three elevations. The effects of OTCs on Ts, Ta, VPD, and SM in 2011–2019 were reported by our previous studies [15,16]. In detail, these OTCs increased Ts by 1.27, 1.32, and 1.17 °C, Ta by 1.40, 1.36, and 1.30 °C, and VPD by 0.11, 0.10, and 0.07 kPa, but decreased SM by 0.03, 0.03, and 0.04 m3 m−3 across the nine growing seasons of 2011–2019, respectively. During the growing season in 2019, the Ts of the control and warming treatments at low, medium, and high altitudes were 15.18, 16.40, 13.72, 15.13, 12.21, and 13.82 °C, respectively. The Ta values of 2019 were 11.79, 13.34, 10.56, 12.16, 9.09, and 10.86 °C, respectively. The VPD values of 2019 were 0.69, 0.77, 0.51, 0.67, 0.40, and 0.49 kPa, respectively.

2.2. Sampling and Analysis

In August 2019, we conducted a community survey in the center of each quadrat using a 0.5 m × 0.5 m quadrat frame, recorded species name, height, and coverage of each species, and collected aboveground biomass (AGB) of plants by species. Then, soil samples ranging from 0 to 10 cm were collected with a soil drill for the measurements of SOC, TN, total phosphorus (TP), ammonium nitrogen (NH4+-N), nitrate nitrogen (NO3-N), available phosphorus (AP), and pH. At the low, med-, and high altitudes, the SOC in 2019 for the control and warming treatments were 21.01, 23.78, 25.67, 29.31, 62.25, and 58.22 g kg−1, respectively. The TN values were 2.21, 2.31, 2.51, 2.61, 4.28, and 4.14 g kg−1, respectively. The TP values were 0.50, 0.49, 0.49, 0.48, 0.51, and 0.51 g kg−1, respectively. The NH4+-N values were 8.85, 9.78, 14.30, 16.68, 45.91, and 35.31 mg kg−1, respectively. The NO3-N values were 8.19, 18.58, 13.82, 15.04, 12.36, and 16.54 mg kg−1, respectively. The AP values were 5.06, 5.74, 3.21, 3.97, 5.75, and 5.56 mg kg−1, respectively. The collected plant samples were stored after drying and weighing for AGB measurement and were fully mixed according to two functional groups of grass and forb, respectively, for the analysis of crude protein (CP), acid detergent fiber (ADF), neutral detergent fiber (NDF), ether extract (EE), crude ash (Ash), and water-soluble carbohydrate (WSC). The analysis methods for soil and plant samples were detailed as reported by previous studies [11]. In short, forage CP, EE, Ash, ADF/NDF, and WSC contents were observed by the Kjeldahl, Soxhlet extraction, complete combustion, Van Soest, and anthrone-based methods, respectively.

2.3. Statistical Analyses

Nutrient yield was equal to the nutrient content multiplied by AGB. For example, crude protein yield was equal to the crude protein content multiplied by AGB. We calculated the ratio of SOC to TN (C:N), SOC to TP (C:P), TN to TP (N:P), NH4+-N to NO3-N (NH4+-N:NO3-N), and the sum of NH4+-N and NO3-N to AP (available N:P). The important values of species were obtained based on the data of relative height and relative coverage of species. On the basis of the important values of each species, we calculated species α-diversity (SR: species richness, Shannon, Simpson, Pielou) and β-diversity matrix (βBray matrix). The “microeco” package was used to calculate SR, Shannon, Simpson, and Pielou. The vegan package was used for calculating βBray. We constructed a plant phylogenetic tree based on the family, genus, and species information and then calculated the phylogenetic α-diversity (PD: Faith’s phylogenetic diversity, MNTD: mean nearest taxon distance) and β-diversity matrix (βMNTD matrix) combined with the important values of each species. The “picante” package was used to calculate PD and MNTD. The iCAMP package was used for calculating βMNTD. Generally, forage nutrition quality increased with increasing CP, EE, Ash, and WSC contents, but decreased with increasing ADF and NDF contents [20,21]. The data matrix (βBrayquality) of CP, ADF, NDF, EE, Ash, and WSC contents represented forage nutrition quality. The data matrix (βBraystorage) of CP, ADF, NDF, EE, Ash, and WSC storages represented forage nutrition storage.
The comparison figures of six nutritional quality variables and nutrient pool variables between the control and warming treatments were obtained using the ggbarplot and stat_compare_means functions of the ggpubr package (Figure 2 and Figure 3). The comparison figures of soil nutrients and pH between the control and warming treatments were also obtained in the same way (Figure S1). Besides, the comparison figures of AGB between the control and warming treatments (Figure S2), and between the graminoids and forbs (Figure 4), were acquired using these functions. The adonis2 function of the vegan package was used to test for significance of βBrayquality or βBraystorage between the control and warming treatments or between the graminoids and forbs (Tables S1 and S2).
The scatter regression figures between a single dependent variable and a single independent variable were obtained using the ggscatter and stat_poly_eq functions in the ggpubr package (e.g., Figure S3). The “randomForest” package was used to analyze the relative impact of various biotic independent variables (AGB, SR, Shannon, Simpson, Pielou, PD, MNTD, βBray, βMNTD) and abiotic independent variables (Ts, SM, Ta, VPD, soil nutrients, and pH) on the nutrition quality and nutrient pools. All statistical analyses and graphing mentioned above were performed using R software version 4.2.2.

3. Results

3.1. Warming Effects on Soil Variables and AGB

Warming increased soil C:N by 10.20% at the mid-elevation (Figure S1). Warming decreased graminoid AGB by 69.63% (32.73 vs. 9.94 g m−2 for the control and warming treatments) at the low elevation but increased graminoid AGB by 104.82% (45.12 vs. 92.40 g m−2 for the control and warming treatments) at the high elevation (Figure S2).

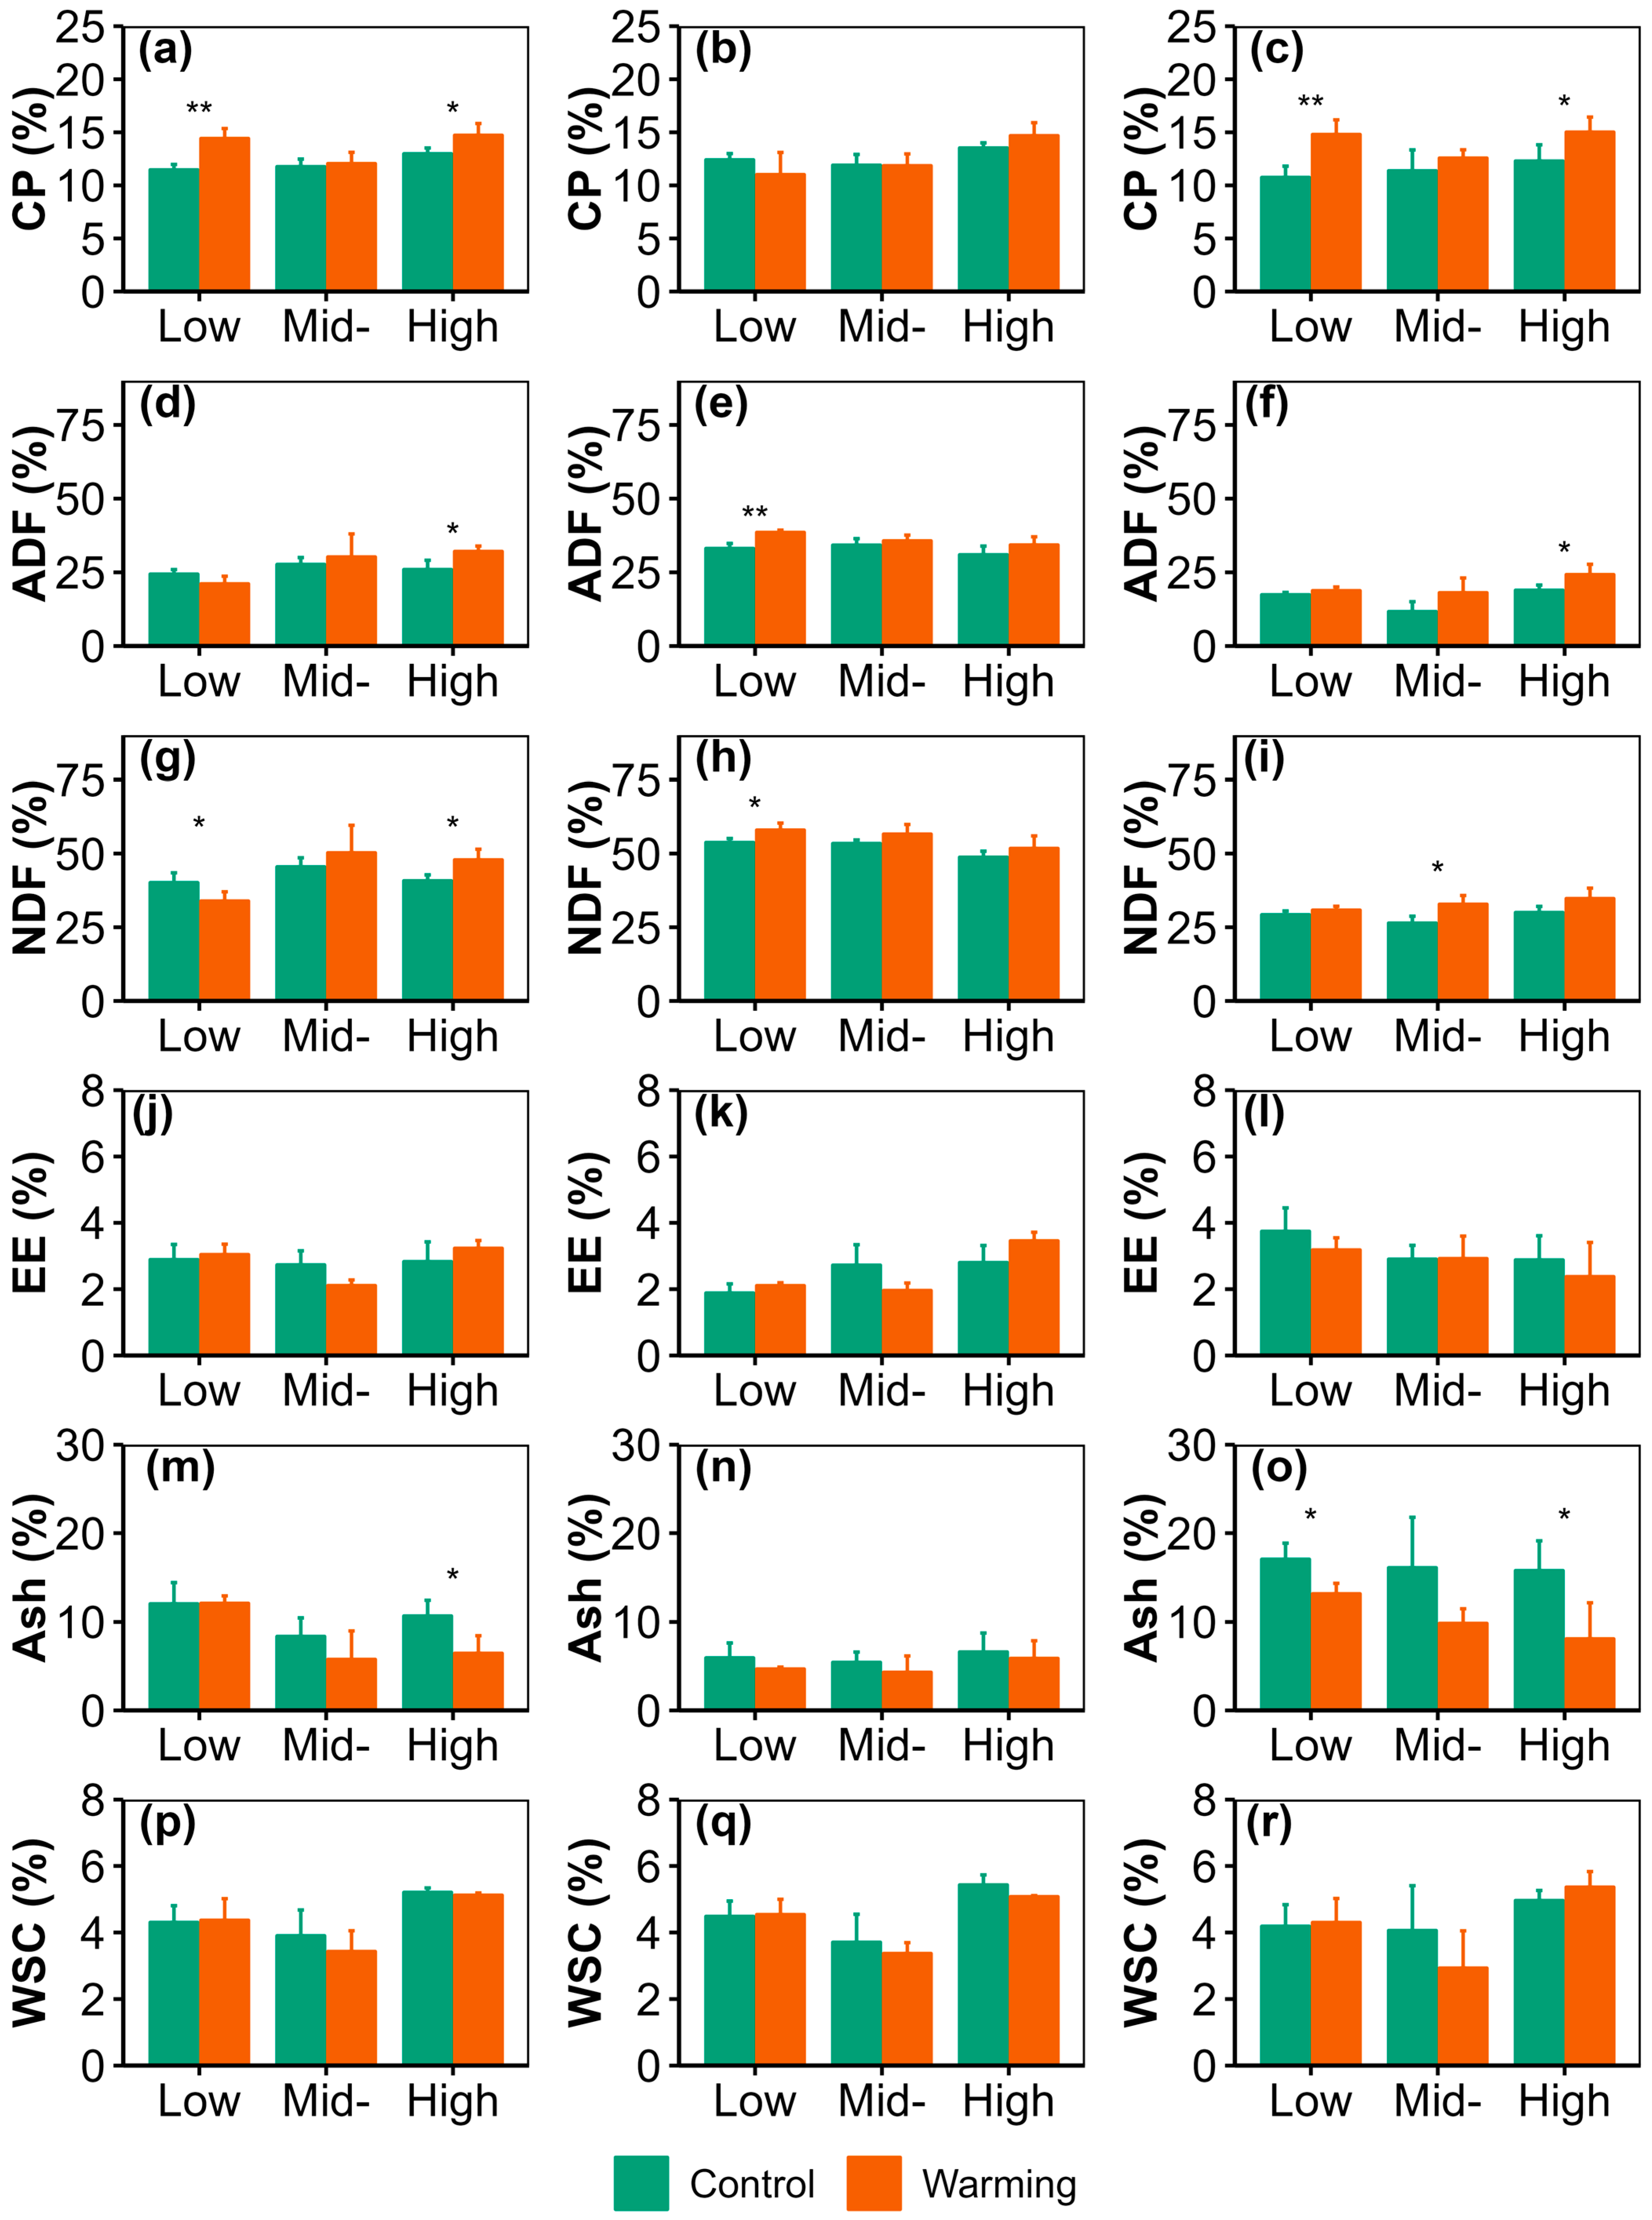
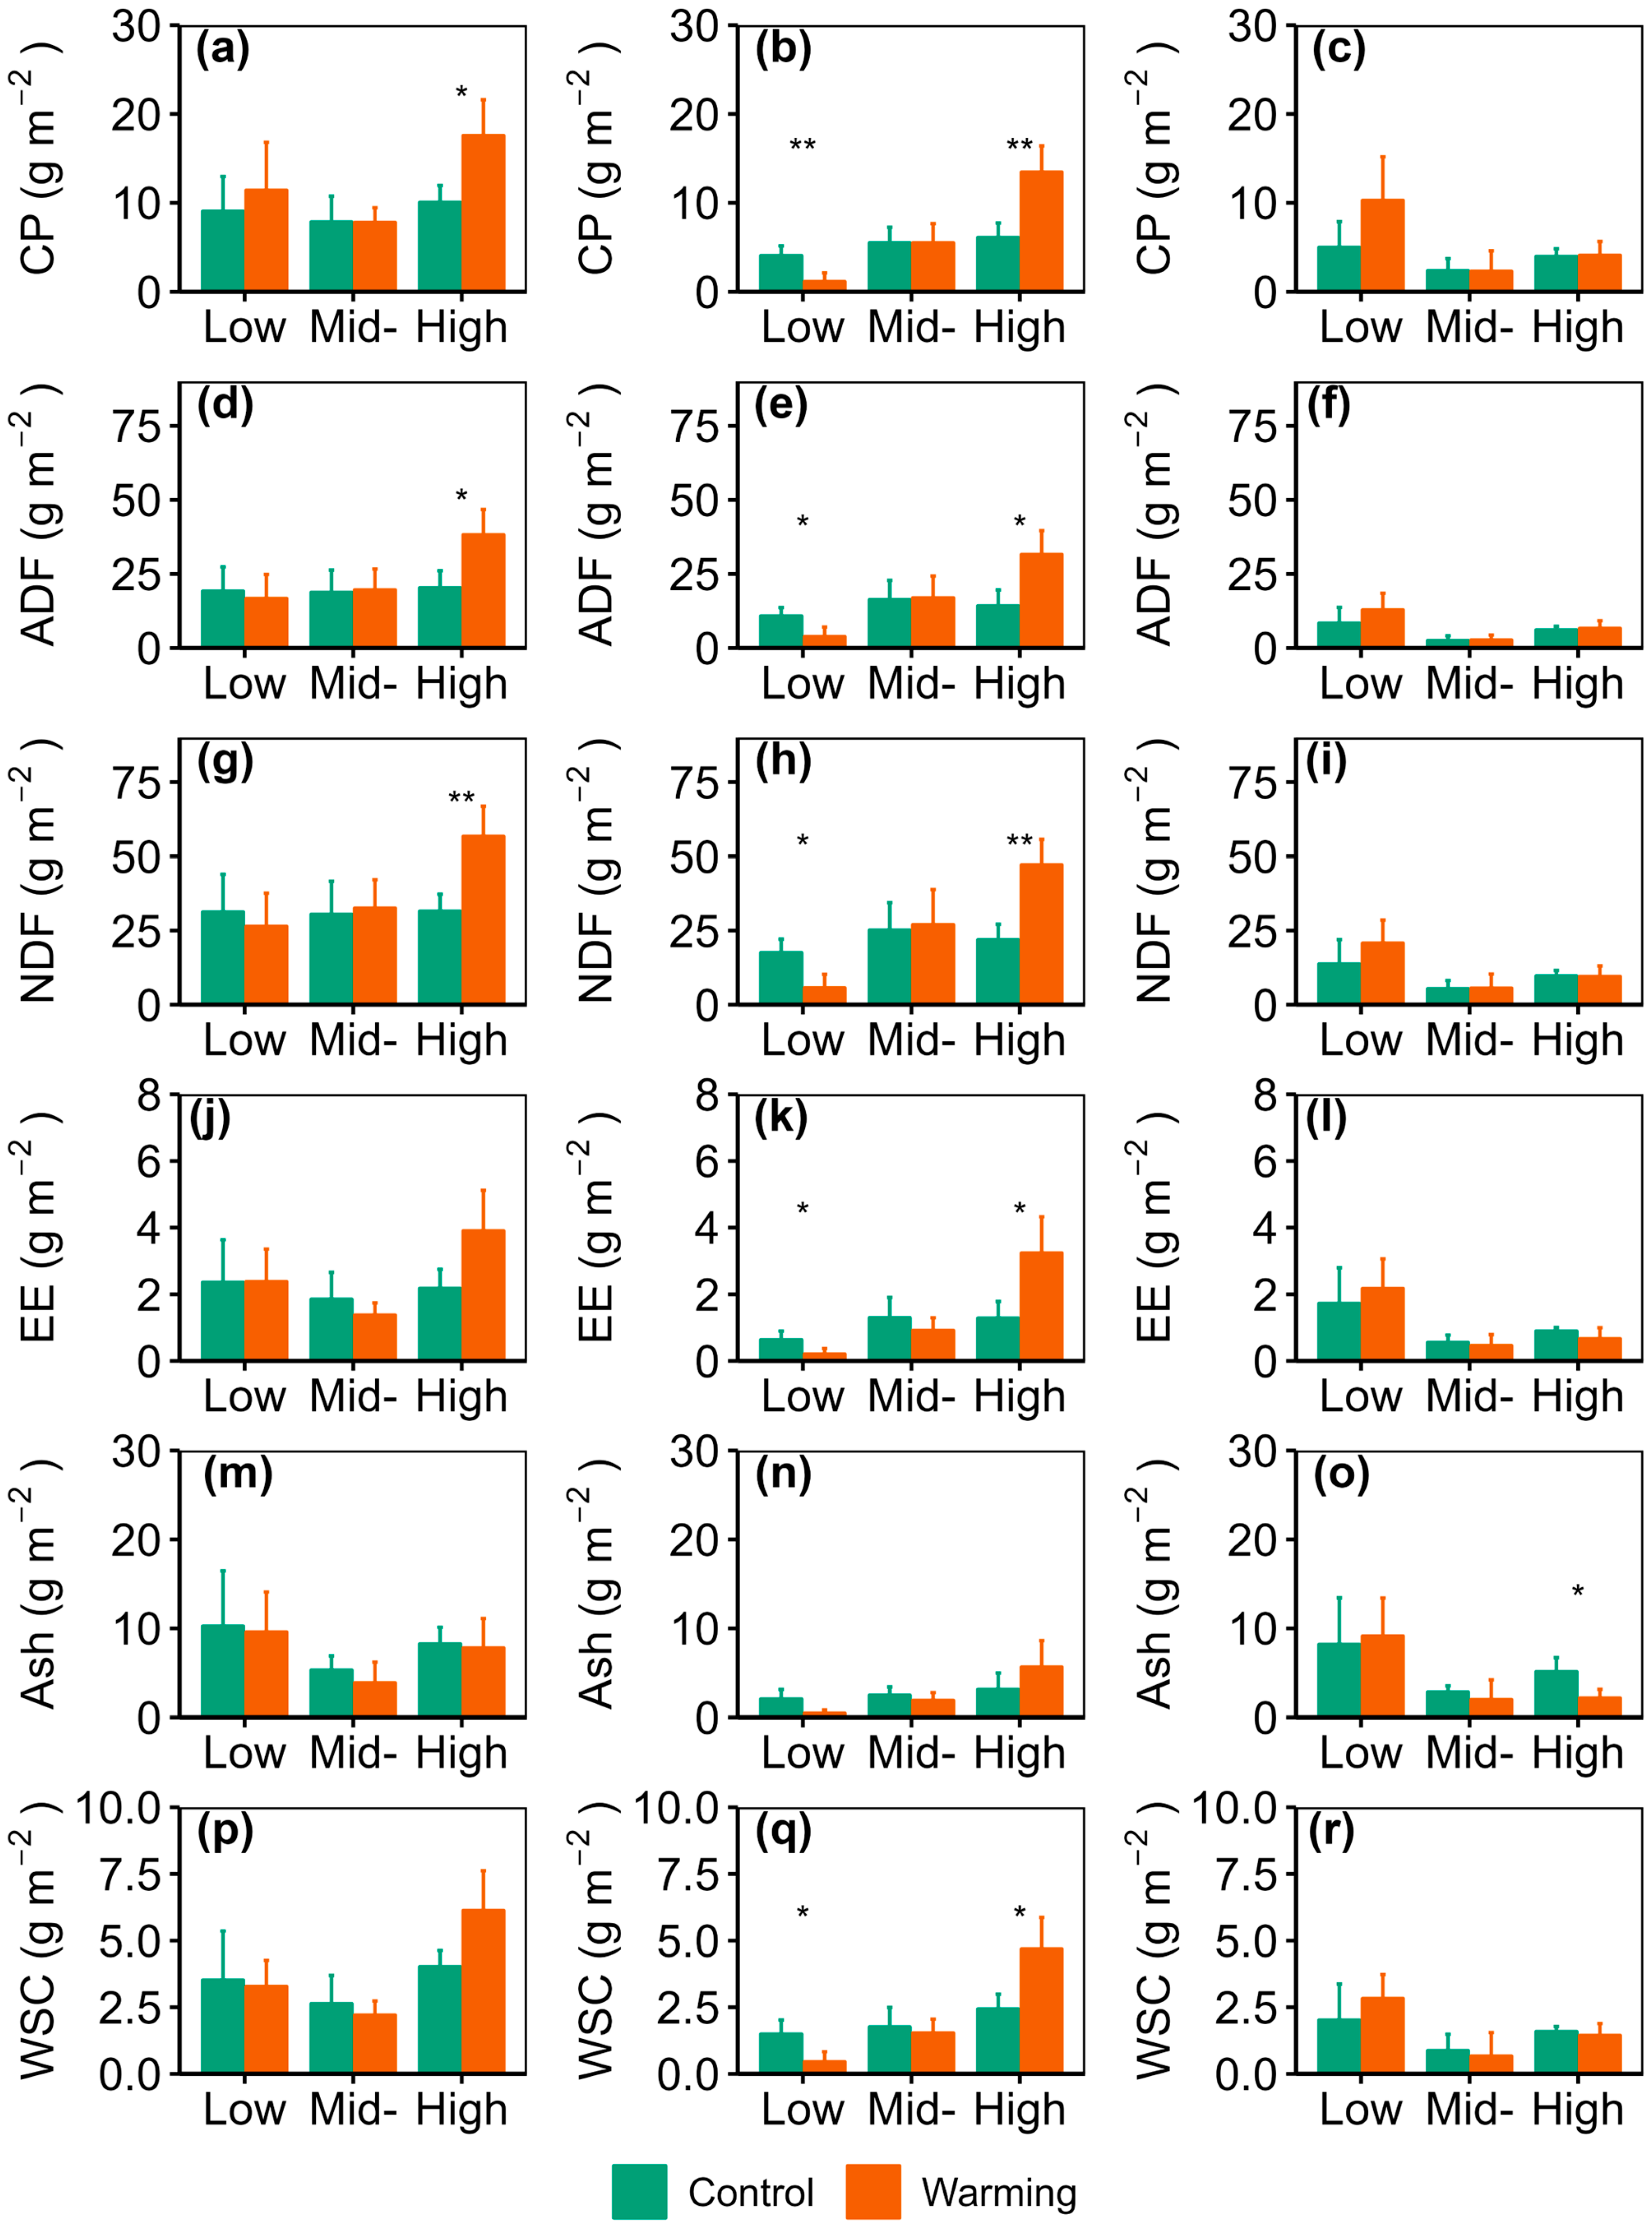
3.2. Warming Effects on Forage Nutrition Quality and Storage

Warming improved community nutrition quality by increasing community CP content by 25.80% (11.46% vs. 14.42% for the control and warming treatments) and decreasing community NDF content by 15.51% (40.12% and 33.90% for the control and warming treatments) at the low elevation (Figure 2, Table S1). Warming also improved forb nutrition quality by increasing forb CP content by 37.68% (10.75% and 14.80% for the control and warming treatments) and decreasing forb Ash content by 22.62% (17.04% and 13.19% for the control and warming treatments) at the low elevation (Figure 2, Table S1). In contrast, warming reduced graminoid nutrition quality by increasing graminoid ADF and NDF contents by 4.30% (33.09% and 38.55% for the control and warming treatments) and 7.86% (53.75% and 57.97% for the control and warming treatments) at the low elevation, respectively (Figure 2, Table S1). Warming reduced forb nutrition quality by increasing forb NDF content by 24.23% (26.41% and 32.81% for the control and warming treatments) at the mid-elevation (Figure 2, Table S1). Warming reduced community nutrition quality by increasing community CP, ADF, and NDF contents by 13.45% (12.98% and 14.72% for the control and warming treatments), 23.68% (25.94% and 32.09% for the control and warming treatments), and 17.43% (40.76% 47.87% for the control and warming treatments), respectively, and decreasing Ash content by 39.50% (10.67% and 6.46% for the control and warming treatments) at the high elevation (Figure 2, Table S1). Warming reduced forb nutrition quality by increasing forb CP and ADF contents by 22.21% (12.29% and 15.02% for the control and warming treatments) and 28.16% (18.91% and 24.23% for the control and warming treatments), respectively, and decreasing forb Ash content by 48.80% (15.80% and 8.09% for the control and warming treatments) at the high elevation (Figure 2, Table S1).
Figure 2. Effects of warming on the contents of (ac) crude protein (CP), (df) acid detergent fiber (ADF), (gi) neutral detergent fiber (NDF), (jl) ether extract (EE), (mo) crude ash (Ash), and (pr) water-soluble carbohydrates (WSC) of (a,d,g,j,m,p) the community, (b,e,h,k,n,q) graminoids, and (c,f,i,l,o,r) forbs at the low, mid-, and high elevations, respectively. * and ** indicates significant differences between the control and warming treatments at p < 0.05 and p < 0.01, respectively.
Agronomy 15 00186 g002
Warming increased community nutrition storage by increasing community CP, ADF, and NDF storages by 74.69% (10.06 and 17.57 g m−2 for the control and warming treatments), 88.18% (20.31 and 38.22 g m−2 for the control and warming treatments), and 79.71% (31.54 and 56.68 g m−2 for the control and warming treatments), respectively, at the high elevation (Figure 3, Table S1). Warming also increased graminoid nutrition storage by increasing graminoid CP, ADF, NDF, EE, and WSC storages by 120.82% (6.10 and 13.46 g m−2 for the control and warming treatments), 122.08% (14.22 and 31.59 g m−2 for the control and warming treatments), 115.54% (21.88 and 47.16 g m−2 for the control and warming treatments), 152.63% (1.28 and 3.24 g m−2 for the control and warming treatments), and 92.63% (2.43 and 4.69 g m−2 for the control and warming treatments), respectively, at the high elevation (Figure 3, Table S1). In contrast, warming reduced graminoid nutrition storage by reducing graminoid CP, ADF, NDF, EE, and WSC storages by 71.80% (4.06 and 1.15 g m−2 for the control and warming treatments), 64.39% (10.81 and 3.85 g m−2 for the control and warming treatments), 67.73% (17.55 and 5.66 g m−2 for the control and warming treatments), 67.31% (0.63 and 0.21 g m−2 for the control and warming treatments), and 69.41% (1.49 and 0.46 g m−2 for the control and warming treatments), respectively, at the low elevation (Figure 3). Warming also reduced forb nutrition storage by decreasing forb Ash storage by 57.74% (5.12 and 2.16 g m−2 for the control and warming treatments) at the high elevation (Figure 3).

3.3. Comparison of Nutrition Quality Between Graminoid and Forb Forage

Overall, forb nutrition quality was greater than graminoid nutrition quality at the three elevations under both control and warming conditions (Figure 4, Table S2). In detail, compared to graminoid forage, the CP content of forb forage was 13.35% lower under the control conditions, but 34.32% greater under the warming conditions at the low elevation (Figure 4). Compared to graminoid forage, the ADF content of forb forage was 47.47% and 51.30%, 65.89%, and 49.33%, and 38.91% and 29.34% lower under the control and warming conditions at the low, mid-, and high elevations, respectively (Figure 4). Compared to graminoid forage, the NDF content of forb forage was 45.60% and 46.85%, 50.54% and 42.03%, and 38.50% and 32.88% lower under the control and warming conditions at the low, mid-, and high elevations, respectively (Figure 4). In contrast, the EE content of forb forage was 98.89% and 51.11% greater than that of graminoid forage under the control and warming conditions at the low elevation, respectively (Figure 4). The Ash content of forb forage was 187.04% and 181.62%, and 196.99% and 128.25% greater than that of graminoid forage under the control and warming conditions at the low and mid-elevations, respectively (Figure 4). In addition, the Ash content of forb forage was 139.15% greater than that of graminoid forage under the control conditions at the high elevation (Figure 4).
Figure 3. Effects of warming on the storage of (ac) CP, (df) ADF, (gi) NDF, (jl) EE, (mo) Ash, and (pr) WSC of (a,d,g,j,m,p) the community, (b,e,h,k,n,q) graminoids, and (c,f,i,l,o,r) forbs at the low, mid-, and high elevations, respectively. Abbreviations are shown in Figure 2. * and ** indicates significant differences between the control and warming treatments at p < 0.05 and p < 0.01, respectively.
Agronomy 15 00186 g003
Figure 4. Comparison of the contents of (a,b) CP, (c,d) ADF, (e,f) NDF, (g,h) EE, (i,j) Ash, and (k,l) WSC between graminoids and forbs under (a,c,e,g,i,k) control conditions and warming conditions (b,d,f,h,j,l) at the low, mid-, and high elevations, respectively. Abbreviations are shown in Figure 2. *, **, *** and **** indicates significant differences between the control and warming treatments at p < 0.05, p < 0.01, p < 0.001 and p < 0.0001, respectively.
Agronomy 15 00186 g004

3.4. Relationships Between Nutrition Quality and Biotic (AGB and Diversity) and Abiotic (Microclimate and Soil Conditions) Variables

Community EE content increased with community AGB, and graminoid CP and EE contents increased with graminoid AGB (Figure S3). In contrast, graminoid NDF content decreased with graminoid AGB (Figure S3). Forb WSC content showed a quadratic relationship with forb AGB (Figure S3). Graminoid forage nutrition quality was positively correlated with graminoid AGB (Figure S3).
Community composition and α-diversity can explain forage nutrition quality, CP, ADF, NDF, EE, Ash, and/or WSC contents (Figures S4–S15, Table 1). For example, community nutrition quality increased with βBray and βMNTD, but graminoid nutrition quality showed quadratic relationships with βBray and βMNTD (Figures S4 and S5). Forb nutrition quality decreased with Simpson and Pielou (Figure S9).
Environmental temperature and humidity conditions can also explain the variations in forage nutrition quality, CP, ADF, NDF, EE, Ash, and/or WSC contents (Figures S16–S18, Table 1). For example, community and graminoid nutrition quality showed quadratic relationships with Ts and Ta, but forb nutrition quality decreased with Ts and Ta (Figures S16–S18). Community nutrition quality showed quadratic relationships with SM and VPD, but graminoid nutrition quality increased with SM and VPD (Figures S16 and S17).
Soil conditions can also explain the variation of forage nutrition quality, CP, ADF, NDF, EE, Ash, and/or WSC contents (Figures S19–S24, Table 1). For example, community nutrition quality showed a quadratic relationship with C:N, but graminoid nutrition quality increased with C:N (Figures S19 and S21). Graminoid nutrition quality increased with NH4+-N and NH4+-N:NO3-N, but forb nutrition quality showed quadratic relationships with NH4+-N and NH4+-N:NO3-N (Figures S22 and S24).
Relative effects of biotic and abiotic variables on the nutrition quality, CP, ADF, NDF, EE, Ash, and/or WSC contents were different (Table 1). For example, the SR, Pielou, βBray, Ts, VPD, and Ta were the dominant variables in influencing the variation of community nutrition quality (Table 1). The Ts, VPD, SOC, TN, C:P, N:P, and βMNTD were the dominant variables in influencing the variation of graminoid nutrition quality (Table 1). The Ts, VPD, SOC, TN, NH4+-N, PD, and SR were the dominant variables in influencing the variation of forb nutrition quality (Table 1).

3.5. Relationships Between Nutrition Storage and Environmental Variables

The AGB was the dominant variable in influencing the variations of CP, ADF, NDF, EE, Ash, WSC, and nutrition storages (Table 1). The SOC, TN, and NO3-N were also the dominant variables in influencing the variation of community Ash storage (Table 1). The βMNTD was another dominant variable in influencing the variations of graminoid EE and Ash storages (Table 1). The SOC and TN were also the dominant variables in influencing the variation of forb Ash storage (Table 1).
Forage CP, ADF, NDF, EE, Ash, WSC, and nutrition storages increased with AGB (Figure S25). Community composition and α-diversity can explain forage CP, ADF, NDF, EE, Ash, WSC, and/or nutrition storages (Figures S26–S37). For example, both graminoid and forb nutrition storages increased with βBray (Figures S27 and S28). Environmental temperature and humidity conditions can also explain the variations of CP, ADF, NDF, EE, Ash, WSC, and/or nutrition storages (Figures S38–S40). For example, community, graminoid, and forb nutrition storages showed a negative, positive, and quadratic relationship with Ts, respectively (Figures S38–S40). Soil conditions can also explain the variations of CP, ADF, NDF, EE, Ash, WSC, and/or nutrition storages (Figures S41–S46). For example, forb nutrition storage showed quadratic relationships with SOC, TN, C:N, C:P, N:P, and NH4+-N (Figures S45 and S46).

4. Discussion

Trade-offs between forage nutrition quality and forage production were not observed in this study, which is in contrast with some previous studies [7,22] but in line with other previous studies [1,18]. These inconsistent findings are likely to be attributed to one or more reasons. Firstly, both different slope directions and microtopographic characteristics can form different community compositions, soil nutrients, environmental temperature, and humidity conditions, which in turn may account for different relationships between forage nutrition quality and forage production [8,23]. Secondly, since both the responses of forage production and nutrition quality among different functional groups to warming may be different and even opposite, the relationships between forage production and nutrition quality of different functional groups can also be different [24,25]. Even for the same plant functional group, there is not always a trade-off between forage production and nutrition quality [1,26], which further aggravates the complexity of the relationships between forage production and nutrition quality at the community level. Thirdly, plant symbiotic fungi can regulate the relationships between forage production and nutrition quality [27]. However, the impacts of warming on plant symbiotic fungi are still controversial [28].
The nutrition quality of forbs was greater than that of gramineous, especially in a warming climate, and responses of forage nutrition quality to warming varied with plant functional groups. These findings were in line with some previous studies [1,18,24] and may be linked to one or more reasons. Firstly, nitrogen use efficiency and nitrogen resorption efficiency among different functional groups of plants and their sensitivities to warming are different [24,29]. Secondly, according to root distribution characteristics, plants can be divided into shallow-rooted and deep-rooted plants, and the root distribution characteristics of different functional groups may be different [30,31]. Shallow-rooted plants can only directly absorb shallow soil nutrients and water, while deep-rooted plants can absorb the nutrients and water they need from both shallow and deep layers [32]. Soil nutrition can generally decline with increasing soil depth [9]. Drought induced by warming may cause plant roots to extend deeper into soils, but this effect may depend on plant functional groups [9]. Thirdly, both the effects of warming on plant phenology and the nutrition quality of forage can be linked to plant functional groups [33]. Fourthly, warming can affect the nutrition quality of forage through its effects on plant photosynthesis [9,32], and the responses of plant photosynthesis to warming may vary with plant functional groups [34,35]. Finally, the effects of plant symbiotic fungi on the nutrition quality of forage can be dependent on plant’s functional groups [27].
Warming improved rangeland quality by increasing forage nutrition quality rather than forage production at the low elevation, which is in line with some previous studies [1,8]. In contrast, warming reduced rangeland quality by decreasing forage nutrition quality rather than forage production at the high elevation, which is similar to some previous studies [2,18]. In addition, warming did not alter rangeland quality at the mid-elevation, which is in line with some previous studies [23,36]. These inconsistent findings may be related to one or more reasons. Firstly, on one hand, different warming devices and their corresponding diverse warming magnitudes can be one of the important mechanisms that cause the different effects of climate warming on rangeland quality [1,37,38]. However, all three sites in this study used the exact same specifications for warming devices, and the increased magnitudes in the soil and air temperatures caused by these devices did not differ significantly among the three elevations. On the other hand, the sensitivity of forage nutrition quality in north-facing sites to warming can be lower than that in south-facing sites [23]. However, all three sites in this study are south-facing. Secondly, consistent with previous studies [1,8], α-diversity and community composition may be another one of the important mechanisms regulating the response of forage nutrition quality to warming. Experimental warming increased and decreased the Pielou index at the low and mid- elevations, respectively, but did not affect the Pielou index at the high elevation [15]. The changes in the Pielou index caused by experimental warming may tend to improve, reduce, or not change the nutrition quality of forage at the low, mid-, and high elevations, respectively (Figure S7d). Experimental warming altered community composition at the low elevation but not the mid- or high elevations [15], which implied that climate warming might tend to improve the nutrition quality of forage at the low elevation but not mid- and high elevations (Figure S4m). Experimental warming induced the decline, negligible change, and an increase in graminoid production at the low, mid-, and high elevations, respectively (Figure S2), which showed that warming may tend to improve, not change, and reduce the nutrition quality of forage at the community level at the low, middle, and high elevations, respectively (Figure 4). Thirdly, plant nutrition quality can vary with the development stage of plants [24,39], and different plant tissues generally have diverse nutrition quality [40,41]. High temperatures and excessive drought normally accelerate plant maturation, while moderate drought usually delays plant maturation [2,42]. Excessive drought may also lead to the translocation of nutrients from shoots to roots [43]. In addition, warming may decrease the ratio of leaves to stems [44], and the nutritional quality of leaves may be greater than that of stems [45]. The delay or advance of plant maturation and redistribution of nutrients among plant tissues induced by experimental warming depends on the relative amplitude of high temperature and drought induced by experimental warming [8]. Fourthly, in a warming scenario, reduced photosynthesis may lead to reduced fine root production and decreased abundance and activity of mycorrhizal fungi, resulting in carbon restriction of nutrient uptake [9]. Moreover, the reductions in stomatal conductance and transpiration of plant leaves may drive the decrease in the nutrition content of plant leaves [46]. Fifthly, the increase in forage production caused by warming may result in nitrogen dilution and the subsequent decrease in crude protein content [7]. However, warming may also promote nitrogen uptake by plants [20,29], which in turn may mitigate or even counteract the effect of nitrogen dilution. Soil drought caused by warming is likely to diminish nitrogen uptake by plants [9,20]. Sixthly, on one hand, soil nitrogen availability may also regulate the effects of warming on forage nutrition quality [37,39]. However, experimental warming had negligible effects on soil available nitrogen at the three elevations [15]. On the other hand, environmental temperature and moisture conditions nonlinearly regulated the response of forage nutrition quality to experimental warming (Figure S16, Table 1), which is similar to some previous studies [38,47]. From the low to high elevations, water availability increased, but temperature decreased [15]. Finally, changes in soil microbial community composition caused by warming may also induce changes in the nutrient quality of forage [27]. From the low to high elevations, the response of the soil microbial community composition to warming declined [16].

5. Conclusions

In summary, warming improved rangeland quality by increasing forage nutrition quality at the low elevation, but reduced rangeland quality by decreasing forage nutrition quality at the high elevation. Warming did not alter rangeland quality at the mid-elevation, considering that warming did not alter forage nutrition quality or forage production. In detail, Warming improved community nutrition quality by increasing community CP content by 25.80% and decreasing community NDF content by 15.51% at the low elevation. In contrast, warming reduced community nutrition quality by increasing community CP, ADF, and NDF contents by 13.45%, 23.68%, and 17.43%, respectively, and decreasing Ash content by 39.50% at the high elevation. Warming increased community CP, ADF, and NDF yields at the high elevation by 74.69%, 88.18%, and 79.71%, respectively.
The responses to warming of forb and graminoid nutrition quality and storage were diverse. For example, warming improved forb nutrition quality by increasing CP content and decreasing Ash content at the low elevation. In contrast, warming reduced graminoid nutrition quality by increasing ADF and NDF contents at the low elevation.
The nutrition quality of forbs was overall greater than that of graminoids, considering that forbs generally had the higher EE and Ash contents but the lower ADF and NDF contents, especially at the low elevation.
There were no trade-offs between forage nutrition quality and forage production because community EE content increased with community AGB, and the contents of the other five nutrition variables were not significantly correlated with AGB.

Supplementary Materials

The following supporting information can be downloaded at: https://www.mdpi.com/article/10.3390/agronomy15010186/s1.

Author Contributions

Writing—original draft, F.H., W.S., S.L., C.Y., J.X., T.L., Y.D., D. (Dorblha), C.C., D. (Dawaqiongda), L. and G.F.; Writing—review & editing, F.H., W.S., S.L., C.Y., J.X., T.L., Y.D., D. (Dorblha), C.C., D. (Dawaqiongda), L. and G.F. All authors have read and agreed to the published version of the manuscript.

Funding

This research was funded by Xizang Autonomous Region Science and Technology Project [XZ202401JD0029], National Natural Science Foundation of China [31600432], Lhasa Science and Technology Plan Project [LSKJ202422], Chinese Academy of Sciences Youth Innovation Promotion Association [2020054], Study on the Path of Agricultural Green Development and Carbon Reduction and Sequestration in Typical Counties of Yarlung Zangbo River Basin, Natural Science Foundation of Tibet Autonomous Region [XZ2019ZRG-155], Technical experiment on restoration of degraded grassland and efficient establishment of artificial grassland in Zhongba County, and Construction of Zhongba County Fixed Observation and Experiment Station of First Support System for Agriculture Green Development.

Data Availability Statement

The data that support the findings of this study are available from the corresponding author upon request.

Conflicts of Interest

The authors declare no conflicts of interest.

References

  1. Xu, W.; Zhu, M.Y.; Zhang, Z.H.; Ma, Z.Y.; Liu, H.Y.; Chen, L.T.; Cao, G.M.; Zhao, X.Q.; Schmid, B.; He, J.S. Experimentally simulating warmer and wetter climate additively improves rangeland quality on the Tibetan Plateau. J. Appl. Ecol. 2018, 55, 1486–1497. [Google Scholar] [CrossRef]
  2. White, S.R.; Cahill, J.F., Jr.; Bork, E.W. Implications of Precipitation, Warming, and Clipping for Grazing Resources in Canadian Prairies. Agron. J. 2014, 106, 33–42. [Google Scholar] [CrossRef]
  3. Arft, A.M.; Walker, M.D.; Gurevitch, J.; Alatalo, J.M.; Bret-Harte, M.S.; Dale, M.; Diemer, M.; Gugerli, F.; Henry, G.H.R.; Jones, M.H.; et al. Responses of tundra plants to experimental warming: Meta-analysis of the international tundra experiment. Ecol. Monogr. 1999, 69, 491–511. [Google Scholar] [CrossRef]
  4. Rustad, L.E.; Campbell, J.L.; Marion, G.M.; Norby, R.J.; Mitchell, M.J.; Hartley, A.E.; Cornelissen, J.H.C.; Gurevitch, J.; Gcte, N. A meta-analysis of the response of soil respiration, net nitrogen mineralization, and aboveground plant growth to experimental ecosystem warming. Oecologia 2001, 126, 543–562. [Google Scholar] [CrossRef] [PubMed]
  5. Lin, D.L.; Xia, J.Y.; Wan, S.Q. Climate warming and biomass accumulation of terrestrial plants: A meta-analysis. New Phytol. 2010, 188, 187–198. [Google Scholar] [CrossRef] [PubMed]
  6. Habermann, E.; de Oliveira, E.A.D.; Contin, D.R.; Costa, J.V.C.P.; Costa, K.A.d.P.; Martinez, C.A. Warming offsets the benefits of elevated CO2 in water relations while amplifies elevated CO2-induced reduction in forage nutritional value in the C4 grass Megathyrsus maximus. Front. Plant Sci. 2022, 13, 1033953. [Google Scholar] [CrossRef] [PubMed]
  7. Shi, Y.; Ma, Y.L.; Ma, W.H.; Liang, C.Z.; Zhao, X.Q.; Fang, J.Y.; He, J.S. Large scale patterns of forage yield and quality across Chinese grasslands. Chin. Sci. Bull. 2013, 58, 1187–1199. [Google Scholar] [CrossRef]
  8. Li, C.Y.; Peng, F.; Xue, X.; You, Q.G.; Lai, C.M.; Zhang, W.J.; Cheng, Y.X. Productivity and quality of alpine grassland vary with soil water availability under experimental warming. Front. Plant Sci. 2018, 9, 1790. [Google Scholar] [CrossRef]
  9. Leon-Sanchez, L.; Nicolas, E.; Prieto, I.; Nortes, P.; Maestre, F.T.; Ignacio Querejeta, J. Altered leaf elemental composition with climate change is linked to reductions in photosynthesis, growth and survival in a semi-arid shrubland. J. Ecol. 2020, 108, 47–60. [Google Scholar] [CrossRef]
  10. Yan, C.; Liu, Z.; Yuan, Z.; Shi, X.; Lock, T.R.; Kallenbach, R.L. Aridity modifies the responses of plant stoichiometry to global warming and nitrogen deposition in semi-arid steppes. Sci. Total Environ. 2022, 831, 154807. [Google Scholar] [CrossRef]
  11. Zha, X.J.; Tian, Y.; Ouzhu; Fu, G. Response of forage nutrient storages to grazing in alpine grasslands. Front. Plant Sci. 2022, 13, 991287. [Google Scholar] [CrossRef] [PubMed]
  12. Ni, J. Carbon storage in grasslands of China. J. Arid Environ. 2002, 50, 205–218. [Google Scholar] [CrossRef]
  13. Piao, S.; Tan, K.; Nan, H.; Ciais, P.; Fang, J.; Wang, T.; Vuichard, N.; Zhu, B. Impacts of climate and CO2 changes on the vegetation growth and carbon balance of Qinghai-Tibetan grasslands over the past five decades. Glob. Planet. Chang. 2012, 98-99, 73–80. [Google Scholar] [CrossRef]
  14. Piao, S.L.; Zhang, X.Z.; Wang, T.; Liang, E.Y.; Wang, S.P.; Zhu, J.T.; Niu, B. Responses and feedback of the Tibetan Plateau’s alpine ecosystem to climate change. Chin. Sci. Bull. 2019, 64, 2842–2855. (In Chinese) [Google Scholar] [CrossRef]
  15. Han, F.; Yu, C.; Fu, G. Temperature sensitivities of aboveground net primary production, species and phylogenetic diversity do not increase with increasing elevation in alpine grasslands. Glob. Ecol. Conserv. 2023, 43, e02464. [Google Scholar] [CrossRef]
  16. Yu, C.Q.; Han, F.S.; Fu, G. Effects of 7 years experimental warming on soil bacterial and fungal community structure in the Northern Tibet alpine meadow at three elevations. Sci. Total Environ. 2019, 655, 814–822. [Google Scholar] [CrossRef]
  17. Martins-Noguerol, R.; Moreno-Perez, A.J.; Pedroche, J.; Gallego-Tevar, B.; Cambrolle, J.; Matias, L.; Fernandez-Rebollo, P.; Martinez-Force, E.; Perez-Ramos, I.M. Climate change alters pasture productivity and quality: Impact on fatty acids and amino acids in Mediterranean silvopastoral ecosystems. Agric. Ecosyst. Environ. 2023, 358. [Google Scholar] [CrossRef]
  18. Klein, J.A.; Harte, J.; Zhao, X.Q. Experimental warming, not grazing, decreases rangeland quality on the Tibetan Plateau. Ecol. Appl. 2007, 17, 541–557. [Google Scholar] [CrossRef]
  19. Wang, S.P.; Duan, J.C.; Xu, G.P.; Wang, Y.F.; Zhang, Z.H.; Rui, Y.C.; Luo, C.Y.; Xu, B.; Zhu, X.X.; Chang, X.F.; et al. Effects of warming and grazing on soil N availability, species composition, and ANPP in an alpine meadow. Ecology 2012, 93, 2365–2376. [Google Scholar] [CrossRef] [PubMed]
  20. Dumont, B.; Andueza, D.; Niderkorn, V.; Lüscher, A.; Porqueddu, C.; Picon-Cochard, C. A meta-analysis of climate change effects on forage quality in grasslands: Specificities of mountain and Mediterranean areas. Grass Forage Sci. 2015, 70, 239–254. [Google Scholar] [CrossRef]
  21. Soares, J.C.; Santos, C.S.; Carvalho, S.M.P.; Pintado, M.M.; Vasconcelos, M.W. Preserving the nutritional quality of crop plants under a changing climate: Importance and strategies. Plant Soil 2019, 443, 1–26. [Google Scholar] [CrossRef]
  22. Schoenbach, P.; Wan, H.; Gierus, M.; Loges, R.; Mueller, K.; Lin, L.; Susenbeth, A.; Taube, F. Effects of grazing and precipitation on herbage production, herbage nutritive value and performance of sheep in continental steppe. Grass Forage Sci. 2012, 67, 535–545. [Google Scholar] [CrossRef]
  23. Wangchuk, K.; Darabant, A.; Nirola, H.; Wangdi, J.; Gratzer, G. Climate Warming Decreases Plant Diversity but Increases Community Biomass in High-Altitude Grasslands. Rangel. Ecol. Manag. 2021, 75, 51–57. [Google Scholar] [CrossRef]
  24. An, Y.A.; Wan, S.Q.; Zhou, X.H.; Subedar, A.A.; Wallace, L.L.; Luo, Y.Q. Plant nitrogen concentration, use efficiency, and contents in a tallgrass prairie ecosystem under experimental warming. Glob. Chang. Biol. 2005, 11, 1733–1744. [Google Scholar] [CrossRef]
  25. Shi, L.N.; Lin, Z.R.; Wei, X.T.; Peng, C.J.; Yao, Z.Y.; Han, B.; Xiao, Q.; Zhou, H.K.; Deng, Y.F.; Liu, K.S.; et al. Precipitation increase counteracts warming effects on plant and soil C:N:P stoichiometry in an alpine meadow. Front. Plant Sci. 2022, 13, 1044173. [Google Scholar] [CrossRef]
  26. Shi, C.; Sun, G.; Zhang, H.; Xiao, B.; Ze, B.; Zhang, N.; Wu, N. Effects of warming on chlorophyll degradation and carbohydrate accumulation of alpine herbaceous species during plant senescence on the Tibetan Plateau. PLoS ONE 2014, 9, e107874. [Google Scholar] [CrossRef]
  27. Mei, L.; Yang, X.; Zhang, S.; Zhang, T.; Guo, J. Arbuscular mycorrhizal fungi alleviate phosphorus limitation by reducing plant N:P ratios under warming and nitrogen addition in a temperate meadow ecosystem. Sci. Total Environ. 2019, 686, 1129–1139. [Google Scholar] [CrossRef]
  28. Shi, G.X.; Yao, B.Q.; Liu, Y.J.; Jiang, S.J.; Wang, W.Y.; Pan, J.B.; Zhao, X.Q.; Feng, H.Y.; Zhou, H.K. The phylogenetic structure of AMF communities shifts in response to gradient warming with and without winter grazing on the Qinghai-Tibet Plateau. Appl. Soil Ecol. 2017, 121, 31–40. [Google Scholar] [CrossRef]
  29. Zong, N.; Shi, P.L.; Chai, X. Effects of warming and nitrogen addition on nutrient resorption efficiency in an alpine meadow on the northern Tibetan Plateau. Soil Sci. Plant Nutr. 2018, 64, 482–490. [Google Scholar] [CrossRef]
  30. Ganjurjav, H.; Gao, Q.Z.; Gornish, E.S.; Schwartz, M.W.; Liang, Y.; Cao, X.J.; Zhang, W.N.; Zhang, Y.; Li, W.H.; Wan, Y.F.; et al. Differential response of alpine steppe and alpine meadow to climate warming in the central Qinghai-Tibetan Plateau. Agric. For. Meteorol. 2016, 223, 233–240. [Google Scholar] [CrossRef]
  31. Klein, J.A.; Harte, J.; Zhao, X.Q. Decline in medicinal and forage species with warming is mediated by plant traits on the Tibetan Plateau. Ecosystems 2008, 11, 775–789. [Google Scholar] [CrossRef]
  32. Zhang, T.; Yang, S.; Guo, R.; Guo, J. Warming and Nitrogen Addition Alter Photosynthetic Pigments, Sugars and Nutrients in a Temperate Meadow Ecosystem. PLoS ONE 2016, 11, e0155375. [Google Scholar] [CrossRef]
  33. Zhu, J.T.; Zhang, Y.J.; Jiang, L. Experimental warming drives a seasonal shift of ecosystem carbon exchange in Tibetan alpine meadow. Agric. For. Meteorol. 2017, 233, 242–249. [Google Scholar] [CrossRef]
  34. Shi, F.S.; Wu, Y.; Wu, N.; Luo, P. Different growth and physiological responses to experimental warming of two dominant plant species Elymus nutans and Potentilla anserina in an alpine meadow of the eastern Tibetan Plateau. Photosynthetica 2010, 48, 437–445. [Google Scholar] [CrossRef]
  35. Yang, Y.; Wang, G.X.; Yang, L.D.; Guo, J.Y.; Li, N. Physiological responses of Kobresia pygmaea to warming in Qinghai-Tibetan Plateau permafrost region. Acta Oecol. 2012, 39, 109–116. [Google Scholar] [CrossRef]
  36. Augustine, D.J.; Blumenthal, D.M.; Springer, T.L.; LeCain, D.R.; Gunter, S.A.; Derner, J.D. Elevated CO2 induces substantial and persistent declines in forage quality irrespective of warming in mixedgrass prairie. Ecol. Appl. 2018, 28, 721–735. [Google Scholar] [CrossRef]
  37. Bai, E.; Li, S.L.; Xu, W.H.; Li, W.; Dai, W.W.; Jiang, P. A meta-analysis of experimental warming effects on terrestrial nitrogen pools and dynamics. New Phytol. 2013, 199, 441–451. [Google Scholar] [CrossRef]
  38. Yoshihara, Y.; Aoki, R.; Kinugasa, T.; Sasaki, T. Predicted effects of simulated ambient warming and moisture on forage nutrient quality and community composition in Mongolian an arid grassland. Rangel. J. 2022, 44, 159–164. [Google Scholar] [CrossRef]
  39. Natali, S.M.; Schuur, E.A.G.; Rubin, R.L. Increased plant productivity in Alaskan tundra as a result of experimental warming of soil and permafrost. J. Ecol. 2012, 100, 488–498. [Google Scholar] [CrossRef]
  40. Jonsdottir, I.S.; Khitun, O.; Stenstrom, A. Biomass and nutrient responses of a clonal tundra sedge to climate warming. Can. J. Bot. Rev. Can. De Bot. 2005, 83, 1608–1621. [Google Scholar] [CrossRef]
  41. Dijkstra, F.A.; Blumenthal, D.; Morgan, J.A.; Pendall, E.; Carrillo, Y.; Follett, R.F. Contrasting effects of elevated CO2 and warming on nitrogen cycling in a semiarid grassland. New Phytol. 2010, 187, 426–437. [Google Scholar] [CrossRef]
  42. Buxton, D.R. Quality-related characteristics of forages as influenced by plant environment and agronomic factors. Anim. Feed Sci. Technol. 1996, 59, 37–49. [Google Scholar] [CrossRef]
  43. Zong, N.; Chai, X.; Shi, P.L.; Yang, X.C. Effects of warming and nitrogen addition on plant photosynthate partitioning in an alpine meadow on the Tibetan Plateau. J. Plant Growth Regul. 2018, 37, 803–812. [Google Scholar] [CrossRef]
  44. Gardarin, A.; Garnier, E.; Carrere, P.; Cruz, P.; Andueza, D.; Bonis, A.; Colace, M.-P.; Dumont, B.; Duru, M.; Farruggia, A.; et al. Plant trait-digestibility relationships across management and climate gradients in permanent grasslands. J. Appl. Ecol. 2014, 51, 1207–1217. [Google Scholar] [CrossRef]
  45. Shi, C.G.; Silva, L.C.R.; Zhang, H.X.; Zheng, Q.Y.; Xiao, B.X.; Wu, N.; Sun, G. Climate warming alters nitrogen dynamics and total non-structural carbohydrate accumulations of perennial herbs of distinctive functional groups during the plant senescence in autumn in an alpine meadow of the Tibetan Plateau, China. Agric. For. Meteorol. 2015, 200, 21–29. [Google Scholar] [CrossRef]
  46. Salazar-Tortosa, D.; Castro, J.; Villar-Salvador, P.; Vinegla, B.; Matias, L.; Michelsen, A.; Rubio de Casas, R.; Querejeta, J.I. The “isohydric trap”: A proposed feedback between water shortage, stomatal regulation, and nutrient acquisition drives differential growth and survival of European pines under climatic dryness. Glob. Chang. Biol. 2018, 24, 4069–4083. [Google Scholar] [CrossRef]
  47. Dijkstra, F.A.; Pendall, E.; Morgan, J.A.; Blumenthal, D.M.; Carrillo, Y.; LeCain, D.R.; Follett, R.F.; Williams, D.G. Climate change alters stoichiometry of phosphorus and nitrogen in a semiarid grassland. New Phytol. 2012, 196, 807–815. [Google Scholar] [CrossRef] [PubMed]
Figure 1. The photoshop of an open-top chamber.
Agronomy 15 00186 g001
Table 1. Relative contribution of aboveground biomass (AGB), species richness (SR), Shannon, Simpson, Pielou, phylogenetic diversity (PD), mean nearest taxon distance (MNTD), species community composition (βBray), phylogenetic community composition (βMNTD), soil temperature (Ts), soil moisture (SM), air temperature (Ta), vapor pressure deficit (VPD), soil organic carbon (SOC), total nitrogen (TN), total phosphorus (TP), ammonium nitrogen (NH4+-N), nitrate nitrogen (NO3-N), available phosphorus (AP), ratio of SOC to TN (C:N), ratio of SOC to TP (C:P), ratio of TN to TP (N:P), ratio of NH4+-N to NO3-N (NH4+-N:NO3-N), ratio of the sum of NH4+-N and NO3-N to AP (available N:P), and pH to the content or yield of community, graminioid and forb CP, ADF, NDF, EE, Ash, and WSC, and the data matrix of the contents or yields of CP, ADF, NDF, EE, Ash, and WSC (βBrayN).
CommunityGraminoidsForbs
Independent VariableCPADFNDFEEAshWSCβBrayNCPADFNDFEEAshWSCβBrayNCPADFNDFEEAshWSCβBrayN
Nutrition contentAGB0.00.10.00.10.20.00.00.20.00.00.10.30.10.00.00.10.00.20.20.80.0
SR0.00.10.00.00.20.00.00.00.00.00.10.10.00.00.00.10.00.10.10.10.0
Shannon0.00.00.00.10.10.10.00.00.00.00.10.10.00.00.00.10.00.10.10.10.0
Simpson0.00.10.00.10.40.10.00.00.00.00.10.10.10.00.00.10.00.10.10.30.0
Pielou0.00.10.10.10.20.00.10.00.00.00.10.10.10.00.00.20.00.10.10.10.0
PD0.00.00.00.10.30.00.00.00.00.00.10.10.00.00.00.30.00.20.10.10.0
MNTD0.00.10.00.10.30.10.00.00.00.00.10.20.10.00.10.10.00.20.30.20.0
βBray0.00.10.10.10.30.20.10.00.00.00.10.10.10.00.00.20.00.20.20.40.0
βMNTD0.00.10.10.10.20.10.00.10.00.00.10.10.10.00.00.20.00.20.20.10.0
Ts0.00.10.10.10.40.00.10.00.00.00.20.20.00.00.10.20.00.10.20.10.1
SM0.00.10.00.10.20.20.00.00.00.00.10.10.40.00.10.20.00.10.30.10.0
Ta0.00.10.10.10.30.10.10.00.00.00.10.20.10.00.10.30.00.10.10.10.0
VPD0.00.10.10.10.40.10.10.00.00.00.20.10.10.00.00.30.00.10.20.10.1
SOC0.00.00.00.10.90.00.00.00.00.00.20.20.10.00.00.20.00.20.60.10.0
TN0.00.00.00.01.20.10.00.00.00.00.20.30.10.00.00.20.10.20.50.10.1
TP0.00.10.00.00.20.00.00.00.00.00.10.20.00.00.00.10.00.10.20.10.0
NH4+-N0.00.00.00.10.20.10.00.00.00.00.10.10.10.00.00.20.00.20.50.10.1
NO3-N0.10.00.00.10.20.00.00.00.00.00.10.20.00.00.10.10.00.20.30.10.0
AP0.00.10.00.10.20.10.00.00.00.00.10.20.10.00.10.20.00.20.20.10.0
C:N0.00.10.00.10.20.10.00.00.00.00.10.10.10.00.00.20.00.20.30.10.0
C:P0.00.00.00.10.10.10.00.00.00.00.20.10.00.00.00.10.00.10.20.10.0
N:P0.00.00.00.10.20.10.00.10.00.00.10.10.00.00.00.20.00.20.10.10.0
NH4+-N:NO3-N0.00.00.00.10.20.10.00.00.00.00.10.10.10.00.00.10.00.20.20.10.0
Available N:P0.00.10.00.10.20.10.00.00.00.00.20.10.10.00.00.10.00.20.20.10.0
pH0.00.10.00.10.20.10.00.10.00.00.10.20.10.00.00.20.00.10.20.20.0
Nutrition yieldAGB5.14.03.75.31.25.03.918.217.618.115.712.417.618.113.212.213.412.09.415.113.0
SR0.00.10.10.00.20.00.00.10.00.00.10.10.00.00.00.10.00.10.10.00.0
Shannon0.00.10.10.10.30.10.00.10.00.00.10.20.10.00.10.20.00.10.20.10.0
Simpson0.00.20.10.10.40.10.10.00.00.00.10.20.10.00.10.10.00.10.20.20.0
Pielou0.10.20.10.20.40.20.10.10.00.00.20.30.30.00.10.20.10.30.30.20.0
PD0.10.20.10.10.30.10.10.10.00.00.10.20.00.00.10.10.00.20.20.10.0
MNTD0.10.20.10.10.30.10.10.10.00.00.20.30.10.00.10.30.00.70.70.20.0
βBray0.00.10.10.10.50.10.10.40.20.10.30.60.10.10.30.40.20.70.30.60.1
βMNTD0.00.20.10.10.40.10.11.10.40.11.11.90.30.10.10.30.10.30.20.20.0
Ts0.10.10.10.20.30.20.10.10.00.00.10.20.10.00.10.20.10.20.60.20.1
SM0.10.20.20.10.30.30.10.10.00.00.20.30.20.00.20.30.10.20.20.30.0
Ta0.10.10.10.10.40.10.00.10.00.00.10.20.10.00.10.30.10.20.70.30.0
VPD0.10.10.10.10.30.10.00.10.00.00.20.20.10.00.10.20.00.20.40.10.0
SOC0.10.10.10.10.70.10.00.00.00.00.10.20.10.00.10.20.10.20.90.20.0
TN0.10.10.10.10.80.20.00.10.00.00.20.20.10.00.10.20.00.20.80.20.0
TP0.10.10.10.10.40.10.00.10.00.00.10.30.10.00.10.10.00.20.20.10.0
NH4+-N0.00.10.10.20.40.10.00.00.00.00.10.20.10.00.10.20.10.20.20.10.0
NO3-N0.10.20.10.10.70.10.00.10.10.00.10.20.10.00.20.20.10.10.50.30.1
AP0.10.10.10.10.30.20.10.10.00.00.10.20.10.00.10.30.00.20.20.10.0
C:N0.00.10.10.10.40.10.00.00.00.00.10.10.10.00.10.20.10.20.50.40.0
C:P0.00.10.10.10.30.10.00.00.00.00.10.10.20.00.10.10.00.10.20.10.0
N:P0.00.10.10.10.30.10.00.10.00.00.20.20.30.00.10.10.00.10.20.10.0
NH4+-N:NO3-N0.00.10.10.10.20.10.00.10.10.00.10.50.10.00.10.10.00.20.30.10.0
Available N:P0.10.10.20.10.40.10.10.10.00.00.20.20.10.00.10.30.10.40.40.20.0
pH0.00.10.10.10.30.10.00.10.00.00.20.30.10.00.10.30.10.10.20.20.0
The bold numbers are significant at the p < 0.05 level.
Disclaimer/Publisher’s Note: The statements, opinions and data contained in all publications are solely those of the individual author(s) and contributor(s) and not of MDPI and/or the editor(s). MDPI and/or the editor(s) disclaim responsibility for any injury to people or property resulting from any ideas, methods, instructions or products referred to in the content.

