Article

YOLOv8n-CA: Improved YOLOv8n Model for Tomato Fruit Recognition at Different Stages of Ripeness

School of Mechanical Engineering, Yangzhou University, Yangzhou 225127, China
*
Author to whom correspondence should be addressed.
These authors contributed equally to this work.
Agronomy 2025, 15(1), 188; https://doi.org/10.3390/agronomy15010188
Submission received: 6 December 2024 / Revised: 31 December 2024 / Accepted: 12 January 2025 / Published: 14 January 2025
(This article belongs to the Section Precision and Digital Agriculture)

Abstract

:
This study addresses the challenges of tomato maturity recognition in natural environments, such as occlusion caused by branches and leaves, and the difficulty in detecting stacked fruits. To overcome these issues, we propose a novel YOLOv8n-CA method for tomato maturity recognition, which defines four maturity stages: unripe, turning color, turning ripe, and fully ripe. The model is based on the YOLOv8n architecture, incorporating the coordinate attention (CA) mechanism into the backbone network to enhance the model’s ability to capture and express features of the tomato fruits. Additionally, the C2f-FN structure was utilized in both the backbone and neck networks to strengthen the model’s capacity to extract maturity-related features. The CARAFE up-sampling operator was integrated to expand the receptive field for improved feature fusion. Finally, the SIoU loss function was used to solve the problem of insufficient CIoU of the original loss function. Experimental results showed that the YOLOv8n-CA model had a parameter count of only 2.45 × 10⁶, computational complexity of 6.9 GFLOPs, and a weight file size of just 4.90 MB. The model achieved a mean average precision (mAP) of 97.3%. Compared to the YOLOv8n model, it reduced the model size slightly while improving accuracy by 1.3 percentage points. When compared to seven other models—Faster R-CNN, YOLOv3s, YOLOv5s, YOLOv5m, YOLOv7, YOLOv8n, YOLOv10s, and YOLOv11n—the YOLOv8n-CA model was the smallest in size and demonstrated superior detection performance.

1. Introduction

Tomatoes are among the most widely traded fruit and vegetable crops worldwide, with annual production consistently ranking first. Different tomato varieties have distinct maturity requirements [1], making maturity a critical factor influencing tomato quality. Traditionally, tomato harvesting has been conducted manually, with workers assessing maturity based on characteristics such as color, aroma, and texture. However, manual sorting is inefficient, prone to subjective bias, and often results in decision-making errors [2,3], which hinder the sustainable development of the tomato industry. Furthermore, due to China’s aging population and rising labor costs, there is an increasing demand for enhanced automation in agricultural machinery. Agricultural robots have attracted considerable attention [4]. To achieve precise operations, harvesting robots require advanced visual systems. Therefore, developing an efficient tomato maturity recognition method is crucial, as it will not only promote the advancement of ecological monitoring but also provide theoretical and technical support for the statistical analysis of tomato growth environments and the real-time collection of ecological planting data [5,6].
Object detection algorithms based on convolutional neural networks (CNNs) have made significant advancements in agricultural applications. Among single-stage algorithms, YOLO serves as a prominent model that has been extensively studied and applied in agriculture-related fields. However, the unique characteristics of agricultural scenarios introduce challenges to the practical application of YOLO algorithms [7]. By contrast, two-stage algorithms, which utilize two independent networks for detection, offer higher accuracy but operate at a slower speed. Due to variations in network architectures, different detection algorithms are tailored to specific application scenarios. Das et al. [8] developed a residue detection system utilizing YOLOv3 and YOLOv3-SPP, incorporating image augmentation to enhance model performance and improve the cultivation environment of wild blueberries. Roy et al. [9] proposed an enhanced YOLOv4 model based on DenseNet, which optimizes feature propagation and reuse. By integrating an improved PANet to preserve fine-grained information, their model effectively detects mango growth stages in complex environments. Saman et al. [10] refined detection using an enhanced YOLOv5l model by replacing the C3 structure with the Bottleneck CSP module and adding the CBAM module to boost performance, enabling accurate detection of small disease spots. Cardellicchio et al. [11] developed a single-stage detector based on an improved YOLOv5 to identify phenotypic traits of tomato plants, such as nodes, fruits, and flowers. Their model achieved high detection accuracy on complex datasets characterized by small objects, high similarity, and closely matching colors. Olisah et al. [12] proposed a novel multi-input convolutional neural network ensemble classifier (MCE), optimized with a pre-trained VGG16 model to detect subtle features of blackberry ripeness. Tenorio et al. [13] introduced a CNN-based method using MobileNetV1 as a feature extractor while strategically selecting anchor points to detect and evaluate tomato ripeness. Tamilarasi et al. [14] employed a two-stage detection algorithm to predict moderately ripe eggplants. By combining k-means clustering for region-of-interest segmentation with shape-based filtering to exclude non-eggplant objects, their method facilitated the harvesting of mature eggplants. Du et al. [15] introduced the multitask convolutional neural network YOLO-MCNN to assist harvesting robots in accurately determining tomato pose and stem location by integrating multi-scale features and optimizing the semantic segmentation branch. Liu et al. [16] proposed Faster-YOLO-AP, a lightweight apple detection algorithm based on YOLOv8. By adjusting the network scaling factor, replacing the original C2F feature extraction module with partial depthwise convolution (PDWConv), and simplifying down-sampling using depthwise separable convolution (DWSConv), they achieved efficient and accurate apple detection.
In conclusion, while deep-learning-based object detection techniques have surpassed traditional image processing methods in terms of accuracy [17], most research has primarily focused on detecting and harvesting ripe tomatoes, with limited exploration of detection methods for tomatoes at various stages of ripeness. Tomato plants typically have one to two branches bearing fruit, but, in some cases, they can have up to seven or eight, with fruits often overlapping. Additionally, fruits on the same plant may exhibit varying degrees of ripeness. These factors can impair the base network model’s ability to accurately detect occlusions and determine the ripeness of adjacent fruits [14]. This study uses YOLOv8n as the base model and proposes a classification system for tomato ripeness, dividing it into four categories: unripe stage, coloring stage, turning ripe stage, and ripe stage. The goal is to enhance the YOLOv8n model by incorporating a coordinate attention mechanism to improve its feature learning capability for tomatoes. Furthermore, the CARAFE up-sampling technique is employed to increase the network’s awareness of feature maps. Finally, the FasterBlock concept from FasterNet is integrated into the C2f structure to form a new C2f-FN module, which better utilizes the contextual information surrounding tomato fruits, thus improving object detection performance while maintaining a lightweight design.
The structure of this paper is organized as follows: Section 1 emphasizes the significance of tomato ripeness detection, addresses the challenges encountered, reviews previous methods, and introduces the approach proposed in this study. Section 2 outlines the experimental materials and methods. Section 3 provides a comprehensive analysis of the experimental procedures. Section 4 discusses the experimental design and results. Section 5 summarizes the findings of this study. Finally, Section 6 offers an outlook on potential future research directions.

2. Materials and Methods

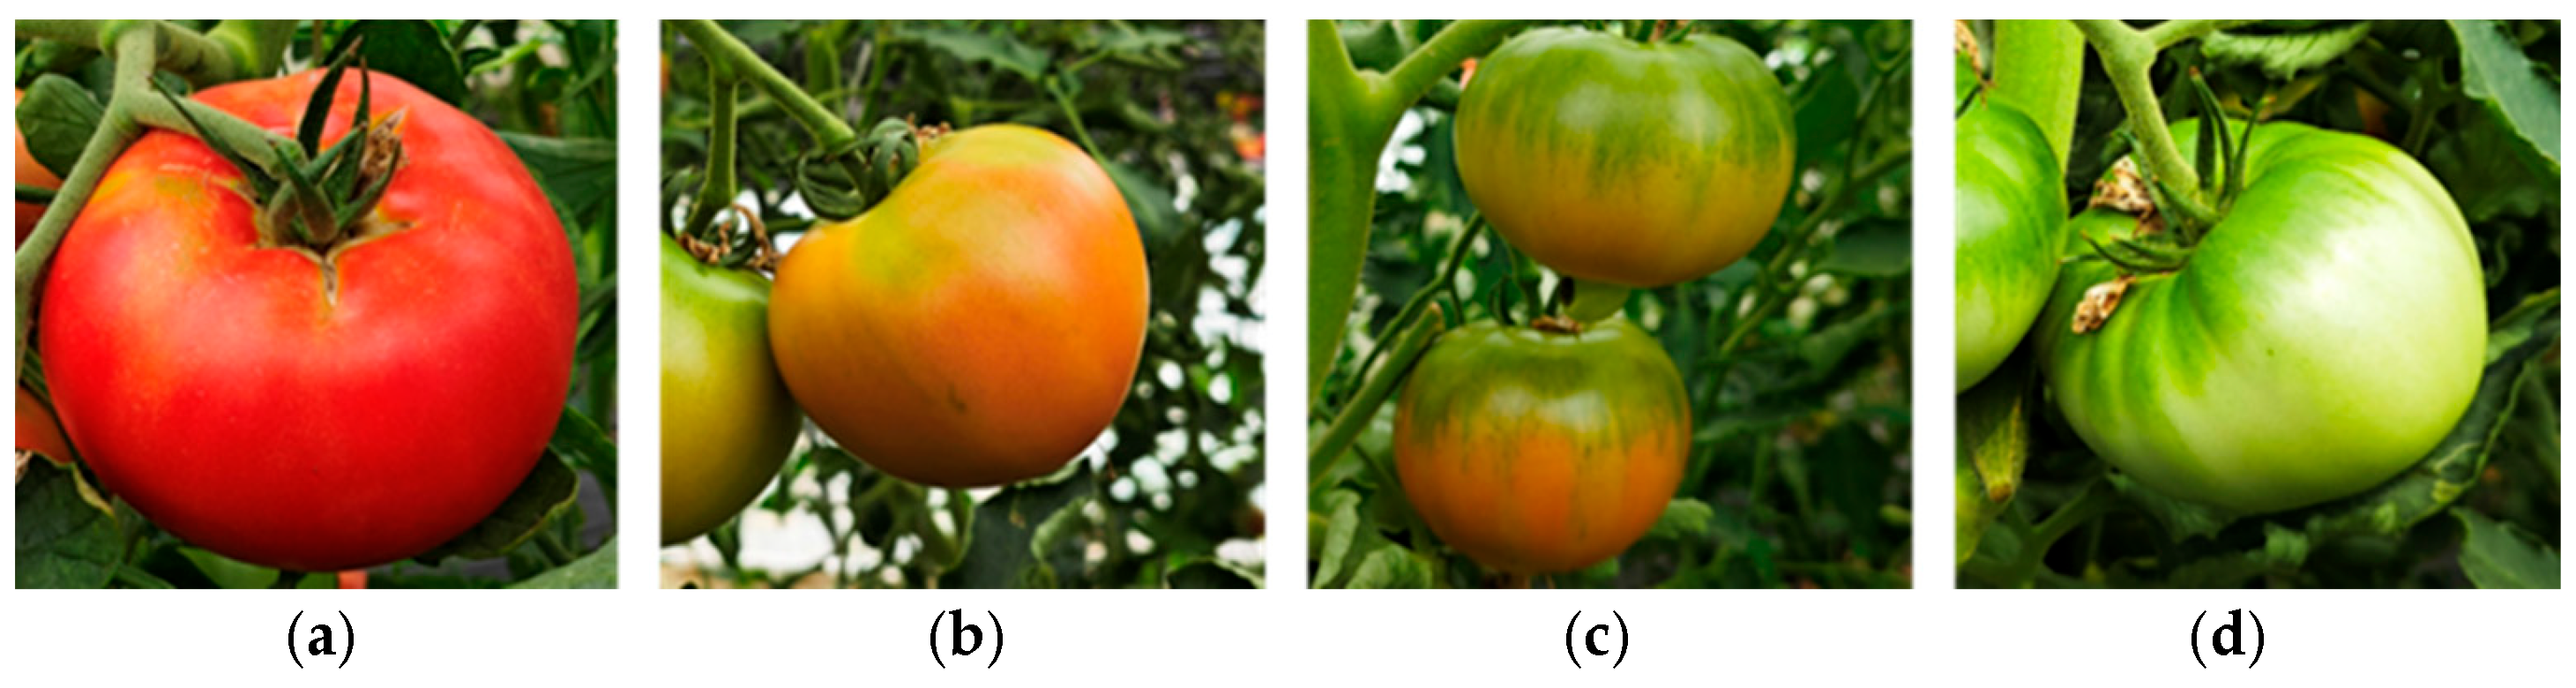
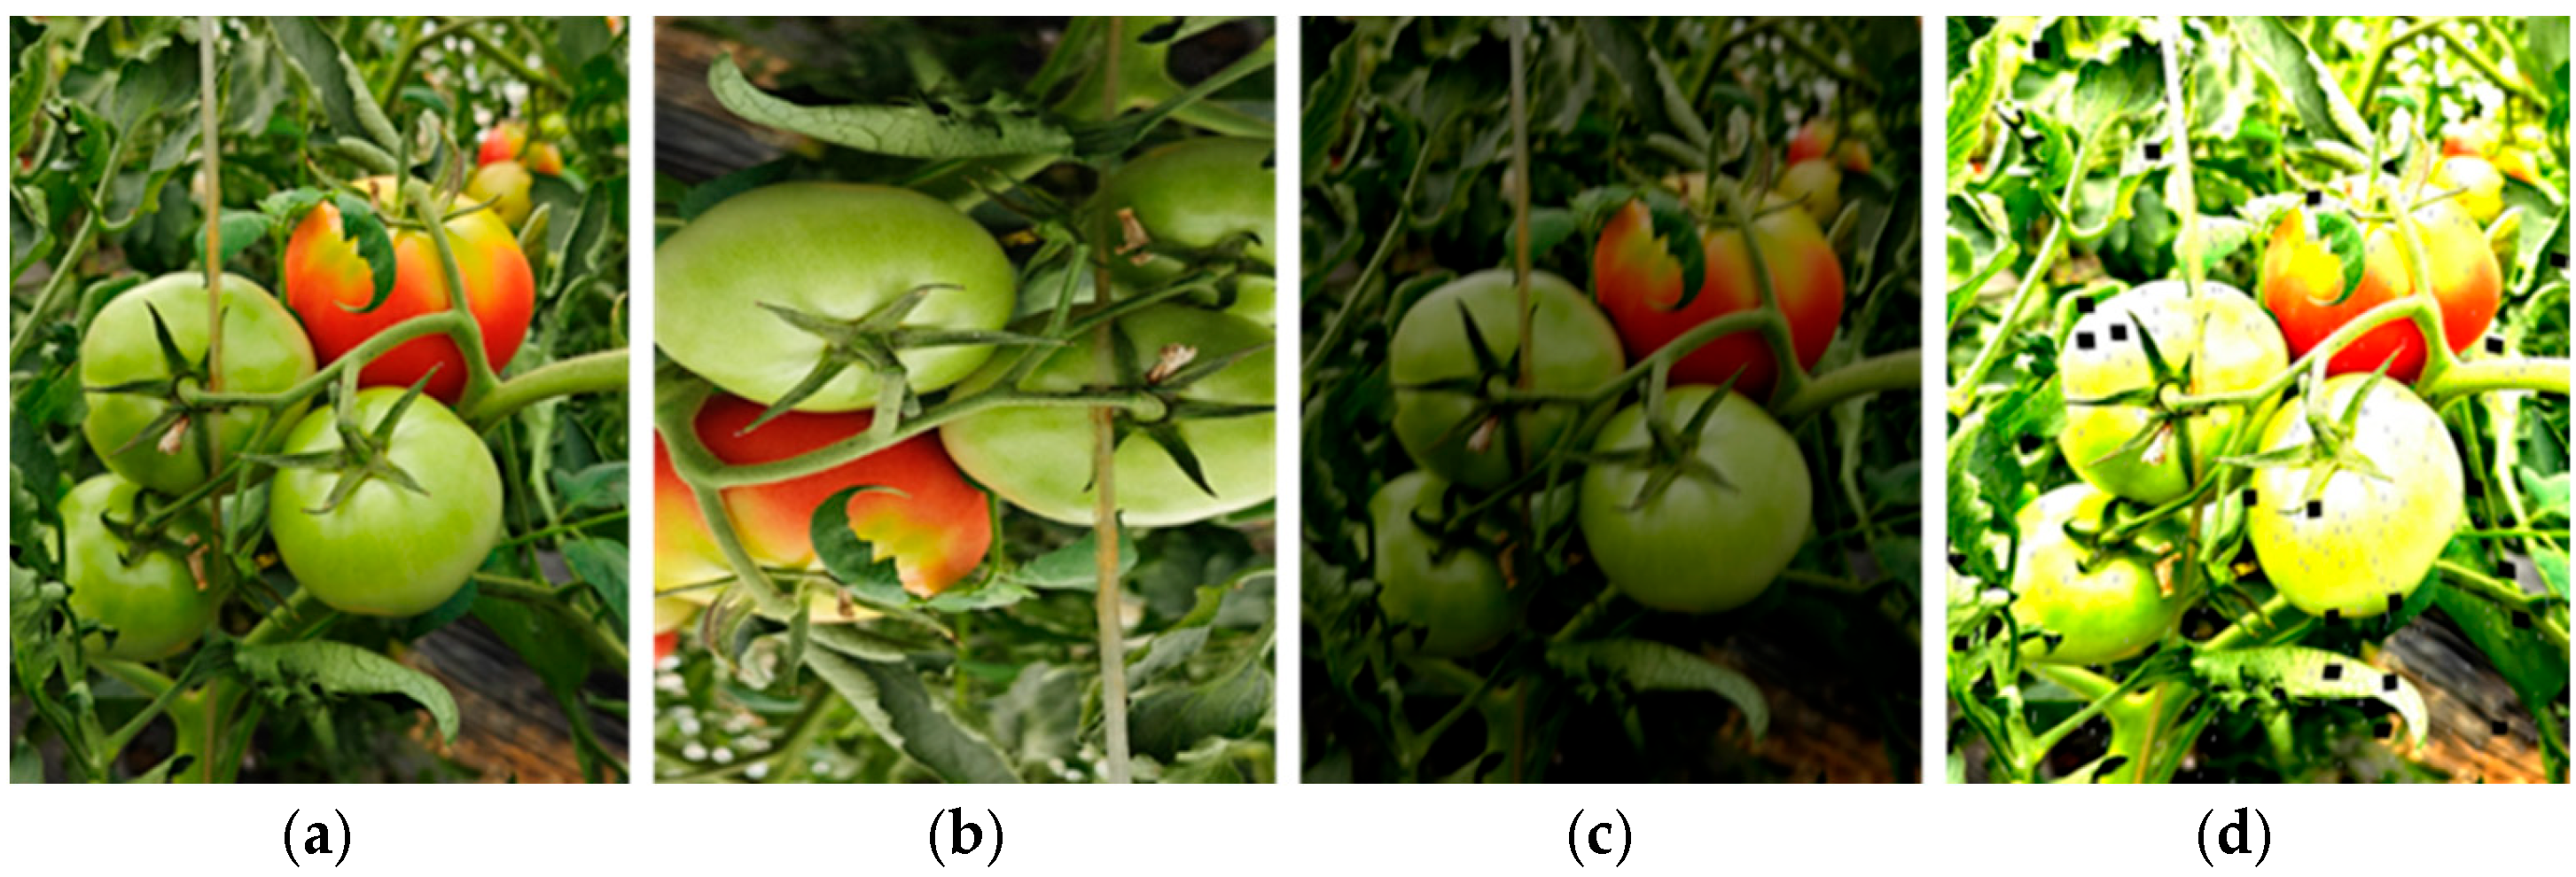
2.1. Image Acquisition

In this study, tomato ripeness is primarily determined by color, as illustrated in Figure 1. When tomatoes first fruit, their skin is white-green. During the green mature stage, the white color fades, and green predominates. Both the unripe and green mature stages are classified as unripe, as tomatoes should not be harvested during this period. In the coloring stage, the fruits begin to exhibit orange-red hues, with a gradual transition from green to orange-red. This stage is referred to as the turning color stage, which is suitable for natural ripening during long-distance transportation. In the early and middle stages of red ripeness, the skin is predominantly red, with some orange and a small amount of green, and these stages are classified as the turning ripe stage, appropriate for short-distance transport and sale. In the late stage of red ripeness, the tomato skin is fully red, which is classified as the fully ripe stage, suitable for immediate market sales. Therefore, this study classifies tomato ripeness into four stages: unripe, turning color, turning ripe, and fully ripe.
The tomato image dataset was collected from the fruit and vegetable cultivation demonstration park in Jiangwang Town, Yangzhou City, Jiangsu Province, China, using a Xiao Mi 13 (Xiaomi Corporation, BeiJing, China) smartphone as the data collection device. The images were captured under various environmental conditions, including natural lighting, fruit stacking, occlusion by branches and leaves, and a combination of different ripeness stages. A total of 1432 images were initially collected, and, following data augmentation, the dataset was expanded to 5728 images. The dataset contains 761 fully ripe tomatoes, 3752 turning ripe tomatoes, 3561 turning color tomatoes, and 3389 unripe tomatoes, totaling 11,463 tomatoes.

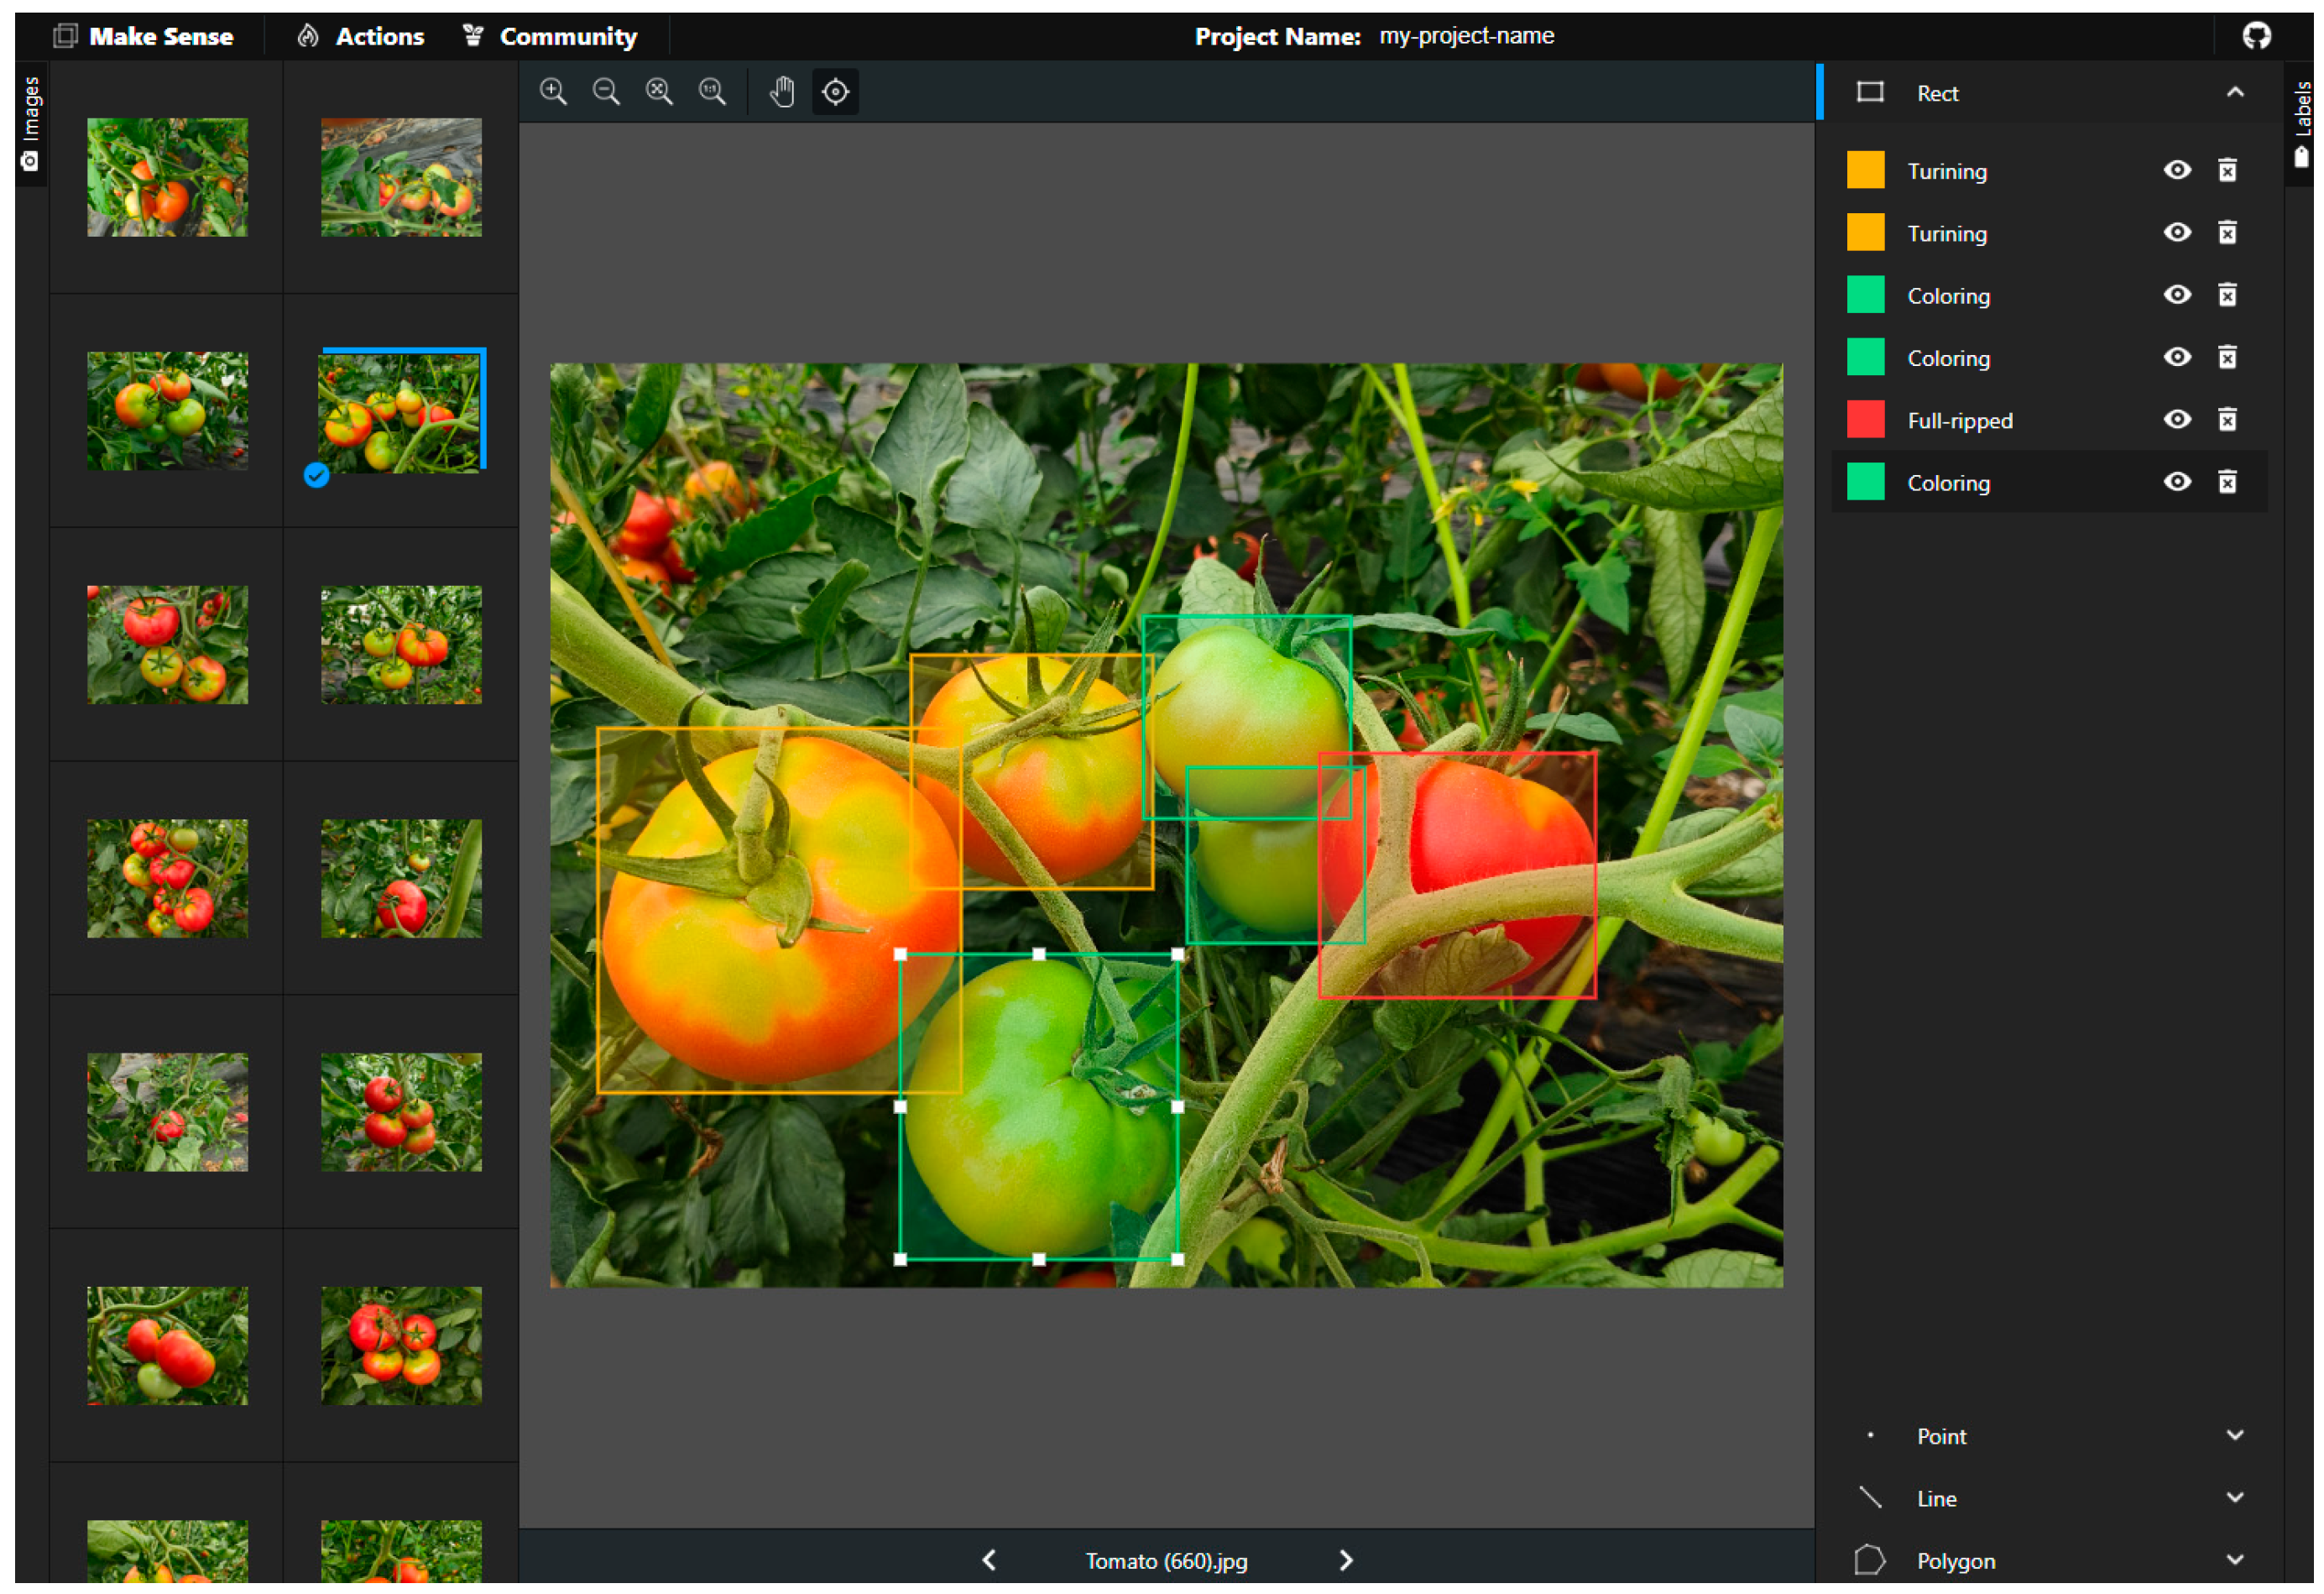
2.2. Dataset Construction

To enhance the diversity of training samples, various augmentations were applied, including random image scaling and rotation, mirroring, translation, and contrast and brightness adjustments, as well as the addition of noise at varying ranges and sizes, as illustrated in Figure 2. These augmentations increased the dataset to a total of 5728 images. The dataset was subsequently divided into training, validation, and test sets in a 7:2:1 ratio. Tomato images were manually annotated using the image labeling tool “Make Sense” (https://www.makesense.ai/), accessed on 24 June 2024. Make Sense is an intuitive and lightweight online tool that requires no deployment or environment setup, with the annotation interface shown in Figure 3. Unlike the widely used Labelme tool, Make Sense allows for the direct export of labeled tomato image data in the TXT format required by the YOLO algorithm, thereby eliminating the need for format conversion and improving efficiency. To ensure annotation accuracy and validity, tomatoes that were more than two-thirds occluded were excluded from the labeling process. The annotations were then exported in TXT format. In this study, the labels corresponded to the ripeness stages of the tomatoes.

3. Experimental Methods
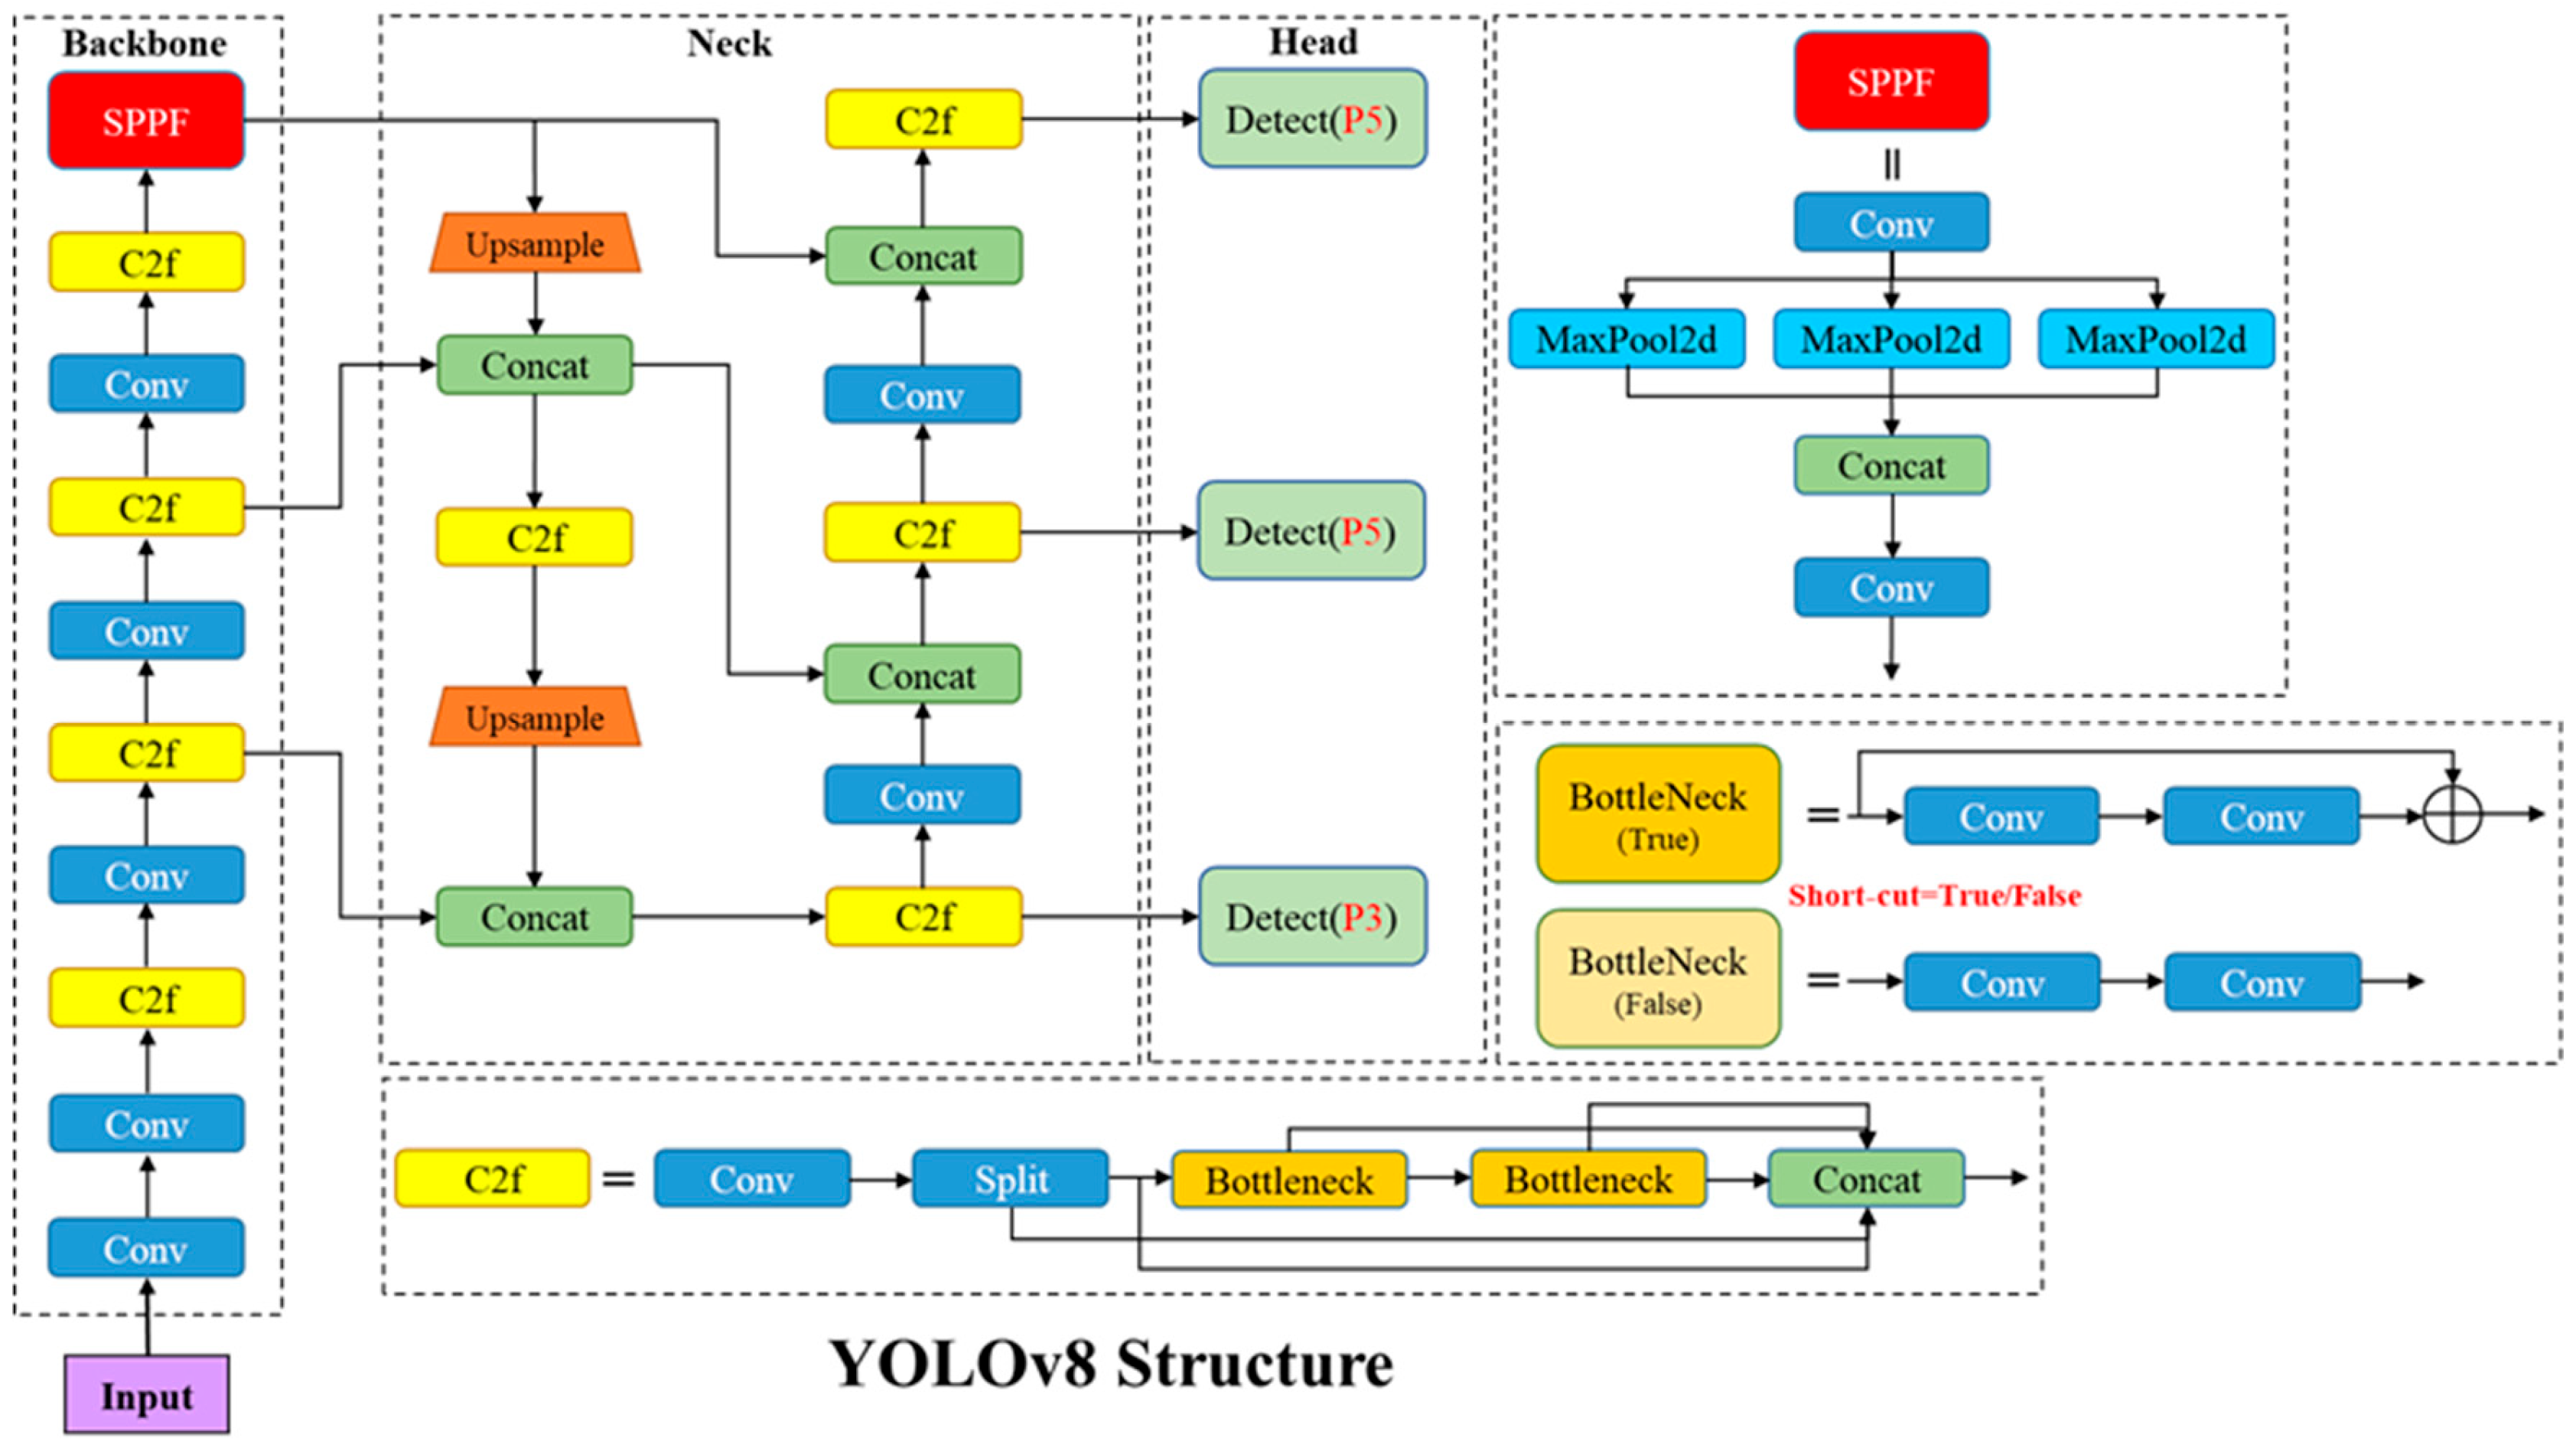
3.1. YOLOv8 Model

The YOLOv8 architecture comprises five variants: YOLOv8n, YOLOv8s, YOLOv8m, YOLOv8l, and YOLOv8x. The primary distinctions between these variants lie in the depth and width of feature extraction. Compared to YOLOv5, YOLOv8 introduces two major improvements. First, the detection head is replaced with a decoupled head, transitioning from Anchor-Based to Anchor-Free; second, it utilizes the Task-Aligned Assigner matching strategy and incorporates DFL loss alongside CIoU loss for classification [18]. By contrast, the YOLOv10 model emphasizes optimizations in feature fusion and scale invariance. However, it struggles with detecting small objects in cluttered environments, and its high complexity makes it less suitable for deployment on mobile devices. Therefore, this study selects YOLOv8n as the base network due to its balanced performance and moderate complexity, making it ideal for mobile deployment. The YOLOv8 network architecture is illustrated in Figure 4.

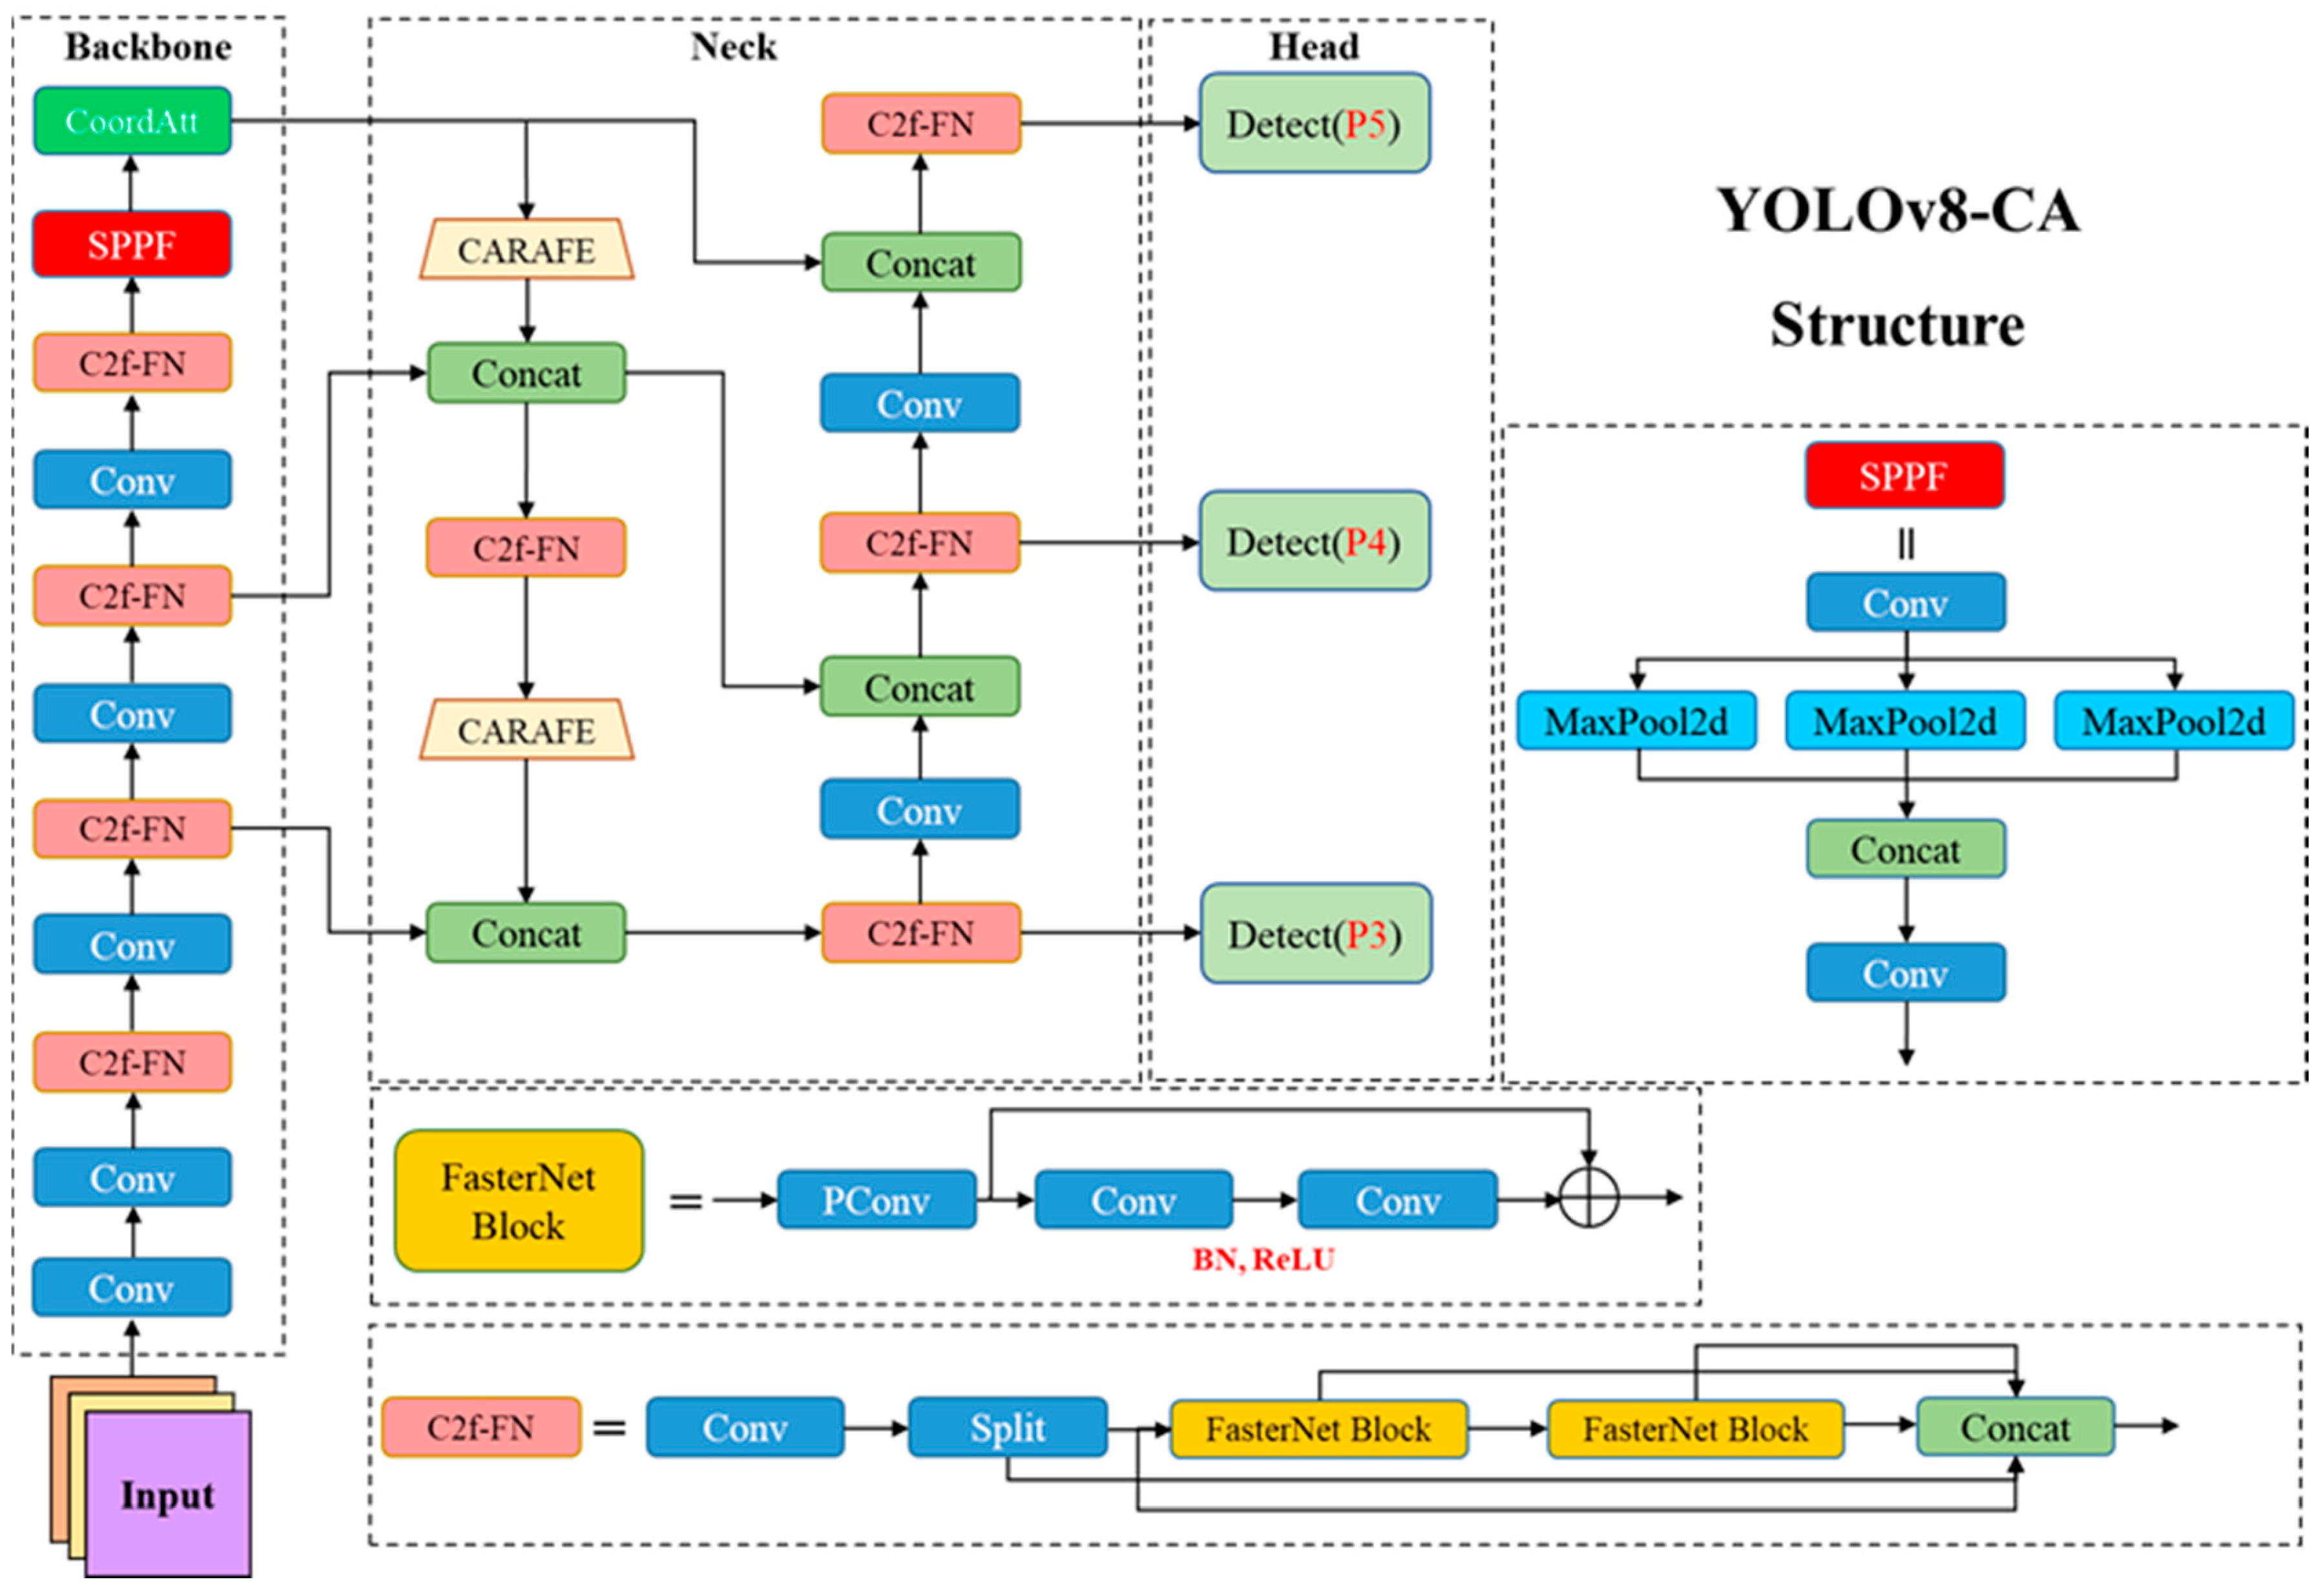
3.2. YOLOv8-CA Model
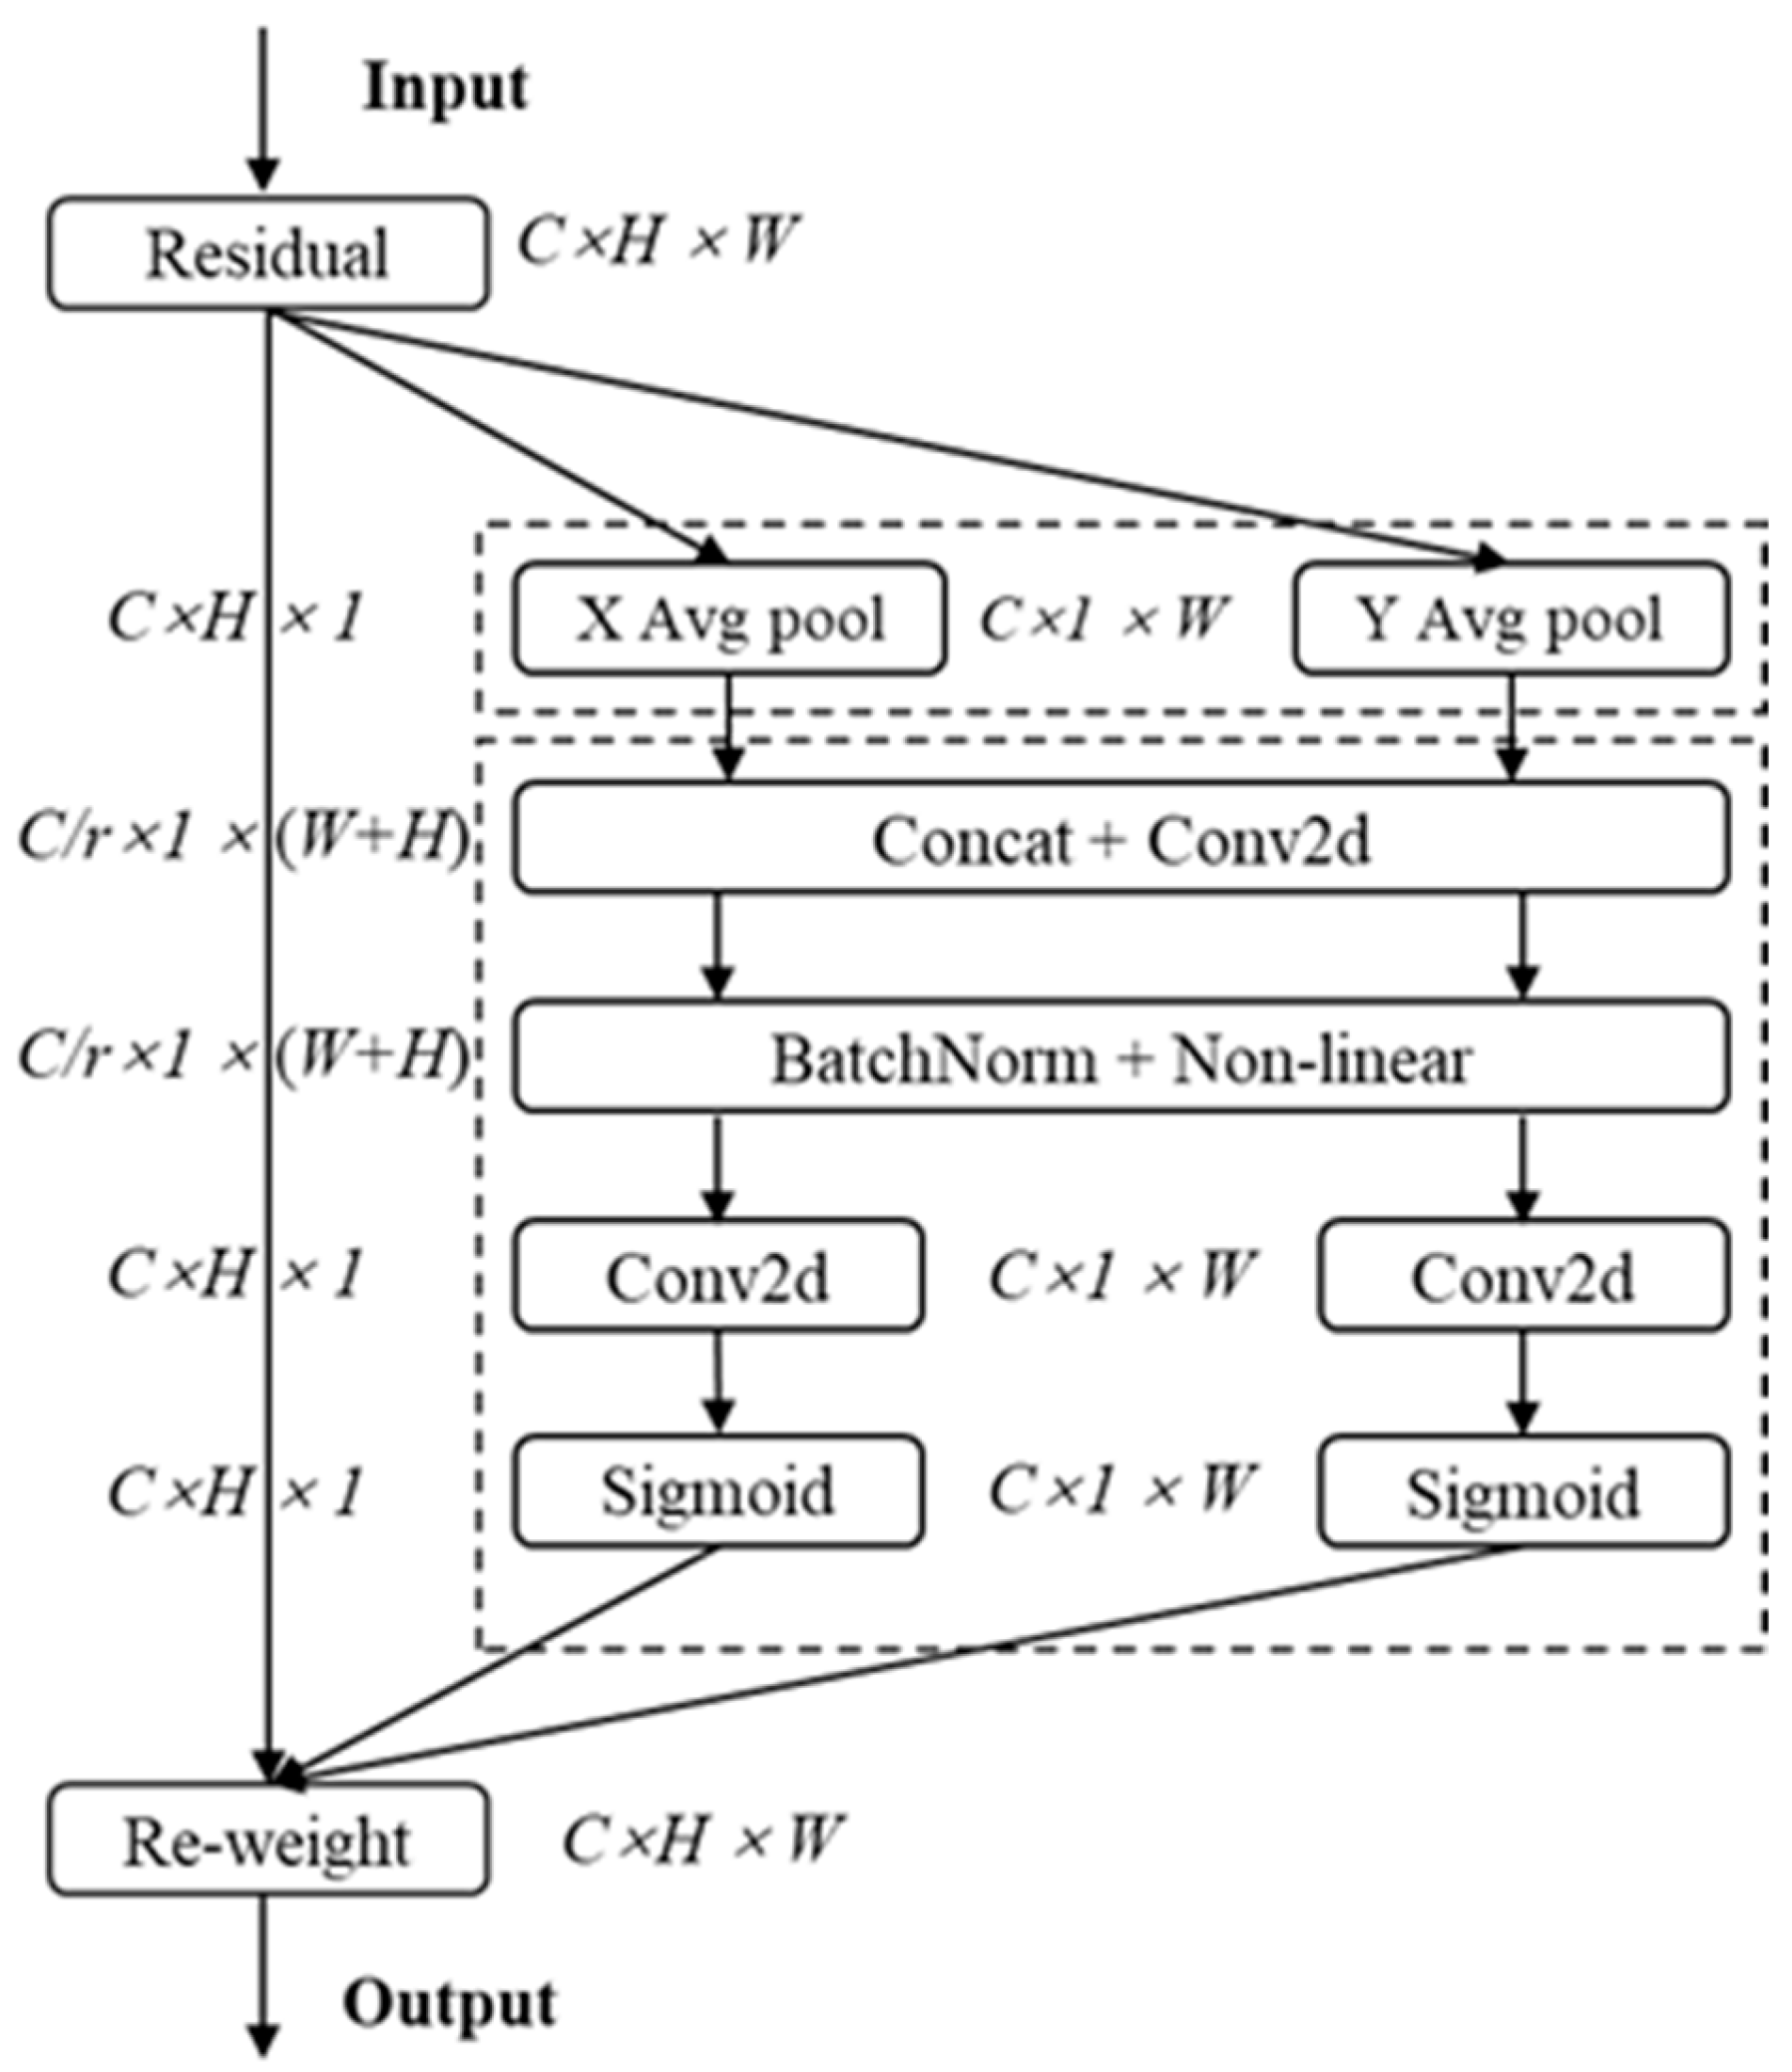
3.2.1. CA Mechanism

Tomato fruits are relatively small, which leads to low detection accuracy. Additionally, each plant typically bears numerous fruits, with occlusions between adjacent fruits and obstructions caused by branches or leaves, as well as variations in ripeness among neighboring fruits. To address the challenge of accurately determining the ripeness of tomatoes in complex backgrounds, the CA mechanism was integrated into the YOLOv8n model. This mechanism incorporates not only channel information but also directional and location-specific information, enabling the model to focus more on the tomatoes themselves while reducing attention to irrelevant background elements. Furthermore, the CA mechanism is both flexible and lightweight.
The CA mechanism module was added after the SPPF layer [19], effectively eliminating redundant background features and concentrating on the tomato fruit detection area. It is connected to the CARAFE up-sampling technique to reduce computational complexity at high resolutions, thereby enhancing the precise localization of tomatoes. By embedding positional information into the channel attention, the CA mechanism enables the network to focus more effectively over larger regions while reducing computational overhead. The CA mechanism decomposes channel attention into two parallel one-dimensional feature encoding processes, integrating spatial coordinate information into the attention map. These two feature maps are encoded into two attention maps that capture long-range dependencies in the spatial direction of the input feature map, preserving positional information. These attention maps then enhance the representational power of the input feature map, improving feature extraction for target detection, reducing both false negatives and false positives, and maintaining the relationship between input and output to accurately capture textures and contours at various levels. The structure is shown in Figure 5. By embedding coordinate information, the model gains a better understanding of the positional context of the input data, thereby improving task performance.

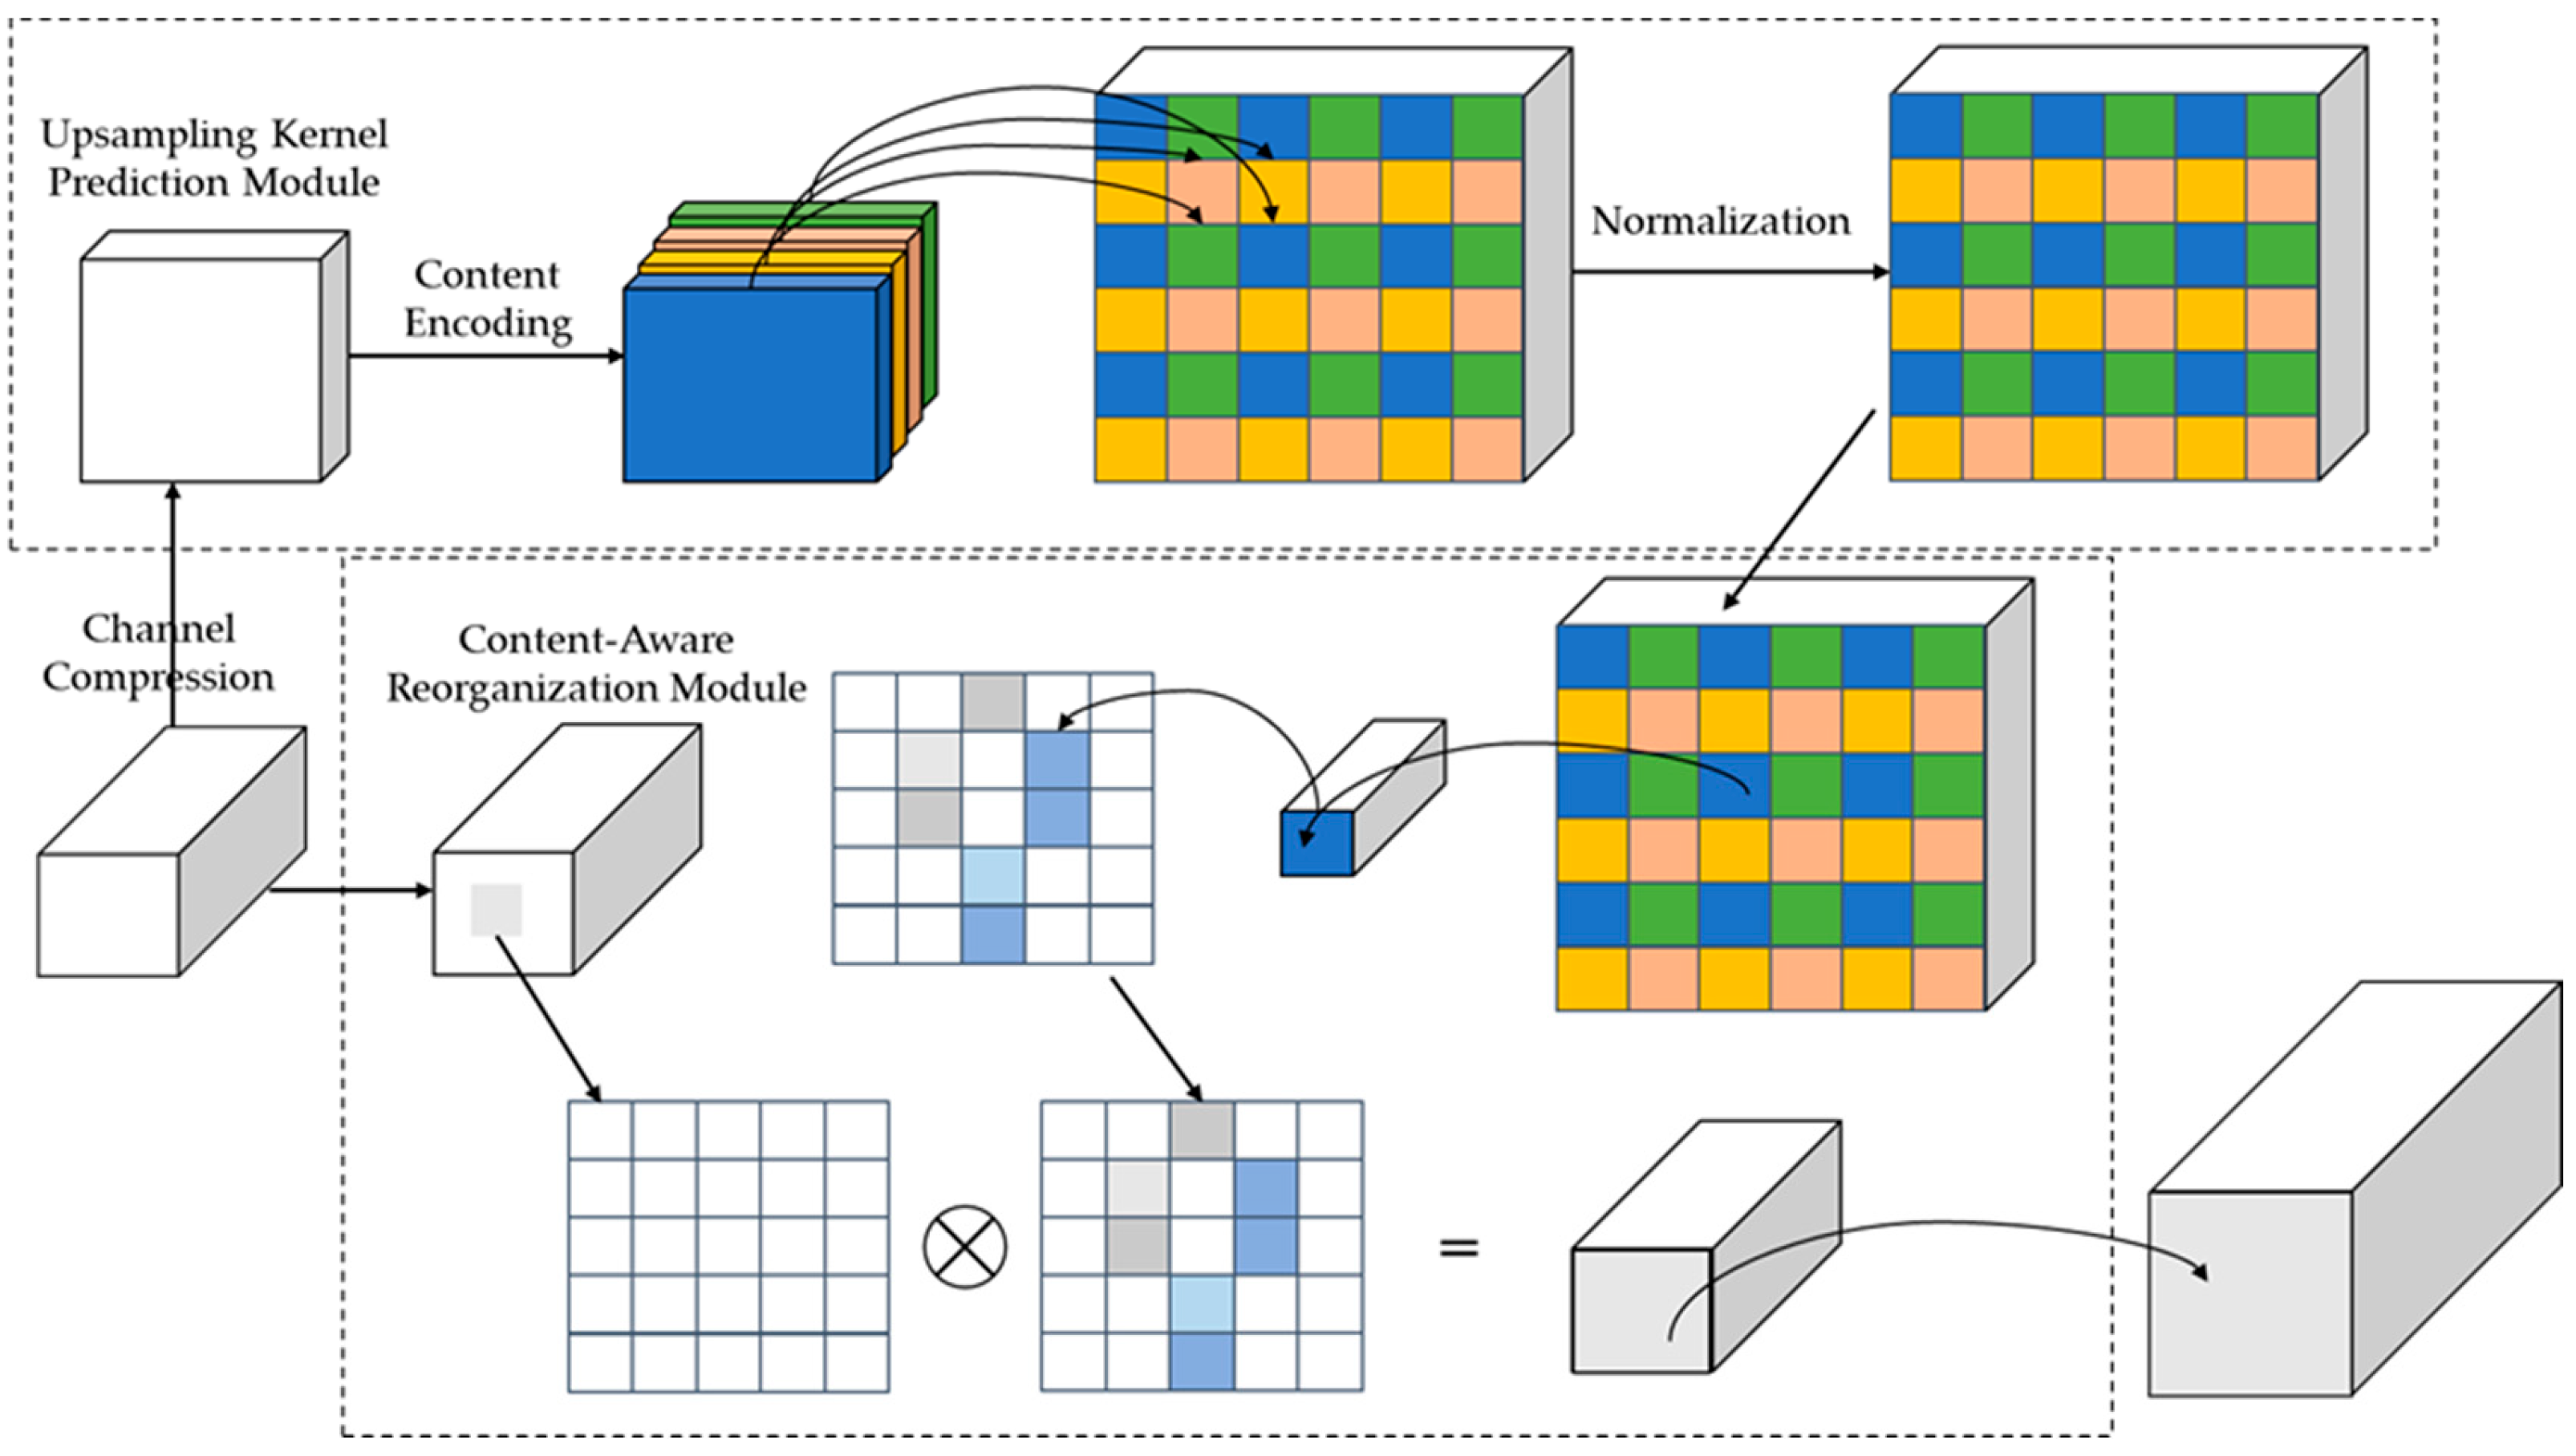
3.2.2. CARAFE Up-Sampling

The YOLOv8 model employs the nearest neighbor method for up-sampling, where the sampling kernel is determined solely by the spatial positions of the pixels. This approach can lead to image blurring and does not fully leverage the available feature information. To address this issue, this study integrates the lightweight CARAFE up-sampling operator, which features a larger receptive field, allowing it to capture a broader range of tomato-specific features. CARAFE [20] utilizes feature-aware reorganization for up-sampling, associating the up-sampling kernel with feature map information to enhance the model’s perception of tomato fruits. Due to its low computational overhead, CARAFE helps maintain the model’s efficiency and lightweight design. The CARAFE structure effectively preserves image details through efficient up-sampling operations, improving the model’s ability to accurately recognize tomato fruit features.
As shown in Figure 6, the CARAFE operation process consists of two main components: the up-sampling kernel prediction module and the content-aware reorganization module. First, the feature map is compressed through convolution, followed by content encoding and up-sampling kernel prediction. The predicted up-sampling kernel is then normalized to ensure that its convolutional weights sum to 1. In the content-aware reorganization module, each position in the output feature map is mapped back to the input feature map, from which the central region is extracted. The dot product of the extracted region and the predicted up-sampling kernel at that position produces the output value. Different channels at the same position share the same up-sampling kernel, resulting in the final output feature map.

3.2.3. C2f-FN Feature Extraction Module

Tomato growth environments in non-standard farmland are often highly disordered, characterized by dense branches, foliage, and a large number of fruits, leading to significant occlusion. Overcast or rainy weather, coupled with low light conditions, can further complicate the image capture process, often resulting in motion blur. Under such conditions, convolutional neural networks may incorporate redundant features and noise during feature extraction, which can hinder the model’s ability to accurately identify the ripeness of tomato fruits.
Eliminating redundant features and reducing model complexity are crucial for improving detection accuracy. FasterNet [21] introduces a simple and efficient partial convolution (PConv) technique that reduces computational redundancy without affecting the variability of other channels. Built upon the FasterNet block module, FasterNet demonstrates strong performance in detection and classification tasks, as shown in Figure 7a. This study integrates the FasterNet block concept into the C2f module of YOLOv8, creating a new C2f-FN module for feature extraction in tomato ripeness detection. The modified model reduces both the parameter count and computational complexity while maintaining an adequate receptive field and non-linear representation capabilities. Its structure is illustrated in Figure 7b.

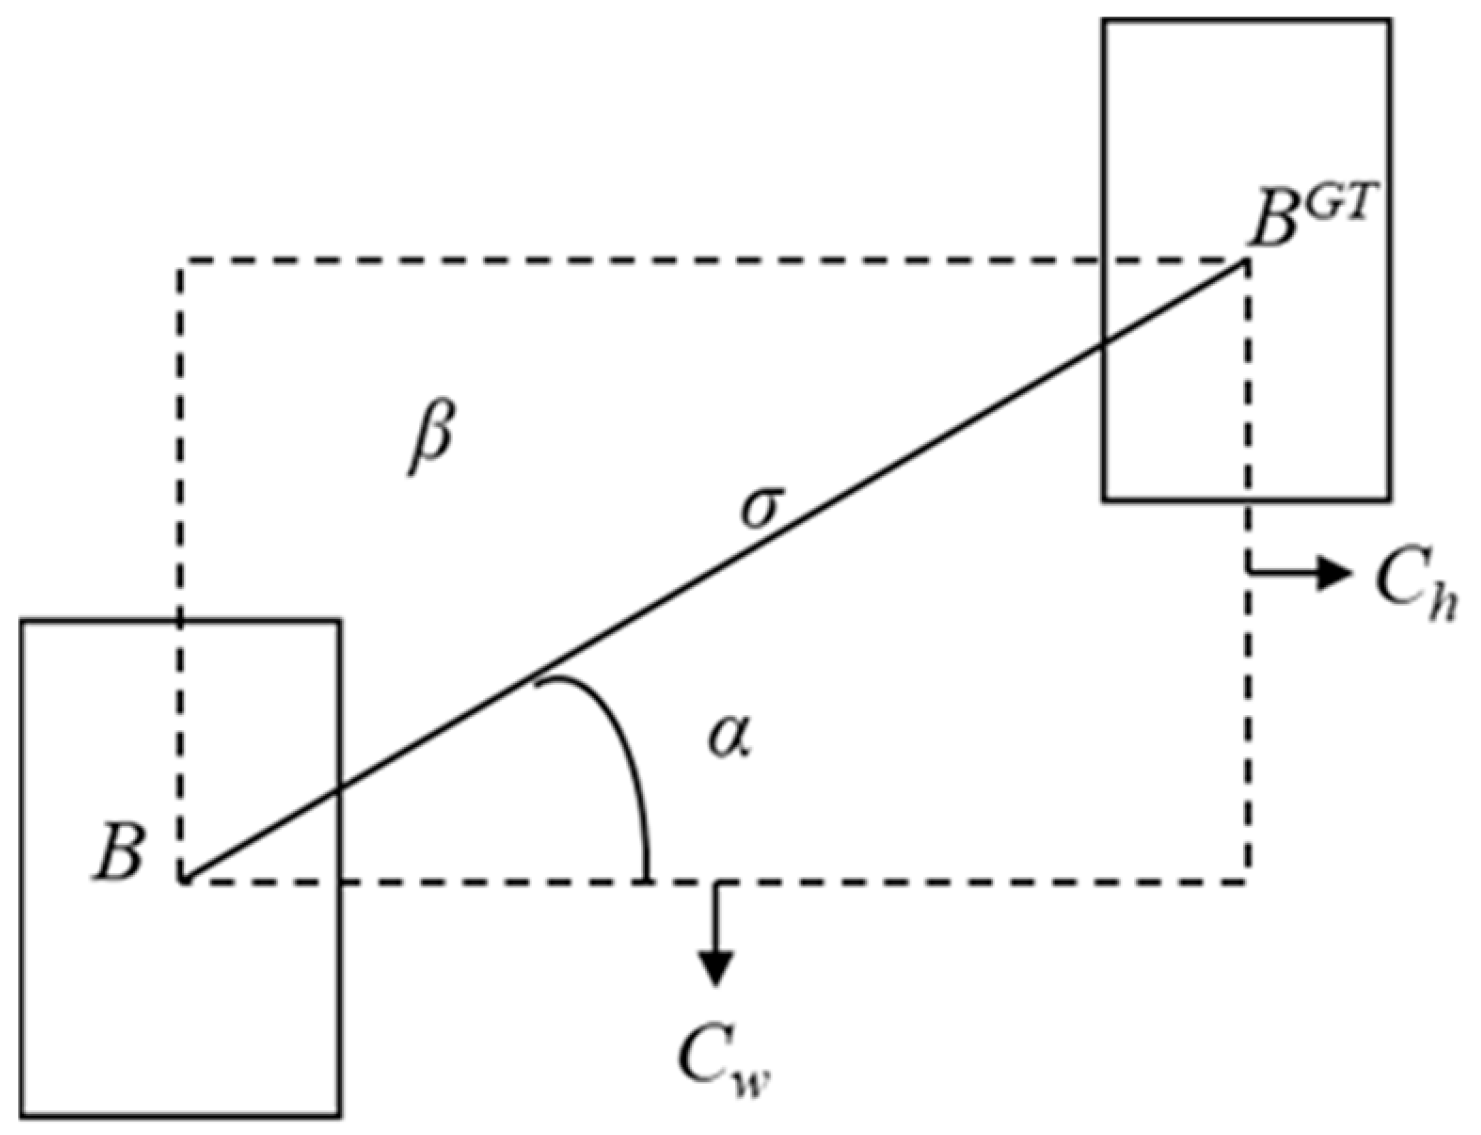
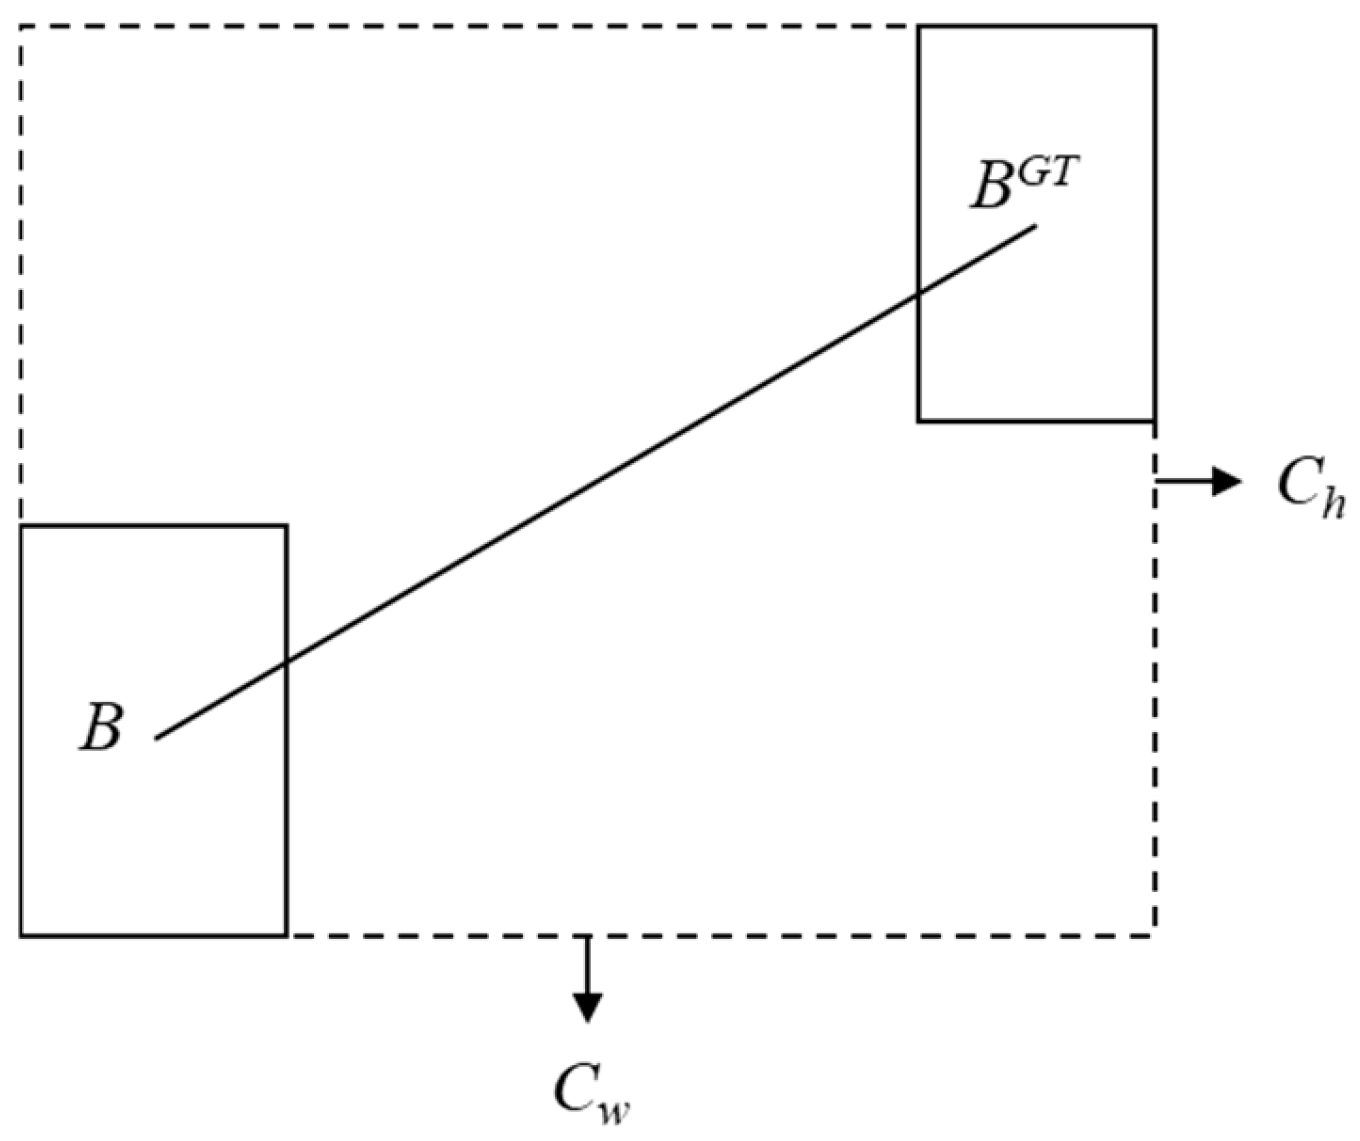
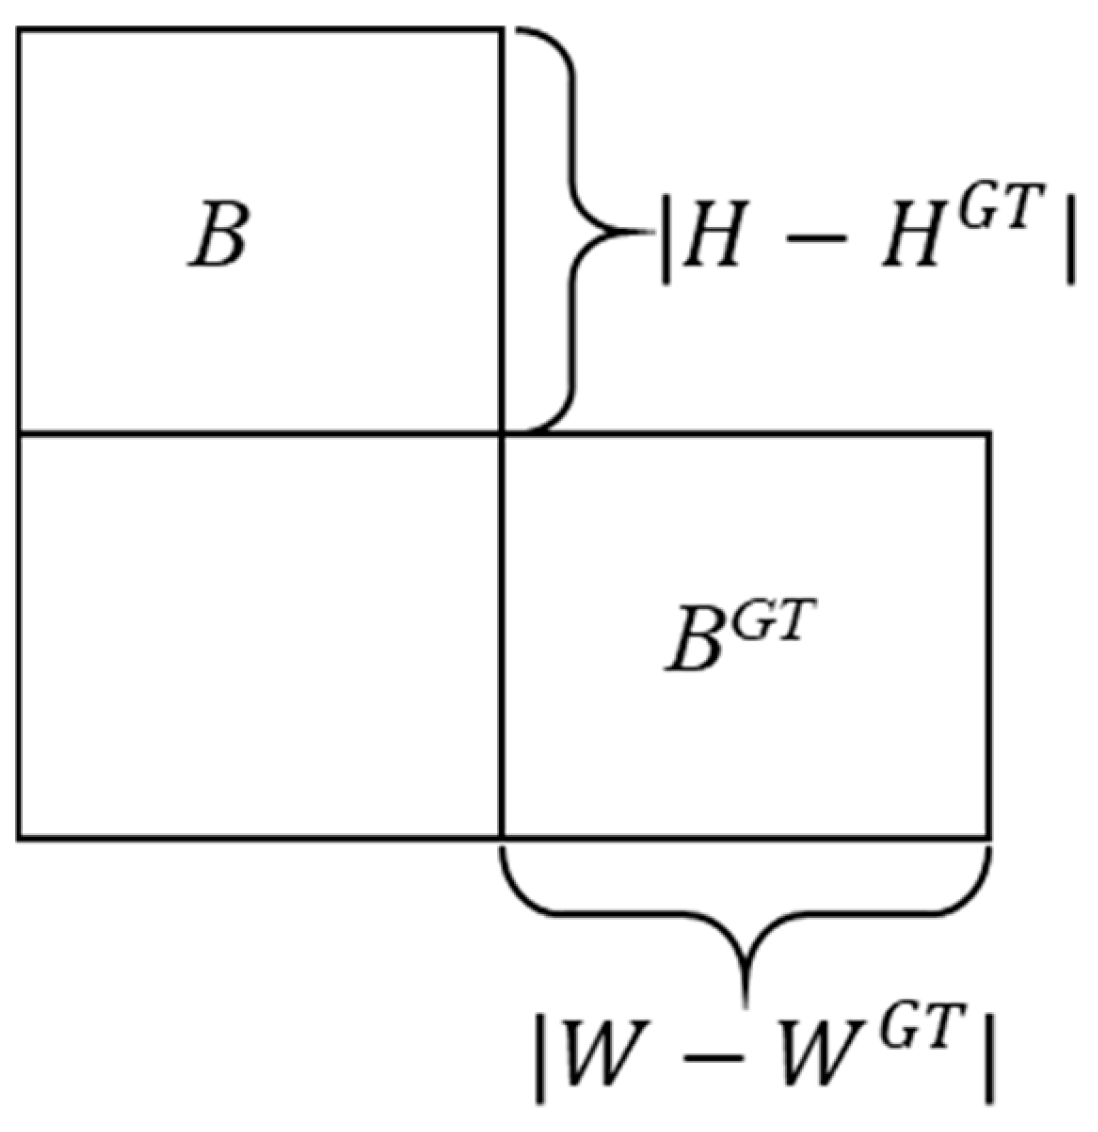
3.2.4. SIoU Loss Function

YOLOv8 utilizes the Complete Intersection over Union (CIoU) as the loss function for bounding box regression. However, CIoU does not consider the directional alignment between the predicted and ground truth boxes. To overcome this limitation, this study introduces the Scaled Intersection over Union (SIoU) [22] as an alternative loss function for bounding box regression. SIoU extends CIoU by incorporating additional scale factors, which improve the matching of boxes of varying sizes. This is especially advantageous for detecting small objects, such as distant tomatoes. By accounting for scale differences, SIoU substantially enhances the detection accuracy of small targets.
SIoU consists of four components: angle loss (Λ), distance loss (Δ), shape loss (Ω), and intersection-over-union loss (U). In Figure 8, B denotes the predicted bounding box, while BGT represents the ground truth bounding box. The symbol σ denotes the distance between the centers of the predicted and ground truth boxes. Ch refers to the vertical distance, and Cw refers to the horizontal distance between the centers of the predicted and ground truth boxes. The terms arcsin (Ch/σ) and arcsin (Cw/σ) are represented by α and β, respectively.
The formula for calculating angle loss (Λ) is as follows:
Λ = 1 2 s i n 2 arcsin x π 4
x = C h σ = s i n   ( α )
In the above calculation, if α ≤ π/4, minimization is applied to α; otherwise, minimization is performed on β.
In Figure 9, Cw and Ch denote the width and height of the minimum enclosing rectangle for the ground truth and predicted bounding boxes, respectively. Based on the angle loss (Λ), the formula for calculating the distance loss (Δ) is defined as follows:
Δ = t = x , y ( 1 e γ p t )
where
p x = ( b c x g t b c x C w ) 2 ,   p y = ( b c y g t b c y C h ) 2 ,   γ = 2 Λ
As α approaches 0, the contribution of the distance cost diminishes. Conversely, as α approaches π/4, the contribution of the distance cost increases. As the angle increases, the processing difficulty also rises. Therefore, γ should be assigned greater priority in terms of distance values as the angle increases.
In Figure 10, H and W represent the height and width of the predicted bounding box, while HGT and WGT denote the height and width of the ground truth bounding box, respectively. The shape loss (Ω) is defined as follows:
Ω = t = w , h ( 1 e w t )
where
ω w = w w g t m a x   ( w ,   w g t ) ,   ω h = w h g t m a x   ( h ,   h g t )
Here, the parameter θ controls the degree of emphasis on the shape loss. To avoid overemphasis on shape loss, which could compromise the adjustment of the predicted bounding box, the value of θ is constrained to the range of 2 to 6. w and h represent the width and height of the predicted bounding box, while wgt and hgt denote the width and height of the ground truth box.
The SIoU loss function is defined as follows:
L S I o U = 1 U + Δ + Ω 2
I o U = B B G T B B G T
With these improvements, we propose the YOLOv8n-CA model, an enhanced version of YOLOv8n, as illustrated in Figure 11.

4. Experimental Results

4.1. Experimental Parameters and Evaluation Metrics

The experimental platform is equipped with an Intel Core i7-14700KF CPU (Intel Corporation, Santa Clara, CA, USA), 32 GB of RAM, and an NVIDIA RTX 4070S GPU (NVIDIA Corporation, Santa Clara, CA, USA) with 12 GB of VRAM. The experiments were conducted on a Windows 11 operating system, with Python 3.8 as the programming language and PyTorch as the deep learning framework for training and testing the tomato fruit maturity detection task. The training parameters were set as follows: input image size of 640 × 640, a total of 300 training iterations, batch size of 8, learning rate of 0.001, and the Mosaic data augmentation feature of the model was disabled. The IoU threshold for both training and testing was set to 0.5. To ensure experimental fairness, all baseline models were trained with the same batch size and configuration, and the Mosaic data augmentation was similarly disabled. All other parameters were left at their default values. Furthermore, ablation studies were conducted to assess the effectiveness of the YOLOv8n-CA model. Finally, the YOLOv8n-CA model was compared with several other state-of-the-art object detection models to validate its performance.
This study evaluates model performance using several metrics, including precision, recall, mean average precision at an IoU threshold of 0.5 (mAP@0.5), the number of parameters, model weight size, and floating point operations per second (FLOPs).
Precision is defined as the proportion of correctly predicted positive samples among all samples predicted as positive by the model. Recall is defined as the proportion of correctly predicted positive samples among all actual positive samples. Average precision (AP) is the mean of precision values at different recall levels. The mean average precision (mAP) represents the average precision across various recall thresholds and is equivalent to the average area under the P-R (precision-recall) curve. The corresponding expressions are given in Equations (9)–(12) as follows:
P r e c i s i o n = T P T P + F P
R e c a l l = T P T P + F N
A P = 0 1 P ( R ) d R
m A P = 1 N i = 1 N A P i

4.2. Experimental Results and Analysis

4.2.1. Comparison of Up-Sampling Modules

To evaluate the effectiveness of CARAFE up-sampling on the dataset, a comparative experiment was conducted using DySample [23], an ultra-lightweight and efficient dynamic up-sampler. The results are presented in Table 1. Both CARAFE and DySample up-sampling techniques were applied while retaining other improvements. The findings show that, although DySample up-sampling has lower parameter count, computational complexity, and model size, its mAP is also lower. While DySample up-sampling demonstrates favorable lightweight characteristics, its detection performance is considerably inferior to that of CARAFE up-sampling, indicating its poor adaptability to the tomato dataset.

4.2.2. Ablation Test

To assess the impact of the CA mechanism, CARAFE up-sampling operator, C2f-FN module, and SIoU loss function on model performance, this study sequentially integrated these enhancements into the original YOLOv8n model. Ablation experiments were conducted on all models with the added modules using a custom dataset, and the results are presented in Table 2. The results reveal that individually adding the CA, CARAFE, and C2f-FN modules improved either precision or recall, but the mean average precision (mAP) decreased. This decrease can be attributed to the fact that the complexity of the modified models did not increase significantly, and the imbalance in the number of tomatoes at different ripeness stages in the test set resulted in performance improvements for only one specific ripeness class, causing the overall performance to remain relatively unchanged or slightly reduced. When any two modules were combined, the mAP increased, and experiments 5 and 7 displayed certain lightweight characteristics. This improvement is attributed to the larger receptive field provided by the CA mechanism and the C2f-FN feature extraction module, which enhanced recognition capabilities in complex environments. The model incorporating the C2f-FN module showed reductions in parameter count, computational complexity, and model size, while the CARAFE up-sampling significantly improved the quality of the feature maps, reducing distortion and blurriness, thereby enhancing detection accuracy. Finally, the introduction of all the modules, along with the SIoU loss function, led to a 1.3 percentage point increase in the model’s mAP. Moreover, the model demonstrated a lightweight advantage in terms of parameter count, computational complexity, and model size compared to the YOLOv8n baseline. Overall, the YOLOv8n-CA model exhibited excellent performance in the tomato ripeness classification task, effectively balancing high detection accuracy with a compact model size.

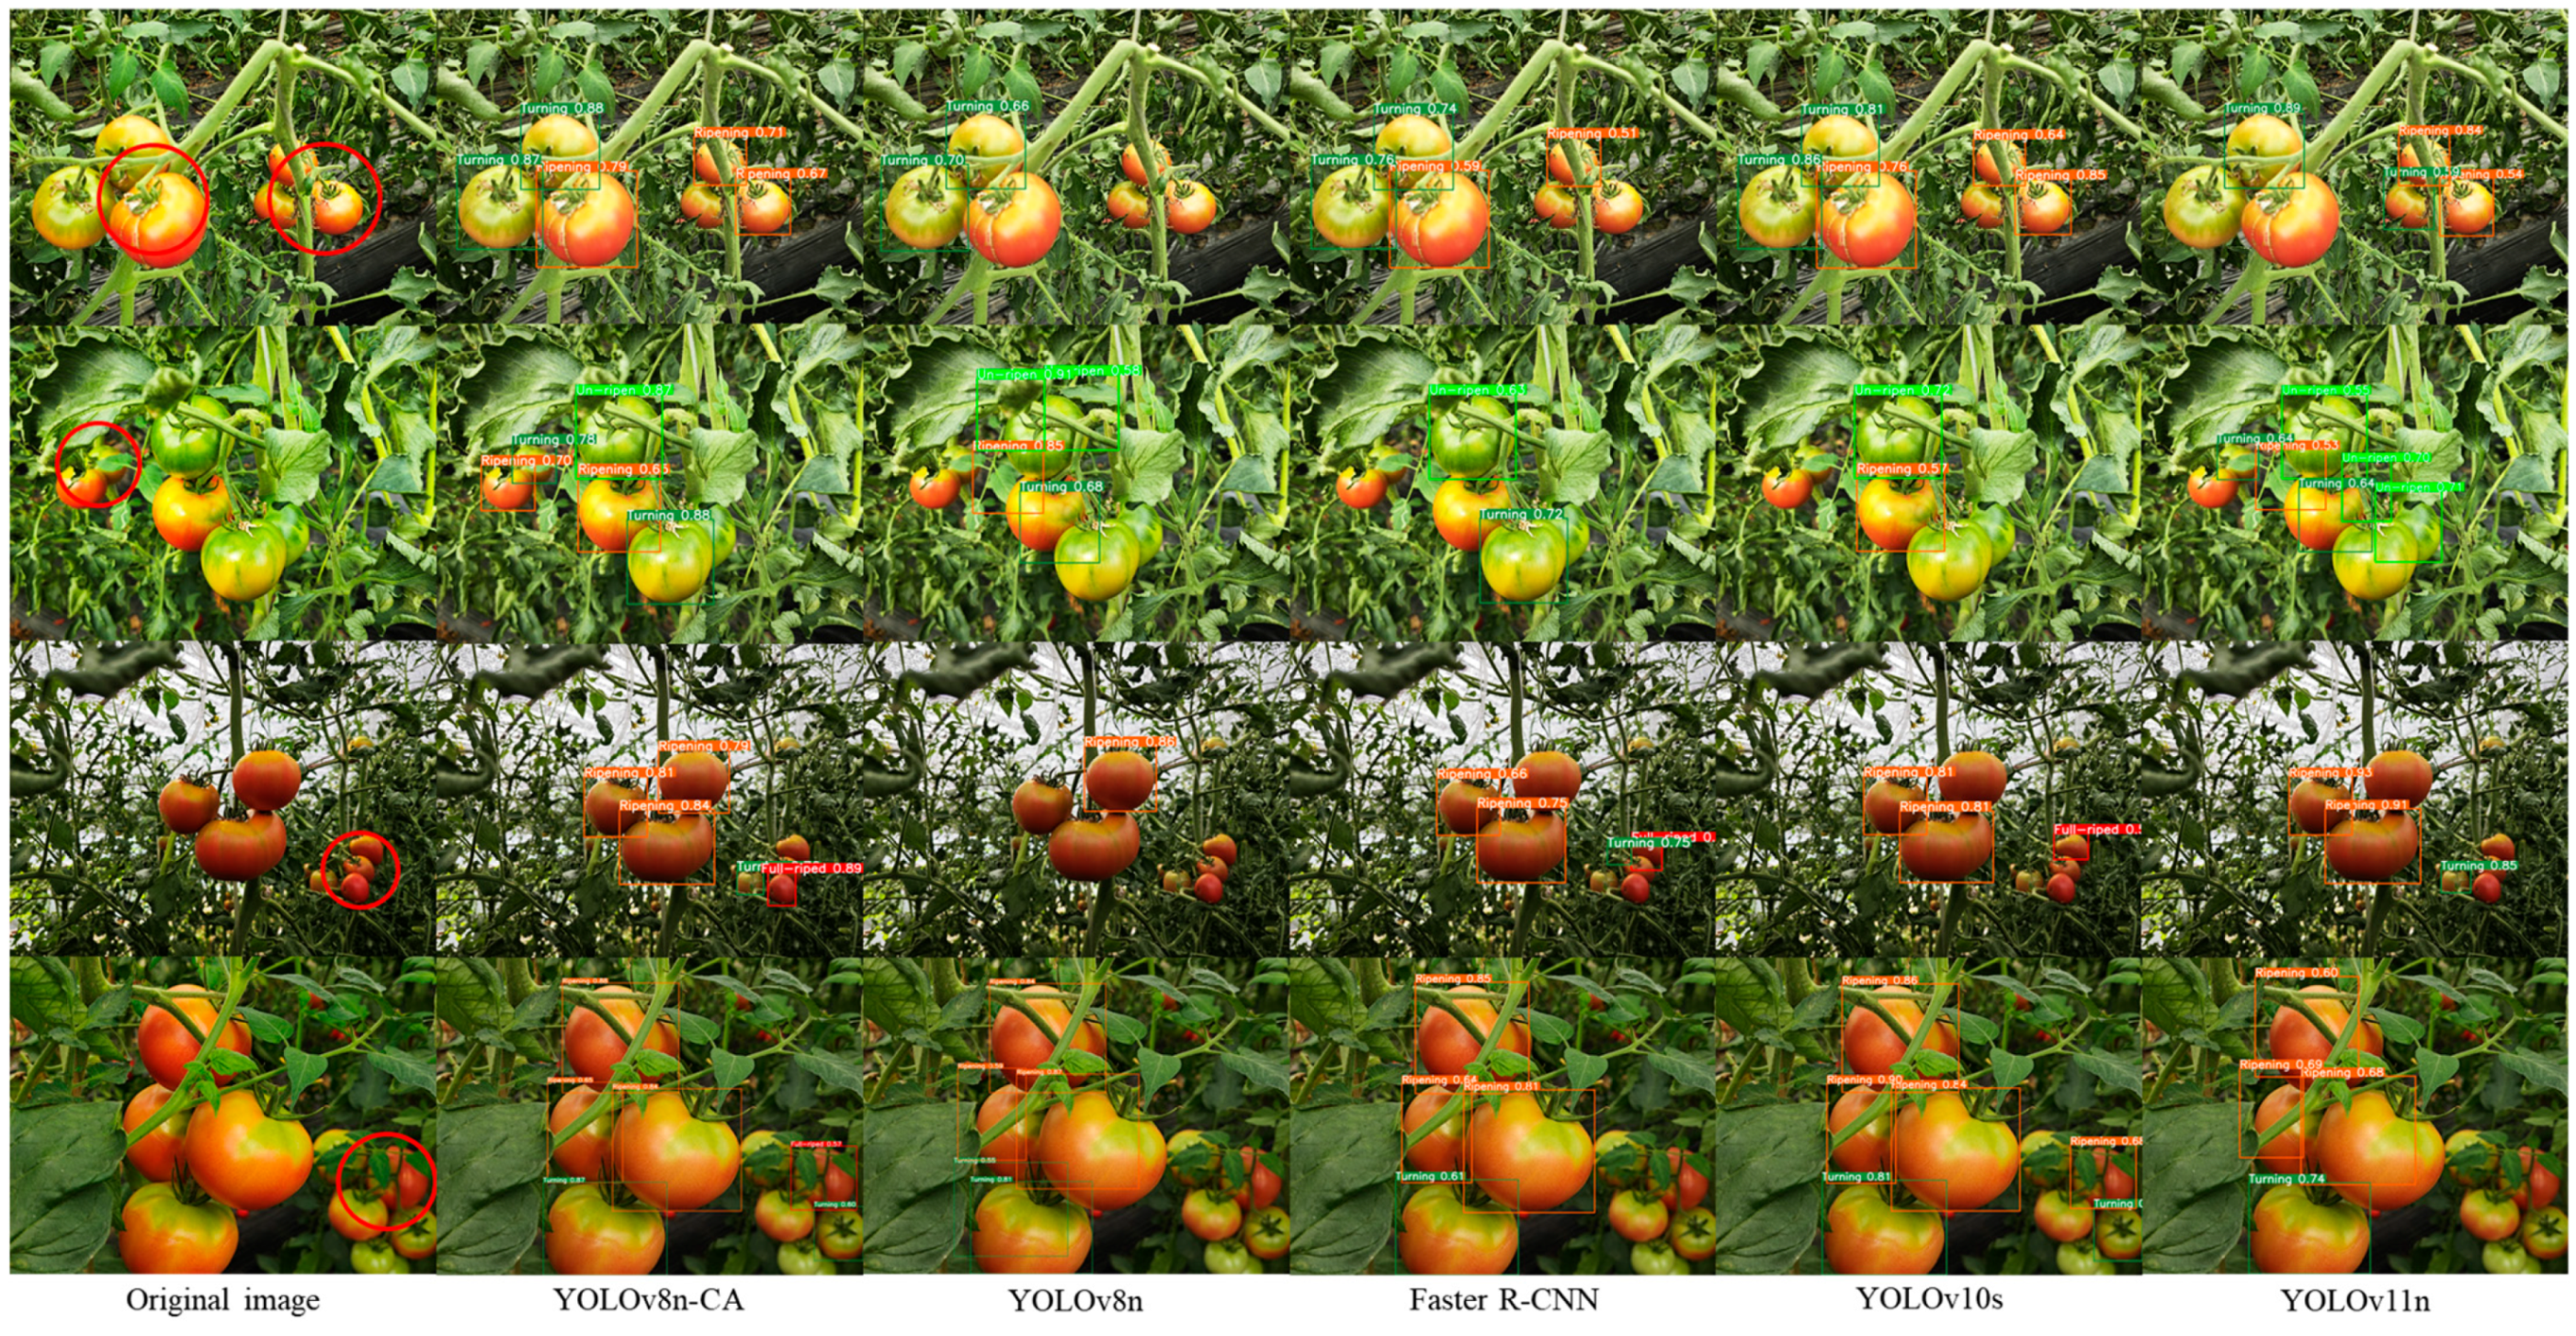
4.2.3. Comparison with Other Object Detection Models

A comparison of the YOLOv8n-CA model with several object detection models, including Faster R-CNN, YOLOv3s, YOLOv5s, YOLOv5m, YOLOv7, YOLOv8n, YOLOv10s, and YOLOv11n, was performed on the test set, with the results presented in Table 3. The findings reveal that, in the tomato ripeness classification task, the YOLOv8n-CA model achieves a higher mAP. The baseline model demonstrates superior lightweight performance, with reductions in parameter count, computational complexity, and model size by 18.7%, 17.3%, and 18.1%, respectively. Overall, the proposed YOLOv8n-CA model surpasses the other models in terms of detection accuracy while maintaining a more compact weight.
This study compares the recognition performance of Faster R-CNN, YOLOv3s, YOLOv5s, YOLOv5m, YOLOv7, YOLOv8n, YOLOv10s, YOLOv11n, and YOLOv8n-CA models on the test set. The analysis reveals that, in complex scenarios involving factors such as fruit stacking, branch and leaf occlusion, and small targets, the YOLOv8n-CA model is able to detect more tomato fruits. The comparison primarily highlights the performance of YOLOv8n-CA against Faster R-CNN, YOLOv8n, YOLOv10s and YOLOv11n, as shown in Figure 12. The results indicate that the Faster R-CNN model struggles with missing detections and duplicate bounding boxes when identifying the ripeness of adjacent tomatoes. This issue arises because ResNet increases the theoretical receptive field by stacking multiple network layers, but the actual effective receptive field may not be as large as expected. The YOLOv3s model fails to detect distant small targets and exhibits misalignment in detection boxes. This can be attributed to the overlap of unripe fruits with branches, as YOLOv3s has limited feature recognition capability and mistakenly detects some branches as unripe tomatoes. Both the YOLOv5s and YOLOv5m models show similar detection results, with false detections occurring when unripe fruits overlap with branches. Inaccurate bounding box placement happens because the YOLOv5 model occasionally replaces convolutional layers with the focus structure, which may lose detailed information in feature maps, leading to reduced recognition accuracy. The YOLOv7 model, compared to earlier versions of YOLO, still suffers from missed detections of nearby tomatoes. Its feature extraction ability is weak, causing bounding boxes to misalign with targets, which hinders its ability to detect the ripeness of adjacent tomatoes. This issue is due to YOLOv7’s insufficient receptive field to capture contextual information from distant targets, and the default Anchor Box is not suitable for small distant targets. Although YOLOv8n is theoretically more powerful, its detection performance is suboptimal. It suffers from missed detections, false positives, and duplicate bounding boxes, and some obvious nearby tomato fruits are not recognized well. This issue may stem from the use of Anchor-Free algorithms in YOLOv8, which, while structurally simpler, struggle with inaccurate localization in densely arranged targets. YOLOv10s, in comparison to YOLOv8n, introduces a more complex network structure with deep convolutional layers, feature fusion modules, and dynamic attention mechanisms. However, its detection performance in the context of tomato fruits in complex scenarios is poor, with a relatively low detection accuracy. This can be attributed to YOLOv10s improvements focusing on scale invariance and feature fusion, which are susceptible to background interference when detecting small targets in complex scenes. The YOLOv11n model also tends to misclassify leaves as unripe tomatoes, and when there are too many background factors, the model fails to correctly identify the targets. Despite being the latest YOLO version, YOLOv11, which is based on YOLOv8, does not demonstrate significant improvements in the agricultural detection domain and lacks good applicability in this context. This highlights the need for further advancements by researchers in the field of agricultural detection. By contrast, the YOLOv8n-CA model accurately identifies more targets, correctly locates bounding boxes around tomato fruits, and provides accurate ripeness evaluations. It performs well in detecting small distant targets, recognizing the ripeness of adjacent fruits, and dealing with interference from branch and leaf occlusions or fruit stacking. The enhanced YOLOv8n-CA model outperforms all other comparative models in detection accuracy.

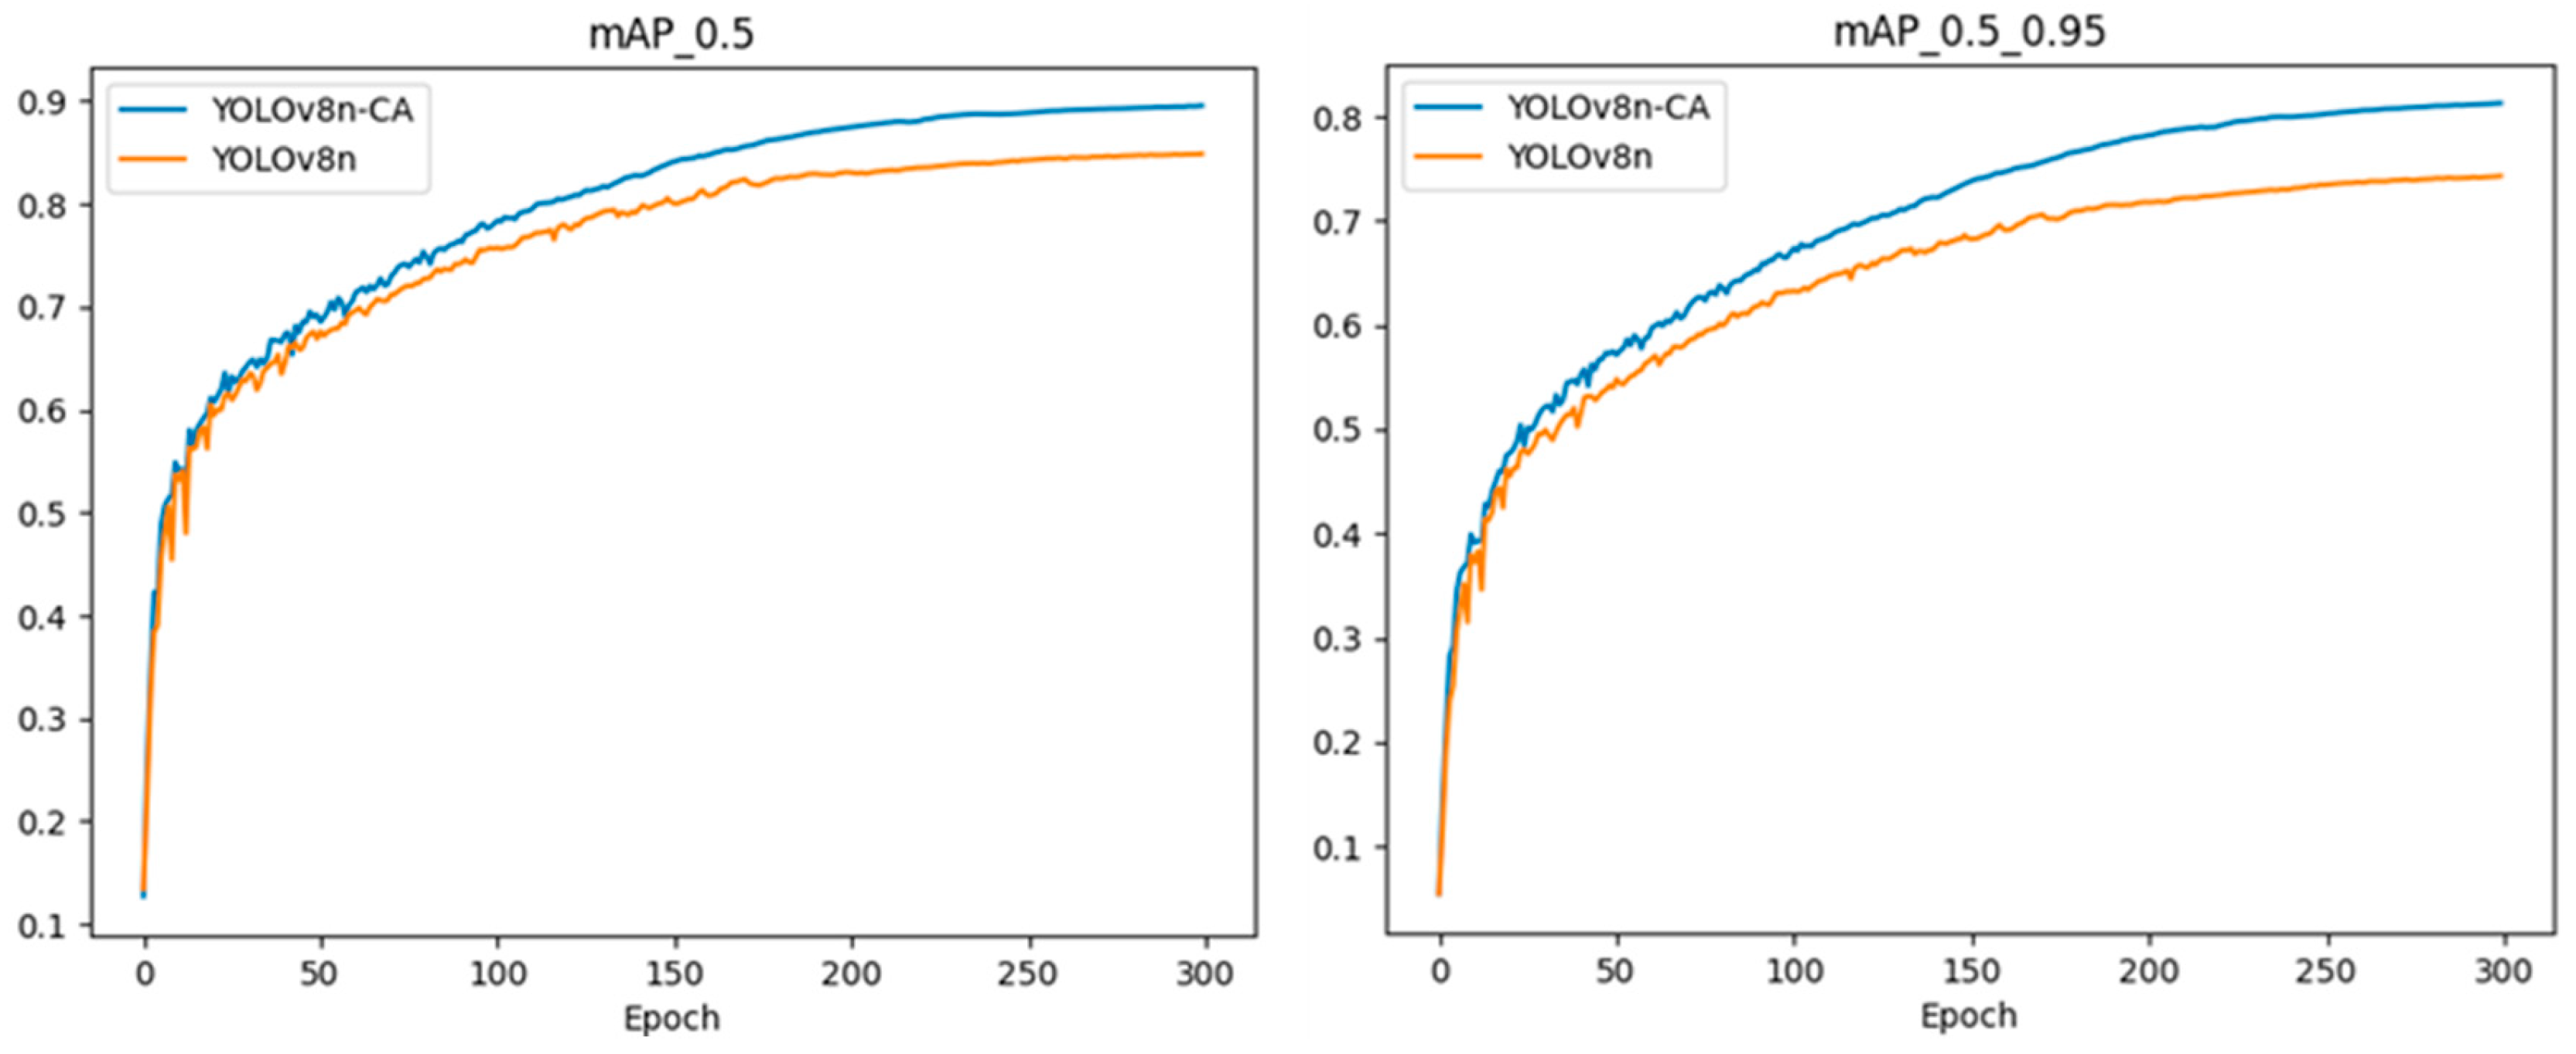
4.2.4. Performance Analysis of the YOLOv8n-CA Model

The mAP@0.5 performance metrics during training for both the YOLOv8n-CA and YOLOv8n models are presented in Figure 13. The enhanced YOLOv8n-CA model exhibits significantly superior training performance compared to the YOLOv8n model. The training metrics show smooth and stable progression, with no noticeable fluctuations or signs of overfitting. These results further confirm that the design improvements in the proposed model contribute to enhanced detection performance on the tomato dataset.
To provide an intuitive comparison of the performance differences between the YOLOv8n-CA and YOLOv8n models, detection results from the network’s output layer were visualized as heatmaps, as shown in Figure 14. The figure illustrates that the cloud map can be compared to attention mechanisms. The base model, YOLOv8n, demonstrates limited feature perception for tomato fruits during detection, making it highly vulnerable to interference from the surrounding environment. Consequently, attention is only weakly concentrated on the tomato fruits, resulting in fewer detections and lower accuracy. By contrast, the YOLOv8n-CA model exhibits substantial improvement, with a marked increase in attention focused on the tomato fruits. Most of the attention is now directed towards the tomatoes, and the CA mechanism enables the YOLOv8n-CA model to capture long-range dependencies in the feature map while preserving accurate spatial location information. This improvement allows for more precise detection of small, distant targets. Furthermore, the CARAFE up-sampling operator mitigates the significant loss of shallow feature information by linking the up-sampling kernel with the feature map, thereby enhancing the model’s ability to perceive features of tomato fruits. The C2f-FN module improves feature extraction by eliminating redundant and noisy information, thereby increasing the model’s accuracy in detecting targets such as stacked fruits and branch occlusions.
To further illustrate the performance of the improved YOLOv8n-CA model, detection results for tomatoes under challenging conditions such as strong lighting, motion blur, and distant small targets are analyzed, as shown in Figure 15. In the strong lighting scenario, the YOLOv8n-CA model exhibits enhanced detection performance, successfully identifying tomatoes that were previously difficult to detect under normal conditions, including distant small targets and those with severe occlusions. The model performs well in detecting distant small targets, although a few small targets are still missed. This is primarily due to the combined effects of leaf occlusion and the small size of distant targets, which impede the model’s ability to perform accurate detection. This issue suggests a potential direction for future improvements.

5. Conclusions

The design of the YOLOv8n-CA model aims not only to enhance its performance in detecting the maturity of tomato fruits but also to prioritize a lightweight architecture. Focusing solely on improving detection performance without considering factors such as parameter count, computational complexity, and model size is an unsustainable approach. The key contributions of the YOLOv8n-CA model are as follows:
(1)
This study introduces the YOLOv8n-CA model, which integrates the CA mechanism by adding an attention layer following the SPPF. This modification enhances the model’s focus on detecting tomato fruits and mitigates the impact of complex environmental factors. Additionally, the CARAFE up-sampling operator is employed to enlarge the receptive field, thereby improving the model’s sensitivity to tomatoes. Lastly, the modified C2f-FN feature extraction module eliminates redundant and noisy information, prioritizing the extraction of key features related to tomato fruits.
(2)
The optimized YOLOv8n-CA model consists of 2.45 × 10⁶ parameters, a computational complexity of 6.7 GFLOPs, and a model weight file size of 4.90 MB. In comparison to the YOLOv8n model, these values reflect reductions of 18.7%, 17.3%, and 18.1%, respectively. The mAP of the YOLOv8n-CA model is 97.3%, ensuring a consistent performance improvement while maintaining a lightweight design. This model effectively balances detection accuracy and computational efficiency.
(3)
The comparison of different models reveals that, despite certain numerical advantages, more recent algorithms do not always outperform their predecessors in detection effectiveness. This is due to the distinct architectural differences among the models, each of which exhibits unique characteristics when applied to the same detection task. Specifically, in the agricultural detection domain, only experimental validation can identify the most suitable algorithm for the task at hand.

6. Discussion

This study introduces the YOLOv8n-CA model, which integrates the CA. Currently, the basic YOLO algorithms demonstrate well-balanced performance across various dimensions, each suited to different application scenarios. Common lightweighting techniques typically involve introducing lightweight networks and reducing unnecessary layer connections to minimize complexity. However, these methods may lead to a reduction in detection performance. To mitigate this issue, attention mechanisms are often integrated to improve detection accuracy. Nevertheless, the lack of thorough exploration into the inter-module adaptability may result in incomplete model improvements, preventing the model from achieving either optimal performance or full lightweighting. Additionally, the YOLOv8n-CA model exhibits suboptimal performance in extreme tomato ripeness detection scenarios, such as those involving strong lighting, motion blur, and the combination of small target detection. Therefore, further optimization of the model is required to address these detection shortcomings.
In the future, the dataset will be expanded to include tomatoes at various stages of ripeness across diverse natural environments, enhancing the algorithm’s generalization capabilities. Pruning techniques will be employed to eliminate redundant model parameters, and distillation methods will be applied to train a student YOLO model based on the predictions of a more complex teacher YOLO model. Furthermore, the underlying mechanisms of attention mechanisms will be investigated, and the relationship between tomato phenotypes and quality will be explored and analyzed. A multimodal approach combining spectral technology will also be used to conduct a comprehensive evaluation of tomato ripeness, with the goal of exploring the potential applications of this model in agricultural harvesting.

Author Contributions

Conceptualization, J.D. and X.G.; methodology, J.D.; software, R.Z.; validation, J.D., X.G. and X.X.; formal analysis, X.G.; investigation, J.D.; resources, X.X.; data curation, J.D.; writing—original draft preparation, J.D.; writing—review and editing, J.D. and R.Z.; visualization, J.D.; supervision, X.X.; project administration, X.X. and R.Z.; funding acquisition, J.D. and X.X. All authors have read and agreed to the published version of the manuscript.

Funding

This research was funded by Education Department of Jiangsu Province: the Postgraduate Research & Practice Innovation Program of Jiangsu Province (SJCX24_2211) and Yangzhou University: High-end Talent Support Program of Yangzhou University.

Data Availability Statement

The original contributions presented in this study are included in the article; further inquiries can be directed to the corresponding authors.

Acknowledgments

The authors would like to thank the technical support of their teacher and supervisor. Additionally, we sincerely appreciate the work of the editor and the reviewers of this paper.

Conflicts of Interest

The authors declare no conflicts of interest.

References

  1. Ninja, B.; Manuj, K.H. Maturity detection of tomatoes using transfer learning. Meas. Food. 2022, 7, 100038. [Google Scholar]
  2. Arad, B.; Balendonck, J.; Barth, R.; Ben-Shahar, O.; Edan, Y.; Hellström, T.; Hemming, J.; Kurtser, P.; Ringdahl, O.; Tielen, T.; et al. Development of a sweet pepper harvesting robot. Field Robot. 2020, 37, 1027–1039. [Google Scholar] [CrossRef]
  3. Lawal, M.O. Tomato detection based on modified YOLOv3 framework. Sci. Rep. 2021, 11, 1447. [Google Scholar] [CrossRef]
  4. Kanagasingham, S.; Ekpanyapong, M.; Chaihan, R. Integrating machine visionbased row guidance with gps and compass-based routing to achieve autonomous navigation for a rice field weeding robot. Precis. Agric. 2020, 21, 831–855. [Google Scholar] [CrossRef]
  5. Bonde, L.; Ouedraogo, O.; Traore, S.; Thiombiano, A.; Boussim, J.I. Impact of environmental conditions on fruit production patterns of shea tree (Vitellaria paradoxa CF Gaertn) in West Africa. Afr. J. Ecol. 2019, 57, 353–362. [Google Scholar] [CrossRef]
  6. Hoye, T.T.; Arhe, J.; Bjerge, K.; Hansen, O.L.P.; Iosifidis, A.; Leese, F.; Mann, H.M.R.; Meissner, K.; Melvad, C.; Raitoharju, J. Deep learning and computer vision will transform entomology. Proc. Natl. Acad. Sci. USA 2021, 118, e2002545117. [Google Scholar] [CrossRef] [PubMed]
  7. Ariza-Sentís, M.; Vélez, S.; Martínez-Peña, R.; Baja, H.; Valente, J. Object detection and tracking in Precision Farming: A systematic review. Comput. Electron. Agric. 2024, 219, 108757. [Google Scholar] [CrossRef]
  8. Das, A.K.; Esau, T.J.; Zaman, Q.U.; Farooque, A.A.; Schumann, A.W.; Hennessy, P.J. Machine vision system for real-time debris detection on mechanical wild blueberry harvesters. Smart Agric. Technol. 2024, 4, 100166. [Google Scholar] [CrossRef]
  9. Roy, A.M.; Bhaduri, J. Real-time growth stage detection model for high degree of occultation using DenseNet-fused YOLOv4. Comput. Electron. Agric. 2022, 193, 106694. [Google Scholar] [CrossRef]
  10. Saman, M.O.; Kayhan, Z.G.; Shavan, K.A. Lightweight improved yolov5 model for cucumber leaf disease and pest detection based on deep learning. Signal Image Video Process. 2023, 18, 1329–1342. [Google Scholar]
  11. Cardellicchio, A.; Solimani, F.; Dimauro, G.; Petrozza, A.; Summerer, S.; Cellini, F.; Renò, V. Detection of tomato plant phenotyping traits using YOLOv5-based single stage detectors. Comput. Electron. Agric. 2023, 207, 107757. [Google Scholar] [CrossRef]
  12. Olisah, C.C.; Trewhella, B.; Li, B.; Smith, M.L.; Winstone, B.; Whitfield, E.C.; Fernández, F.F.; Duncalfe, H. Convolutional neural network ensemble learning for hyperspectral imaging-based blackberry fruit ripeness detection in uncontrolled farm environment. Eng. Appl. Artif. Intell. 2024, 132, 107945. [Google Scholar] [CrossRef]
  13. Tenorio, G.L.; Caarls, W. Automatic visual estimation of tomato cluster maturity in plant rows. Mach. Vis. Appl. 2021, 32, 78. [Google Scholar] [CrossRef]
  14. Tamilarasi, T.; Muthulakshmi, P. Machine vision algorithm for detection and maturity prediction of Brinjal. Smart Agric. Technol. 2024, 7, 100402. [Google Scholar]
  15. Du, X.; Meng, Z.; Ma, Z.; Zhao, L.; Lu, W.; Cheng, H.; Wang, Y. Comprehensive visual information acquisition for tomato picking robot based on multitask convolutional neural network. J. Biosyst. Eng. 2024, 238, 51–61. [Google Scholar] [CrossRef]
  16. Liu, Z.; Abeyrathna, R.R.; Sampurno, R.M.; Nakaguchi, V.M.; Ahamed, T. Faster-YOLO-AP: A lightweight apple detection algorithm based on improved YOLOv8 with a new efficient PDWConv in orchard. Comput. Electron. Agric. 2024, 223, 109118. [Google Scholar] [CrossRef]
  17. Luo, L.; Yin, W.; Ning, Z.; Wang, J.; Wei, H.; Chen, W.; Lu, Q. In-field pose estimation of grape clusters with combined point cloud segmentation and geometric analysis. Comput. Electron. Agric. 2022, 200, 107197. [Google Scholar] [CrossRef]
  18. Bigal, E.; Galili, O.; van Rijn, I.; Rosso, M.; Cleguer, C.; Hodgson, A.; Scheinin, A.; Tchernov, D. Reduction of Species Identification Errors in Surveys of Marine Wildlife Abundance Utilising Unoccupied Aerial Vehicles (UAVs). Remote Sens. 2022, 14, 4118. [Google Scholar] [CrossRef]
  19. Hou, Q.; Zhou, D.; Feng, J. Coordinate attention for efficient mobile network design. In Proceedings of the IEEE/CVF Conference on Computer Vision and Pattern Recognition, Las Vegas, NV, USA, 27–30 June 2016; pp. 13713–13722. [Google Scholar]
  20. Zhao, J.; Xi, X.; Shi, Y.; Zhang, B.; Qu, J.; Zhang, J.; Zhu, Z.; Zhang, R. An Online Method for Detecting Seeding Performance Based on Improved YOLOv5s Model. Agronomy 2023, 13, 2391. [Google Scholar] [CrossRef]
  21. Chen, J.; Kao, S.H.; He, H.; Zhuo, W.; Wen, S.; Lee, C.H.; Chan, S.H. Run, don’t walk: Chasing higher FLOPS for faster neural networks. In Proceedings of the IEEE/CVF Conference on Computer Vision and Pattern Recognition, Vancouver, BC, Canada, 17–24 June 2023; pp. 12021–12031. [Google Scholar]
  22. Badgujar, C.M.; Poulose, A.; Gan, H. Agricultural object detection with You Only Look Once (YOLO) Algorithm: A bibliometric and systematic literature review. Comput. Electron. Agric. 2024, 223, 109090. [Google Scholar] [CrossRef]
  23. Xu, K.; Song, C.; Xie, Y.; Pan, L.; Gan, X.; Huang, G. RMT-YOLOv9s: An Infrared Small Target Detection Method Based on UAV Remote Sensing Images. IEEE Geosci. Remote Sens. Lett. 2024, 21, 7002205. [Google Scholar] [CrossRef]
Figure 1. Tomato maturity diagram: (a) ripe stage; (b) turning ripe stage; (c) turning color stage; (d) unripe stage.
Agronomy 15 00188 g001
Figure 2. Image sample data augmentation: (a) original image; (b) rotation and compression; (c) low lighting and motion blur; and (d) high lighting, noise blur, and pixel loss.
Agronomy 15 00188 g002
Figure 3. Make Sense annotation interface.
Agronomy 15 00188 g003
Figure 4. YOLOv8 network structure.
Agronomy 15 00188 g004
Figure 5. Structure diagram of CA mechanism. Note: C, H, and W denote the number of channels, width, and height of the pooling kernel feature maps, respectively. X represents average pooling in the horizontal direction, while Y denotes average pooling in the vertical direction.
Agronomy 15 00188 g005
Figure 6. CARAFE process diagram.
Agronomy 15 00188 g006
Figure 7. FasterNet Block structure and C2f-FN structure: (a) FasterNet Block; (b) C2f-FN.
Agronomy 15 00188 g007
Figure 8. Angle loss calculation.
Agronomy 15 00188 g008
Figure 9. Distance loss calculation.
Agronomy 15 00188 g009
Figure 10. IoU calculation.
Agronomy 15 00188 g010
Figure 11. YOLOv8n-CA network structure.
Agronomy 15 00188 g011
Figure 12. Comparison of different models.
Agronomy 15 00188 g012
Figure 13. Comparison of model performance before and after improvement.
Agronomy 15 00188 g013
Figure 14. Comparison of YOLOv8n-CA and YOLOv8n heat maps. (a) Original image. (b) YOLOv8n. (c) YOLOv8n-CA. The red and yellow colors represent the degree of attention focus. The darker the color, the higher the focus, resulting in better detection performance.
Agronomy 15 00188 g014aAgronomy 15 00188 g014b
Figure 15. Diversity detection effect. (a) Strong lighting. (b) Detection of small targets. The red-circled area indicates small objects.
Agronomy 15 00188 g015
Table 1. Comparison of up-sampling performance.
ModelsParams (M)GFLOPsModel Size (M)P (%)R (%)mAP@0.5 (%)
Other improvements—DySample2.326.34.6793.393.196.4
Other improvements—CARAFE2.456.74.9094.392.597.3
Table 2. Ablation test results of YOLOv8n-CA model.
No.ModelsParams (M)GFLOPsModel Size (MB)mAP@0.5 (%)
1YOLOv8n3.018.15.9896.0
2YOLOv8n-CA3.028.25.9995.6
3YOLOv8n-CARAFE3.309.16.2595.9
4YOLOv8n-C2f-FN2.316.54.6795.7
5YOLOv8n-CA-C2f_Faster2.457.04.6496.2
6YOLOv8n-CA-CARAFE3.168.56.2796.1
7YOLOv8n-C2f_Faster-CARAFE2.456.64.9296.5
8YOLOv8n-CA-C2f_FN-CARAFE-SIoU2.456.74.9097.3
Table 3. Test results of the YOLOv8n-CA model.
ModelsParams (M)GFLOPsModel Size (MB)P (%)R (%)mAP@0.5 (%)mAP@0.5 (%)Detect Times (ms)
Faster R-CNN136.75401.8108.060.159.262.353.870.1
YOLOv3s61.51154.611788.187.191.487.758.5
YOLOv5s7.0316.013.7088.587.291.975.338.3
YOLOv5m20.8747.940.288.288.191.877.642.1
YOLOv736.49103.271.3095.590.591.776.745.1
YOLOv8n3.018.15.9892.192.096.088.318.9
YOLOv10s8.0724.815.789.482.989.886.021.4
YOLOv11n2.596.35.2398.290.293.287.914.1
YOLOv8n-CA2.456.74.9094.392.597.388.817.7
Disclaimer/Publisher’s Note: The statements, opinions and data contained in all publications are solely those of the individual author(s) and contributor(s) and not of MDPI and/or the editor(s). MDPI and/or the editor(s) disclaim responsibility for any injury to people or property resulting from any ideas, methods, instructions or products referred to in the content.

