Unraveling the Tolerance of Moringa oleifera to Excess K through Increased N Absorption and Mg Use Efficiency


Abstract
1. Introduction
2. Material and Methods
2.1. Development Conditions, Location, and Soil Characterization
2.2. Treatments and Experimental Design
2.3. Evaluations
2.3.1. Height, Number of Leaves, Chlorophyll, Fv/Fm, and Plant Dry Matter
2.3.2. Macronutrient and Micronutrient Content in Leaf, Stem, and Root
2.3.3. Accumulation and Efficiency of Nutrient Use in the Shoots
2.4. Statistical Analysis
3. Results
3.1. Biometric Variables
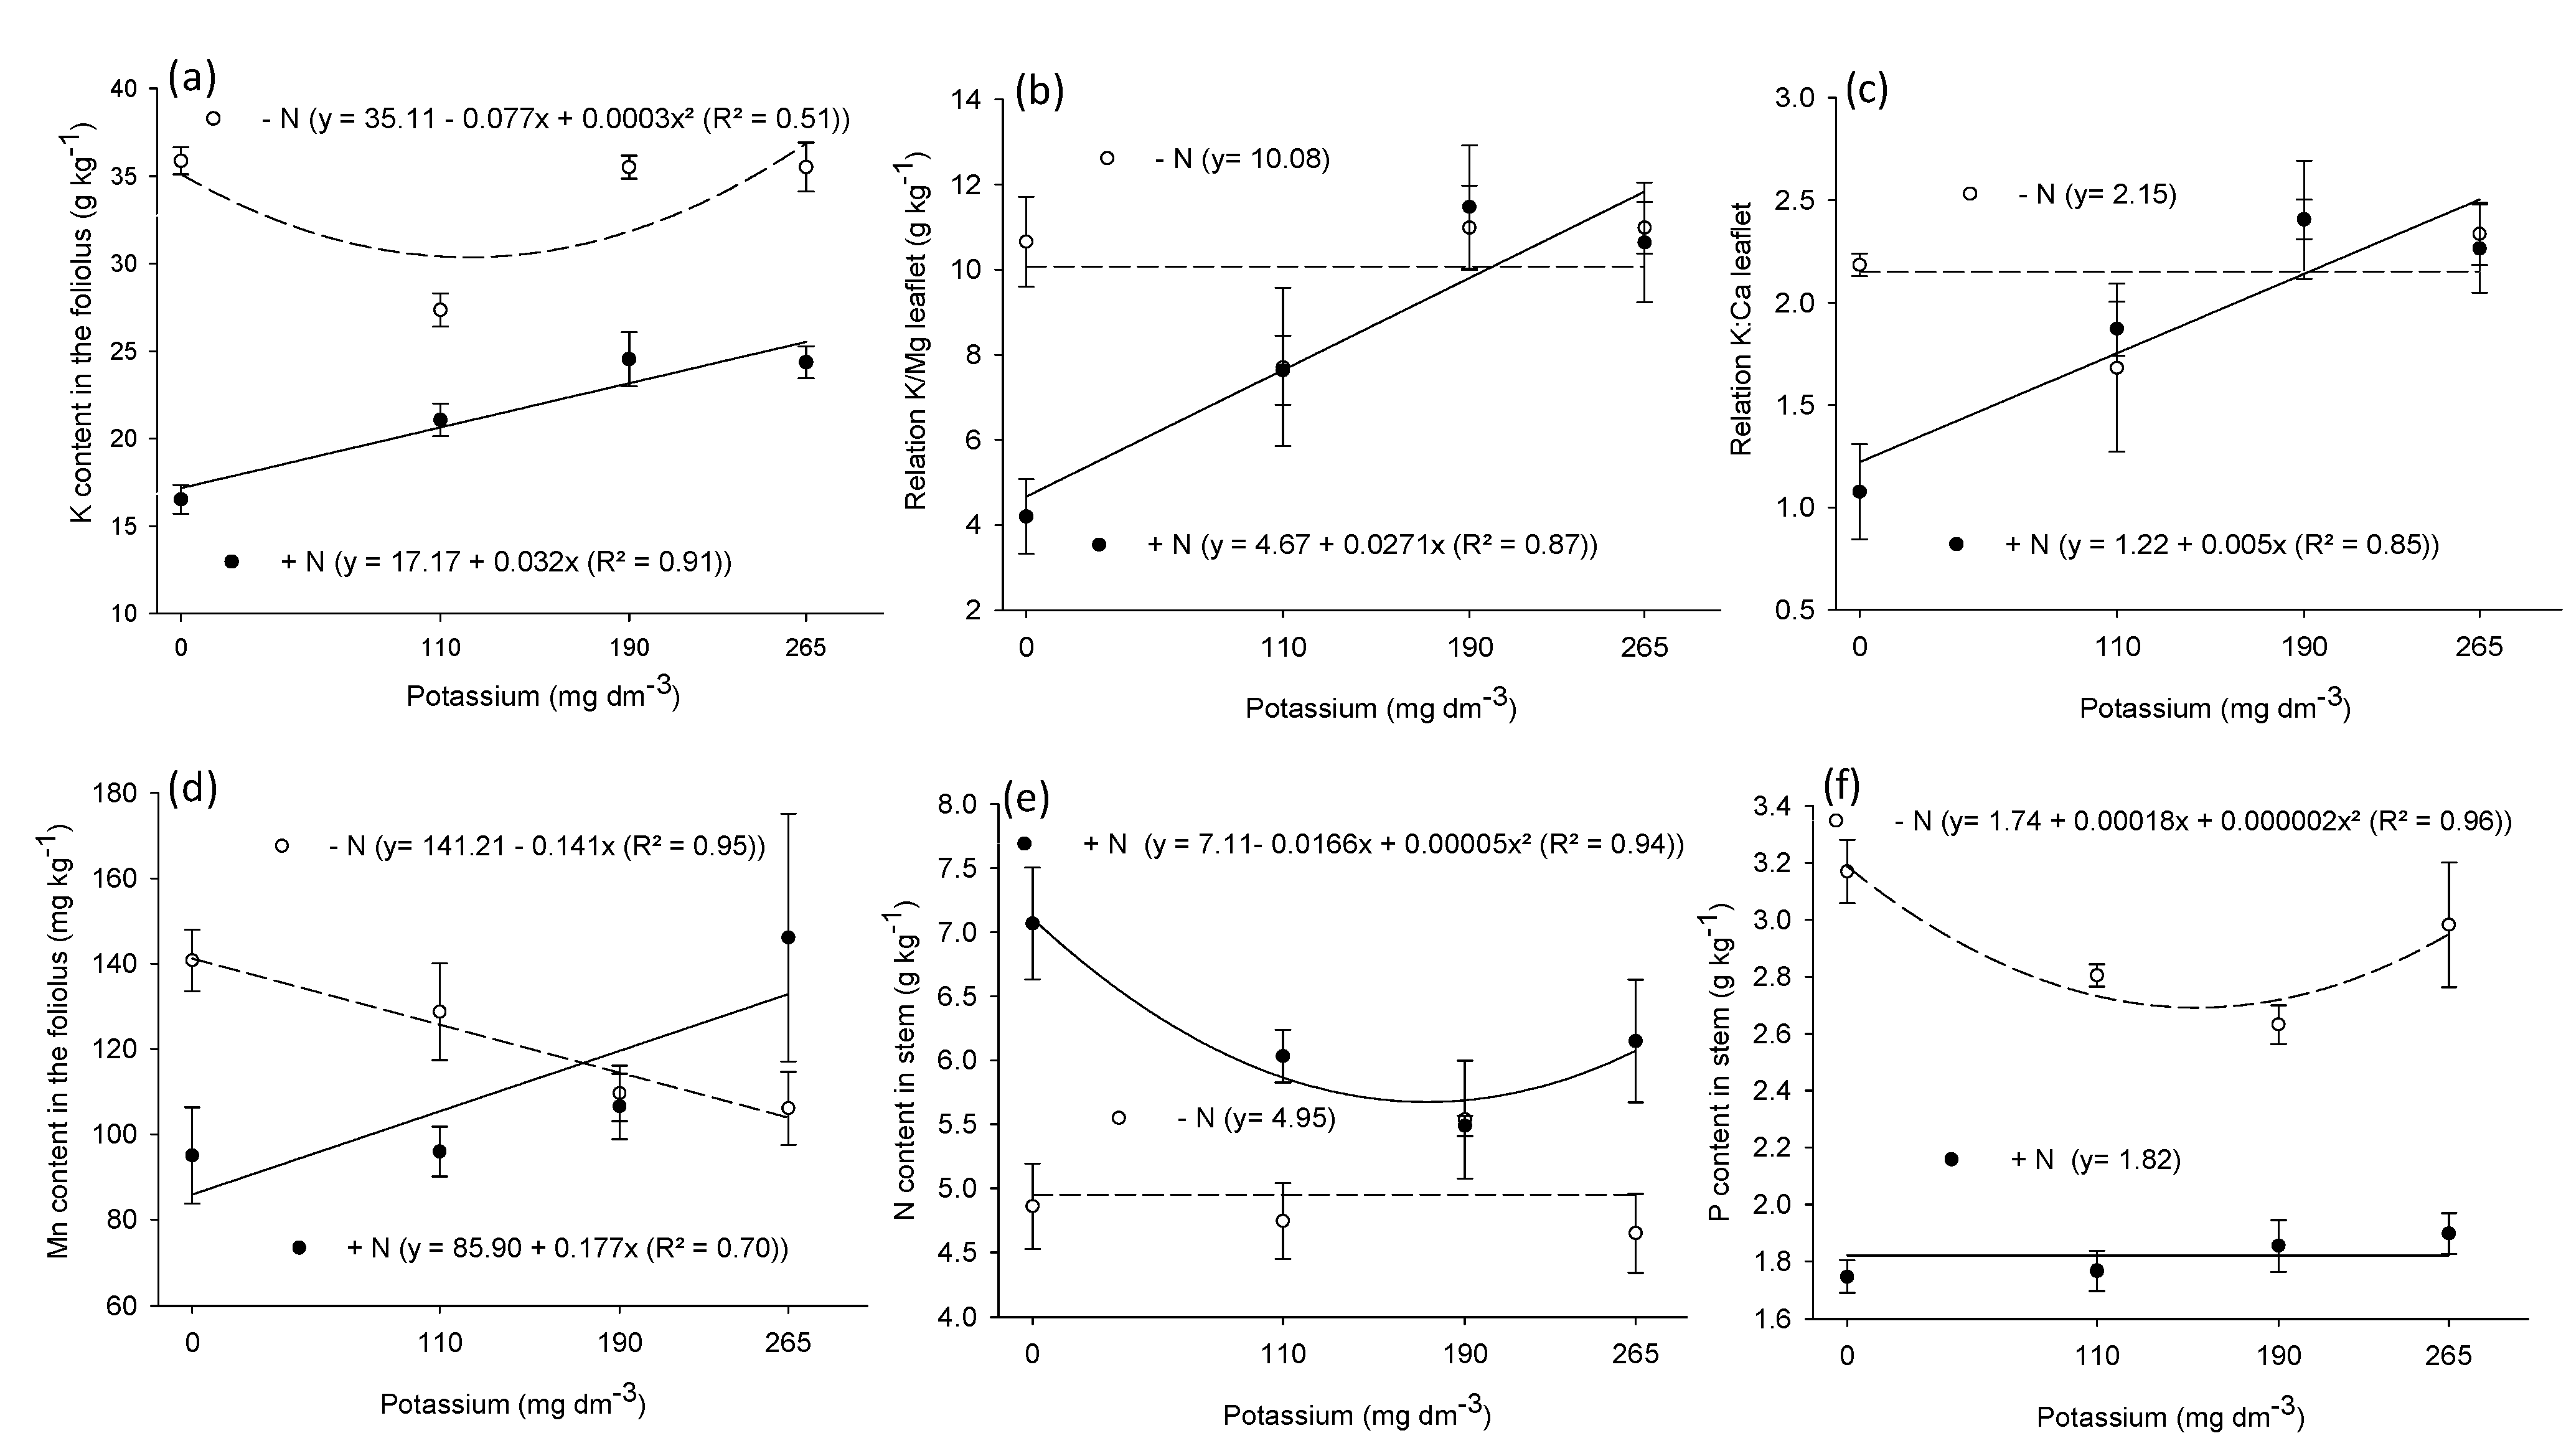
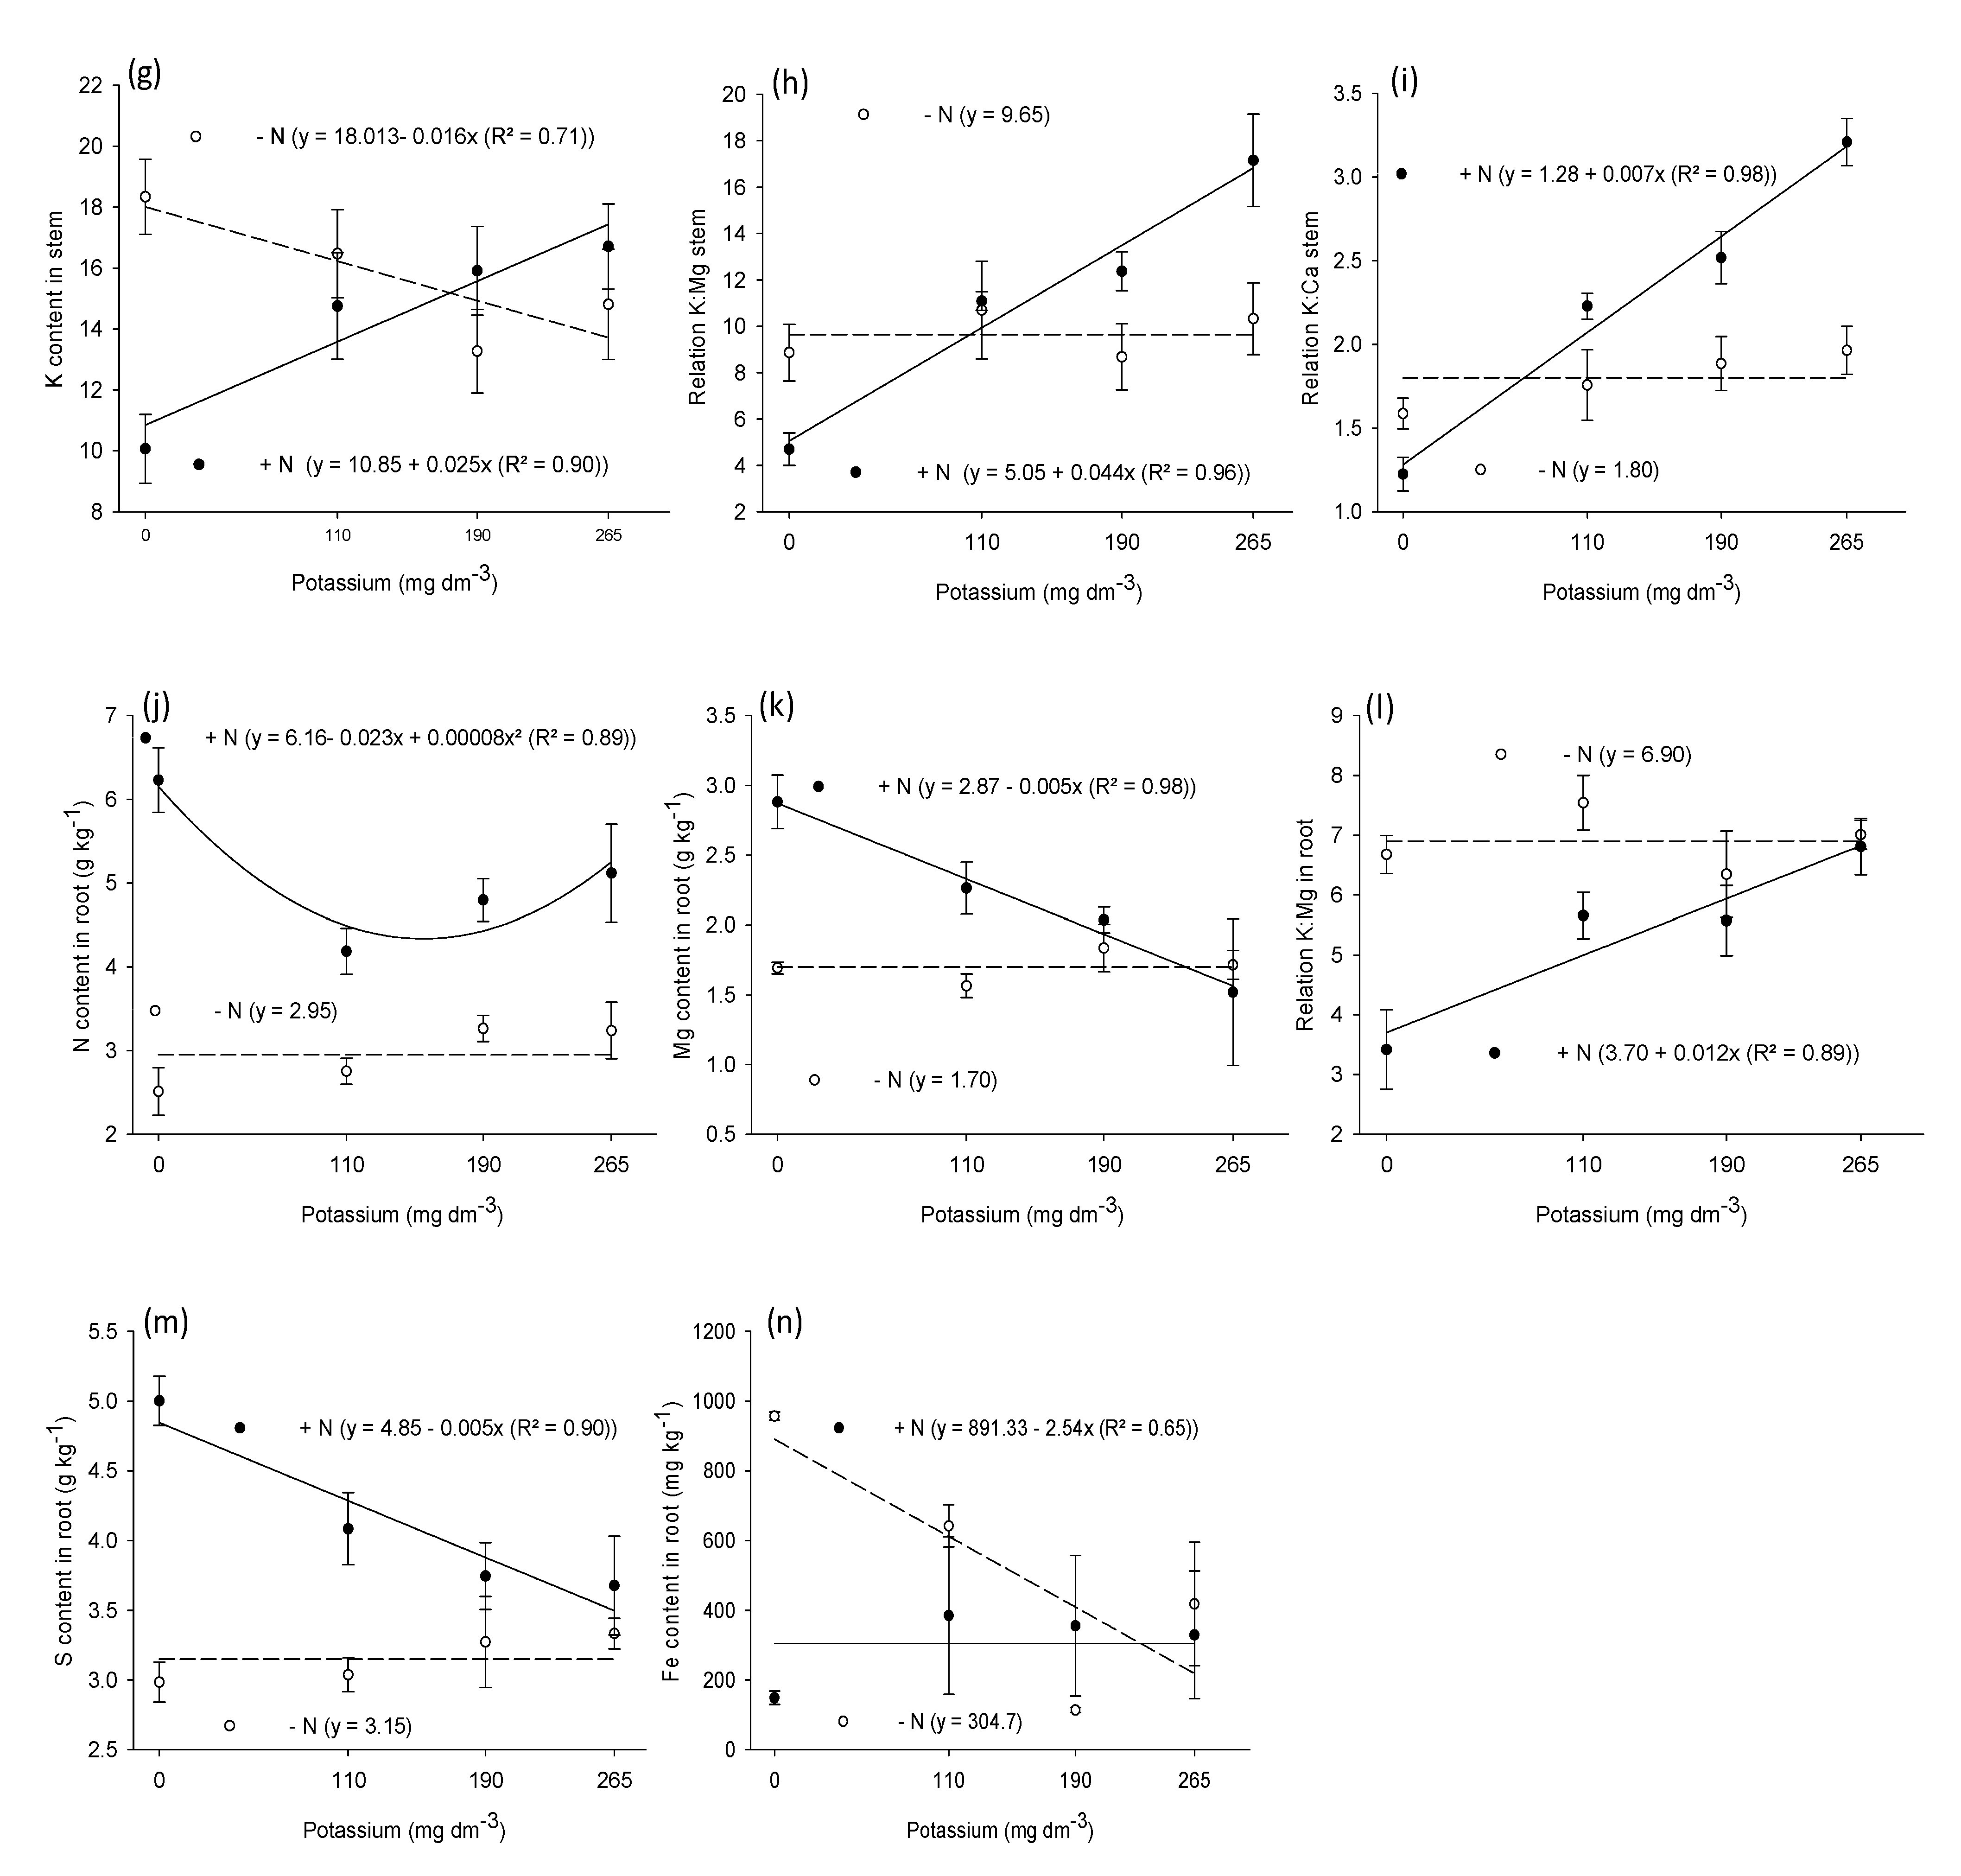
3.2. Macronutrient and Micronutrient Content in Leaf, Stem, and Root
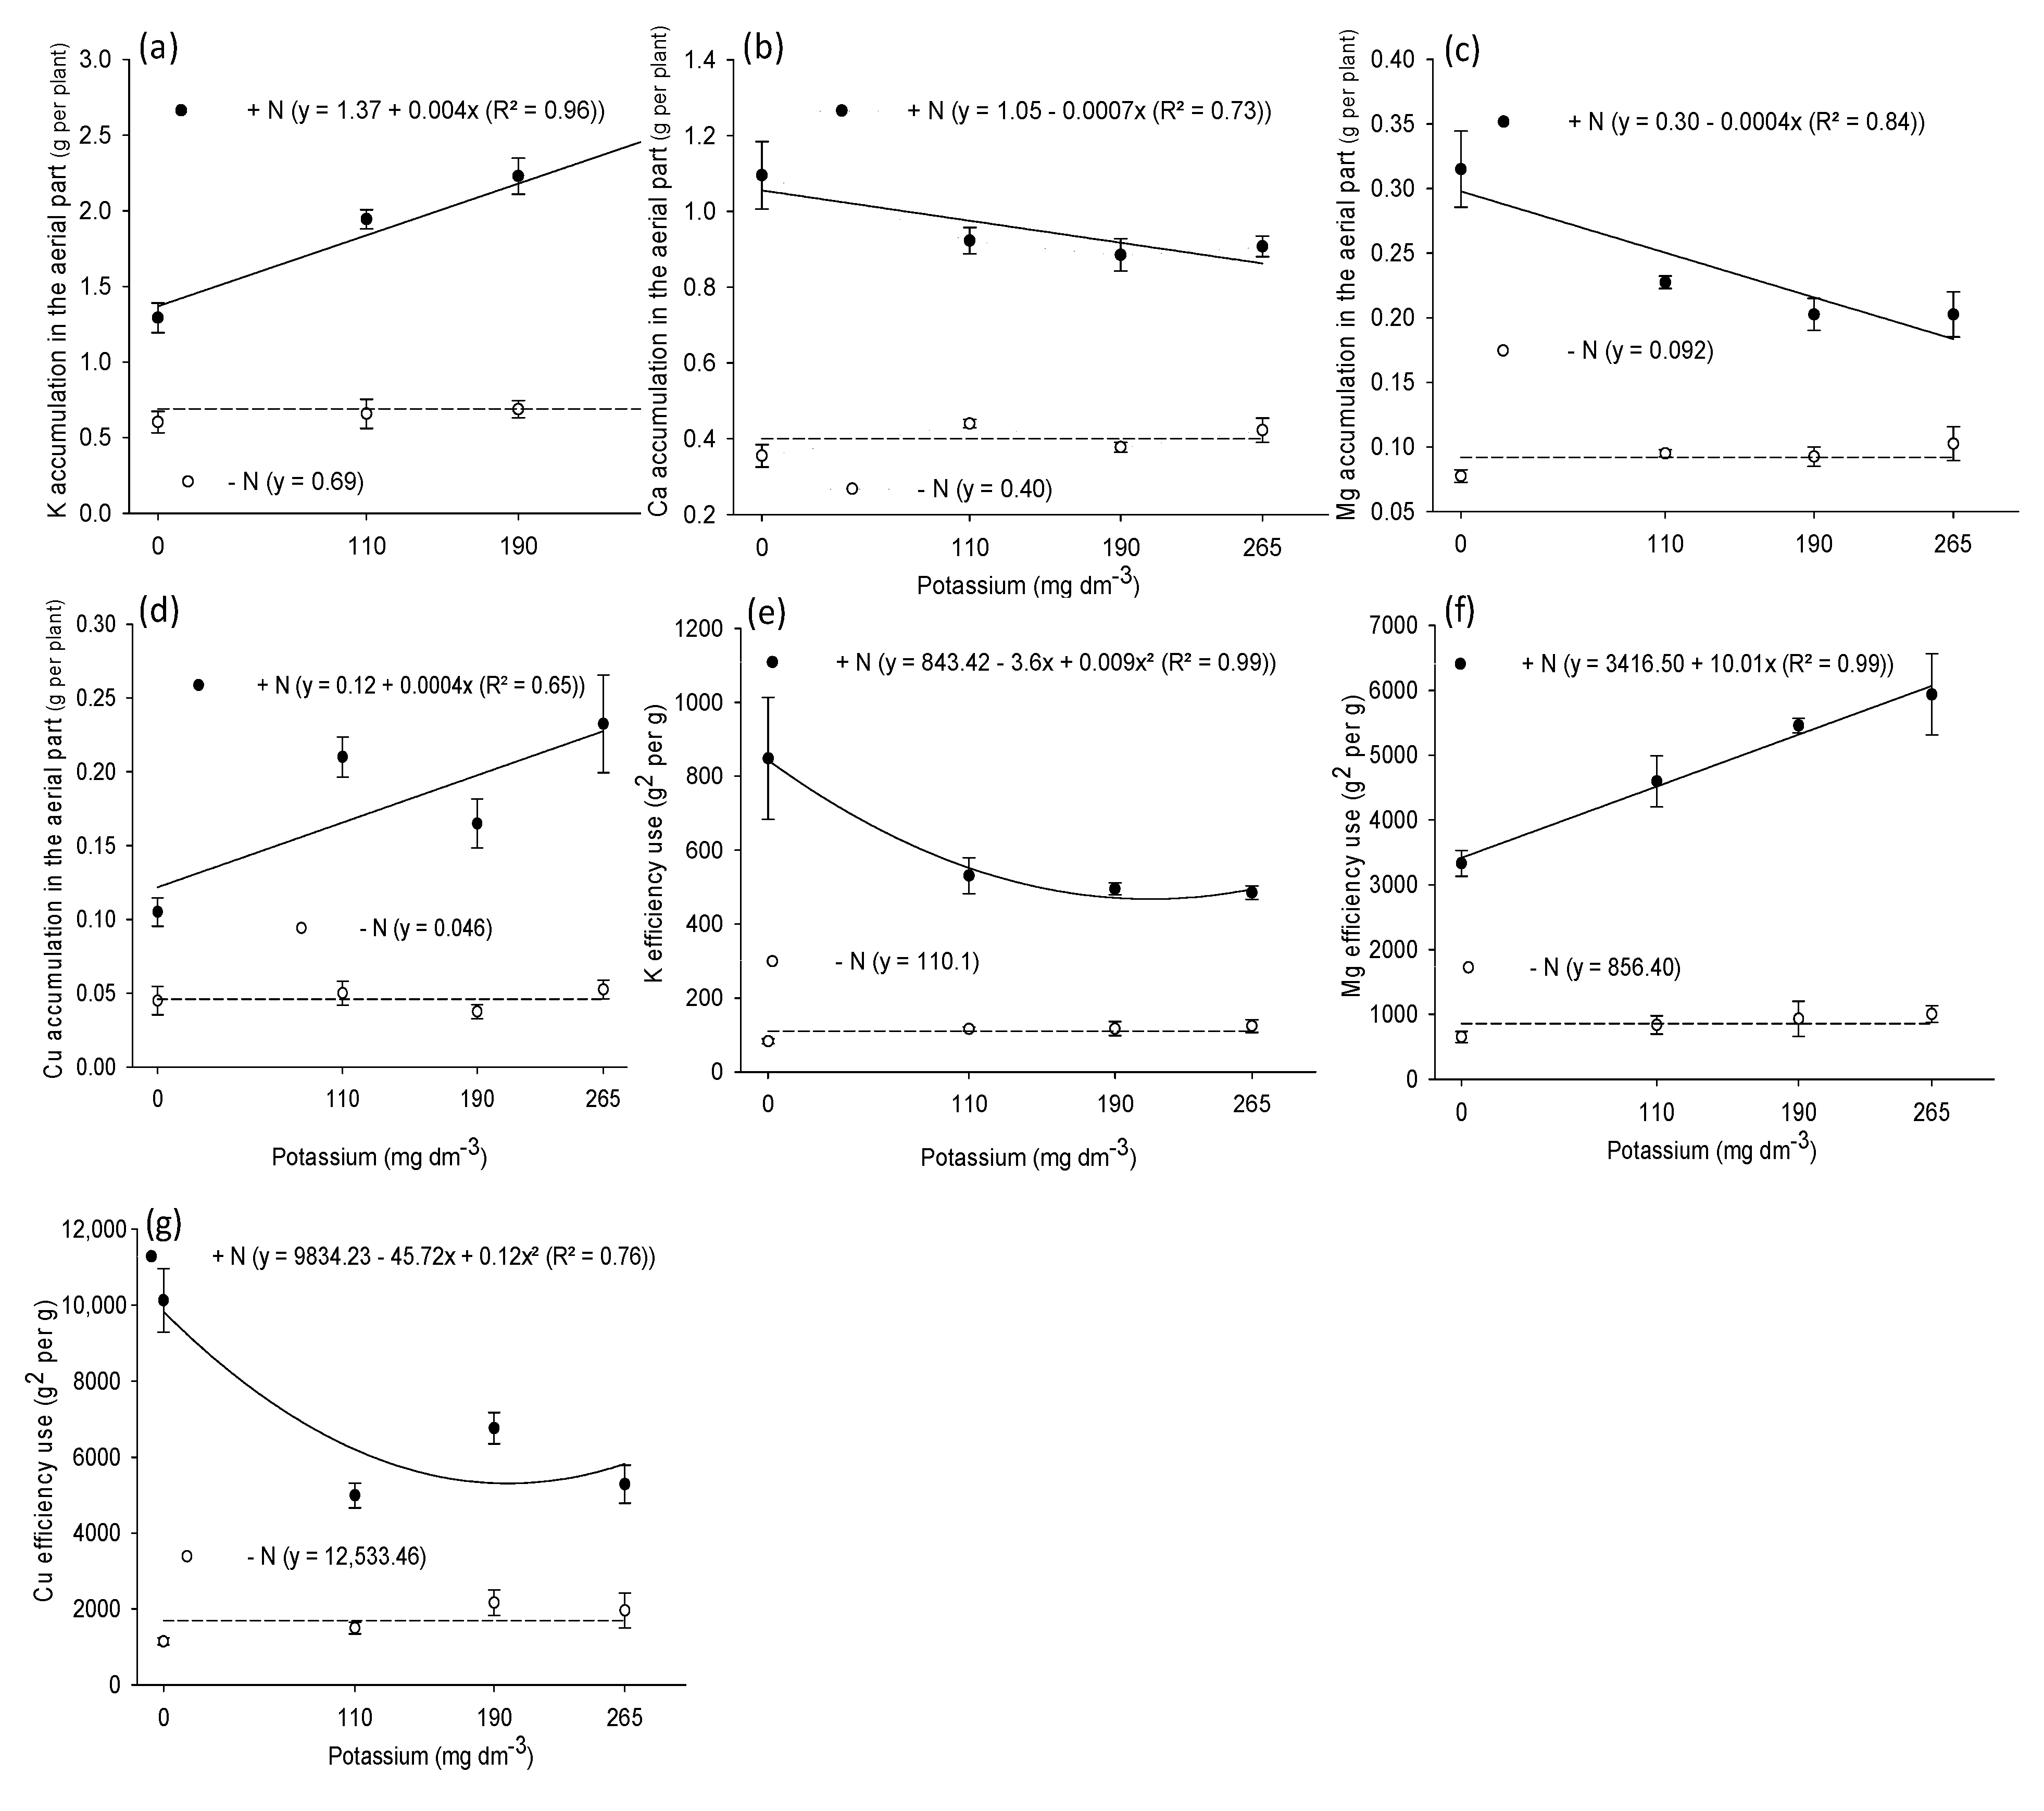
3.3. Shoot Nutrient Accumulation
4. Discussion
5. Conclusions
Author Contributions
Funding
Data Availability Statement
Acknowledgments
Conflicts of Interest
References
- Adefa, T.; Tefera, M. Heavy Metal Accumulation and Health Risk Assessment in Moringa Oleifera from Awi Zone, Ethiopia. Chem. Afr. 2020, 3, 1073–1079. [Google Scholar] [CrossRef]
- Tiloke, C.; Anand, K.; Gengan, R.M.; Chuturgoon, A.A. Moringa Oleifera and Their Phytonanoparticles: Potential Antiproliferative Agents against Cancer. Biomed. Pharmacother. 2018, 108, 457–466. [Google Scholar] [CrossRef]
- Devisetti, R.; Sreerama, Y.N.; Bhattacharya, S. Processing Effects on Bioactive Components and Functional Properties of Moringa Leaves: Development of a Snack and Quality Evaluation. J. Food Sci. Technol. 2016, 53, 649–657. [Google Scholar] [CrossRef] [PubMed]
- Benhammouche, T.; Melo, A.; Martins, Z.; Faria, M.A.; Pinho, S.C.M.; Ferreira, I.M.L.P.V.O.; Zaidi, F. Nutritional Quality of Protein Concentrates from Moringa Oleifera Leaves and in Vitro Digestibility. Food Chem. 2021, 348, 128858. [Google Scholar] [CrossRef] [PubMed]
- de Mello Prado, R. Mineral Nutrition of Tropical Plants; Springer International Publishing: Cham, Switzerland, 2021; ISBN 978-3-030-71261-7. [Google Scholar]
- Kumar, S.; Kumar, S.; Mohapatra, T. Interaction between Macro- and Micro-Nutrients in Plants. Front. Plant Sci. 2021, 12, 665583. [Google Scholar] [CrossRef]
- Rodrigues, A.A.; Mendonça, R.M.N.; Silva, A.P.d.; Silva, S.d.M. Nutrição Mineral e Produção de Abacaxizeiro “Pérola”, Em Função Das Relações K/N Na Adubação. Rev. Bras. Frutic. 2013, 35, 625–633. [Google Scholar] [CrossRef]
- Tränkner, M.; Tavakol, E.; Jákli, B. Functioning of Potassium and Magnesium in Photosynthesis, Photosynthate Translocation and Photoprotection. Physiol. Plant 2018, 163, 414–431. [Google Scholar] [CrossRef] [PubMed]
- Xie, K.; Cakmak, I.; Wang, S.; Zhang, F.; Guo, S. Synergistic and Antagonistic Interactions between Potassium and Magnesium in Higher Plants. Crop J. 2021, 9, 249–256. [Google Scholar] [CrossRef]
- Ertiftik, H.; Zengin, M. Response of Maize for Grain to Potassium and Magnesium Fertilizers in Soils with High Lime Contents. J. Plant Nutr. 2017, 40, 93–103. [Google Scholar] [CrossRef]
- Koch, M.; Busse, M.; Naumann, M.; Jákli, B.; Smit, I.; Cakmak, I.; Hermans, C.; Pawelzik, E. Differential Effects of Varied Potassium and Magnesium Nutrition on Production and Partitioning of Photoassimilates in Potato Plants. Physiol. Plant 2019, 166, 921–935. [Google Scholar] [CrossRef]
- Rhodes, R.; Miles, N.; Hughes, J.C. Interactions between Potassium, Calcium and Magnesium in Sugarcane Grown on Two Contrasting Soils in South Africa. Field Crops Res. 2018, 223, 1–11. [Google Scholar] [CrossRef]
- Guan, X.; Liu, D.; Liu, B.; Wu, C.; Liu, C.; Wang, X.; Zou, C.; Chen, X. Critical Leaf Magnesium Concentrations for Adequate Photosynthate Production of Soilless Cultured Cherry Tomato—Interaction with Potassium. Agronomy 2020, 10, 1863. [Google Scholar] [CrossRef]
- Ding, Y.; Luo, W.; Xu, G. Characterisation of Magnesium Nutrition and Interaction of Magnesium and Potassium in Rice. Ann. Appl. Biol. 2006, 149, 111–123. [Google Scholar] [CrossRef]
- Bedi, A.S.; Sekhon, G.S. Effect of Potassium and Magnesium Application to Soils on the Dry-Matter Yield and Cation Composition of Maize. J. Agric. Sci. 1977, 88, 753–758. [Google Scholar] [CrossRef]
- Guo, S.; Shen, Q.; Brueck, H. Effects of Local Nitrogen Supply on Water Uptake of Bean Plants in a Split Root System. J. Integr. Plant Biol. 2007, 49, 472–480. [Google Scholar] [CrossRef]
- Wang, M.Y.; Siddiqi, M.Y.; Glass, A.D.M. Interactions between K+ and NH4+: Effects on Ion Uptake by Rice Roots. Plant Cell Environ. 1996, 19, 1037–1046. [Google Scholar] [CrossRef]
- Pettersson, S. Effects of Nitrate on Influx, Efflux and Translocation of Potassium in Young Sunflower Plants. Physiol. Plant 1984, 61, 663–669. [Google Scholar] [CrossRef]
- Cosgrove, D.J. Plant Cell Wall Extensibility: Connecting Plant Cell Growth with Cell Wall Structure, Mechanics, and the Action of Wall-Modifying Enzymes. J. Exp. Bot. 2016, 67, 463–476. [Google Scholar] [CrossRef]
- Kudoyarova, G.; Arkhipova, T.; Veselov, D. Correction to: Water Relations in Plants Treated with Growth Promoting Rhizosphere Bacteria. Plant Soil 2024, 494, 73. [Google Scholar] [CrossRef]
- Liu, H.; Todd, J.L.; Luo, H. Turfgrass Salinity Stress and Tolerance—A Review. Plants 2023, 12, 925. [Google Scholar] [CrossRef] [PubMed]
- Qi, J.; Song, C.; Wang, B.; Zhou, J.; Kangasjärvi, J.; Zhu, J.; Gong, Z. Reactive Oxygen Species Signaling and Stomatal Movement in Plant Responses to Drought Stress and Pathogen Attack. J. Integr. Plant Biol. 2018, 60, 805–826. [Google Scholar] [CrossRef]
- Mostofa, M.G.; Rahman, M.M.; Ghosh, T.K.; Kabir, A.H.; Abdelrahman, M.; Rahman Khan, M.A.; Mochida, K.; Tran, L.-S.P. Potassium in Plant Physiological Adaptation to Abiotic Stresses. Plant Physiol. Biochem. 2022, 186, 279–289. [Google Scholar] [CrossRef]
- Majumdar, K.; Norton, R.M.; Murrell, T.S.; García, F.; Zingore, S.; Prochnow, L.I.; Pampolino, M.; Boulal, H.; Dutta, S.; Francisco, E.; et al. Assessing Potassium Mass Balances in Different Countries and Scales. In Improving Potassium Recommendations for Agricultural Crops; Springer International Publishing: Cham, Switzerland, 2021; pp. 283–340. [Google Scholar]
- Santos, d.H.G.; Jacomine, P.K.T.; Anjos, d.L.H.C.; Oliveira, d.V.A.; Lumbreras, J.F.; Coelho, M.R.; Almeida, d.J.A.; Araujo Filho, d.J.C.; Oliveira, d.J.B.; Cunha, T.J.F. Sistema Brasileiro de Classificação de Solos, 5th ed.; Embrapa: Brasília, Brazil, 2018; ISBN 9788570358004. [Google Scholar]
- Raij, B.V.; Cantarella, H.; Quaggio, J.A.; Furlani, A.M.C. Lime and Fertilizer Recommendations for the State of São Paulo, 2nd ed.; (Technical Bulletin, 100); Instituto Agronômico: Campinas, Brazil, 1997; pp. 1–285. [Google Scholar]
- Malavolta, E. Handbook of Agricultural Chemistry Fertilisers and Fertilisation. Agron. Ceres 1981, 1–596. [Google Scholar]
- Bolhar-Nordenkampf, H.R.; Long, S.P.; Baker, N.R.; Oquist, G.; Schreiber, U.; Lechner, E.G. Chlorophyll Fluorescence as a Probe of the Photosynthetic Competence of Leaves in the Field: A Review of Current Instrumentation. Funct. Ecol. 1989, 3, 497. [Google Scholar] [CrossRef]
- Demmig, B.; Björrkman, O. Comparison of the Effect of Excessive Light on Chlorophyll Fluorescence (77K) and Photon Yield of O2 Evolution in Leaves of Higher Plants. Planta 1987, 171, 171–184. [Google Scholar] [CrossRef]
- Bataglia, O.C.; Furlani, A.M.C.; Teixeira, J.A.F.; Furlani, P.R.; Gallo, J.R. Methods for Analysing Plant Chemistry; Agronomic Institute of Campinas: Campinas, Brazil, 1983; pp. 1–596. [Google Scholar]
- Siddiqi, M.Y.; Glass, A.D.M. Utilization Index: A Modified Approach to the Estimation and Comparison of Nutrient Utilization Efficiency in Plants. J. Plant Nutr. 1981, 4, 289–302. [Google Scholar] [CrossRef]
- Veloso, C.A.C.; Oeiras, A.H.L.; Carvalho, E.J.M.; Souza, F.R.S. Response of Pineapple to the Addition of Nitrogen, Potassium and Limestone in a Yellow Oxisol in Northeast Paraense. Braz. J. Frutic. 2001, 23, 396–402. [Google Scholar] [CrossRef]
- Spironello, A.; Quaggio, J.A.; Teixeira, L.A.J.; Furlani, P.R.; Sigrist, J.M.M. Pineapple Yield and Fruit Quality Effected by NPK Fertilization in a Tropical Soil. Rev. Bras. Frutic. 2004, 26, 155–159. [Google Scholar] [CrossRef]
- Dias, M.J.T.; Souza, H.A.; Natale, W.; Modesto, V.C.; Rozane, D. Fertilization with Nitrogen and Potassium in Guava Seedlings in a Commercial Nursery. Semant. Sch. Semin. 2012, 33, 2837–2848. [Google Scholar]
- Santa-María, G.E.; Danna, C.H.; Czibener, C. High-Affinity Potassium Transport in Barley Roots. Ammonium-Sensitive and -Insensitive Pathways. Plant Physiol. 2000, 123, 297–306. [Google Scholar] [CrossRef] [PubMed]
- Nieves-Cordones, M.; Alemán, F.; Martínez, V.; Rubio, F. K+ Uptake in Plant Roots. The Systems Involved, Their Regulation and Parallels in Other Organisms. J. Plant Physiol. 2014, 171, 688–695. [Google Scholar] [CrossRef] [PubMed]
- Marschner, P. Marschner’s Mineral Nutrition of Higher Plants; Elsevier: Amsterdam, The Netherlands, 2012; ISBN 9780123849052. [Google Scholar]
- Vieira, H.; Helena, L.; Chaves, G.; Viégas, R.A. Diagnosis of Macronutrient Deficiency Symptoms in Seedlings of Moringa (Moringa Oleifera). Cerne 2007, 13, 47–53. [Google Scholar]
- Vieira, H.; Helena, L.; Chaves, G.; Viégas, R.A. Nutrient Accumulation In Moringa Seedlings (Moringa Oleifera Lam) Under Macronutrient Omission. J. Agron. Sci. 2008, 39, 130–136. [Google Scholar]
- Soares, P.P.d.S.; Mesquita, N.L.S.; Almeida, J.R.; Coutrim, R.L.; Cairo, P.A.R.; Silva, L.D. Growth, Root Quality and Nitrate Reductase Activity in Radish Plants Subjected to Doses of Potassium and Nitrogen Sources. Sci. Plena 2020, 16, 1–9. [Google Scholar] [CrossRef]
- Wang, N.; Hua, H.; Egrinya Eneji, A.; Li, Z.; Duan, L.; Tian, X. Genotypic Variations in Photosynthetic and Physiological Adjustment to Potassium Deficiency in Cotton (Gossypium Hirsutum). J. Photochem. Photobiol. B 2012, 110, 1–8. [Google Scholar] [CrossRef]
- Meurer, E.J.; Potássio, I.F.M.S. (Eds.) Plant Mineral Nutrition; Brazilian Society of Soil Science: Rio de Janeiro, Brazil, 2006; pp. 281–298. [Google Scholar]


| Nutrient | Total Chlorophyll | Fv/Fm | H (cm) | NL | LA | DM |
|---|---|---|---|---|---|---|
| N | 229.51 ** | 83.05 ** | 276.76 ** | 37.71 ** | 268.20 ** | 313.02 ** |
| K | 0.39 ns | 0.41 ns | 2.32 ns | 1.55 ns | 1.75 ns | 2.13 ns |
| N × K | 1.07 ns | 2.13 ns | 0.17 ns | 0.43 ns | 1.64 ns | 0.73 ns |
| MSE | 2.48 | 0.01 | 5.19 | 0.77 | 104.79 | 2.13 |
| CV% | 11.38 | 2.92 | 9.09 | 9.95 | 14.19 | 10.31 |
| N | P | K | Ca | Mg | K/Mg | K/Ca | S | Cu | Fe | Mn | Zn | |
|---|---|---|---|---|---|---|---|---|---|---|---|---|
| Leaf | ||||||||||||
| N | 97.4 ** | 10.5 ** | 56.4 ** | 32.5 * | 7.7 ** | 3.6 ns | 2.4 ns | 175 ** | 11.0 * | 9.5 ** | 1.3 ns | 32.5 ** |
| K | 2.1 ns | 1.31 ns | 3.39 ** | 3.6 * | 3.6 * | 5.7 ** | 5.8 ** | 3.6 * | 0.5 ns | 0.4 ns | 0.7 ns | 0.5 ns |
| N × K | 1.2 ns | 2.5 ns | 3.45 ** | 1.6 ns | 2.3 ns | 3.7 * | 3.4 * | 0.8 ns | 0.6 ns | 1.4 ns | 4.3 * | 1.5 ns |
| Stem | ||||||||||||
| N | 25.1 ** | 214.2 ** | 1.7 ns | 64.7 ** | 36.5 ** | 2.9 ns | 24.8 ** | 36.3 ** | 9.5 ** | 0.5 ns | 9.4 ** | 6.00 * |
| K | 1.2 ns | 2.1 ns | 0.5 ns | 1.5 ns | 0.8 ns | 8.3 ** | 24.4 ** | 0.8 ns | 0.8 ns | 0.2 ns | 0.5 ns | 0.32 ns |
| N × K | 3.7 * | 3.2 * | 5.8 ** | 1.2 ns | 0.3 ns | 5.6 ** | 11.3 ** | 0.03 ns | 0.2 ns | 0.3 ns | 0.4 ns | 0.80 ns |
| Root | ||||||||||||
| N | 84.2 ** | 191.8 ** | 0.6 ns | 4.5 ** | 8.8 ** | 18.2 ** | 9.8 ** | 34.6 ** | 2.7 ns | 5.2 * | 5.6 ** | 2.8 ns |
| K | 2.8 ns | 2.2 ns | 0.5 ns | 1.3 ns | 3.0 ns | 5.3 ** | 2.4 ns | 2.0 ns | 0.4 ns | 2.1 ns | 0.2 ns | 0.8 ns |
| N × K | 5.2 ** | 1.2 ns | 0.5 ns | 0.8 ns | 3.6 * | 3.6 * | 0.8 ns | 5.3 ** | 0.5 ns | 4.8 ** | 0.4 ns | 1.0 ns |
| Shoot Nutrient Accumulation (g per Plant) | ||||||||||
| Source of Variation | N | P | K | Ca | Mg | S | Cu | Fe | Mn | Zn |
| N | 733.6 ** | 405.8 ** | 420.4 ** | 354.7 ** | 207.6 ** | 334.6 ** | 149.6 ** | 12.6 ** | 118.9 ** | 282.0 ** |
| K | 1.26 ns | 2.87 ** | 21.0 ** | 1.75 ns | 4.78 ** | 2.2 ns | 7.9 ** | 0.31 ns | 2.32 ns | 0.41 ns |
| N × K | 1.26 ns | 0.85 ns | 11.18 ** | 4.49 * | 9.84 ** | 0.75 ns | 5.94 ** | 1.59 ns | 2.15 ns | 0.67 ns |
| MSE | 0.06 | 0.009 | 0.09 | 0.04 | 0.01 | 0.04 | 0.02 | 3.68 | 0.5 | 0.08 |
| CV% | 14.4 | 11.3 | 13.3 | 12.3 | 17.3 | 11.1 | 27.2 | 81.1 | 28.0 | 19.5 |
| Nutrient Use Efficiency (g2 per g) | ||||||||||
| Source of Variation | NUE N | NUE P | NUE K | NUE Ca | NUE Mg | NUE S | NUE Cu | NUE Fe | NUE Mn | NUE Zn |
| N | 242.2 ** | 457.2 ** | 119.1 ** | 598.6 ** | 352.1 ** | 348.5 ** | 262.7 ** | 108.8 ** | 171.4 ** | 202.8 ** |
| K | 2.9 ns | 0.4 ns | 3.1 * | 6.2 ** | 9.4 ** | 0.6 ns | 11.4 ** | 1.9 ns | 0.09 ns | 0.6 ns |
| N × K | 0.4 ns | 0.04 ns | 4.75 ** | 1.8 ns | 5.5 * | 0.06 ns | 17.1 ** | 2.2 ns | 1.31 ns | 0.4 ns |
| MSE | 45.6 | 264.6 | 62.2 | 55.5 | 299.5 | 70.8 | 445.1 | 10.4 | 18.1 | 60.1 |
| CV% | 16.5 | 19.14 | 35.5 | 16.5 | 21.9 | 22.5 | 21.0 | 35.0 | 27.4 | 23.3 |
Disclaimer/Publisher’s Note: The statements, opinions and data contained in all publications are solely those of the individual author(s) and contributor(s) and not of MDPI and/or the editor(s). MDPI and/or the editor(s) disclaim responsibility for any injury to people or property resulting from any ideas, methods, instructions or products referred to in the content. |
© 2024 by the authors. Licensee MDPI, Basel, Switzerland. This article is an open access article distributed under the terms and conditions of the Creative Commons Attribution (CC BY) license (https://creativecommons.org/licenses/by/4.0/).
Share and Cite
da Silva, B.C.; Cazetta, J.O.; de Mello Prado, R. Unraveling the Tolerance of Moringa oleifera to Excess K through Increased N Absorption and Mg Use Efficiency. Agronomy 2024, 14, 694. https://doi.org/10.3390/agronomy14040694
da Silva BC, Cazetta JO, de Mello Prado R. Unraveling the Tolerance of Moringa oleifera to Excess K through Increased N Absorption and Mg Use Efficiency. Agronomy. 2024; 14(4):694. https://doi.org/10.3390/agronomy14040694
Chicago/Turabian Styleda Silva, Bianca Cavalcante, Jairo Osvaldo Cazetta, and Renato de Mello Prado. 2024. "Unraveling the Tolerance of Moringa oleifera to Excess K through Increased N Absorption and Mg Use Efficiency" Agronomy 14, no. 4: 694. https://doi.org/10.3390/agronomy14040694
APA Styleda Silva, B. C., Cazetta, J. O., & de Mello Prado, R. (2024). Unraveling the Tolerance of Moringa oleifera to Excess K through Increased N Absorption and Mg Use Efficiency. Agronomy, 14(4), 694. https://doi.org/10.3390/agronomy14040694