
Substituting Partial Chemical Fertilizers with Bio-Organic Fertilizers to Reduce Greenhouse Gas Emissions in Water-Saving Irrigated Rice Fields

Abstract
1. Introduction
2. Materials and Methods
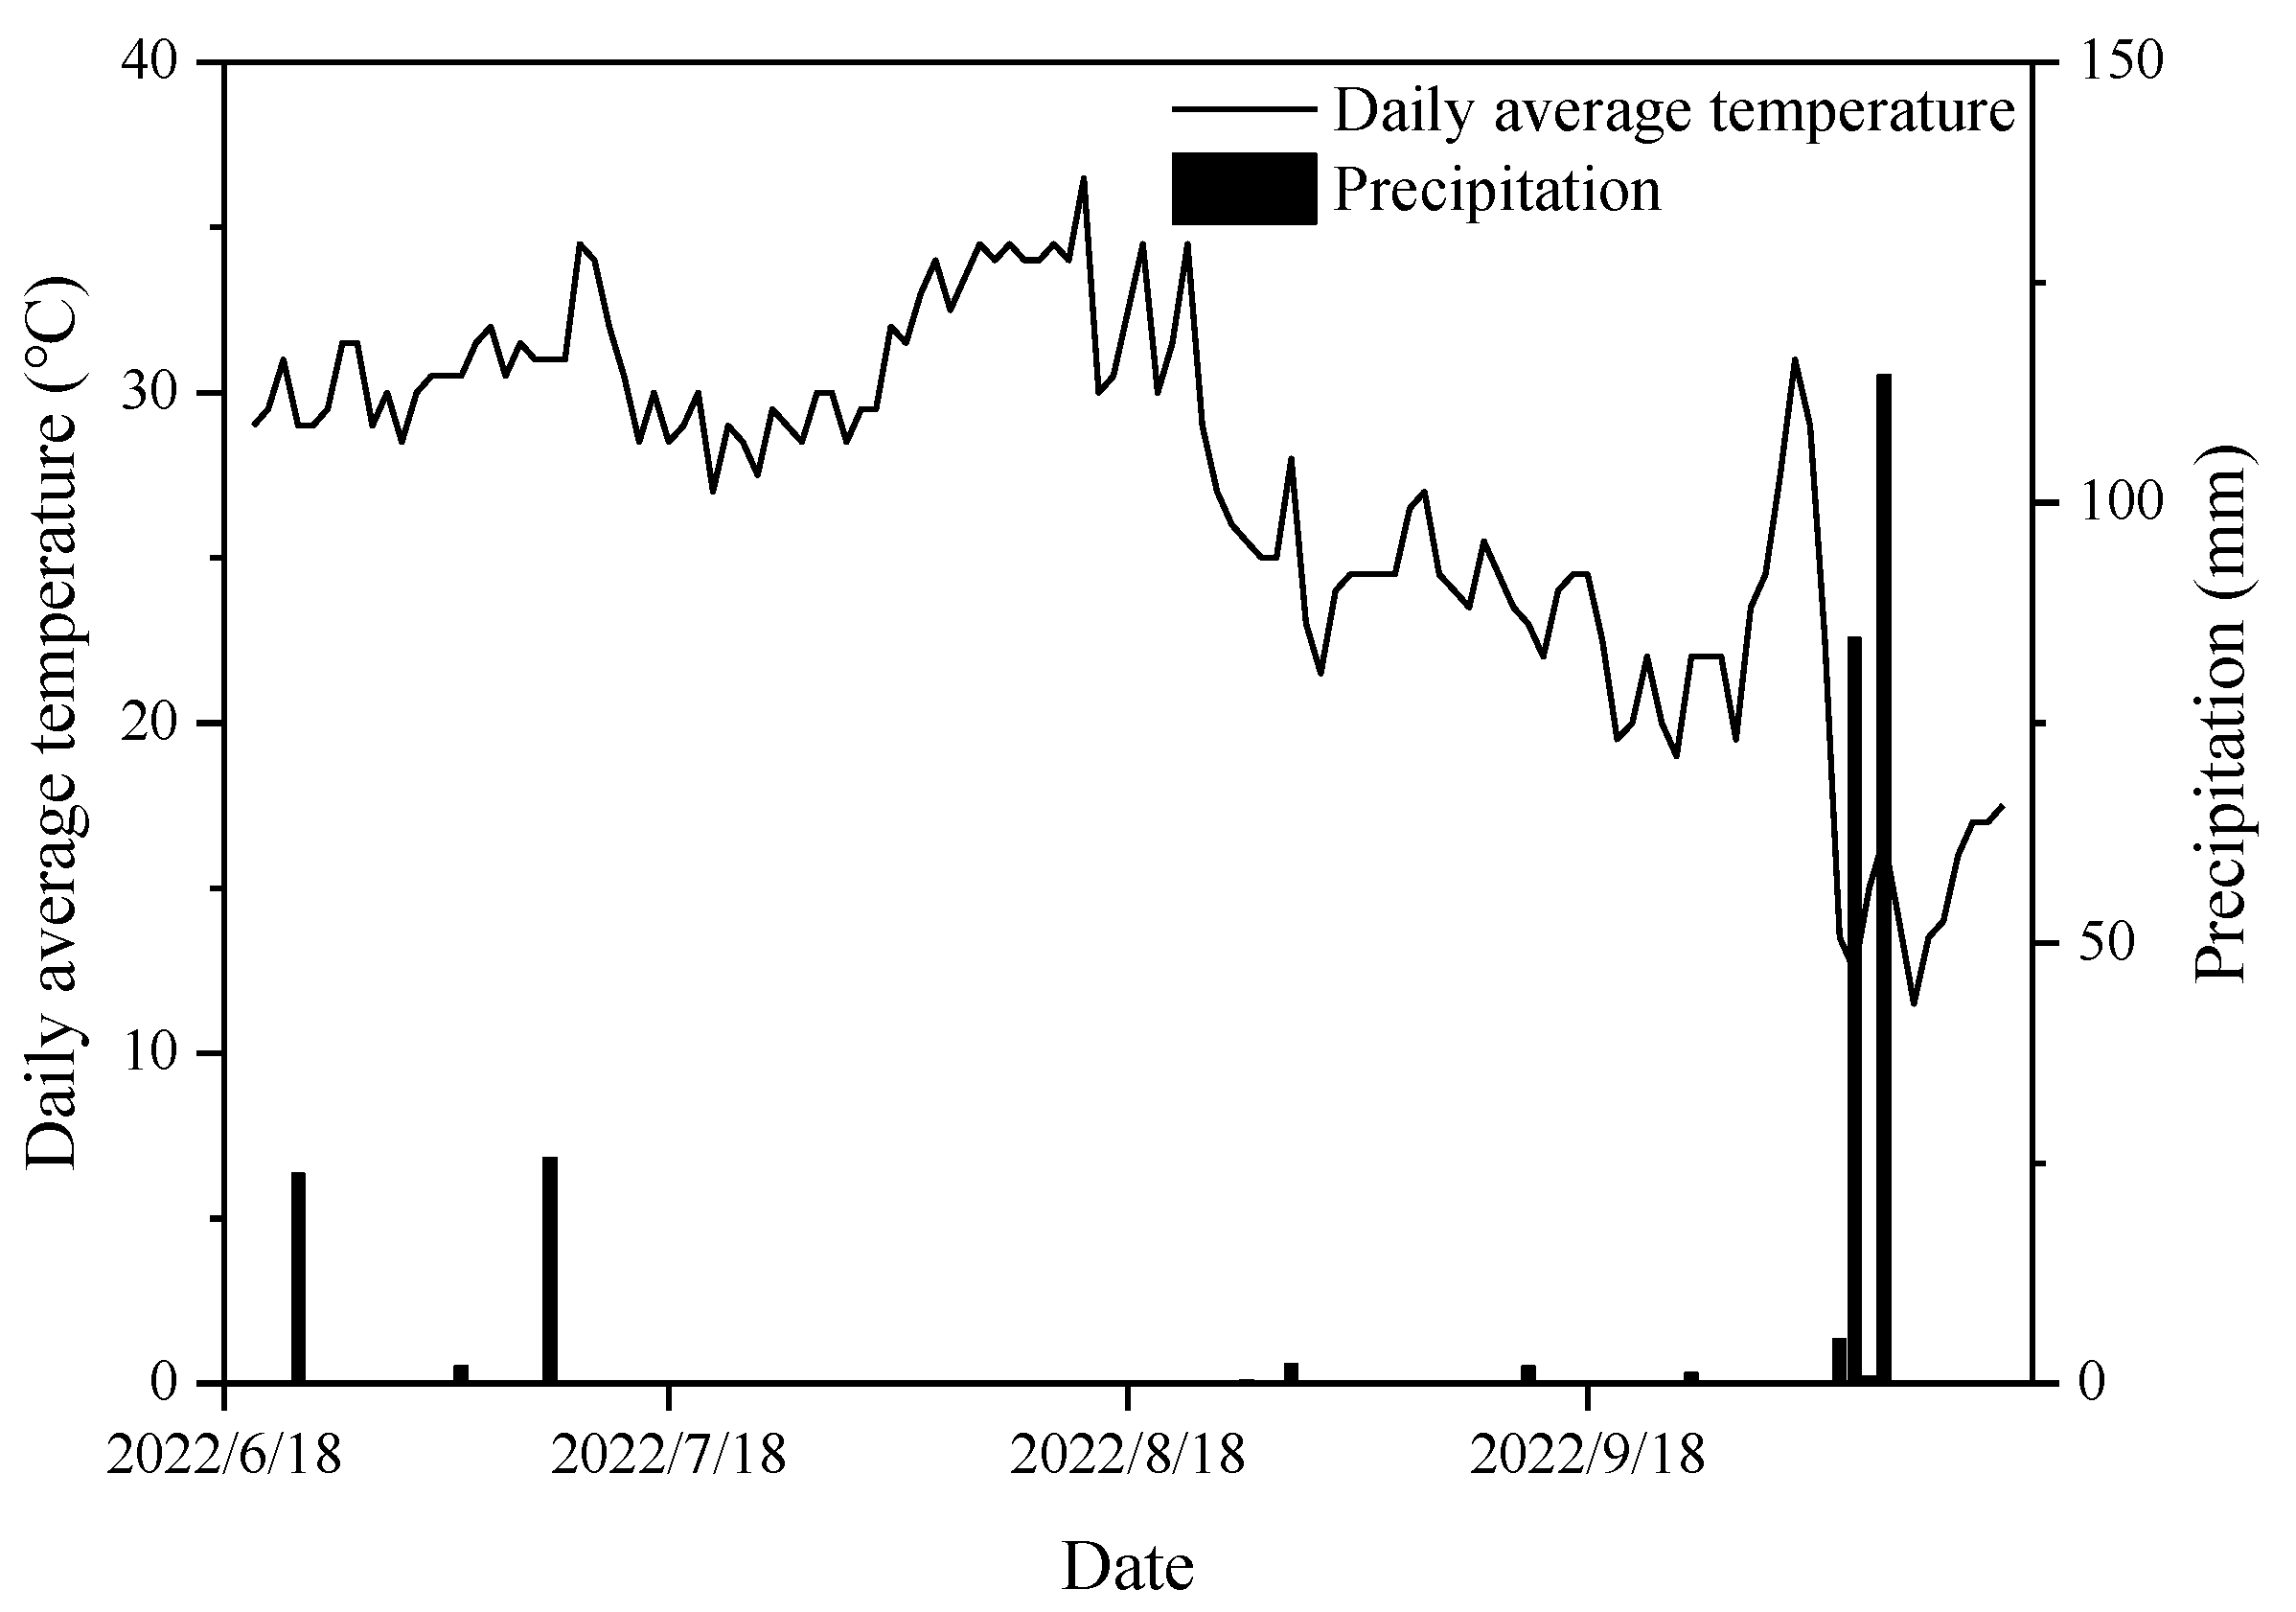
2.1. Experimental Site
2.2. Field Experiment Design
2.3. Gas Collection and Measurement
2.4. Soil Sample Collection and Analysis
2.5. Statistical Analyses
3. Results
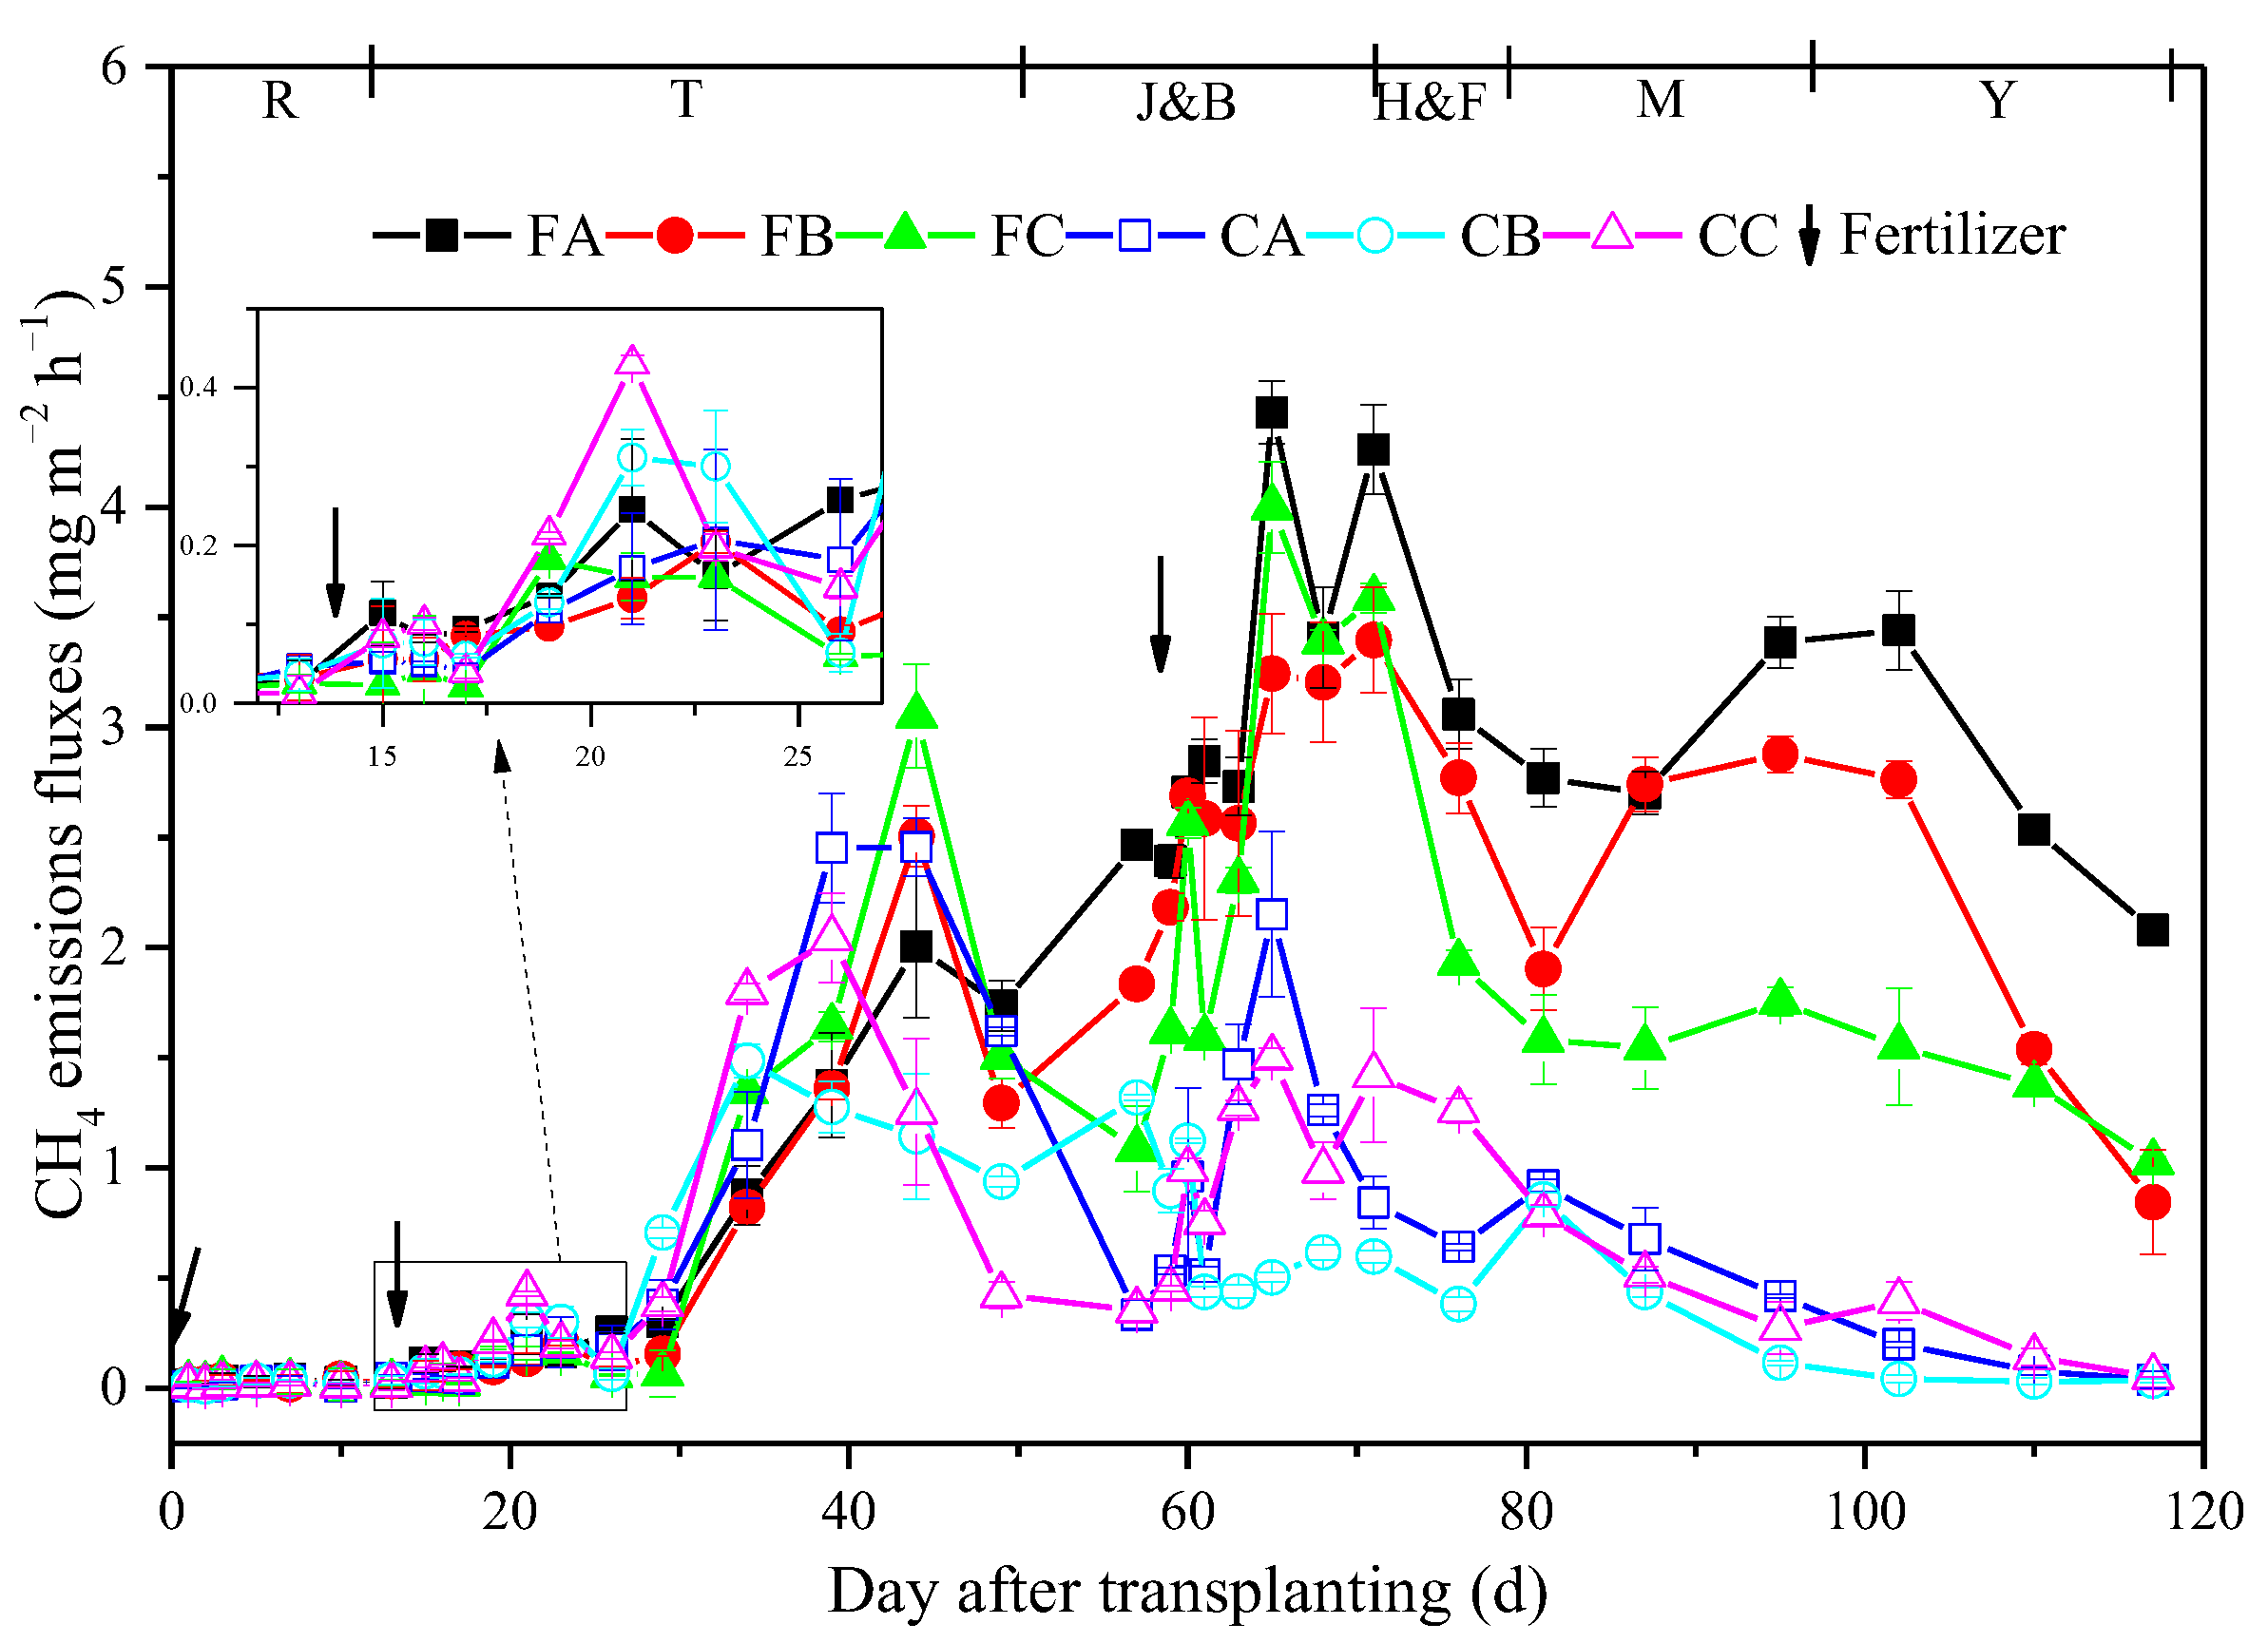
3.1. CH4 Emissions
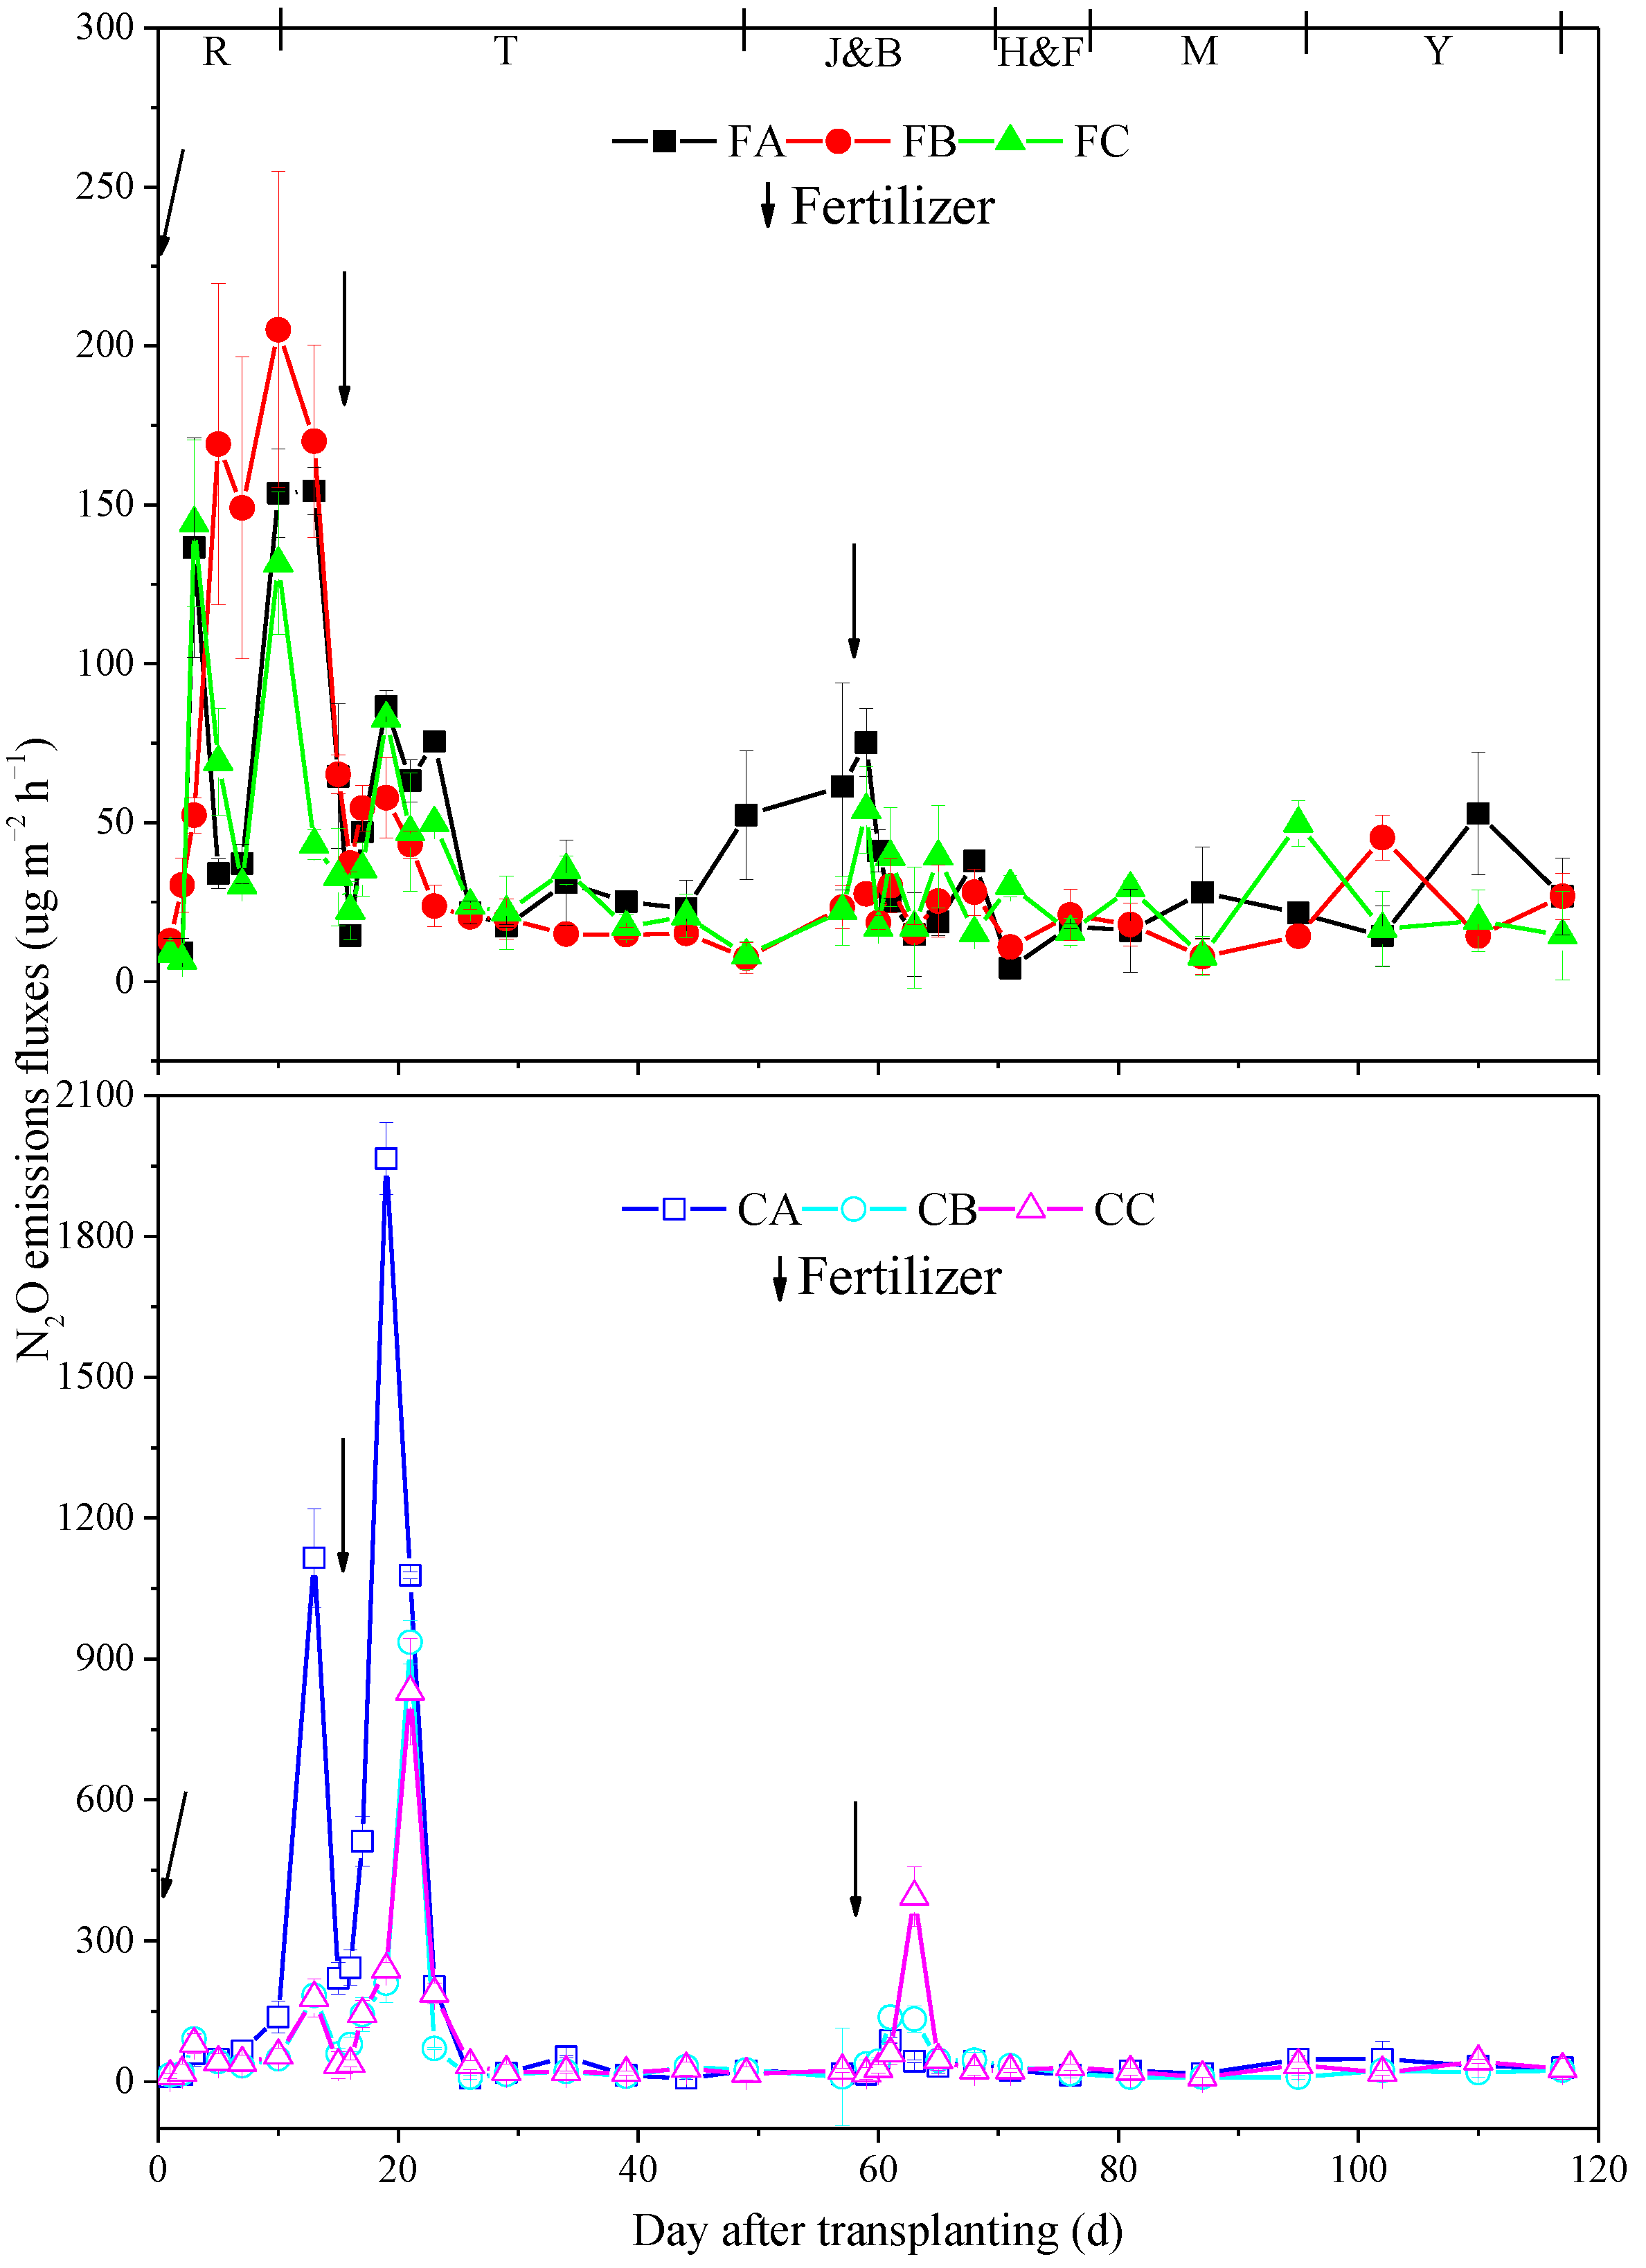
3.2. N2O Emissions
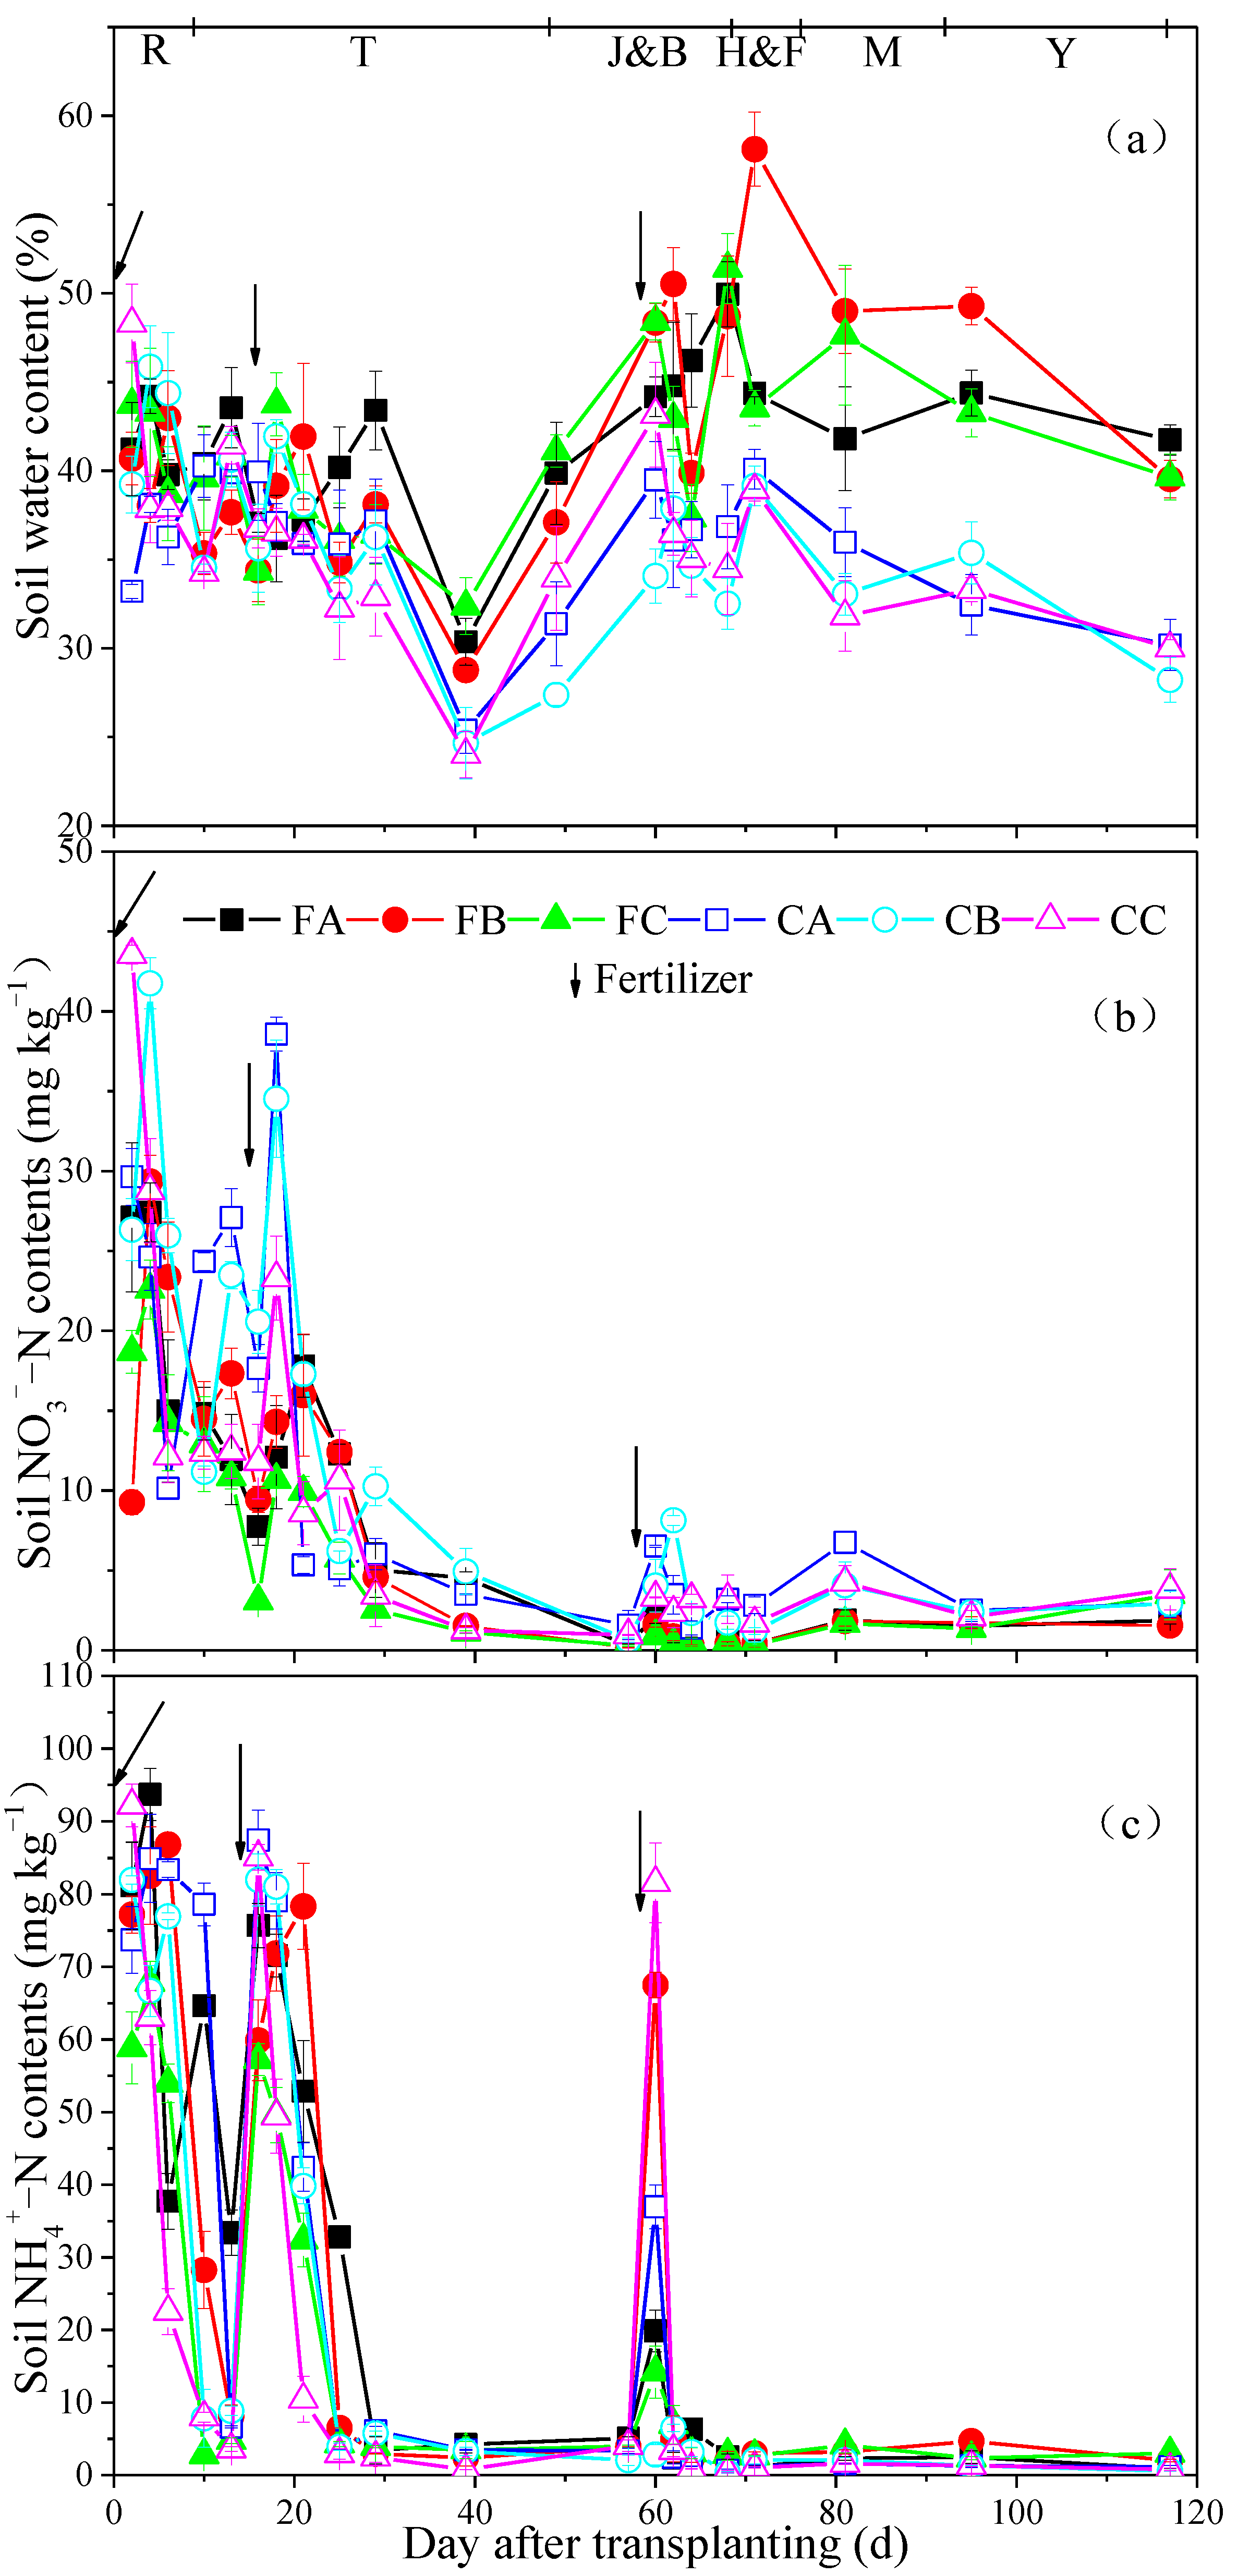
3.3. Soil NO3−-N and NH4+-N Contents
3.4. Relationships between CH4 and N2O Fluxes with Impact Factors
3.5. Rice Yield and Cumulative Gas Emissions
4. Discussion
4.1. Effect of Water and Fertilizer Management on CH4 Emissions
4.2. Effect of Water and Fertilizer Management on N2O Emissions
5. Conclusions
Author Contributions
Funding
Data Availability Statement
Conflicts of Interest
References
- World Meteorological Organization. WMO Greenhouse Gas Bulletin No. 16: The State of Greenhouse Gases in the Atmosphere Based on Global Observations through 2019; World Meteorological Organization: Geneva, Switzerland, 2019. [Google Scholar]
- World Meteorological Organization. United in Science 2021: A Multi-Organization High-Level Compilation of the Latest Climate Science Information; World Meteorological Organization: Geneva, Switzerland, 2021. [Google Scholar]
- Saunois, M. The Global Methane Budget 2000–2017. Earth Syst. 2020, 12, 1561–1623. [Google Scholar] [CrossRef]
- Lal, R. Intensive Agriculture and the Soil Carbon Pool. J. Crop. Improv. 2013, 27, 735–751. [Google Scholar] [CrossRef]
- Li, C.S.; Mosier, A.; Wassmann, R.; Cai, Z.C.; Zheng, X.H.; Huang, Y.; Tsuruta, H.; Boonjawat, J.; Lantin, R. Modeling greenhouse gas emissions from rice-based production systems: Sensitivity and upscaling. Global Biogeochem. Cycles 2004, 18, 1–19. [Google Scholar] [CrossRef]
- Huang, S.; Pant, H.K.; Lu, J. Effects of water regimes on nitrous oxide emission from soils. Ecol. Eng. 2007, 31, 9–15. [Google Scholar] [CrossRef]
- Bouwman, A.F. Direct emission of nitrous oxide from agricultural soils. Nutr. Cycl. Agroecosyst. 1996, 46, 53–70. [Google Scholar] [CrossRef]
- Liang, H.; Xu, J.; Hou, H.; Qi, Z.; Yang, S.; Li, Y.; Hu, K. Modeling CH4 and N2O emissions for continuous and noncontinuous flooding rice systems. Agric. Syst. 2022, 203, 1–13. [Google Scholar] [CrossRef]
- Sun, H.; Feng, Y.; Ji, Y.; Shi, W.; Yang, L.; Xing, B. N2O and CH4 emissions from N-fertilized rice paddy soil can be mitigated by wood vinegar application at an appropriate rate. Atmos. Environ. 2018, 185, 153–158. [Google Scholar] [CrossRef]
- Duchemin, M.; Hogue, R. Reduction in agricultural non-point source pollution in the first year following establishment of an integrated grass/tree filter strip system in southern Quebec (Canada). Agric. Ecosyst. Environ. 2009, 131, 85–97. [Google Scholar] [CrossRef]
- Lu, H.; Xie, H. Impact of changes in labor resources and transfers of land use rights on agricultural non-point source pollution in Jiangsu Province, China. J. Environ. Manag. 2018, 207, 134–140. [Google Scholar] [CrossRef]
- Li, X.; Weller, D.E.; Jordan, T.E. Watershed model calibration using multi-objective optimization and multi-site averaging. J. Hydrol. 2010, 380, 277–288. [Google Scholar] [CrossRef]
- Du, X.; Li, X.; Zhang, W.; Wang, H. Variations in source apportionments of nutrient load among seasons and hydrological years in a semi-arid watershed: GWLF model results. Environ. Sci. Pollut. R. 2014, 21, 6506–6515. [Google Scholar] [CrossRef] [PubMed]
- Guo, X.; Liu, J.; Xu, L.; Sun, F.; Ma, Y.; Yin, D.; Gao, Q.; Zheng, G.; Lv, Y. Combined Organic and Inorganic Fertilization Can Enhance Dry Direct-Seeded Rice Yield by Improving Soil Fungal Community and Structure. Agronomy 2022, 12, 1213. [Google Scholar] [CrossRef]
- Yang, Y.; Liu, B.; Ni, X.; Tao, L.; Yu, L.; Yang, Y.; Feng, M.; Zhong, W.; Wu, Y. Rice productivity and profitability with slow-release urea containing organic-inorganic matrix materials. Pedosphere 2021, 31, 511–520. [Google Scholar] [CrossRef]
- Ansari, R.A.; Mahmood, I. Optimization of organic and bio-organic fertilizers on soil properties and growth of pigeon pea. Sci. Hortic. 2017, 226, 1–9. [Google Scholar] [CrossRef]
- Huang, N.; Wang, W.W.; Yao, Y.L.; Zhu, F.X.; Wang, W.P.; Chang, X.J. The influence of different concentrations of bio-organic fertilizer on cucumber Fusarium wilt and soil microflora alterations. PLoS ONE 2017, 12, e0171490. [Google Scholar] [CrossRef] [PubMed]
- Wang, J.F.; Li, X.L.; Xing, S.Z.; Ma, Z.Y.; Hu, S.J.; Tu, C. Bio-organic Fertilizer Promotes Plant Growth and Yield and Improves Soil Microbial Community in Continuous Monoculture System of Chrysanthemum morifolium cv. Chuju. Int. J. Agric. Biol. 2017, 19, 563–568. [Google Scholar] [CrossRef]
- Li, Y.; Zheng, Q.; Yang, R.; Zhuang, S.; Lin, W.; Li, Y. Evaluating microbial role in reducing N2O emission by dual isotopocule mapping following substitution of inorganic fertilizer for organic fertilizer. J. Clean Prod. 2021, 326, 129442. [Google Scholar] [CrossRef]
- Ma, Q.Y.; Li, J.W.; Aamer, M.; Huang, G.Q. Effect of Chinese Milk Vetch Astragalus sinicus and Rice Straw Incorporated in Paddy Soil on Greenhouse Gas Emission and Soil Properties. Agronomy 2020, 10, 717. [Google Scholar] [CrossRef]
- Thuries, L.; Pansu, M.; Larre-Larrouy, M.C.; Feller, C. Biochemical composition and mineralization kinetics of organic inputs in a sandy soil. Soil Biol. Biochem. 2002, 34, 239–250. [Google Scholar] [CrossRef]
- Yuan, J.; Yuan, Y.; Zhu, Y.; Cao, L. Effects of different fertilizers on methane emissions and methanogenic community structures in paddy rhizosphere soil. Sci. Total Environ. 2018, 627, 770–781. [Google Scholar] [CrossRef]
- Kim, S.Y.; Pramanik, P.; Gutierrez, J.; Hwang, H.Y.; Kim, P.J. Comparison of methane emission characteristics in air-dried and composted cattle manure amended paddy soil during rice cultivation. Agric. Ecosyst. Environ. 2014, 197, 60–67. [Google Scholar] [CrossRef]
- Linquist, B.A.; Adviento-Borbe, M.A.; Pittelkow, C.M.; Van Kessel, C.; Van Groenigen, K.J. Fertilizer management practices and greenhouse gas emissions from rice systems: A quantitative review and analysis. Field Crops Res. 2012, 135, 10–21. [Google Scholar] [CrossRef]
- Zhang, X.; Zhou, S.; Bi, J.; Sun, H.; Wang, C.; Zhang, J. Drought-resistance rice variety with water-saving management reduces greenhouse gas emissions from paddies while maintaining rice yields. Agric. Ecosyst. Environ. 2021, 320, 107592. [Google Scholar] [CrossRef]
- Zhuang, Y.; Zhang, L.; Li, S.; Liu, H.; Zhai, L.; Zhou, F.; Ye, Y.; Ruan, S.; Wen, W. Effects and potential of water-saving irrigation for rice production in China. Agric. Water Manag. 2019, 217, 374–382. [Google Scholar] [CrossRef]
- Song, C.C.; Zhang, J.B.; Wang, Y.Y.; Wang, Y.S.; Zhao, Z.C. Emission of CO2, CH4 and N2O from freshwater marsh in northeast of China. J. Environ. Manag. 2008, 88, 428–436. [Google Scholar] [CrossRef] [PubMed]
- Zou, J.W.; Huang, Y.; Jiang, J.Y.; Zheng, X.H.; Sass, R.L. A 3-year field measurement of methane and nitrous oxide emissions from rice paddies in China: Effects of water regime, crop residue, and fertilizer application. Glob. Biogeochem. Cycles 2005, 19, 1–9. [Google Scholar] [CrossRef]
- Peng, S.; Yang, S.; Xu, J.; Gao, H. Field experiments on greenhouse gas emissions and nitrogen and phosphorus losses from rice paddy with efficient irrigation and drainage management. Sci. China Technol. Sci. 2011, 54, 1581–1587. [Google Scholar] [CrossRef]
- Hou, H.J.; Yang, S.H.; Wang, F.T.; Li, D.; Xu, J.Z. Controlled irrigation mitigates the annual integrative global warming potential of methane and nitrous oxide from the rice-winter wheat rotation systems in Southeast China. Ecol. Eng. 2016, 86, 239–246. [Google Scholar] [CrossRef]
- Xu, J.; Liu, B.; Wang, H.; Liu, W.; Li, Y.; Dai, Y.; Lu, T. Ammonia volatilization and nitrogen leaching following top-dressing of urea from water-saving irrigated rice field: Impact of two-split surge irrigation. Paddy Water Environ. 2019, 17, 45–51. [Google Scholar] [CrossRef]
- Hou, H.J.; Peng, S.Z.; Xu, J.Z.; Yang, S.H.; Mao, Z. Seasonal variations of CH4 and N2O emissions in response to water management of paddy fields located in Southeast China. Chemosphere 2012, 89, 884–892. [Google Scholar] [CrossRef]
- Qian, H.; Chen, J.; Zhu, X.; Wang, L.; Liu, Y.; Zhang, J.; Deng, A.; Song, Z.; Ding, Y.; Jiang, Y.; et al. Intermittent flooding lowers the impact of elevated atmospheric CO2 on CH4 emissions from rice paddies. Agric. Ecosyst. Environ. 2022, 329, 107872. [Google Scholar] [CrossRef]
- Liao, B.; Cai, T.; Wu, X.; Luo, Y.; Liao, P.; Zhang, B.; Zhang, Y.; Wei, G.; Hu, R.; Luo, Y.; et al. A combination of organic fertilizers partially substitution with alternate wet and dry irrigation could further reduce greenhouse gases emission in rice field. J. Environ. Manag. 2023, 344, 118372. [Google Scholar] [CrossRef] [PubMed]
- Wang, J.; Zhang, X.; Xiong, Z.; Khalil, M.A.K.; Zhao, X.; Xie, Y.; Xing, G. Methane emissions from a rice agroecosystem in South China: Effects of water regime, straw incorporation and nitrogen fertilizer. Nutr. Cycl. Agroecosyst. 2012, 93, 103–112. [Google Scholar] [CrossRef]
- Cai, Z.; Shan, Y.; Xu, H. Effects of nitrogen fertilization on CH4 emissions from rice fields. Soil Sci. Plant Nutr. 2007, 53, 353–361. [Google Scholar] [CrossRef]
- Zhou, M.H.; Zhu, B.; Wang, X.G.; Wang, Y.Q. Long-term field measurements of annual methane and nitrous oxide emissions from a Chinese subtropical wheat-rice rotation system. Soil Biol. Biochem. 2017, 115, 21–34. [Google Scholar] [CrossRef]
- Kumaraswamy, S.; Ramakrishnan, B.; Sethunathan, N. Methane production and oxidation in an anoxic rice soil as influenced by inorganic redox species. J. Environ. Qual. 2001, 30, 2195–2201. [Google Scholar] [CrossRef] [PubMed]
- Lin, S.; Zhang, S.; Shen, G.; Shaaban, M.; Ju, W.; Cui, Y.; Duan, C.; Fang, L. Effects of inorganic and organic fertilizers on CO2 and CH4 fluxes from tea plantation soil. Elementa-Sci. Anthrop. 2021, 9, 090. [Google Scholar] [CrossRef]
- Jeong, S.T.; Kim, G.W.; Hwang, H.Y.; Kim, P.J.; Kim, S.Y. Beneficial effect of compost utilization on reducing greenhouse gas emissions in a rice cultivation system through the overall management chain. Sci. Total Environ. 2018, 613, 115–122. [Google Scholar] [CrossRef]
- Zhang, T.; Liu, H.; Luo, J.; Wang, H.; Zhai, L.; Geng, Y.; Zhang, Y.; Li, J.; Lei, Q.; Bashir, M.A.; et al. Long-term manure application increased greenhouse gas emissions but had no effect on ammonia volatilization in a Northern China upland field. Sci. Total Environ. 2018, 633, 230–239. [Google Scholar] [CrossRef]
- Wassmann, R.; Lantin, R.S.; Neue, H.U.; Buendia, L.V.; Corton, T.M.; Lu, Y. Characterization of methane emissions from rice fields in Asia. III. Mitigation options and future research needs. Nutr. Cycl. Agroecosyst. 2000, 58, 23–36. [Google Scholar] [CrossRef]
- Harada, N.; Otsuka, S.; Nishiyama, M.; Matsumoto, S. Influences of indigenous phototrophs on methane emissions from a straw-amended paddy soil. Biol. Fert. Soils. 2005, 41, 46–51. [Google Scholar] [CrossRef]
- Chen, Y.; Li, S.; Zhang, Y.; Li, T.; Ge, H.; Xia, S.; Gu, J.; Zhang, H.; Lu, B.; Wu, X.; et al. Rice root morphological and physiological traits interaction with rhizosphere soil and its effect on methane emissions in paddy fields. Soil Biol. Biochem. 2019, 129, 191–200. [Google Scholar] [CrossRef]
- Matsuda, S.; Nakamura, K.; Tran, H.; Le Xuan, Q.; Haruhiko, H.; Pham Thanh, H.; Nguyen Dang, H.; Hama, T. Paddy ponding water management to reduce methane emission based on observations of methane fluxes and soil redox potential in the Red River Delta, Vietnam*. Irrig. Drain. 2022, 71, 241–254. [Google Scholar] [CrossRef]
- Chen, D.; Wang, C.; Shen, J.; Li, Y.; Wu, J. Response of CH4 emissions to straw and biochar applications in double-rice cropping systems: Insights from observations and modeling. Environ. Pollut. 2018, 235, 95–103. [Google Scholar] [CrossRef] [PubMed]
- Oo, A.Z.; Sudo, S.; Inubushi, K.; Mano, M.; Yamamoto, A.; Ono, K.; Osawa, T.; Hayashida, S.; Patra, P.K.; Terao, Y.; et al. Methane and nitrous oxide emissions from conventional and modified rice cultivation systems in South India. Agric. Ecosyst. Environ. 2018, 252, 148–158. [Google Scholar] [CrossRef]
- Liao, B.; Wu, X.; Yu, Y.; Luo, S.; Hu, R.; Lu, G. Effects of mild alternate wetting and drying irrigation and mid-season drainage on CH4 and N2O emissions in rice cultivation. Sci. Total Environ. 2020, 698, 134212. [Google Scholar] [CrossRef] [PubMed]
- Xia, L.; Lam, S.K.; Yan, X.; Chen, D. How Does Recycling of Livestock Manure in Agroecosystems Affect Crop Productivity, Reactive Nitrogen Losses, and Soil Carbon Balance? Environ. Sci. Technol. 2017, 51, 7450–7457. [Google Scholar] [CrossRef]
- Huang, T.; Gao, B.; Hu, X.-K.; Lu, X.; Well, R.; Christie, P.; Bakken, L.R.; Ju, X.-T. Ammonia-oxidation as an engine to generate nitrous oxide in an intensively managed calcareous Fluvo-aquic soil. Sci. Rep. 2014, 4, 3950. [Google Scholar] [CrossRef]
- Peng, S.; Hou, H.; Xu, J.; Mao, Z.; Abudu, S.; Luo, Y. Nitrous oxide emissions from paddy fields under different water managements in southeast China. Paddy Water Environ. 2011, 9, 403–411. [Google Scholar] [CrossRef]
- Cai, Z.; Laughlin, R.J.; Stevens, R.J. Nitrous oxide and dinitrogen emissions from soil under different water regimes and straw amendment. Chemosphere 2001, 42, 113–121. [Google Scholar] [CrossRef]
- Shan, J.; Yan, X. Effects of crop residue returning on nitrous oxide emissions in agricultural soils. Atmos. Environ. 2013, 71, 170–175. [Google Scholar] [CrossRef]
- Tao, R.; Li, J.; Guan, Y.; Liang, Y.; Hu, B.; Lv, J.; Chu, G. Effects of urease and nitrification inhibitors on the soil mineral nitrogen dynamics and nitrous oxide (N2O) emissions on calcareous soil. Environ. Sci. Pollut. Res. Int. 2018, 25, 9155–9164. [Google Scholar] [CrossRef] [PubMed]
- Li, Y.; Xu, J.; Liu, X.; Qi, Z.; Wang, H.; Li, Y.; Liao, L. Nitrification inhibitor DMPP offsets the increase in N2O emission induced by soil salinity. Biol. Fertility Soils. 2020, 56, 1211–1217. [Google Scholar] [CrossRef]
- Ma, J.; Li, X.L.; Xu, H.; Han, Y.; Cai, Z.C.; Yagi, K. Effects of nitrogen fertiliser and wheat straw application on CH4 and N2O emissions from a paddy rice field. Aust. J. Soil Res. 2007, 45, 359–367. [Google Scholar] [CrossRef]
- Li, J.; Li, Y.E.; Wan, Y.; Wang, B.; Waqas, M.A.; Cai, W.; Guo, C.; Zhou, S.; Su, R.; Qin, X.; et al. Combination of modified nitrogen fertilizers and water saving irrigation can reduce greenhouse gas emissions and increase rice yield. Geoderma 2018, 315, 1–10. [Google Scholar] [CrossRef]

| Factor | CH4 | N2O | ||
|---|---|---|---|---|
| F | p | F | p | |
| Fertilizer | 6 | 0.014 | 216 | <0.001 |
| Irrigation | 681 | <0.001 | 613 | <0.001 |
| Fertilizer × Irrigation | 16 | <0.001 | 244 | <0.001 |
| Treatment | Gas | Soil Water Content | NO3−-N | NH4+-N |
|---|---|---|---|---|
| FA | CH4 | 0.531 * | −0.764 ** | −0.736 ** |
| N2O | −0.105 | 0.257 | 0.309 | |
| FB | CH4 | 0.693 * | −0.740 ** | −0.506 * |
| N2O | −0.290 | 0.799 ** | 0.379 | |
| FC | CH4 | 0.392 | −0.686 ** | −0.531 * |
| N2O | −0.024 | 0.459 * | 0.123 | |
| CA | CH4 | −0.426 | −0.572 ** | −0.574 ** |
| N2O | 0.218 | 0.597 ** | 0.288 | |
| CB | CH4 | −0.577 ** | −0.567 ** | −0.514 * |
| N2O | 0.214 | 0.218 | 0.188 | |
| CC | CH4 | −0.331 | −0.542 * | −0.318 |
| N2O | 0.084 | 0.013 | −0.103 |
| Treatment | FA | FB | FC | CA | CB | CC |
|---|---|---|---|---|---|---|
| Yield (kg ha−1) | 9247.8 a | 9271.5 a | 9232.7 a | 9212.2 a | 9205.2 a | 9135.3 a |
| Cumulative CH4 emissions (kg ha−1) | 55.2 a | 45.6 b | 38.8 c | 19.7 d | 14.0 e | 17.4 d |
| Cumulative N2O emissions (kg ha−1) | 1.1 c | 1.0 cd | 0.9 d | 3.4 a | 1.5 b | 1.7 b |
| GWP (kg CO2 ha−1) | 1710.2 a | 1434.7 b | 1226.6 c | 1507.6 b | 782.3 e | 934.8 d |
| GHGI (kg CO2 t−1) | 184.9 a | 155.7 b | 132.9 c | 163.7 b | 85.0 e | 102.3 d |
Disclaimer/Publisher’s Note: The statements, opinions and data contained in all publications are solely those of the individual author(s) and contributor(s) and not of MDPI and/or the editor(s). MDPI and/or the editor(s) disclaim responsibility for any injury to people or property resulting from any ideas, methods, instructions or products referred to in the content. |
© 2024 by the authors. Licensee MDPI, Basel, Switzerland. This article is an open access article distributed under the terms and conditions of the Creative Commons Attribution (CC BY) license (https://creativecommons.org/licenses/by/4.0/).
Share and Cite
Han, Z.; Hou, H.; Yao, X.; Qian, X.; Zhou, M. Substituting Partial Chemical Fertilizers with Bio-Organic Fertilizers to Reduce Greenhouse Gas Emissions in Water-Saving Irrigated Rice Fields. Agronomy 2024, 14, 544. https://doi.org/10.3390/agronomy14030544
Han Z, Hou H, Yao X, Qian X, Zhou M. Substituting Partial Chemical Fertilizers with Bio-Organic Fertilizers to Reduce Greenhouse Gas Emissions in Water-Saving Irrigated Rice Fields. Agronomy. 2024; 14(3):544. https://doi.org/10.3390/agronomy14030544
Chicago/Turabian StyleHan, Zhengdi, Huijing Hou, Xianzi Yao, Xiang Qian, and Mingyao Zhou. 2024. "Substituting Partial Chemical Fertilizers with Bio-Organic Fertilizers to Reduce Greenhouse Gas Emissions in Water-Saving Irrigated Rice Fields" Agronomy 14, no. 3: 544. https://doi.org/10.3390/agronomy14030544
APA StyleHan, Z., Hou, H., Yao, X., Qian, X., & Zhou, M. (2024). Substituting Partial Chemical Fertilizers with Bio-Organic Fertilizers to Reduce Greenhouse Gas Emissions in Water-Saving Irrigated Rice Fields. Agronomy, 14(3), 544. https://doi.org/10.3390/agronomy14030544