Article

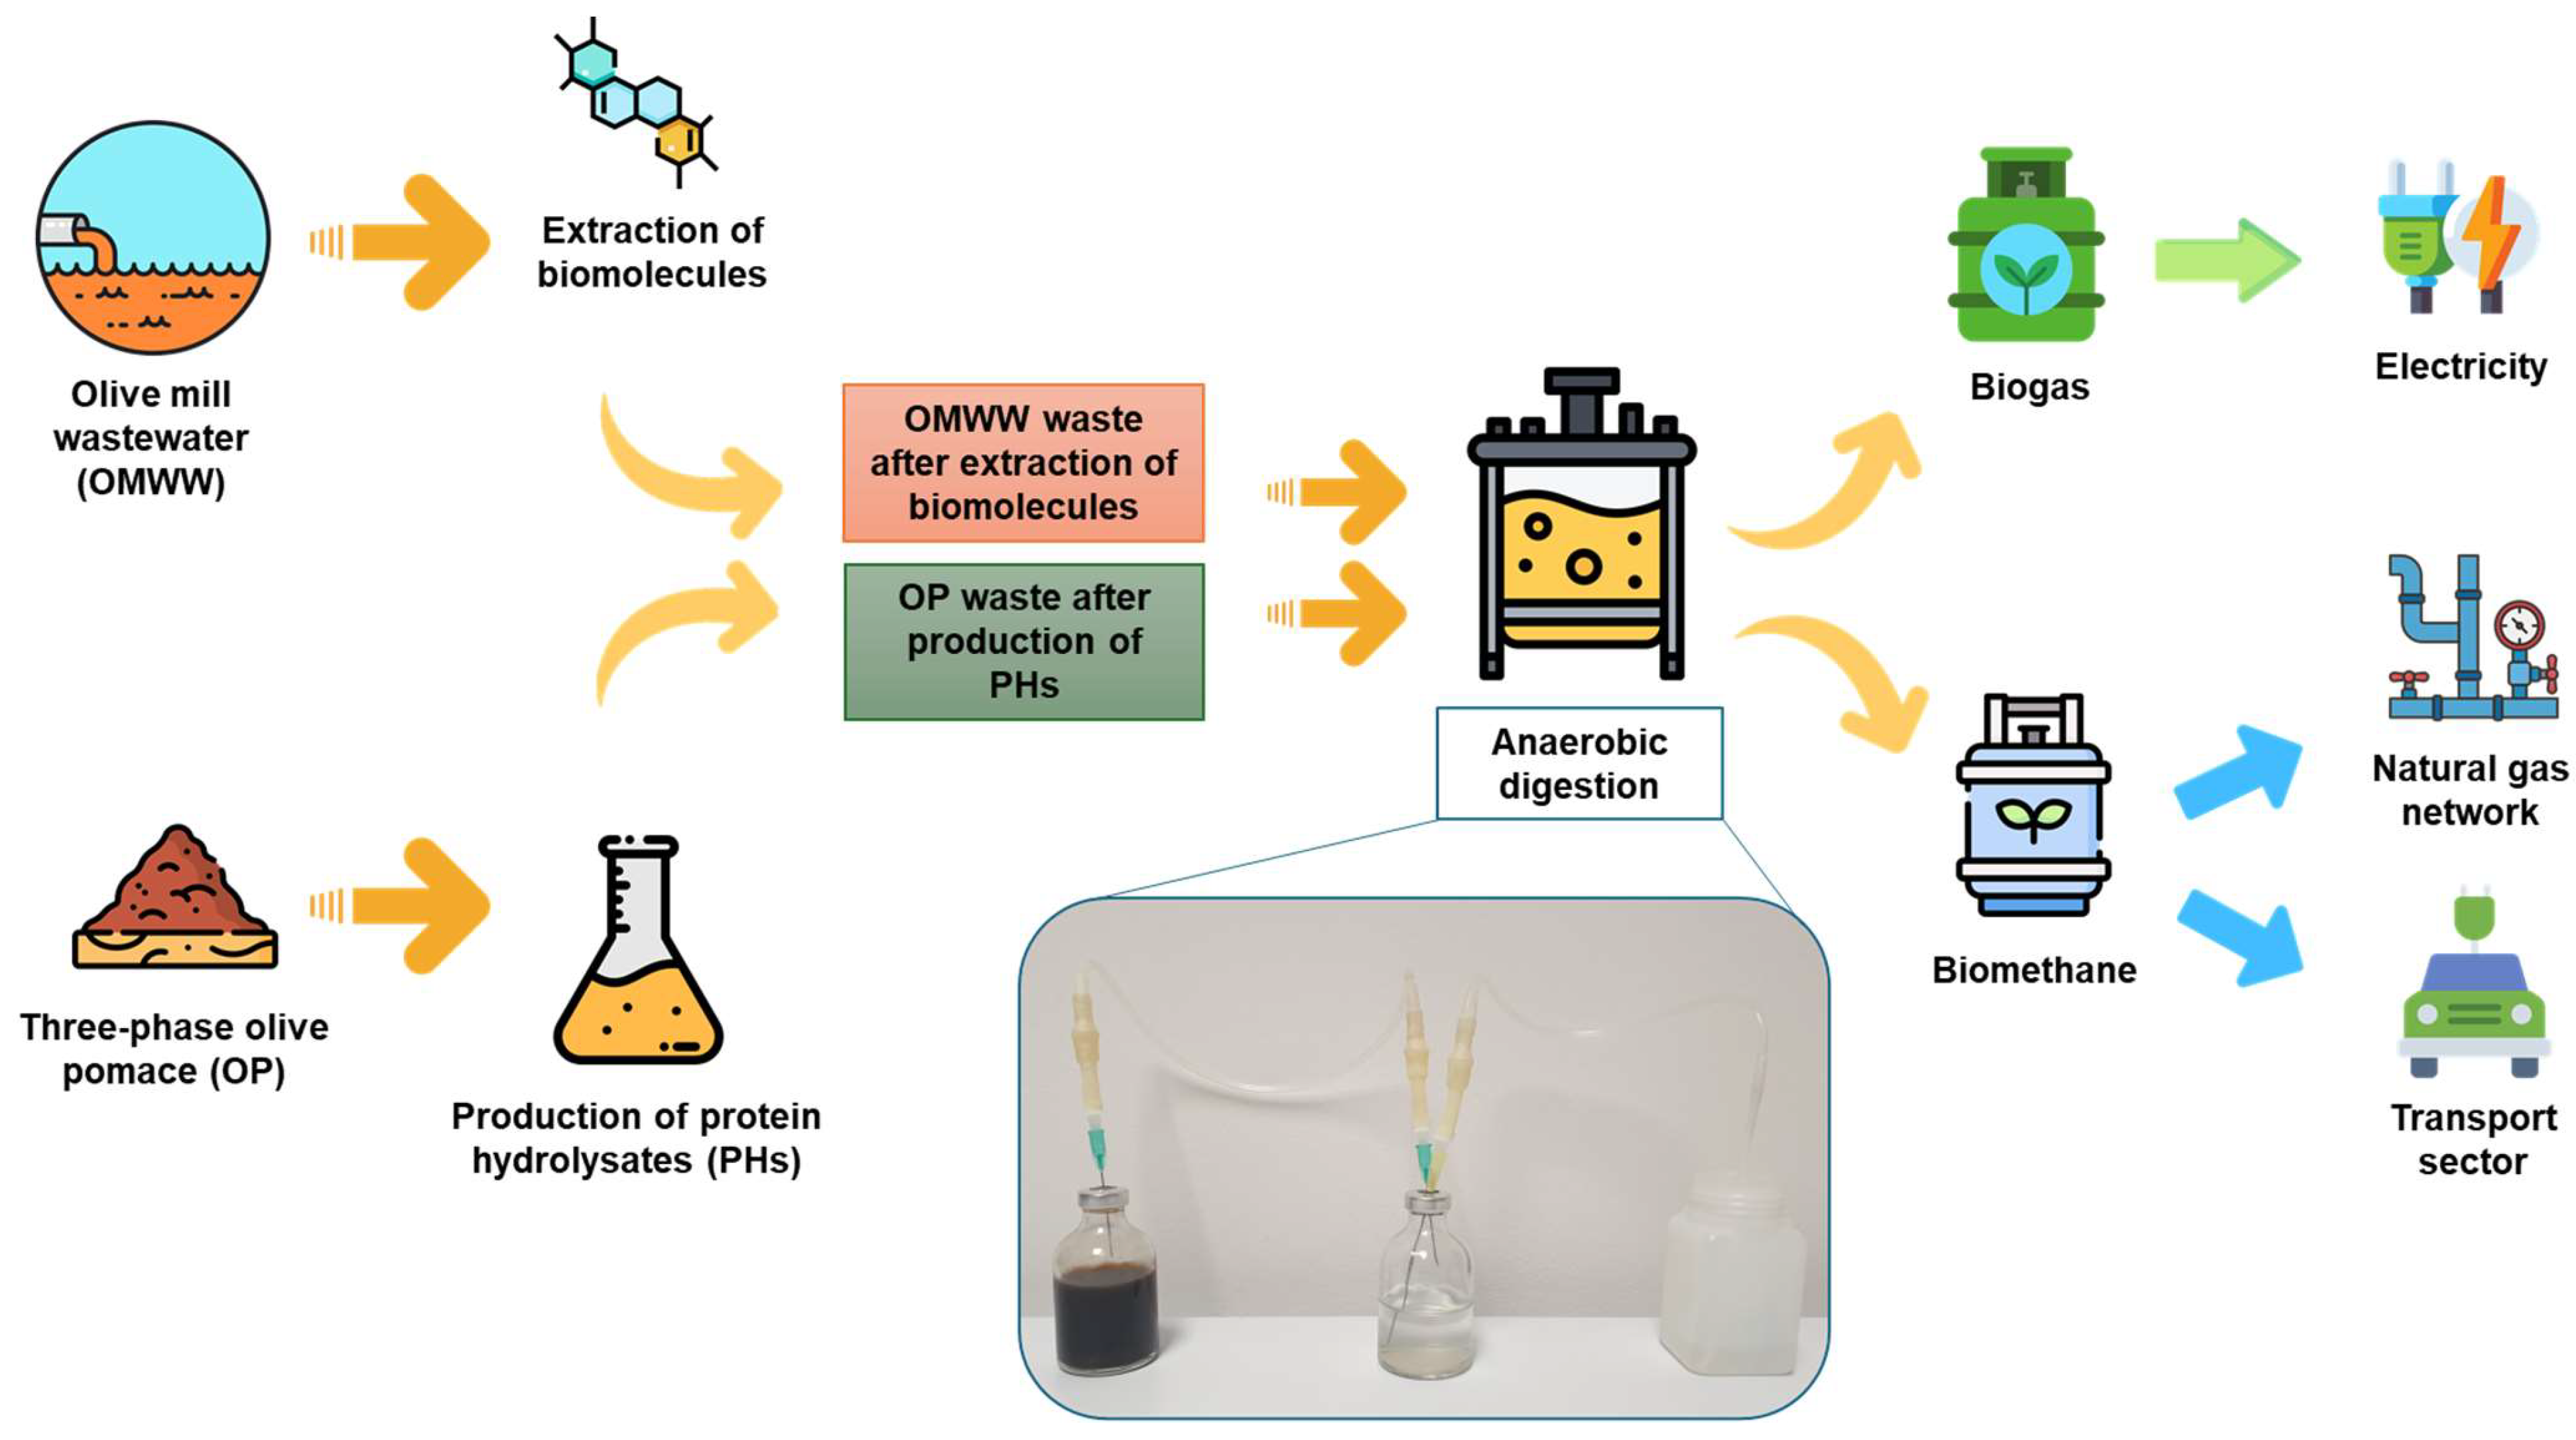
Biogas Production with Residuals Deriving from Olive Mill Wastewater and Olive Pomace Wastes: Quantification of Produced Energy, Spent Energy, and Process Efficiency

1
Department of Civil and Environmental Engineering, University of Perugia, Via G. Duranti 93, 06125 Perugia, Italy
2
Biochemistry and Molecular Biology Section, Department of Chemistry, Biology and Biotechnology, University of Perugia, Via del Giochetto, 06126 Perugia, Italy
3
Centro di Eccellenza Materiali Innovativi Strutturali (CEMIN), University of Perugia, Via del Giochetto, 06126 Perugia, Italy
4
UdR INSTM, Department of Civil and Environmental Engineering, University of Perugia, 05100 Terni, Italy
5
Department of Pharmaceutical Sciences, University of Perugia, 06122 Perugia, Italy
*
Author to whom correspondence should be addressed.
Agronomy 2024, 14(3), 531; https://doi.org/10.3390/agronomy14030531
Submission received: 29 January 2024 / Revised: 28 February 2024 / Accepted: 2 March 2024 / Published: 4 March 2024
(This article belongs to the Section Agricultural Biosystem and Biological Engineering)

Abstract

:
At present, taking into account the sustainability of the starting matrices, the biogas production industry is continuously growing, especially in consideration of ecological transition and circularity. The present study deals with the development of anaerobic bioreactors aimed at valorizing two specific wastes of the olive oil supply chain, i.e., the residual of protein hydrolysis process of three-phases olive pomace (OP-PH) and that recovered after the extraction of bioactive molecules from olive mill wastewater (OMWW waste). The energy consumed for biogas production varied from 0.52 kJ (OP and OMWW waste) to 0.97 kJ (OP-PH), while the energy produced for OP, OP-PH and OMMW waste was equal to 1.73, 2.94 and 1.60 kJ, respectively. The optimal production period was defined by considering only the range showing energy production higher than its consumption. According to this, OMWW showed the best performances, since it required 9 days (instead of 12 of untreated and treated OP) to reach the completion. The biogas production efficiency of the three-phase OP-PH waste calculated in the optimal production period, i.e., 12 days, was higher than the other samples, with a yield of 76.7% and a quantity of energy potentially producible corresponding to 1727.8 kJ/kg of volatile solids. These results pave the way for possible applications of this procedure for the planning of a multi-purpose biorefinery fed with by-products from the olive supply chain waste, thus promoting the use of sustainable waste materials from a circular economy perspective.

Graphical Abstract

1. Introduction

Nowadays, the industrial processing of agri-food products gives rise to large quantities of by-products that must be disposed of [1]. A considerable effort is currently in progress to find use and utility for the waste inevitably produced and to give new value to waste biomass by transforming it into products that can be used in other industrial fields and reintroduced into the market, thus responding to the circular economy challenge [2,3,4,5]. Most agricultural and agri-food waste biomasses preserve a high content of potentially recoverable bioactive compounds that can be exploited to produce high-added-value products, such as protein hydrolysates (PHs) or low-added-value products, such as compost or digestate [1,6,7,8,9]. The former have multiple applications in various industrial sectors, from the food industry, both human and animal, to the nutraceutical sector, the cosmetics industry, and the agricultural field; differently, the low-added-value products mainly find applications in the agricultural sector [1,8,10,11,12,13]. Agricultural waste biomass has been identified as low-cost raw material and represents a good portion of the biomass present in the world. It is estimated that globally 140 billion tons of biomass are generated from agricultural waste every year [14,15]. Among all the activities of the Mediterranean region, the olive industry produces tons of waste every year that could be valorized and reintroduced into the market, i.e., olive pomace (OP) and olive mill wastewater (OMWW). Olive cultivation and olive oil making are in fact crucial activities in the Mediterranean basin of social and financial significance, as a matter of fact over 98% of the world’s olive oil is produced in this area, and Italy is one of the greatest manufacturers in this sector, alongside Spain, Greece, and Portugal [7,16,17]. This large industry, however, generates large quantities of waste, which often have significant ecological implications due to their environmental impact, furthermore, they represent an economic problem for olive-oil-producing companies as they have to take charge of their disposal [16,18,19]. Specifically, the olive industry produces large quantities of wet and solid by-products, such as OP and OMWW [18,20]. The OP resulting from the processing of olives represents approximately 35–40% of the total weight of the olive and is made up of the solid part left after the milling process in the oil mill, i.e., stone, and the pulp and peel [21,22]. It has been estimated that the annual global production of OP is around 400 million tons, while the OMWW production varies from 7 to over 30 million m3 globally annually [23,24,25]. In this scenario, it becomes important to mitigate the impacts of olive oil production and find new ways of treating its potentially harmful by-products for the ecosystem which are aimed at obtaining new materials with added value, thus avoiding problems relating to the disposal of this waste. Therefore, by focusing on the reuse of waste, the olive oil production chain develops a potential yet to be explored in terms of bioeconomy and circular economy activities. Depending on the particular climate, cultivation techniques, and the variety of olives from which OPs derive, they can contain different concentrations of many molecules of important biological value such as proteins, fats, phenolic compounds, lignin, cellulose, hemicellulose, pectic polymers, and minerals [20,22,26,27,28,29]. As far as OMWWs are concerned they are dark liquid effluents characterized by strong odor and a high concentration of organic compounds, such as organic acids, tannins, pectins, sugars, and phenolic substances. The latter, in particular, are responsible for OMWW toxicity in the soil if released in the environment, as they inhibit bacterial activity and growth [30,31,32]. From this perspective, by virtue of the considerable content of bioactive compounds that can be recovered and valorized, waste from the olive oil industry can be used as a raw material for the production of organic products with high added value by applying or developing appropriate technologies [18]. The great potential of these waste materials lies in the opportunity to extract valuable bioactive molecules, such as polyphenols, or transform them into high-added-value products, such as PHs, thus promoting the transition towards a circular and eco-compatible economy. In order to fully valorize the waste biomass, this work focused on the study of the anaerobic digestion of the waste obtained from both processes, i.e., the OP waste obtained following the production of a PH, and the OMWW waste recovered after the extraction of bioactive molecules. These wastes can in fact be treated for anaerobic digestion aimed at producing biogas, from which electricity can be produced, and biomethane which can be obtained through adequate purification processes and can be injected into the natural gas network or used for the gas sector transport [33,34]. In the quest for sustainable energy sources and waste management solutions, biogas emerges indeed as a promising player on the global stage. Additionally, anaerobic digestion is a useful method for treating biomass wastes and producing biogas at the same time [35]. With a burgeoning population and the escalating challenges posed by climate change, there is then an urgent need to explore eco-friendly alternatives that simultaneously address energy demands and mitigate environmental impacts [36,37]. Hence, due to its cost-effectiveness and environmental friendliness, anaerobic digestion technology garnered a lot of attention thanks to the possibility to easily convert organic waste into biogas, which is mostly composed of CH4 and CO2, and digestate, which could be used for making the compound fertilizer [38]. The anaerobic digestion of waste from olive processing, i.e., OP and OMWW, has been extensively tested in the literature [39,40], however to the best of our knowledge the waste from the hydrolysis process of OP and the extraction of bioactive molecules from OMWW has never been tested for anaerobic digestion aimed at biogas production. Furthermore, the aspect of the energy balance of the anaerobic digestion of these wastes is addressed here for the first time. This study embarks indeed on a holistic assessment of the energy aspects and yields associated with biogas production from diverse waste streams, aiming to shed light on the potential of waste-to-energy technologies. In particular, as stated above, the waste of three-phase OP deriving from an alkaline hydrolysis, for the production of high-added value PHs, and OMWW waste from which biomolecules, such as polyphenols, have previously been extracted, were tested for anaerobic digestion. The controls were represented by an inoculum consisting of digestate, a mixture of inoculum and swine slurry, a mixture of inoculum and untreated three-phase OP, and a mixture of inoculum and untreated OMWW.
The aim of this work was then to test the anaerobic digestion aimed at biogas production of both the three-phase OP wastes obtained from the production of PHs and the OMWW wastes derived from the extraction of biomolecules. In fact, from both OP and OMWW treatment, a small part of waste is generated that has been tested for the production of biogas, which normally contains a large quantity of biomethane (Figure 1).
This work also aimed at evaluating the biomethanation potential of the two different olive oil industry wastes obtained following the recovery of molecules with different extraction processes placing attention on the analysis of the energy balance related to biogas production in terms of energy consumed/produced by the entire process, focusing on the time interval where the energy produced was greater than that spent. Batch anaerobic digestion reactors have been set up in order to shed light on which olive oil waste positively influences the efficiency of the biogas yield. This study synthesizes these empirical observations to contribute not only to the advancement of waste-to-energy technologies but also to the broader discourse on sustainable energy solutions in an era of growing environmental concerns. Taking into account the potential applications and the sustainability of the starting matrices, the biogas industry results then in an attractive answer to valorize the aforementioned agroindustrial wastes that can satisfy the growing demand for an ecological transition and circularity.

2. Materials and Methods

2.1. Materials

The inoculum used in this study was represented by a digestate that was produced in our laboratory. The characterization of the inoculum is reported in Table 1.
The swine slurry was supplied by a local breeder in the Umbria region, Italy. The three-phase OP and OMWW were supplied by a local olive mill in the Umbria region, Italy. For the production of PHs, three-phase OP was digested under alkaline conditions. After the hydrolysis process, PHs were isolated from each sample and the waste produced following the treatment was recovered to be used for anaerobic digestion. As far as the recovery of bioactive molecules, i.e., phenolic compounds, from OMWW is concerned, the waste produced after the extraction process was collected to be subsequently tested for biogas production.

2.2. Determination of Moisture Content

The moisture content was evaluated according to the official method with few modifications [41]. For the moisture evaluation, 2 g of each sample were evenly distributed on a dish and dried in an oven at 105 °C. Samples were then cooled down at room temperature in a desiccator containing silica gel and weighed. The process was repeated until a constant and stable weight was reached. The content of water was determined as the difference between the initial and final weight. Each sample was analyzed in triplicate.

2.3. Determination of Volatile Solids

Volatile solids (VS) were measured according to the standard method with few modifications [42]. For the VS evaluation, 2 g of each sample previously dried were evenly distributed on a ceramic crucible. The samples were then introduced in a muffle furnace where the temperature was gradually and slowly increased to reach 550 °C. After this, the samples were left to incinerate at 550 °C. Subsequently, the ceramic crucibles containing the samples were transferred to the desiccator containing silica gel for cooling and weighed once the temperature balance was reached. The content of VS, which represents also an estimation of the sample organic matter content [43], was determined as the difference between the initial and final weight. Each sample was analyzed in triplicate.

2.4. Anaerobic Bioreactors

The production of biogas analysis was carried out in 50 mL batch bioreactors kept in mesophilic conditions in a climatic chamber at a temperature of 37 °C for 30 days. The production of biogas was evaluated through the volumetric method. In particular, four controls and two treated samples were set up in the batch anaerobic digestion reactors as follows: Sample 1 consisting of sole digestate produced in our laboratory that represents the inoculum, Sample 2 consisting of ¾ of inoculum and ¼ of swine sludge, Sample 3 consisting of ¾ of inoculum and ¼ of untreated three-phase OP, Sample 4 consisting of ¾ of inoculum and ¼ of untreated OMWW, Sample 5 consisting of ¾ of inoculum and ¼ of waste of three-phase OP-PH, and Sample 6 consisting of ¾ of inoculum and ¼ of OMWW waste recovered after the extraction of biomolecules. In the reactors, 37.5 g of each mixture was inserted by considering the proportions mentioned above. Each sample was analyzed in triplicate.

2.5. Statistical Analysis

The data regarding the analysis concerning the analyzes performed in this study are reported as mean values of three samples. A one-way ANOVA test was used to investigate the significance of the differences in the sample mean values. The level of significance for the data was set at p < 0.05.

3. Results and Discussion

The residues of both the hydrolysis process of three-phase OP and the extraction of polyphenols from OMWW, whose tested quantities were reported in Section 2.4, were assessed for anaerobic digestion for the production of biogas aimed at valorizing the waste derived from the production of olive oil. These residues were evaluated in laboratory-scale reactors maintained at 37 °C and followed for one month. The results showed how anaerobic bioreactors containing the waste of three-phase OP-PH show a greater production of biogas, followed by reactors added with the OMWW waste. Specifically, the daily production of biogas showed an increasing trend from the first day while reaching its peak on the sixth day (23.8 mL of biogas produced). The production then decreased and reached its inactivity on the eighteenth day. As far as the OMWW waste is concerned, the peak of activity is detected on day one (19.3 mL of biogas produced). The reason behind this behavior could be attributed to the highest availability of nutrients already suitable for biodigestion process in the first steps of the test. Its production then gradually decreased over time ending its production on the fourteenth day. The results highlighted differences in trend between the various controls. In particular, the control consisting of untreated three-phase OP showed variable production of biogas during the production period. Peaks of production were observed on the sixth and eighth days (10.8 mL of biogas produced). Then the production gradually decreased, until completely stopping from the thirteenth day. The swine sludge control showed even lower biogas production, with its peak on day ten (6.3 mL of biogas produced) and then a decrease reaching zero activity on day 22. As regards the control consisting only of sole inoculum, this shows its peak on the fourth day (10.5 mL of biogas produced), increases until the twelfth day and then decreases and ends biogas production on the twenty-fifth day. The control consisting of untreated OMWW, however, did not show any biogas production.
In the same way, the cumulative production of the biogas (Figure 2) produced in the reactors inoculated with residues of OP-PHs was evaluated, and the results showed how the biogas was produced in greater quantities in this sample over the time of the examination (Table 2 and Figure 2). A 153.9 mL total volume of biogas was found in the three-phase OP-PH waste sample, followed by 84.1 mL in OMWW waste, 80.0 mL in untreated three-phase OP, 62.5 in swine slurry sample, and 56.5 mL in the sole inoculum. The control consisting of untreated OMWW is not shown in the graph as there was no production of biogas by the reactors, this could be justified by the phenolic component present in the OMWW which is responsible for inhibiting growth and bacterial activity [30,31,32].
These results therefore highlight how the reactors treated with three-phase OP-PH waste showed a greater production of biogas, followed by the OMWW waste, highlighting how the use of these wastes can have industrial potential with a view to valorizing the waste of a process aimed at valorizing waste from the olive oil supply chain.
The six samples, described in Section 2.4, were then analyzed comparing the biogas production with the energy produced and the energy spent for each of them.
Table 2 shows the cumulative quantity of biogas produced for all the samples that showed biogas production, expressed in mL, while the diagrams (Figure 2) describe the cumulative curves defined with data reported in Table 1.
The diagrams (Figure 2) highlight relevant differences between the production of biogas achieved with the different samples. The addition of three-phase OP improved the production of biogas, if compared with the quantities achieved with Sample 1 and Sample 2. The corresponding quantities are not numerically reported here, since the global production of biogas will be discussed in detail in the next paragraphs.
Depending on the specific composition of the samples, the cumulative curve assumed different trends: even if with different daily increments and final quantities reached, Sample 1, related to the sole inoculation, and Sample 4, where one-fourth of OP-PH waste was added to the inoculation, showed a continuous trend that subsequently decreased when biogas production ends. Conversely, Sample 2, containing one-fourth of swine slurry, revealed a partially discontinuous trend. The more constant production of biogas, in particular that of the three-phase OP-PH waste, could be justified by greater availability of simple sugars, amino acids, and fatty acids formed following the hydrolysis process and which could have remained in the waste used in reactors [43]. These compounds having a small carbon chain can in fact be easily converted by acidogenic bacteria into a mixture rich in volatile fatty acids, which represents the substrate for the acetogenic bacteria that convert them into acetic acid, CO2, and H2 [44]. The latter are the substrates from which methanogenic bacteria can carry out methanogenesis and produce biogas [45].
However, the complete extraction of biogas from digestate might be unfeasible from an economic point of view. The biogas production process has some energy requirements to satisfy, mainly related to the maintenance of temperature within the optimal temperature range and to the management of the whole plant. It means that the production of biogas is feasible only until the energy production (evaluated for the unit of time) is higher than the energy consumption. Therefore, the samples analyzed in this study cannot be evaluated and compared among each other exclusively considering the overall quantity of biogas produced; such quantity must be evaluated only within the time period where the production goes over the consumption of energy and is then compared.
Table 3 shows the daily biogas production, expressed in kg, for each sample, the corresponding quantity of biomethane, and the related total quantity of energy produced.
Starting from biogas, the quantity of biomethane achieved was directly measured and the following results expressed as percentage of biogas produced were reached:
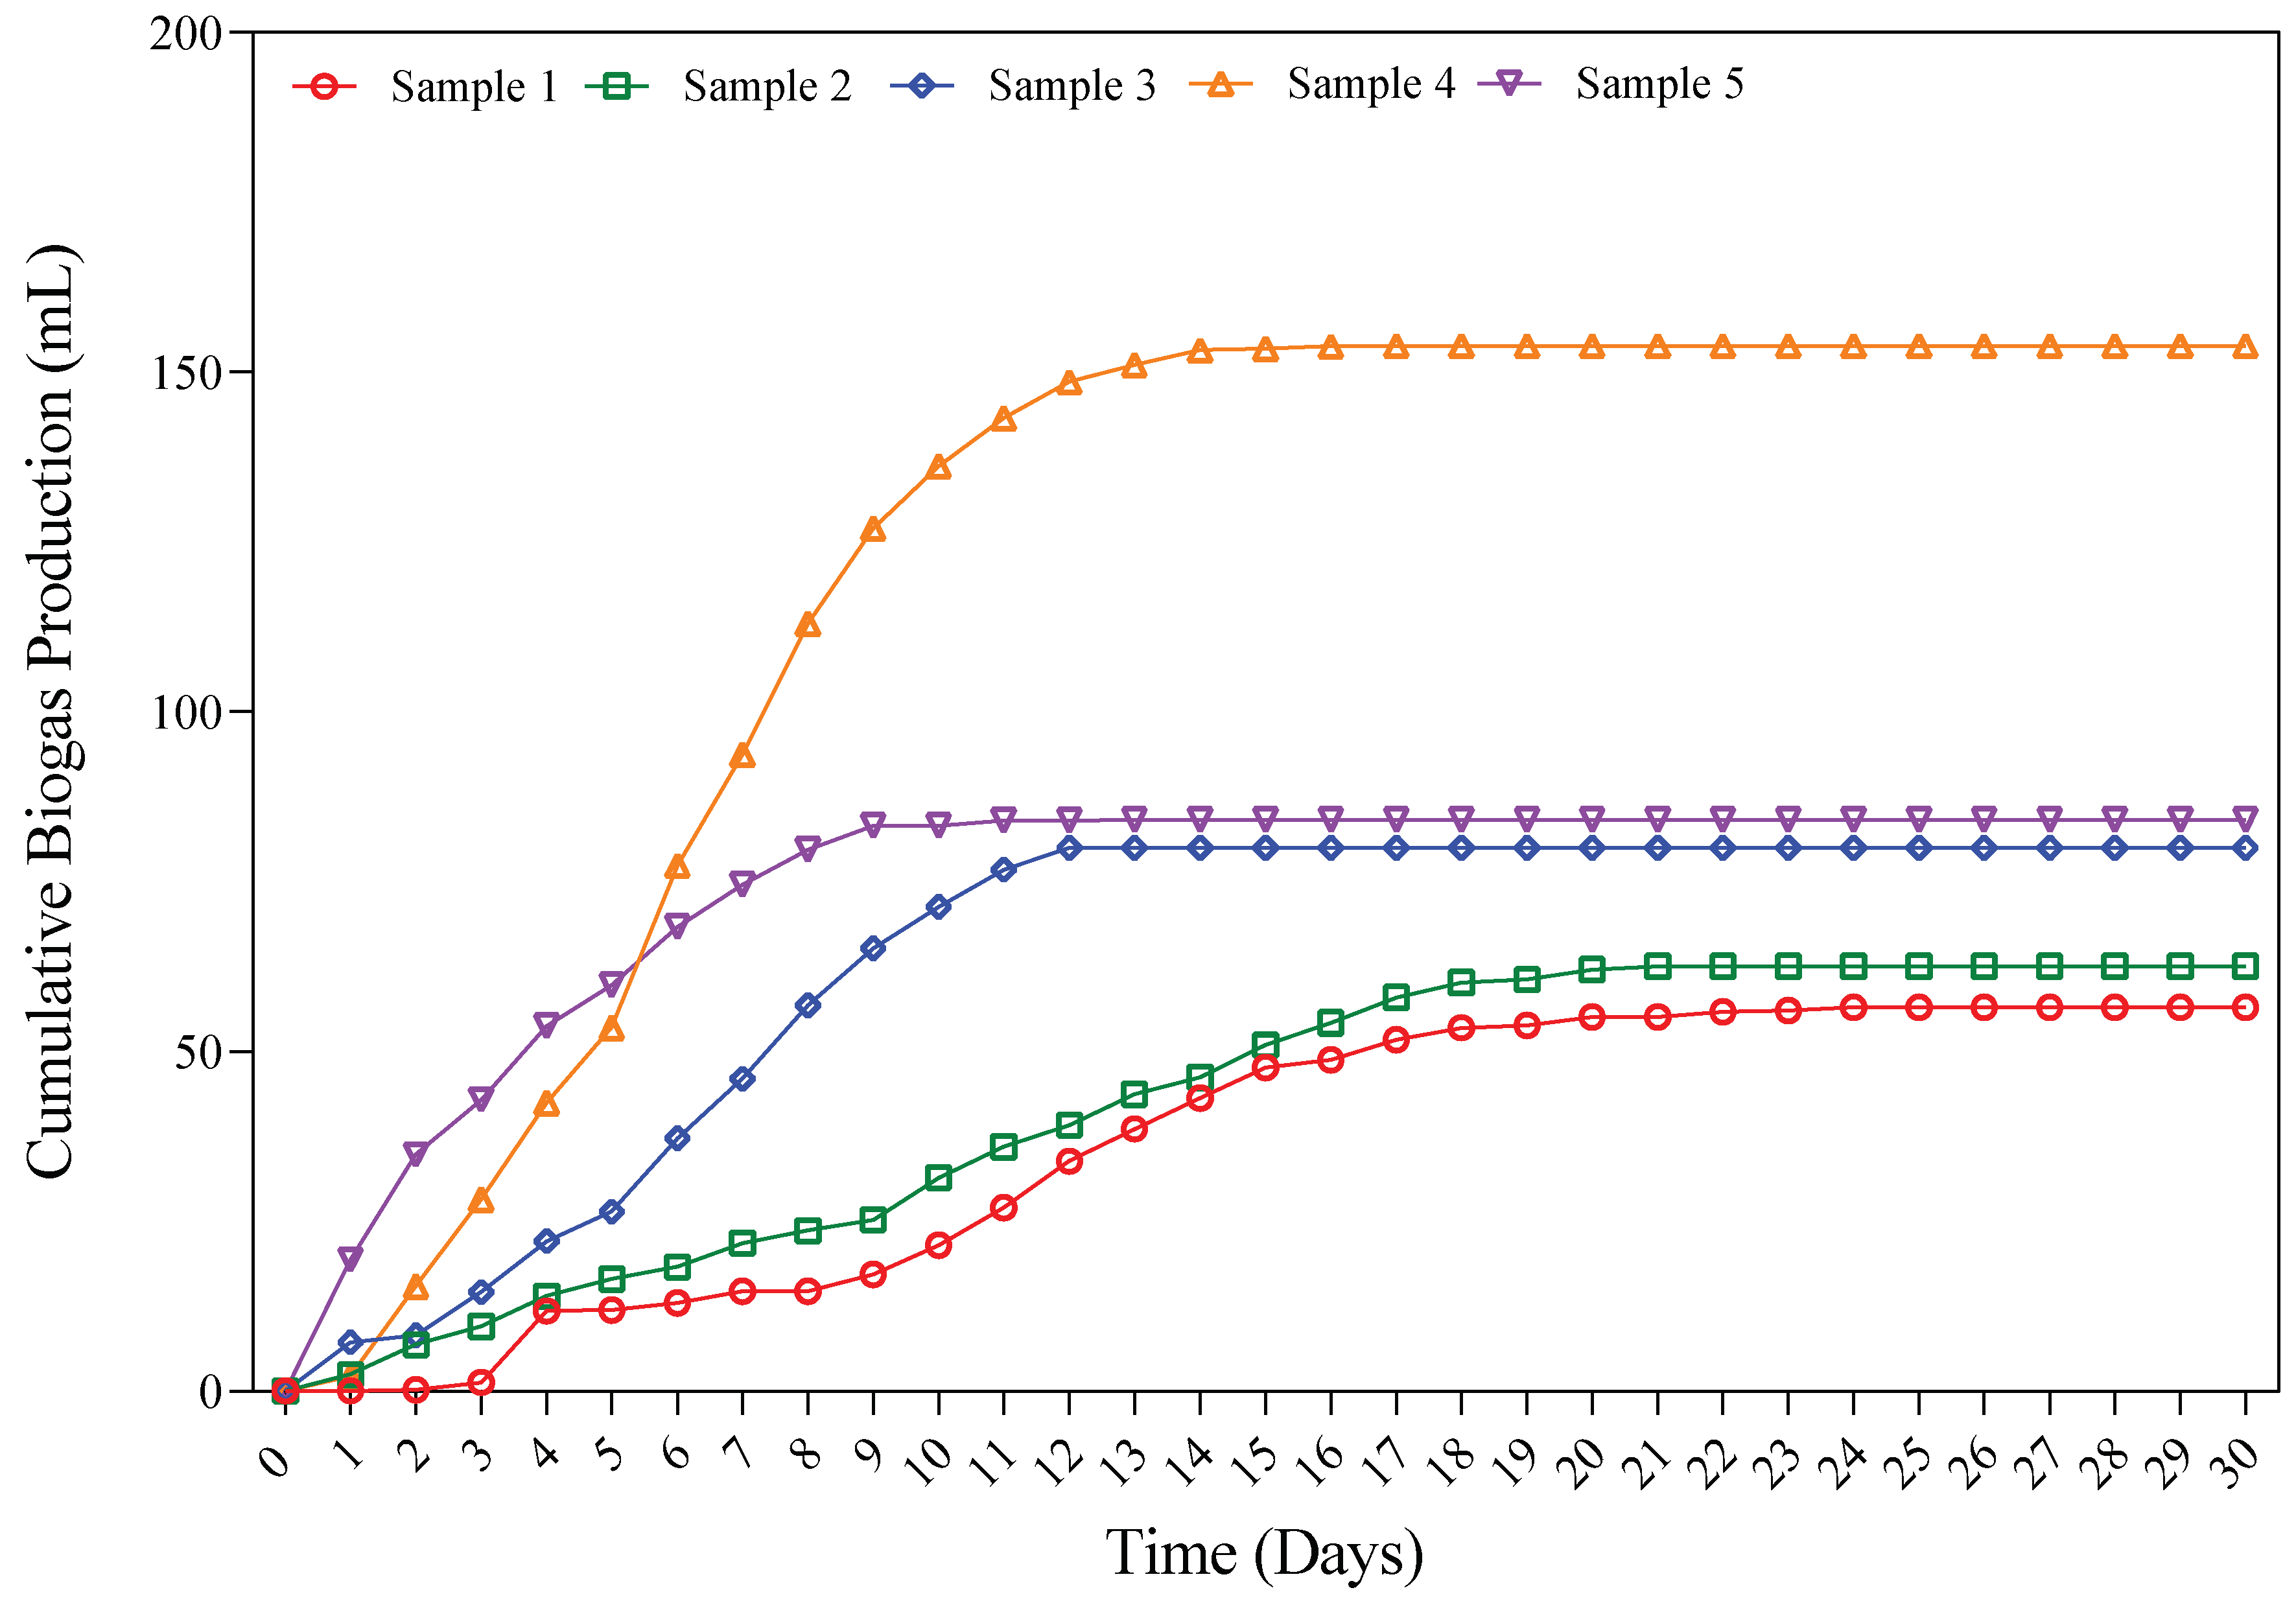
  • Sample 1 (sole inoculation): 47.52%;
  • Sample 2 (inoculation + ¼ swine slurry): 53.23%;
  • Sample 3 (inoculation + ¼ untreated three-phase OP): 66.30%;
  • Sample 4 (inoculation + ¼ three-phase OP-PH waste): 58.44%;
  • Sample 5 (inoculation + ¼ OMWW waste): 56.99%.
In Table 3, the energy produced was calculated by considering the LHV (Lower Heating Value) of methane equal to 52 MJ/kg. The transformation of biogas into biomethane was considered costless, due to the limited quantities produced. In this regard, the most widespread technique consists of the membrane separation technology, since the recovery of methane is higher than 99.5%, with relatively moderate operating costs [46]. The energy cost for biogas treatment is estimated in the range of 0.18–0.35 kWh/Nm3 [47]; such an estimation inevitably leads to a negligible consumption of energy for this study. It should be considered that the investment cost of membrane modules may vary from 7600 to 3700 €/(m3 h) for inlet capacities of 100–500 m3/h. Differently, for capacities higher than 1000 m3, the investment cost remains constant and approximately equal to €200,000 per year [48]. Considering the quantity and composition of samples, the table immediately suggests that a 30-day production time period is excessive and can be easily shortened, while maintaining the overall production of biogas unvaried. Therefore, the next calculations involving the energy spent were carried out by considering a shorter time period, different for each sample and extended until the last day where biogas production different from zero was measured. If combining the data of Table 2 and Table 3, it clearly appears that the length of the production time is not strictly proportional to the overall amount of biogas and biomethane produced. The first sample led to the less abundant quantity produced (56.5 mL), even if the production time was the longest (24 days).
While the energy produced was directly obtained from the experimental results, the energy spent was deduced from the literature.
The input energy consists of the sum of several different contributions; the most significant can be referred to as follows:
(1)
Energy crop cultivation and feedstock pre-treatment;
(2)
Feedstock collection and transportation;
(3)
Biogas plant operation processes;
(4)
Biogas treatment and storage;
(5)
Digestate processing and handling.
The overall energy spent to carry out all these phases can be quantified as a highly variable percentage of the energy contained in the produced biogas. To compare these two latter quantities, the Primary Energy Input Output ratio (PEIO) [49] was introduced. Based on the typology and composition of the feedstock used, the PEIO index was estimated to range from 10.5% to 64.0%.
Considering the experimental procedure followed for the experiments and, mostly, the scale of the experimental apparatus, contributions such as feedstock collection and transportation, plant operation processes, and digestate processing and handling, cannot be calculated with accuracy. For that reason, the energy spent was calculated as a percentage of the energy produced. The percentage value was defined as an average of the values found in the literature and those available elsewhere [50,51,52].
In this study, the following value was used: PEIO = 33%.
Table 4 shows the energy consumed (quantity estimated according to what previously asserted) for each sample, to reach the final quantity of biogas produced. Such amount was then split out between the single day of production. The daily quantity is indicated in the last column of Table 4.
Being the consumed energy expressed as percentage of the produced one, the quantities corresponding to the different samples are ordered exactly as the corresponding quantities of energy produced. It is important to note that, based on the days of production shown in Table 4, the presence of OP and OMWW waste lowered the production period and also improved the overall production of energy, if compared with what obtained with the sole inoculation or with the inoculation mixed with swine slurry.
The following diagrams (Figure 3, Figure 4, Figure 5, Figure 6 and Figure 7) compare, for each tested sample, the daily energy production with the daily energy consumption and allow one to identify the optimal production time period, which denotes the interval where the daily production is higher than the daily consumption.
The diagrams (Figure 3, Figure 4, Figure 5, Figure 6 and Figure 7) further confirm (see Table 3) that biogas production is time-limited and, in any case, the process did not cover the 30-day period fixed for all the experiments. The production trend is widely different, as a function of the sample taken into consideration for biogas production. The biogas production from Sample 1 showed an initial increasing trend, until reaching the maximum daily production after twelve days; then, the production gradually decreased and finished after 24 days. It should be noted that the maximum previously mentioned is referred to the production trend, while the overall maximum value was measured after four days of production, but consists of an isolated peak of production. With Sample 2, daily production values quantitatively similar to those observed for Sample 1 were reached; however, no specific trend was denoted and these values resulted casually distributed throughout the whole production period, whose time duration was equal to 21 days.
The addition of untreated OP (Sample 3) led to completely different results: the daily production was massively higher than the other samples and the time production was significantly more limited. In detail, the maximum daily production was equal to 1.63 × 10⁻¹ kJ for Sample 1, 1.09 × 10⁻¹ kJ for Sample 2, while the same parameter reached 2.34 × 10⁻¹ kJ in presence of OP, or in Sample 3 (Figure 3, Figure 4 and Figure 5). The process reached its completion after twelve days.
In Sample 4, the maximum daily production was equal to 4.55 × 10⁻¹ kJ and occurred after six days of production (Figure 6). Similarly, the total production period fell within the values observed for the other samples and was about 17 days. The production trend was similar to what observed for Sample 1: it increased until reaching the maximum values, then it gradually decreased.
However, during the production period, the daily production of biogas was not always higher than the daily consumption of energy needed to carry the process forward. For instance, with Sample 1, the production exceeded the consumption until day 18, then the trend was reversed. Sample 2 showed higher consumption on day 19 and higher production on the next day 20; then the consumption always remained above the production. A similar behavior was also observed for Sample 5, while Sample 4 described the same trend of the first Sample 1, just showing differences regarding the end of biogas production periods. Conversely, when the production effectively occurred, in Sample 3 the quantity produced was always higher than the quantity consumed, except for day 2. The comparison between daily energy production and consumption is mandatory to correctly define the optimal biogas production period. Extracting the maximum possible quantity of biogas might be not the best solution in terms of energy produced/energy spent ratio, as confirmed in all the tests carried out in this study. According to the present experimental results, the preferred option would consist of extracting biogas until the previously mentioned ratio remains higher than one, and consequently leaving part of the whole quantity theoretically extractable, within the exhaust digestate.
Table 5 shows, for each sample, the total energy produced, the estimated time period having daily production higher than the energy consumption (or the optimal biogas production period), the portion of energy produced in this latter time range and, in the last column, the percentage of energy lost, corresponding to the portion of biogas not extracted from the digestate.
Table 5 confirms the positive contribution of OP, both in terms of biogas extracted and time period duration. In particular, the OP-PH waste led to the best performance for biogas production: 2.94 kJ were produced, against 1.73 kJ, obtained with the presence of untreated OP, and 1.60 kJ, achieved with OMWW waste. Finally, 0.88 and 1.09 kJ were achieved with the other samples. In the case of tests made with OP or residual OP, the one carried out with OMWW showed the lowest overall production of energy. However, it presented, at the same time, the shortest production period, which is symptomatic of a more contained consumption of energy.
The coupling of these two benefits, the higher production and the lower production period, led to a significantly better efficiency for biogas production from digestate containing OP.
The efficiency value (η) was initially defined by considering the whole energy produced and the energy consumed during the whole production period. This latter parameter was considered different from the 30-day test initially fixed; it was assumed equal to the number of days during which the production of biogas was different from zero. In particular, from Sample 1 to Sample 5, it was equal to 24, 21, 12, 17 and 13 days, respectively. According to it and based to the efficiency values reported in the literature [49,50,51,52], the process efficiency was considered equal to 67%.
Here, the efficiency (ηOPT) was calculated by considering only the energy produced during the optimal production period, shown in Table 5, and the energy consumed during the same period. The results are shown in Table 6.
The re-evaluation of the process efficiency, limited to the optimal production period, clearly led to better results, especially in the presence of OP, where the efficiency was found to be equal to 81.7%, with untreated OP, and 76.7%, with the treated one. It must be remembered that the energy consumed was considered as percentage of the total energy produced and it is, therefore, different between the different samples. As a consequence of it, the biogas production process of each sample must be evaluated by taking into consideration the quantity of energy produced and also the portion of energy lost if the production is limited to the optimal time period defined in Table 5. In this regard, Sample 4 (containing the OP-PH waste) showed higher performances than Sample 3 (containing untreated OP).
The higher biogas production from the sample containing treated three-phase OP waste could be again justified by the greater availability of simple and readily-available sugars, amino acids, and fatty acids in this raw material that are formed following the hydrolysis process, and that can ultimately lead to a more efficient methanogenic process over time [45]. On the contrary, untreated OP, being made up of olive peel and pulp, mainly contains polysaccharides, proteins, and lipids, making the hydrolysis step necessary before the acetogenic and methanogenic process [45,53,54]. The analysis of these raw materials used for these experiments will be the subject of subsequent studies where these concepts will be explored in depth.
Finally, the energy producible per unit of total (TS) and volatile solids (VS) of the single samples was calculated and is shown in Table 7. The results obtained with the sole inoculation and with the addition of swine slurry and OP were compared among each other. Due to the convenience of producing biogas from digestate containing OP-PH waste, only Sample 4 has been taken into account for this last evaluation.
The highest quantity of energy per unit of mass, both considering the TS and the VS, was calculated for the inoculum containing OP-PH waste, corresponding to Sample 4.
Based on the whole results obtained with this study, it clearly comes to light the convenience of upgrading digestate mixtures with OP-PH waste, in order to both increase the total quantity of biogas extractable and also keep the production time contained, with consequent lower operative costs. The preferability of OP-PH waste, instead of the untreated one, can be explained by the higher overall production of energy and the lower percentage of unextracted energy. Moreover, as previously explained, OP-PH waste means that the present raw material has been previously processed to obtain PHs, high-added-value products that can have different applications in many commercial sectors [1]. Therefore, the added values, associated with the production of these further compounds, such as biogas and biomethane, have to be considered and perfectly agree with the concept of biorefinery. This study deepened the possibility of achieving still high-efficiency biogas production from biomasses previously used for active molecules. Moreover, the digestates obtained from anaerobic digestion processes could be valorized through a composting process to produce compound fertilizer. Therefore, the production of fertilizers from digestates, collected during the present experimental campaign, will be treated in future studies.
The scientific literature on this specific topic is full of research focused on the production of biogas from agricultural waste biomass, however, there is a lack of studies on the optimal production period from an energy point of view that can elucidate the timing to be used in a plant before it is supplied with biomass to be digested. This study therefore aimed to shed light on the period in which there is an energy advantage of the entire process by comparing energy spent/produced in the optimal biogas production period. Furthermore, to the best of our knowledge, the newly synthesized wastes that are the focus of this study, i.e., OP-PH and OMWW waste, have never been tested in other works, under this point of view. Finally, the methodology proposed in this study needs to be validated in large-scale apparatuses in order to make the results more solid from an industrial point of view.

4. Conclusions

This research investigated the production of biogas from the waste biomass deriving from both three-phase OP-PH extraction process and recovery of the OMWW polyphenolic component. The results achieved with these waste biomasses were then compared with those obtained with different biomasses, for a total of five samples tested. The concentration of biomethane in the biogas mixture was detected and, considering the whole quantity of biogas produced from the samples, the quantity of energy producible for unit of mass was calculated. This latter quantity was then compared with the energy consumption associated with the production of biogas and derived from the literature. Based on the energy spent/energy produced ratio, the optimal production period was defined for each sample and the process efficiency was re-defined within this time range.
The batch anaerobic bioreactors consisting of inoculum added with the waste of three-phase OP-PH showed a greater production of biogas compared to the controls consisting of sole inoculum, inoculum with the addition of swine slurry, a mixture of inoculum and untreated three-phase OP, inoculum and untreated OMWW, and inoculum and OMWW waste recovered after the extraction of bioactive molecules. The largest production of biogas for the bioreactors inoculated with the three-phase OP-PH waste occurred in the first 12 days, reaching an optimal production yield of 76.7%. The quantity of energy potentially producible using this raw material accounts for 946.5 kJ/kg of TS or 1727.8 kJ/kg of VS. These results more than doubled those obtained by the other samples, demonstrating how the energy values potentially obtainable from the waste of three-phase OP-PH are remarkable and should be taken into consideration in order to optimize processes aimed at valorizing olive oil waste supply chain. The biogas obtained can be then used for electricity production, while through a purification process it is possible to obtain biomethane, which can instead be used by introducing it into the distribution network or for the transport sector.
These outcomes pave the way for possible applications of the waste from the olive supply chain in a multi-purpose biorefinery concept, aimed at valorizing the olive by-products from different points of view. In this way, the waste from a process of valorization of waste from the production of olive oil, i.e., the waste derived from the production of PHs starting from three-phase OP and the waste recovered after the extraction of bioactive molecules from OMWW, can also be reused to obtain an energy value in a circular economy perspective thus promoting the use of more sustainable raw materials for biogas production.

Author Contributions

Conceptualization, N.M. and A.M.G.; methodology, C.Z., G.G. and E.C.; software, A.M.G. and N.M.; validation, C.E., E.C. and A.B.; formal analysis, N.M.; investigation, A.M.G. and C.Z.; resources, G.G.; data curation, D.P. and A.M.G.; writing—original draft preparation, N.M., A.M.G., D.P. and E.C.; writing—review and editing, A.B.; supervision, G.G. and C.E.; project administration, G.G.; funding acquisition, G.G. All authors have read and agreed to the published version of the manuscript.

Funding

This work was funded by the European Union—NextGenerationEU as part of the National Innovation Ecosystem grant ECS00000041—VITALITY (to Prof. Giovanni Gigliotti and Prof. Carla Emiliani) promoted by the Ministero dell’Università e della Ricerca (MUR). We thank the University of Perugia and the MUR for their support within the VITALITY project. This work was supported by the PRIMA, Italy, Project 4BIOLIVE: Production of biostimulants, biofertilizers, biopolymers and bioenergy from OLIVE-oil chain residues and by-products. The PRIMA program is supported by the European Union.

Data Availability Statement

Data are contained within the article.

Conflicts of Interest

The authors declare no conflicts of interest.

References

  1. Cesaretti, A.; Montegiove, N.; Calzoni, E.; Leonardi, L.; Emiliani, C. Protein Hydrolysates: From Agricultural Waste Biomasses to High Added-Value Products (minireview). AgroLife Sci. J. 2020, 9, 79–87. [Google Scholar]
  2. European Commission. Communication from the Commission to the European Parliament, the Council, the European Economic and Social Committee and the Committee of the Regions Closing the Loop—An EU Action Plan for the Circular Economy; European Commission: Brussels, Belgium, 2015. [Google Scholar]
  3. FAO. The State of Food and Agriculture: Moving Forward on Food Loss and Waste Reduction, the State of Food and Agriculture (SOFA); FAO: Rome, Italy, 2019. [Google Scholar] [CrossRef]
  4. Stahel, W.R. The circular economy. Nature 2016, 531, 435–438. [Google Scholar] [CrossRef]
  5. Tuck, C.O.; Pérez, E.; Horváth, I.T.; Sheldon, R.A.; Poliakoff, M. Valorization of Biomass: Deriving More Value from Waste. Science 2012, 337, 695–699. [Google Scholar] [CrossRef]
  6. Calzoni, E.; Cesaretti, A.; Tacchi, S.; Caponi, S.; Pellegrino, R.M.; Luzi, F.; Cottone, F.; Fioretto, D.; Emiliani, C.; Di Michele, A. Covalent Immobilization of Proteases on Polylactic Acid for Proteins Hydrolysis and Waste Biomass Protein Content Valorization. Catalysts 2021, 11, 167. [Google Scholar] [CrossRef]
  7. Del Buono, D. Can biostimulants be used to mitigate the effect of anthropogenic climate change on agriculture? It is time to respond. Sci. Total Environ. 2021, 751, 141763. [Google Scholar] [CrossRef]
  8. Martínez-Alvarez, O.; Chamorro, S.; Brenes, A. Protein hydrolysates from animal processing by-products as a source of bioactive molecules with interest in animal feeding: A review. Food Res. Int. 2015, 73, 204–212. [Google Scholar] [CrossRef]
  9. Puglia, D.; Pezzolla, D.; Gigliotti, G.; Torre, L.; Bartucca, M.L.; Del Buono, D. The Opportunity of Valorizing Agricultural Waste, Through Its Conversion into Biostimulants, Biofertilizers, and Biopolymers. Sustainability 2021, 13, 2710. [Google Scholar] [CrossRef]
  10. Calzoni, E.; Cesaretti, A.; Montegiove, N.; Pellegrino, R.M.; Leonardi, L.; Emiliani, C. Protein and Amino Acid Profile Analysis of Agri-Food Waste Biomasses. Sci. Bull. Ser. F Biotechnol. 2021, 25, 19–25. [Google Scholar]
  11. Etemadian, Y.; Ghaemi, V.; Shaviklo, A.R.; Pourashouri, P.; Sadeghi Mahoonak, A.R.; Rafipour, F. Development of animal/ plant-based protein hydrolysate and its application in food, feed and nutraceutical industries: State of the art. J. Clean. Prod. 2021, 278, 123219. [Google Scholar] [CrossRef]
  12. Kiewiet, M.B.G.; Faas, M.M.; De Vos, P. Immunomodulatory Protein Hydrolysates and Their Application. Nutrients 2018, 10, 904. [Google Scholar] [CrossRef] [PubMed]
  13. Norzagaray-Valenzuela, C.D.; Valdez-Ortiz, A.; Shelton, L.M.; Jiménez-Edeza, M.; Rivera-López, J.; Valdez-Flores, M.A.; Germán-Báez, L.J. Residual biomasses and protein hydrolysates of three green microalgae species exhibit antioxidant and anti-aging activity. J. Appl. Phycol. 2017, 29, 189–198. [Google Scholar] [CrossRef]
  14. Forster-Carneiro, T.; Berni, M.D.; Dorileo, I.L.; Rostagno, M.A. Biorefinery study of availability of agriculture residues and wastes for integrated biorefineries in Brazil. Resour. Conserv. Recycl. 2013, 77, 78–88. [Google Scholar] [CrossRef]
  15. Salisu, J.; Gao, N.; Quan, C. Techno-economic Assessment of Co-gasification of Rice Husk and Plastic Waste as an Off-grid Power Source for Small Scale Rice Milling—An Aspen Plus Model. J. Anal. Appl. Pyrolysis 2021, 158, 105157. [Google Scholar] [CrossRef]
  16. Dermeche, S.; Nadour, M.; Larroche, C.; Moulti-Mati, F.; Michaud, P. Olive mill wastes: Biochemical characterizations and valorization strategies. Process Biochem. 2013, 48, 1532–1552. [Google Scholar] [CrossRef]
  17. Espadas-Aldana, G.; Vialle, C.; Belaud, J.-P.; Vaca-Garcia, C.; Sablayrolles, C. Analysis and trends for Life Cycle Assessment of olive oil production. Sustain. Prod. Consum. 2019, 19, 216–230. [Google Scholar] [CrossRef]
  18. Behera, B.; Venkata Supraja, K.; Paramasivan, B. Integrated microalgal biorefinery for the production and application of biostimulants in circular bioeconomy. Bioresour. Technol. 2021, 339, 125588. [Google Scholar] [CrossRef]
  19. Gigliotti, G.; Proietti, P.; Said-Pullicino, D.; Nasini, L.; Pezzolla, D.; Rosati, L.; Porceddu, P.R. Co-composting of olive husks with high moisture contents: Organic matter dynamics and compost quality. Int. Biodeterior. Biodegrad. 2012, 67, 8–14. [Google Scholar] [CrossRef]
  20. Otero, P.; Garcia-Oliveira, P.; Carpena, M.; Barral-Martinez, M.; Chamorro, F.; Echave, J.; Garcia-Perez, P.; Cao, H.; Xiao, J.; Simal-Gandara, J.; et al. Applications of by-products from the olive oil processing: Revalorization strategies based on target molecules and green extraction technologies. Trends Food Sci. Technol. 2021, 116, 1084–1104. [Google Scholar] [CrossRef]
  21. Çelekli, A.; Gün, D.; Bozkurt, H. Bleaching of olive pomace oil with Spirulina platensis as an eco-friendly process. Algal Res. 2021, 54, 102210. [Google Scholar] [CrossRef]
  22. Gullón, P.; Gullón, B.; Astray, G.; Carpena, M.; Fraga-Corral, M.; Prieto, M.A.; Simal-Gandara, J. Valorization of by-products from olive oil industry and added-value applications for innovative functional foods. Food Res. Int. 2020, 137, 109683. [Google Scholar] [CrossRef] [PubMed]
  23. Sánchez, M.; Laca, A.; Laca, A.; Díaz, M. Value-Added Products from Fruit and Vegetable Wastes: A Review. CLEAN—Soil Air Water 2021, 49, 2000376. [Google Scholar] [CrossRef]
  24. Torrecilla, J.S. Chapter 40-Phenolic Compounds in Olive Oil Mill Wastewater. In Olives and Olive Oil in Health and Disease Prevention; Preedy, V.R., Watson, R.R., Eds.; Academic Press: San Diego, CA, USA, 2010; pp. 357–365. [Google Scholar] [CrossRef]
  25. Torrecilla, J.S. The Olive: Its Processing and Waste Management; Nova Science Publishers: Hauppauge, NY, USA, 2010. [Google Scholar]
  26. Galanakis, C.M.; Kotsiou, K. Chapter 10-Recovery of bioactive compounds from olive mill waste. In Olive Mill Waste; Galanakis, C.M., Ed.; Academic Press: Cambridge, MA, USA, 2017; pp. 205–229. [Google Scholar] [CrossRef]
  27. Mateos, R.; Sarria, B.; Bravo, L. Nutritional and other health properties of olive pomace oil. Crit. Rev. Food Sci. Nutr. 2020, 60, 3506–3521. [Google Scholar] [CrossRef]
  28. Rodrigues, F.; Pimentel, F.B.; Oliveira, M.B.P.P. Olive by-products: Challenge application in cosmetic industry. Ind. Crops Prod. 2015, 70, 116–124. [Google Scholar] [CrossRef]
  29. Ruiz, E.; Romero-García, J.M.; Romero, I.; Manzanares, P.; Negro, M.J.; Castro, E. Olive-derived biomass as a source of energy and chemicals. Biofuels Bioprod. Biorefin. 2017, 11, 1077–1094. [Google Scholar] [CrossRef]
  30. Di Lecce, G.; Cassano, A.; Bendini, A.; Conidi, C.; Giorno, L.; Toschi, T.G. Characterization of olive mill wastewater fractions treatment by integrated membrane process. J. Sci. Food Agric. 2014, 94, 2935–2942. [Google Scholar] [CrossRef] [PubMed]
  31. Fiorentino, A.; Gentili, A.; Isidori, M.; Monaco, P.; Nardelli, A.; Parrella, A.; Temussi, F. Environmental Effects Caused by Olive Mill Wastewaters: Toxicity Comparison of Low-Molecular-Weight Phenol Components. J. Agric. Food Chem. 2003, 51, 1005–1009. [Google Scholar] [CrossRef] [PubMed]
  32. Justino, C.I.L.; Pereira, R.; Freitas, A.C.; Rocha-Santos, T.A.P.; Panteleitchouk, T.S.L.; Duarte, A.C. Olive oil mill wastewaters before and after treatment: A critical review from the ecotoxicological point of view. Ecotoxicology 2012, 21, 615–629. [Google Scholar] [CrossRef] [PubMed]
  33. Cucina, M.; Pezzolla, D.; Tacconi, C.; Gigliotti, G. Anaerobic co-digestion of a lignocellulosic residue with different organic wastes: Relationship between biomethane yield, soluble organic matter and process stability. Biomass Bioenergy 2021, 153, 106209. [Google Scholar] [CrossRef]
  34. Di Maria, F.; Gigliotti, G.; Sordi, A.; Micale, C.; Zadra, C.; Massaccesi, L. Hybrid solid anaerobic digestion batch: Biomethane production and mass recovery from the organic fraction of solid waste. Waste. Manag. Res. 2013, 31, 869–873. [Google Scholar] [CrossRef] [PubMed]
  35. Xing, T.; Yun, S.; Li, B.; Wang, K.; Chen, J.; Jia, B.; Ke, T.; An, J. Coconut-shell-derived bio-based carbon enhanced microbial electrolysis cells for upgrading anaerobic co-digestion of cow manure and aloe peel waste. Bioresour. Technol. 2021, 338, 125520. [Google Scholar] [CrossRef] [PubMed]
  36. Ghosh, P.; Shah, G.; Sahota, S.; Singh, L.; Vijay, V.K. Chapter 7-Biogas production from waste: Technical overview, progress, and challenges. In Bioreactors; Singh, L., Yousuf, A., Mahapatra, D.M., Eds.; Elsevier: Amsterdam, The Netherlands, 2020; pp. 89–104. [Google Scholar] [CrossRef]
  37. Nwokolo, N.; Mukumba, P.; Obileke, K.; Enebe, M. Waste to Energy: A Focus on the Impact of Substrate Type in Biogas Production. Processes 2020, 8, 1224. [Google Scholar] [CrossRef]
  38. Li, B.; Yun, S.; Xing, T.; Wang, K.; Ke, T.; An, J. A strategy for understanding the enhanced anaerobic co-digestion via dual-heteroatom doped bio-based carbon and its functional groups. Chem. Eng. J. 2021, 425, 130473. [Google Scholar] [CrossRef]
  39. Fleyfel, L.M.; Leitner, N.K.V.; Deborde, M.; Matta, J.; El Najjar, N.H. Olive oil liquid wastes–characteristics and treatments: A literature review. Process Saf. Environ. Protection. 2022, 168, 1031–1048. [Google Scholar] [CrossRef]
  40. Tekin, A.R.; Dalgıç, A.C. Biogas production from olive pomace. Resour. Conserv. Recycl. 2000, 30, 301–313. [Google Scholar] [CrossRef]
  41. AOAC. Official Methods of Analysis of AOAC International, 19th ed.; AOAC International: Gaithersburg, MD, USA, 2012. [Google Scholar]
  42. Dunbabin, J.S.; Bowmer, K.H. Potential use of constructed wetlands for treatment of industrial wastewaters containing metals. Sci. Total Environ. 1992, 111, 151–168. [Google Scholar] [CrossRef]
  43. Paritosh, K.; Yadav, M.; Mathur, S.; Balan, V.; Liao, W.; Pareek, N.; Vivekanand, V. Organic fraction of municipal solid waste: Overview of treatment methodologies to enhance anaerobic biodegradability. Front. Energy Res. 2018, 6, 75. [Google Scholar] [CrossRef]
  44. Amani, T.; Nosrati, M.; Mousavi, S.M.; Kermanshahi, R.K. Study of syntrophic anaerobic digestion of volatile fatty acids using enriched cultures at mesophilic conditions. Int. J. Environ. Sci. Technol. 2011, 8, 83–96. [Google Scholar] [CrossRef]
  45. Li, Y.; Park, S.Y.; Zhu, J. Solid-state anaerobic digestion for methane production from organic waste. Renew. Sustain. Energy Rev. 2011, 15, 821–826. [Google Scholar] [CrossRef]
  46. Ullah Khan, I.; Hafiz Dzarfan Othman, M.; Hashim, H.; Matsuura, T.; Ismail, A.F.; Rezaei-DashtArzhandi, M.; Wan Azelee, I. Biogas as a renewable energy fuel—A review of biogas upgrading, utilisation and storage. Energy Convers. Manag. 2017, 150, 277–294. [Google Scholar] [CrossRef]
  47. Cao, X.; Bian, J. Supersonic separation technology for natural gas processing: A review. Chem. Eng. Process.-Process Intensif. 2019, 136, 138–151. [Google Scholar] [CrossRef]
  48. Fajrina, N.; Yusof, N.; Ismail, A.F.; Aziz, F.; Bilad, M.R.; Alkahtani, M. A crucial review on the challenges and recent gas membrane development for biogas upgrading. J. Environ. Chem. Eng. 2023, 11, 110235. [Google Scholar] [CrossRef]
  49. Pöschl, M.; Ward, S.; Owende, P. Evaluation of energy efficiency of various biogas production and utilization pathways. Appl. Energy 2010, 87, 3305–3321. [Google Scholar] [CrossRef]
  50. Berglund, M.; Börjesson, P. Assessment of energy performance in the life-cycle of biogas production. Biomass Bioenergy 2006, 30, 254–266. [Google Scholar] [CrossRef]
  51. Gkotsis, P.; Kougias, P.; Mitrakas, M.; Zouboulis, A. Biogas upgrading technologies–Recent advances in membrane-based processes. Int. J. Hydrogen Energy 2023, 48, 3965–3993. [Google Scholar] [CrossRef]
  52. Prade, T.; Svensson, S.-E.; Mattsson, J.E. Energy balances for biogas and solid biofuel production from industrial hemp. Biomass Bioenergy 2012, 40, 36–52. [Google Scholar] [CrossRef]
  53. Maicas, S.; Mateo, J.J. Chapter 41-Sustainability of food industry wastes: A microbial approach. In Valorization of Agri-Food Wastes and By-Products; Bhat, R., Ed.; Academic Press: Cambridge, MA, USA, 2021; pp. 829–854. [Google Scholar] [CrossRef]
  54. Skaltsounis, A.-L.; Argyropoulou, A.; Aligiannis, N.; Xynos, N. 11-Recovery of High Added Value Compounds from Olive Tree Products and Olive Processing Byproducts. In Olive and Olive Oil Bioactive Constituents; Boskou, D., Ed.; AOCS Press: Urbana, IL, USA, 2015; pp. 333–356. [Google Scholar] [CrossRef]
Figure 1. Biogas production through anaerobic digestion of three-phase olive pomace waste after the hydrolysis process and olive mill wastewater waste after the extraction of biomolecules. In the bottom center: the experimental system used in this study for the quantification of biogas produced.
Agronomy 14 00531 g001
Figure 2. Cumulative biogas production (mL) of the anaerobic reactors containing sole inoculum (Sample 1), inoculum and swine sludge (Sample 2), inoculum and untreated three-phase OP (Sample 3), inoculum and waste of three-phase OP-PH (Sample 4), and inoculum and waste of OMWW recovered after the extraction of biomolecules (Sample 5).
Agronomy 14 00531 g002
Figure 3. Daily energy production vs. daily energy consumption, measured for Sample 1 consisting of sole inoculum.
Agronomy 14 00531 g003
Figure 4. Daily energy production vs. daily energy consumption, measured for Sample 2 consisting of inoculum and swine sludge.
Agronomy 14 00531 g004
Figure 5. Daily energy production vs. daily energy consumption, measured for Sample 3 consisting of inoculum and untreated three-phase OP.
Agronomy 14 00531 g005
Figure 6. Daily energy production vs. daily energy consumption, measured for Sample 4 consisting of inoculum and waste of three-phase OP-PH.
Agronomy 14 00531 g006
Figure 7. Daily energy production vs. daily energy consumption, measured for Sample 5 consisting of inoculum and waste of OMWW recovered after the extraction of biomolecules.
Agronomy 14 00531 g007
Table 1. Main characteristics of the inoculum used in this study.
ParameterInoculum
Moisture (%)93.3
pH8.76
TOC (% on DM)56.2
TKN (% on DM)5.8
Total P (g/kg of DM)3.30
Total K (g/kg of DM)80.11
WEOC (g/kg of DM)117.06
WEN (g/kg of DM)71.89
TOC: total organic carbon; TKN: total Kjeldahl nitrogen; WEOC: water extractable organic C; WEN: water extractable N; DM: dry matter.
Table 2. Cumulative quantities of biogas produced (mL) by sole inoculum (Sample 1), inoculum and swine sludge (Sample 2), inoculum and untreated three-phase OP (Sample 3), inoculum and waste of three-phase OP-PH (Sample 4), and inoculum and waste of OMWW recovered after the extraction of biomolecules (Sample 5).
Day n°Sample 1Sample 2Sample 3Sample 4Sample 5
102.57.22.219.3
20.26.88.215.434.8
31.39.514.628.342.9
411.814.022.142.453.7
511.916.526.453.559.8
612.918.337.277.468.3
714.721.846.093.774.5
814.723.656.8113.079.7
917.225.265.2127.183.2
1021.531.571.3136.283.2
1127.036.076.8143.284.0
1233.939.280.0148.684.0
1338.643.780.0151.184.1
1443.146.280.0153.284.1
1547.651.080.0153.484.1
1648.854.280.0153.884.1
1751.758.080.0153.984.1
1853.560.180.0153.984.1
1953.960.680.0153.984.1
2055.162.180.0153.984.1
2155.162.580.0153.984.1
2255.862.580.0153.984.1
2356.162.580.0153.984.1
2456.562.580.0153.984.1
2556.562.580.0153.984.1
2656.562.580.0153.984.1
2756.562.580.0153.984.1
2856.562.580.0153.984.1
2956.562.580.0153.984.1
3056.562.580.0153.984.1
Table 3. Daily quantities of biogas produced, corresponding amount of biomethane, and related energy produced by sole inoculum (Sample 1), inoculum and swine sludge (Sample 2), inoculum and untreated three-phase OP (Sample 3), Part 1. Daily quantities of biogas produced, corresponding amount of biomethane, and related energy produced by inoculum and waste of three-phase OP-PH (Sample 4), and inoculum and waste of OMWW recovered after the extraction of biomolecules (Sample 5), Part 2.
Sample 1Sample 2Sample 3Sample 4Sample 5
Day
Num°
Biogas
[kg]
Biomethane
[kg]
Energy
[kJ]
Biogas
[kg]
Biomethane
[kg]
Energy
[kJ]
Biogas
[kg]
Biomethane
[kg]
Energy
[kJ]
Biogas
[kg]
Biomethane
[kg]
Energy
[kJ]
Biogas
[kg]
Biomethane
[kg]
Energy
[kJ]
10009.62 × 1051.54 × 10−68.19 × 10−74.52 × 10−63.00 × 10−61.56 × 10−11.36 × 10−67.96 × 10−74.14 × 10−21.21 × 10−57.09 × 10−63.69 × 10−1
29.43 × 10−84.48 × 10−82.33 × 10−31.72 × 10−42.75 × 10−61.46 × 10−66.28 × 10−74.17 × 10−72.17 × 10−28.32 × 10−64.86 × 10−62.53 × 10−19.74 × 10−65.69 × 10−62.96 × 10⁻¹
37.23 × 10−73.43 × 10−71.79 × 10−21.06 × 10−41.69 × 10−69.00 × 10−74.02 × 10−62.67 × 10−61.39 × 10−18.06 × 10−64.71 × 10−62.45 × 10−15.09 × 10−62.97 × 10−61.55 × 10⁻¹
46.60 × 10−63.14 × 10−61.63 × 10−11.77 × 10−42.83 × 10−61.51 × 10−64.71 × 10−63.12 × 10−61.62 × 10−18.91 × 10−65.21 × 10−62.71 × 10−16.79 × 10−63.97 × 10−62.06 × 10⁻¹
57.86 × 10−83.73 × 10−81.94 × 10−39.82 × 10−51.57 × 10−68.36 × 10−72.70 × 10−61.79 × 10−69.32 × 10−26.97 × 10−64.08 × 10−62.12 × 10−13.83 × 10−62.24 × 10−61.16 × 10⁻¹
66.28 × 10−72.99 × 10−71.55 × 10−27.07 × 10−51.13 × 10−66.02 × 10−76.79 × 10−64.50 × 10−62.34 × 10−11.50 × 10−58.75 × 10−64.55 × 10−15.34 × 10−63.12 × 10−61.62 × 10⁻¹
71.13 × 10−65.38 × 10−72.79 × 10−21.37 × 10−42.20 × 10−61.17 × 10−65.53 × 10−63.67 × 10−61.91 × 10−11.03 × 10−56.00 × 10−63.12 × 10−13.90 × 10−62.28 × 10−61.18 × 10⁻¹
80007.07 × 10−51.13 × 10−66.02 × 10−76.79 × 10−64.50 × 10−62.34 × 10−11.21 × 10−57.10 × 10−63.69 × 10−13.27 × 10−61.91 × 10−69.93 × 10⁻²
91.57 × 10−67.47 × 10−73.88 × 10−26.28 × 10−51.01 × 10−65.35 × 10−75.28 × 10−63.50 × 10−61.82 × 10−18.81 × 10−65.15 × 10−62.68 × 10−12.20 × 10−61.29 × 10−66.68 × 10⁻²
102.67 × 10−61.30 × 10−66.60 × 10−22.45 × 10−43.93 × 10−62.09 × 10−63.83 × 10−62.54 × 10−61.32 × 10−15.76 × 10−63.37 × 10−61.75 × 10−1000
113.46 × 10−61.64 × 10−68.54 × 10−21.77 × 10−42.83 × 10−61.51 × 10−63.46 × 10−62.29 × 10−61.19 × 10−14.40 × 10−62.57 × 10−61.34 × 10−15.03 × 10−72.94 × 10−71.53 × 10⁻²
124.34 × 10−62.0 × 10−61.07 × 10−11.28 × 10−42.04 × 10−61.09 × 10−60003.35 × 10−61.96 × 10−61.02 × 10−1000
132.99 × 10−61.42 × 10−67.38 × 10−21.77 × 10−42.83 × 10−61.51 × 10−60001.61 × 10−69.43 × 10−74.90 × 10−26.28 × 10−83.67 × 10−81.91 × 10⁻³
142.83 × 10−61.34 × 10−66.99 × 10−29.82 × 10−51.57 × 10−68.36 × 10−70001.33 × 10−67.77 × 10−74.04 × 10−2000
152.83 × 10−61.34 × 10−66.99 × 10−21.87 × 10−42.98 × 10−61.59 × 10−60001.26 × 10−77.34 × 10−83.82 × 10−3000
167.23 × 10−73.43 × 10−71.79 × 10−21.28 × 10−42.04 × 10−61.09 × 10−60002.51 × 10−71.47 × 10−77.64 × 10−3000
171.84 × 10−68.76 × 10−74.56 × 10−21.47 × 10−42.36 × 10−61.25 × 10−60002.62 × 10−81.53 × 10−87.96 × 10−4000
181.13 × 10−65.38 × 10−72.79 × 10−28.44 × 10−51.35 × 10−67.19 × 10−7000000000
192.14 × 10−71.02 × 10−75.28 × 10−31.77 × 10−52.83 × 10−71.51 × 10−7000000000
207.85 × 10−73.73 × 10−71.94 × 10−25.89 × 10−59.43 × 10−75.02 × 10−7000000000
210001.77 × 10−52.83 × 10−71.51 × 10−7000000000
224.40 × 10−72.09 × 10−71.09 × 10−2000000000000
231.57 × 10−77.47 × 10−83.88 × 10−3000000000000
242.51 × 10−71.19 × 10−76.21 × 10−3000000000000
25000000000000000
26000000000000000
27000000000000000
28000000000000000
29000000000000000
30000000000000000
Table 4. Total and daily energy consumed by sole inoculum (Sample 1), inoculum and swine sludge (Sample 2), inoculum and untreated three-phase OP (Sample 3), inoculum and waste of three-phase OP-PH (Sample 4), and inoculum and waste of OMWW recovered after the extraction of biomolecules (Sample 5), considering the effective days of production and PEIO = 33%.
Total Energy Consumed [kJ]Days of ProductionDaily Energy Consumed [kJ]
Sample 10.29 ± 0.005240.01 ± 0.005
Sample 20.36 ± 0.005210.02 ± 0.005
Sample 30.52 ± 0.005120.05 ± 0.005
Sample 40.97 ± 0.005170.06 ± 0.005
Sample 50.52 ± 0.005130.05 ± 0.005
Table 5. From left to right: overall quantity of energy produced; optimal production period; quantity of energy produced during the so-defined time period and portion of energy unextracted from the digestate. Sample 1: sole inoculum, Sample 2: inoculum and swine sludge, Sample 3: inoculum and untreated three-phase OP, Sample 4: inoculum and waste of three-phase OP-PH; Sample 5 inoculum and waste of OMWW.
Whole Production of Energy
[kJ]
Optimal Production Period [Day]Energy Produced in the Optimal Period [kJ]Portion of Energy Lost
[%]
Sample 10.88180.809.09
Sample 21.09181.053.67
Sample 31.73121.730
Sample 42.94122.843.40
Sample 51.6091.581.25
Table 6. Biogas production efficiency, expressed as ratio between energy consumption and energy production, evaluated during the whole (on the left) and the optimal production period (on the right).
η [%]ηOPT [%]
Sample 167.074.8
Sample 267.072.3
Sample 367.081.7
Sample 467.076.7
Sample 567.075.9
Table 7. Energy produced per unit of total solids (ETS) and volatile solids (EVS) for the sole inoculation (Sample 1) and with the addition of swine slurry (Sample 2) and waste of three-phase olive pomace protein hydrolysate (OP-PH) (Sample 4).
TS [kg]ETS [kJ/kg]VS [kg]EVS [kJ/kg]
Sample 1 (sole inoculation)2.43 × 10−3361.11.65 × 10−3530.3
Sample 2 (with swine slurry)2.22 × 10−3490.11.44 × 10−3756.0
Sample 4 (with OP-PH waste)3.10 × 10−3946.51.70 ×10−31727.8
Disclaimer/Publisher’s Note: The statements, opinions and data contained in all publications are solely those of the individual author(s) and contributor(s) and not of MDPI and/or the editor(s). MDPI and/or the editor(s) disclaim responsibility for any injury to people or property resulting from any ideas, methods, instructions or products referred to in the content.

