Article

Differences in Fatty Acid and Central Carbon Metabolite Distribution among Different Tissues of Alfalfa–Rhizobia Symbiotic System

1
Key Laboratory of Grassland Ecosystem (Gansu Agricultural University), Ministry of Education, Lanzhou 730070, China
2
Pratacultural College, Gansu Agricultural University, Lanzhou 730070, China
*
Authors to whom correspondence should be addressed.
Agronomy 2024, 14(3), 511; https://doi.org/10.3390/agronomy14030511
Submission received: 29 January 2024 / Revised: 21 February 2024 / Accepted: 24 February 2024 / Published: 1 March 2024
(This article belongs to the Section Grassland and Pasture Science)

Abstract

:
Fatty acid and central carbon metabolism are crucial energy metabolism reactions. However, to date, few studies have examined their distribution characteristics within the alfalfa–rhizobia symbiotic system. To clarify the distributional differences and accumulation rates of fatty acids and central carbon with this system, we measured the plant phenotype, nodule formation, nitrogen fixation capacity, and key nitrogen metabolism enzyme activities of Medicago sativa ‘Gannong No. 9’ 35 days post-inoculation (dpi) with Sinorhizobia meliloti LL11. Additionally, we employed targeted metabolomics to analyze central carbon and fatty acid metabolites in various tissue samples of symbiotic and control (C.K.) plants, as well as in S. meliloti LL11. We found that plant height; root length; aboveground fresh and dry weights; underground fresh and dry weights; and nitrate reductase, nitrogen reductase, glutamine synthetase, and glutamate synthase activities were significantly higher in the leaves and roots of symbiotic plants than in those of C.K. plants. Compared to symbiotic plants, C.K. plants exhibited higher total central carbon and fatty acid metabolite content, accounting for 38.61% and 48.17% of C.K. plants, respectively. We detected 32 central carbon and 40 fatty acid metabolites in S. meliloti LL11, with succinate (343,180.8603 ng·mL−1) and hexadecanoic acid (4889.7783 ng·mL−1) being the most. In both symbiotic and C.K. plants, central carbon metabolite was considerably higher than the fatty acid metabolite central. Moreover, the carbon metabolites found in symbiotic plants were primarily distributed in pink nodule roots (PNRs), with malate exhibiting the highest content (4,800,612.3450 ng·g−1), accounting for 53.09% of total central carbon metabolite content. Fatty acid metabolites were mainly found in pink root nodules (P.N.s), which are sites of nitrogen fixation. Trans-10-nonadecenoic acid and hexadecanoic acid exhibited the highest contents, comprising >15% of the total fatty acid metabolite content. We found that petroselaidic acid is only present in P.N., which seems to be closely related to the nitrogen fixation reaction in P.N. In general, symbiotic plants transfer central carbon metabolites to nodules via PNRs to drive nitrogen fixation. However, in P.N.s, these metabolites are limited, leading to accumulation in PNRs. Fatty acid metabolites, crucial for nitrogen fixation, are prevalent in P.N.s. Conversely, C.K. plants without nitrogen fixation distribute these metabolites primarily to the stems, emphasizing growth. This study provides new insights into the energy metabolism of symbiotic nitrogen fixation.

1. Introduction

Alfalfa (Medicago sativa L.) is a highly valued legume used as a forage plant [1]. Rhizobia are a class of aerobic and heterotrophic gram-negative bacteria that form nodules with legumes, where they convert inorganic nitrogen to organic ammonia, thereby providing essential nutrients to plants [2]. Symbiotic nitrogen fixation is an energy-intensive process in which host plants provide dicarboxylate (mainly malate) to maintain the nitrogen fixation capacity of rhizobia [3,4,5]. Nutrient exchange is the basis of this mutualistic relationship. Rhizobia convert atmospheric nitrogen into ammonia, which is then absorbed and used by plants via proteins such as nitrogenase and leghemoglobin, ultimately improving plant yield and quality. In return, plants convert about a quarter of their photosynthesis-derived D-glucose into dicarboxylic acid via biochemical reactions. This provides energy to support the growth and reproduction of rhizobia and ensures the steady functioning of nitrogen fixation for the benefit of the plant [6,7]. Moreover, the symbiotic signaling pathway between legumes and rhizobia has evolved from the mycorrhizal signaling pathway [8,9]. Recent studies have shown that plants not only provide hexose as a carbon source for arbuscular mycorrhizal fungi (AMF), but also transfer endogenously synthesized fatty acids (F.A.s) [10,11,12]. This has sparked interest in investigating the role that F.A.s (the second largest source of energy following D-glucose) play in this symbiotic relationship.
F.A.s are compounds of three elements: carbon, hydrogen, and oxygen. Moreover, F.A.s are often divided into saturated F.A.s (SFAs) and unsaturated F.A.s (UFAs) based on the degree of saturation of the carbon side chain. F.A.s are one of the main components of the plant cell membrane and can affect the fluidity, permeability, and signal transduction of cells [13]. However, F.A.s can also be used as raw materials for the synthesis of many important biomolecules in plants, and, therefore, play an important role in plant growth, development, and stress resistance [14]. Additionally, F.A.s can also be used as the main source of energy in plants. For example, when plants require additional energy, F.A.s are hydrolyzed and released, and energy is released by oxidation [15]. Furthermore, F.A.s act during plant stress responses, where they regulate plant antioxidant and stress resistance [16]. During plant growth and development, F.A.s are involved in cell division, elongation, and regulating hormone synthesis and signal transduction [17]. In conclusion, F.A.s play an important role in plants, and, therefore, the metabolic processes regulating F.A. synthesis and degradation affect many pathways.
F.A.s can also act as a carbon source for symbiotes. For example, Jiang [11] found that F.A.s are the main carbon source transmitted from plants to symbiotic AMF, a finding that overturned the received ‘sugar’ theory. Moreover, Dai [16] also found that Metarhizium robertsii use plant-derived F.A.s as sugars to provide carbon to symbiotes. Thus, an increasingly large body of evidence demonstrates that F.A.s can act as a major carbon source for plant–microorganism interaction systems. The central carbon metabolism (CCM) system, also known as energy metabolism, usually includes stages such as glycolysis (Embden–Meyerhof–Parnas (EMP) pathway), the tricarboxylic acid (TCA) cycle, and the pentose phosphate pathway (PPP). CCM is an important physiological metabolic process that maintains all normal life activities of the body [18]. In the alfalfa–rhizobia symbiosis system, the host plant converts a quarter of the photosynthate to dicarboxylic acid via the CCM, and this, in turn, is supplied to the rhizobia to maintain rhizobial reproduction and growth while ensuring symbiotic nitrogen fixation. However, although it is widely accepted that F.A.s and central carbon metabolites are shared by both alfalfa and rhizobia, the precise nature of their role in the alfalfa–rhizobia symbiosis system and their specific distribution in different plant tissues remain unknown.
The levels and types of metabolites found in different tissues of the same plant typically vary [19]. In one example, flavonoid metabolite content was found to be higher in leaves than in stems and roots [20]. In another study of Panax notoginseng, saponins in the roots and stems were found to be primarily composed of protopanaxatriol-type saponins, whereas those in the leaves were mainly composed of protopanaxadiol-type saponins [21]. In alfalfa–rhizobia symbioses, some roots have pink nodules, some have white nodules, and others have no nodules. Previous studies have not distinguished between these accordingly, and roots with pink and white nodules have not been well studied.
Targeted metabolomics is a highly specific, sensitive, and repeatable method of metabolomic detection. It involves using standard substances to construct all or part of the compounds involved in a target compound or pathway, enabling the quantitative and/or qualitative analysis of these target compounds [22]. Herein, we conducted a targeted metabolomic study of the symbiotic relationship between alfalfa and rhizobia and the reciprocal exchange of nutrients, but also assessed the composition and content of energy substances, such as central carbon and F.A. metabolites, in both rhizobia and plants. Accordingly, metabolic accumulation patterns remain incompletely revealed and/or utilized. Previous studies have found that M. sativa ‘Gannong No. 9’ inoculated with Sinorhizobium meliloti LL11 reached a high nitrogen fixation efficiency state by the 35th day (unpublished data).
Herein, we conducted targeted metabolomics analysis on different tissues of M. sati-va ‘Gannong No. 9’ plants, including leaves; stems; pink nodules; white nodules; roots with pink nodules; roots with white nodules; roots without nodules; and leaves, stems, and roots without the inoculation of rhizobia on the 35th day after inoculation of S. meliloti LL11 in M. sativa ‘Gannong No. 9’. This study aimed to explore the distributional differences in carbon and F.A. metabolites in different tissue centers of the entire symbiotic system, as well as to assess the potential energy role that F.A.s may play in the alfalfa–rhizobia symbiotic system. To the best of our knowledge, this is the first study designed to explore differences in central carbon and F.A. metabolites in different root and nodule tissues within the alfalfa–rhizobia symbiosis system. Our findings will, therefore, provide a solid foundation for improving the nitrogen fixation efficiency of the symbiosis system.

2. Materials and Methods

2.1. Plant Materials, Rhizobia Strains, and Treatments

The Key Laboratory for Grassland Ecosystems, Ministry of Education, Gansu Agricultural University, provided M. sativa ‘Gannong No. 9’ seeds. To sterilize the endophytic rhizobia in the seeds, the D.S. treatment [23] was used: this involved soaking seeds in an iodophor disinfectant for 5 min, followed by washing with sterile water, soaking in ST solution (i.e., a solution of 0.9% aseptic sodium chloride and 0.5% Tween-80) for 1 min, and washing again with sterile water.
Next, two layers of filter paper were placed in a 90 mm diameter culture dish and were then wetted using 2 mL of distilled water. Next, twenty sterilized seeds were evenly distributed in each dish and were placed in a constant-temperature (28 °C), humidity-controlled, light-free incubator (HHWS-II-400, Shanghai Yuejin Medical Instruments Co., Ltd., Shanghai, China) for germination treatment. Distilled water was added to the culture dish at regular intervals. After 2–3 days, germinated seeds were then placed in a hydroponic device (Chinese Utility Patent, patent number: ZL-2022-2-2289363.4) [24] and screened again. The nutrient solution used for the hydroponic apparatus was Hoagland nutrient solution, and this was changed every 3 days. After 7 days of growth, seedlings without rhizome (i.e., that possessed no endophytic rhizobacteria) were sieved and placed in seedling trays (i.e., 6 cm in diameter and 10 cm in depth) with holes in the bottom. These trays were then covered with cleaned and autoclaved (for 26 min at 121 °C) sand (7.5 kg of sand per tray, pH 7.0) before being covered with approximately 1.5 cm of sterilized fine sand (i.e., 7.5 kg of fine sand per tray, adjusted to pH 7.0). SeedlinG.S. were then planted as individual plants, covering the surface with approximately 1.5 cm of sterilized fine sand. Next, seedling trays were placed in a larger tray (i.e., 45 cm long, 38 cm wide, and 4.5 cm high), and 200 mL of Hoagland nitrogenous nutrient solution was added on the planting day. This larger tray was watered with 300 mL of Hoagland nitrogenous nutrient solution every 5 days during the growth period, and seedlings were replenished with distilled water when there was a lack of water to ensure normal growth. Subsequently, seedlings were placed in an artificial climate chamber (i.e., light 16 h·d−1, the lighting photosynthetic photon flux density (PPFD) 400 μmol·m−2·s−1) with day and night temperatures of 25 °C ± 1 °C and 20 °C ± 1 °C, respectively. The humidity was fixed at 50% relative humidity.
The bacterial strain selected for this study was S. meliloti LL11. It was stored at −80 °C and then resuscitated on yeast mannitol agar solid medium at 28 °C. After culturing for 24 h, single colonies were inoculated into flasks containing Tryptone yeast (T.Y.) liquid medium. This product was then incubated for 18–20 h at 28 °C on a rotary shaker at 180 rpm and centrifuged at 4 °C and 10,000 r·min−1 for 10 min. After discarding the supernatant, the same amount of sterile water was added to wash the bacteria, and the bacterial suspension was configured using the same volume (i.e., OD600mm equal to 0.5 (concentration of 109 CFU·mL−1)). Using a pipette, 5 mL of bacterial suspension was then inoculated onto the root of each seedling, which ensured that no part of the seedling other than the root was inoculated. Sterile water was used to create a control condition; here, water was inoculated alone in C.K. (nonsymbiotic) plants using the procedure described above. Each experiment was repeated three times. Finally, after inoculation, 300 mL of Hoagland nutrient solution was irrigated. All samples were taken on the 35th day after inoculation.

2.2. Indicators Measurement

2.2.1. Plant Phenotype

To quantify the plant phenotype, we first randomly selected 10 plants, slowly rinsed fine sand off the root system with clear water, wiped any surface dirt off using filter paper, and then dried the plant surface. Subsequently, the plant height and root length were measured using the first pair of cotyledon leaf scars as a marker for dividing the above- and belowground parts of each plant. The above- and belowground parts were then cut with scissors and the fresh weights of both parts were determined by weighing. The samples were then placed in an envelope that was opened at both ends, dried in an oven at 105 °C for 15 min, and then dried in an oven at 80 °C to maintain constant weight. The dry weight of the above- and belowground parts were determined by weighing.

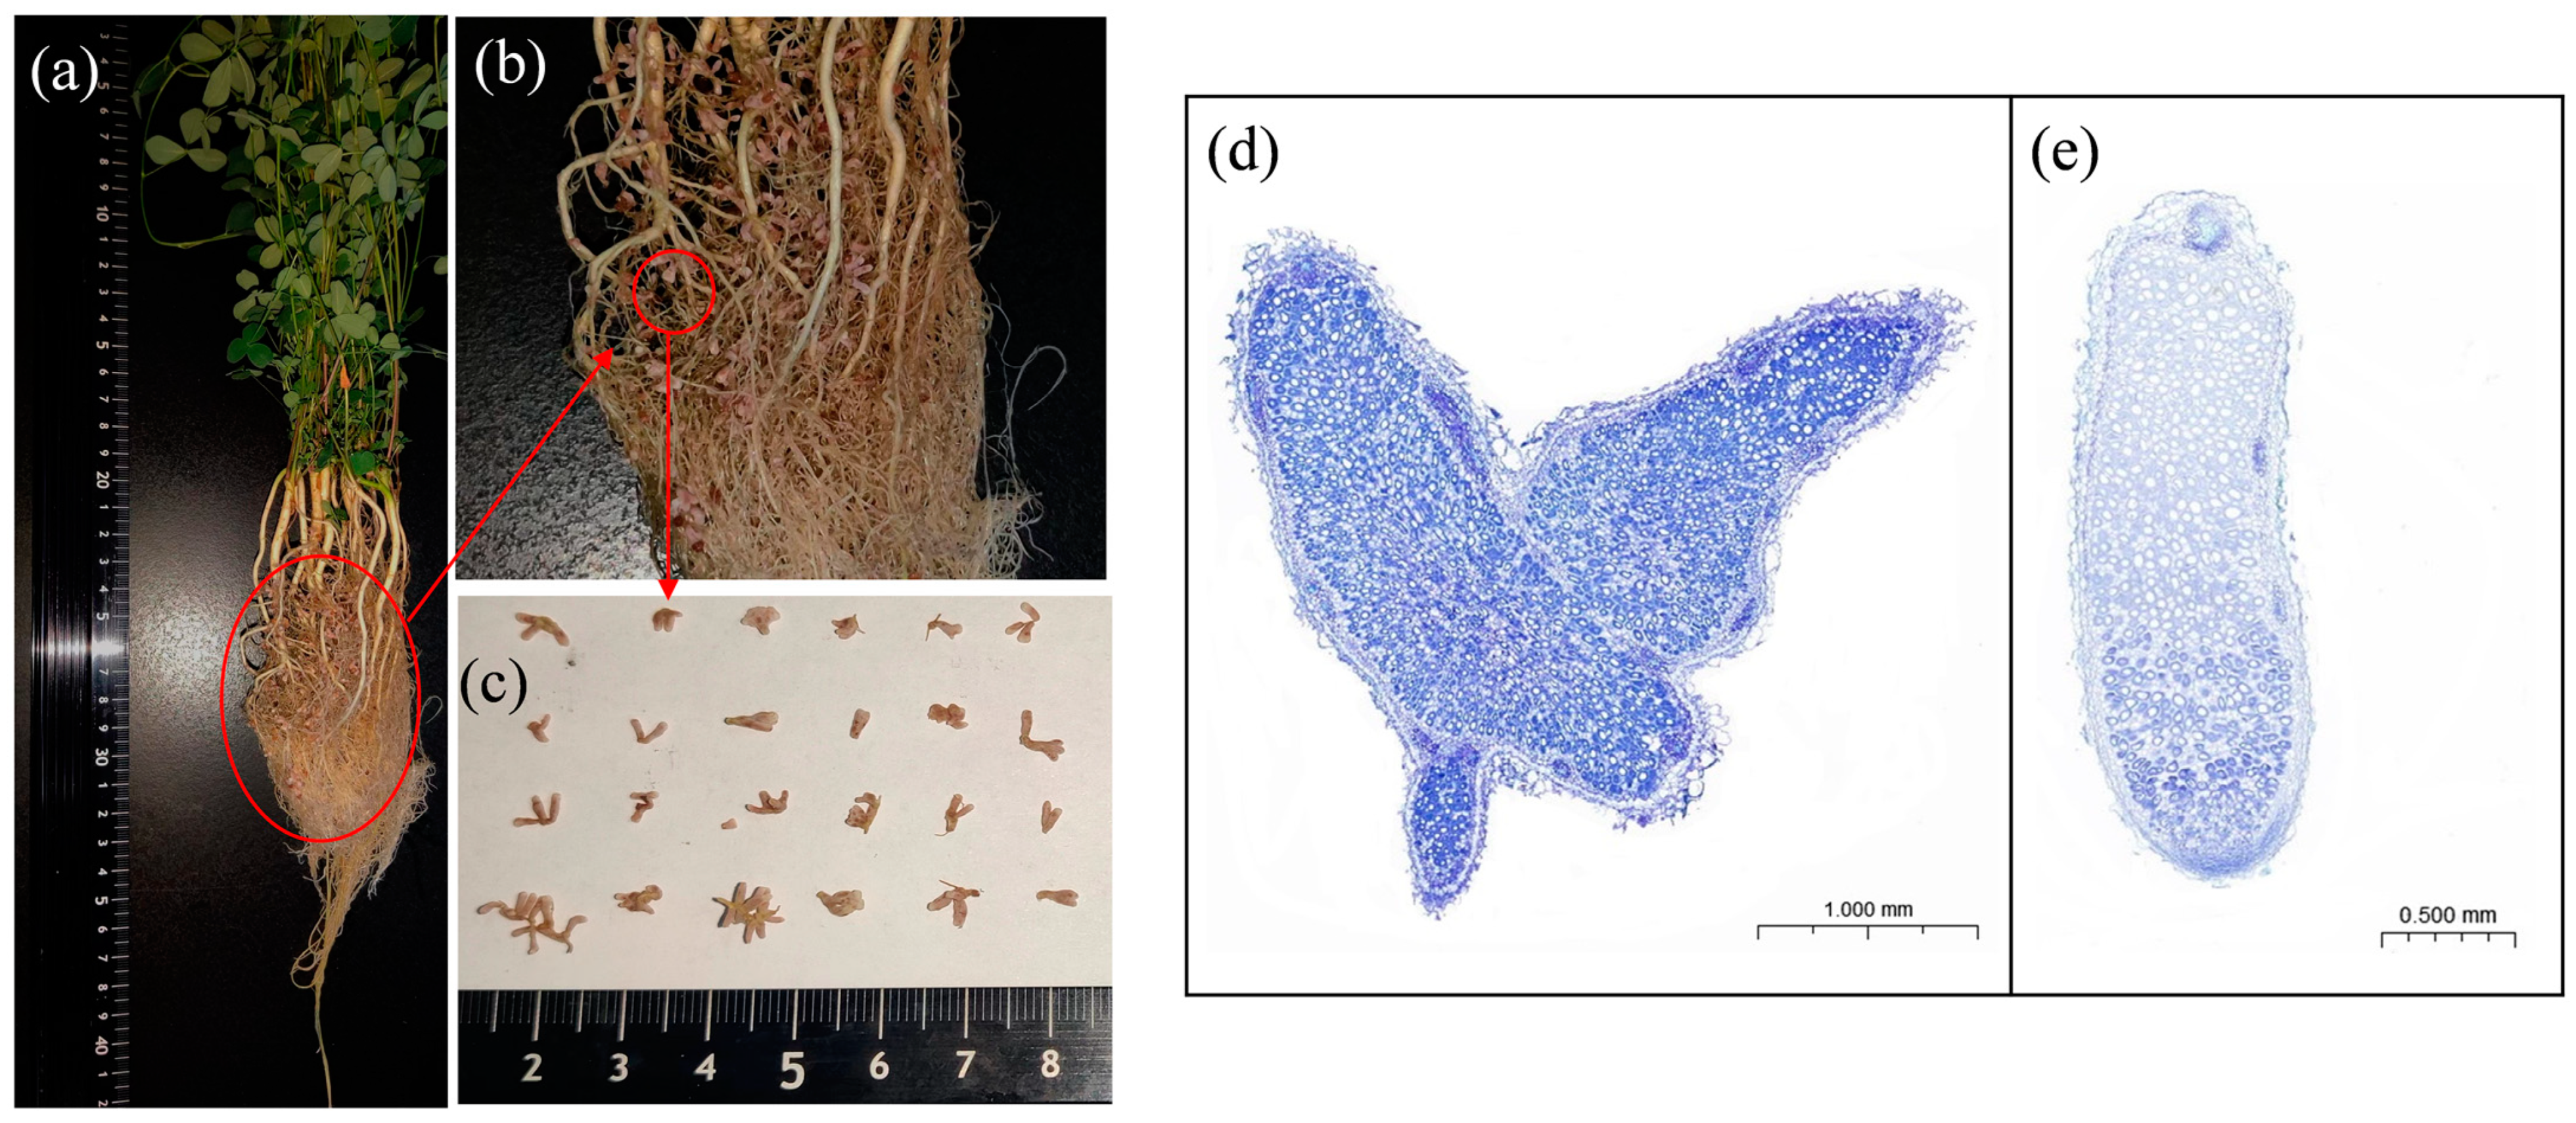
2.2.2. Nodule Formation

Visual count determined the root nodule validity under a stereomicroscope. To do so, the cut rhizomes were placed under a stereomicroscope for observation. Those with a light pink color were considered to be valid rhizomes, whereas those with a pure white color were considered to be invalid rhizomes. Next, a sample of 30 randomly selected root nodules were measured using calipers (accuracy 0.01 mm). The weight of the root nodules was determined using an electronic balance (accuracy 0.001 g). Finally, both pink and white rhizomes on symbiotic plants were fixed in 50% for maldehyde alcohol acetic acid fixative, embedded in paraffin, sectioned, stained with toluidine blue, scanned, and photographed using a Leica biomicroscope.

2.2.3. Nitrogen Fixation Capacity

To measure nitrogen fixation, nitrogenase activity was determined using the acetylene reduction method. The hemoglobin content of the nodules was determined according to previously described methods [25,26]. The nitrogen fixation potential per plant was estimated as the product of nitrogenase activity and nodule weight per plant. Each sample quality was greater than 0.1 g (repeated 3 times).

2.2.4. Activity of Key Enzymes Involved in Nitrogen Metabolism

Nitrate reductase (N.R.), nitrogen reductase (NiR), glutamine synthetase (G.S.), and glu-tamate synthetase (GOGAT) were measured using a kit from Suzhou Grace Biotech-nology Co., Ltd., Suzhou, China. All procedures were performed per the manufacturer’s instructions. Each sample quality was greater than 0.1 g (repeated 3 times).

2.3. Sample Collection for Targeted Metabolomics

After culture activation of S. meliloti LL11, which was stored in a freezer at −80 °C, the bacterial body was first washed in sterile water, transferred to a freezing tube, and then quickly placed in liquid nitrogen for 15 min. Both symbiotic and C.K. plants were washed clean and then the leaf (I.L.), stem (I.S.), pink nodule root (PNR), pink root nodule (P.N.), white nodule root (WN.R.), white root nodule (W.N.), no nodule root (NNR), C.K. leaf (CKL), C.K. stem (CKS), and C.K. root (CKR) samples were quickly cut off using a sterile scalpel. Each sample was then loaded into a storage tube and flash-frozen in liquid nitrogen for 15 min. Three replicates of each sample were obtained for each feature listed above; these were stored at −80 °C until further analysis. Sample abbreviations are listed in Table 1.

Quantification of Central Carbon and F.A. Metabolites

Central carbon metabolite samples: samples were ground in liquid nitrogen and then added to water as 100-fold dilutions. Next, 100 μL aliquots were taken and homogenized with 500 μL of an 8:2 methanol/water mixture containing mixed internal standards. Samples were mixed by good vortexing and then placed on ice for 30 min before being centrifuged at 12,000 rpm for 10 min. Finally, the supernatant was injected into the LC-MS/MS system for analysis.
FA metabolite samples: samples were resuspended in liquid nitrogen and then added to water by good vortexing as described above. Next, 100 μL aliquots were homogenized with 300 μL of a 1:1 mixture of isopropanol/acetonitrile containing mixed internal standards. This was centrifuged at 12,000 rpm for 10 min. Finally, the supernatant was injected into the LC-MS/MS system for analysis.

2.4. Data Analysis

Raw data were collected and stored in Microsoft Excel 2019. All measurements were expressed as a mean and standard error following statistical analysis. Data were sub-jected to ANOVA using SPSS version 27.0 (IBM SPSS Inc., Armonk, NY, USA,), and graphs were gen-erated using GraphPad Prism 9.5.1 (GraphPad, San Diego, CA, USA). Principal component analysis (PCA) and hierarchical cluster analysis was performed using R software (R version 4.3.1). Differences in metabolite concentration were screened primarily according to fold change (F.C.) and p-values. p-values were calculated using t-tests. F.C. thresholds were set at F.C. > 1.2 or F.C. < 0.833 and p < 0.05 to identify the differential production of metabolites.

3. Results

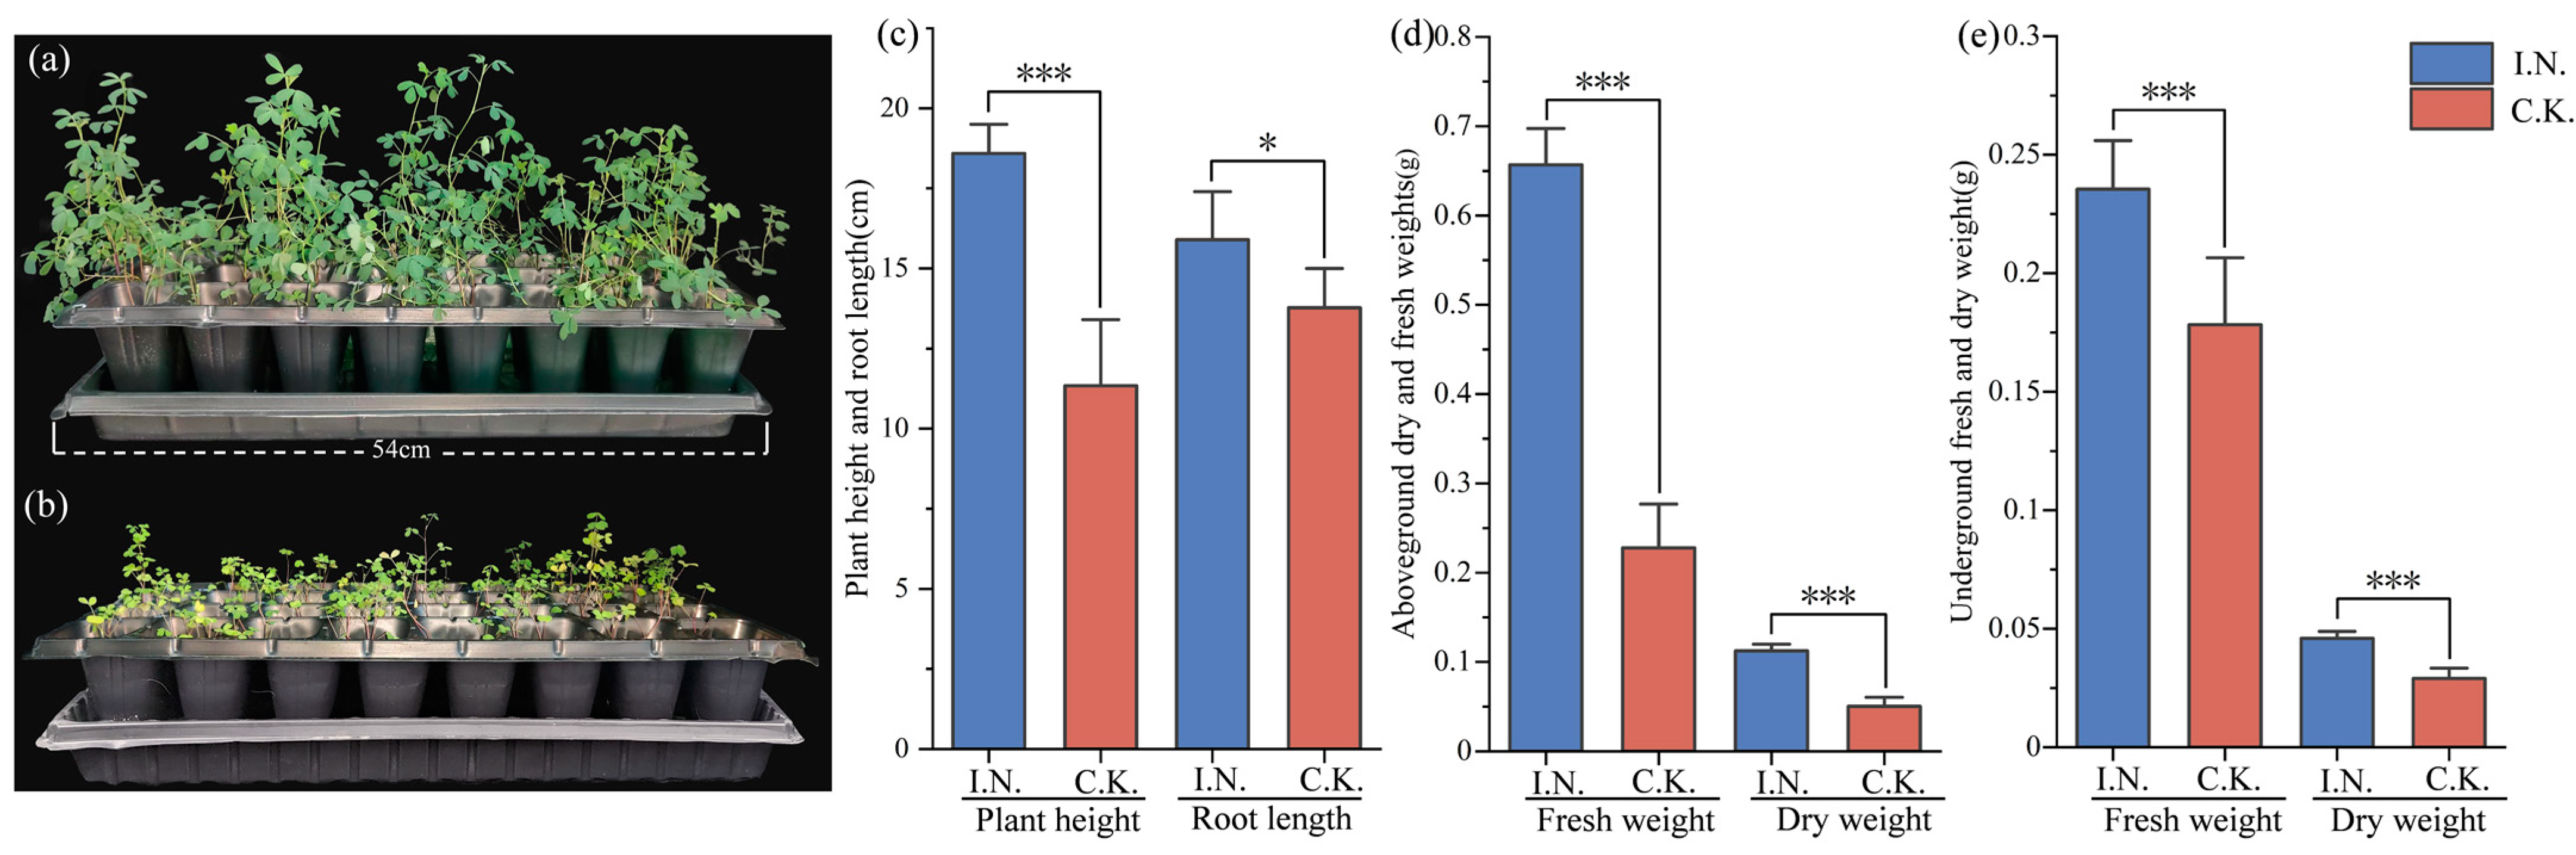
3.1. Plant Phenotype and Biomass

Symbiotic plants exhibited robust growth, including dark green leaves, whereas C.K. plants exhibited stunted growth and yellow leaves (Figure 1a,b). At 35 dpi, the symbiotic plants reached a height of 18.59 cm and a root length of 15.90 cm, dimensions that were 63.93% (p < 0.01) and 15.38% (p < 0.05) greater than those of C.K. plants (Figure 1c). Significant differences were observed in both aboveground fresh and dry weight and in underground fresh and dry weight. Overall, the aboveground fresh and dry weights of symbiotic plants were 2.89 and 2.24 times higher than those of C.K. plants (p < 0.05), whereas the underground fresh and dry weights were 32.08% and 58.40% higher (p < 0.01) (Figure 1d,e).

3.2. Nodulation and Nitrogen Fixation Capacity

After inoculation with rhizobia, the number of root nodules of alfalfa plants increased significantly. Most nodules were Y-shaped and/or coral-shaped, whereas a few had a short rod shape (Figure 2a–c). At 35 dpi, the mean nodule weight per plant was 0.0295 g, and the number of effective nodules was 4.17 times greater than the number of ineffective nodules. The nodule diameter ranged from 0.4 to 1.45 mm, with a mean of 0.905 mm(Table 2). The effective nodules’ bacteroid count was higher than ineffective nodules (Figure 2d,e). Next, we found that rhizobial inoculation led to a significant increase in nitrogenase activity and leghemoglobin content, which reached 2.8023 μmol·g−1·h−1 and 2.9659 mg·g−1, respectively. Overall, the nitrogen fixation capacity per plant increased to 0.0826 μmol·h−1 following inoculation (Table 2).

3.3. Activity of Key Enzymes Involved in Nitrogen Metabolism

The activities of enzymes related to nitrogen metabolism in symbiotic plants were significantly different from those in C.K. plants (p < 0.05). For example, GOGAT activity in the leaves of symbiotic plants (i.e., 1116.86 nmol Glu·min−1·g−1) was 1.84 times higher than in the roots (p < 0.01) and was 37.25% higher than in the leaves of C.K. plants. In contrast to GOGAT, G.S. activity in the roots was higher than in the leaves. Moreover, G.S. activity in the roots of symbiotic plants reached 11.45 U·g−1, which was significantly different from that in other groups (p < 0.01). We found no significant difference in NiR activity between the leaves (59.58 μmol·h−1·g−1) and roots (59.26 μmol·h–1·g−1) of symbiotic plants (p > 0.05), but we found a significant difference in NiR activity between the leaves and roots of C.K. plants (p < 0.05). Moreover, N.R. activity in the roots of symbiotic and C.K. plants was significantly higher than in the leaves of either plant group (p < 0.05). However, N.R. activity in the roots of symbiotic plants (728.23 nmol·h−1·g−1) was 39.08% higher than in C.K. plants, which was itself 2.05 times higher than what was recorded in the leaves of symbiotic plants (p < 0.05) (Figure 3a–d).

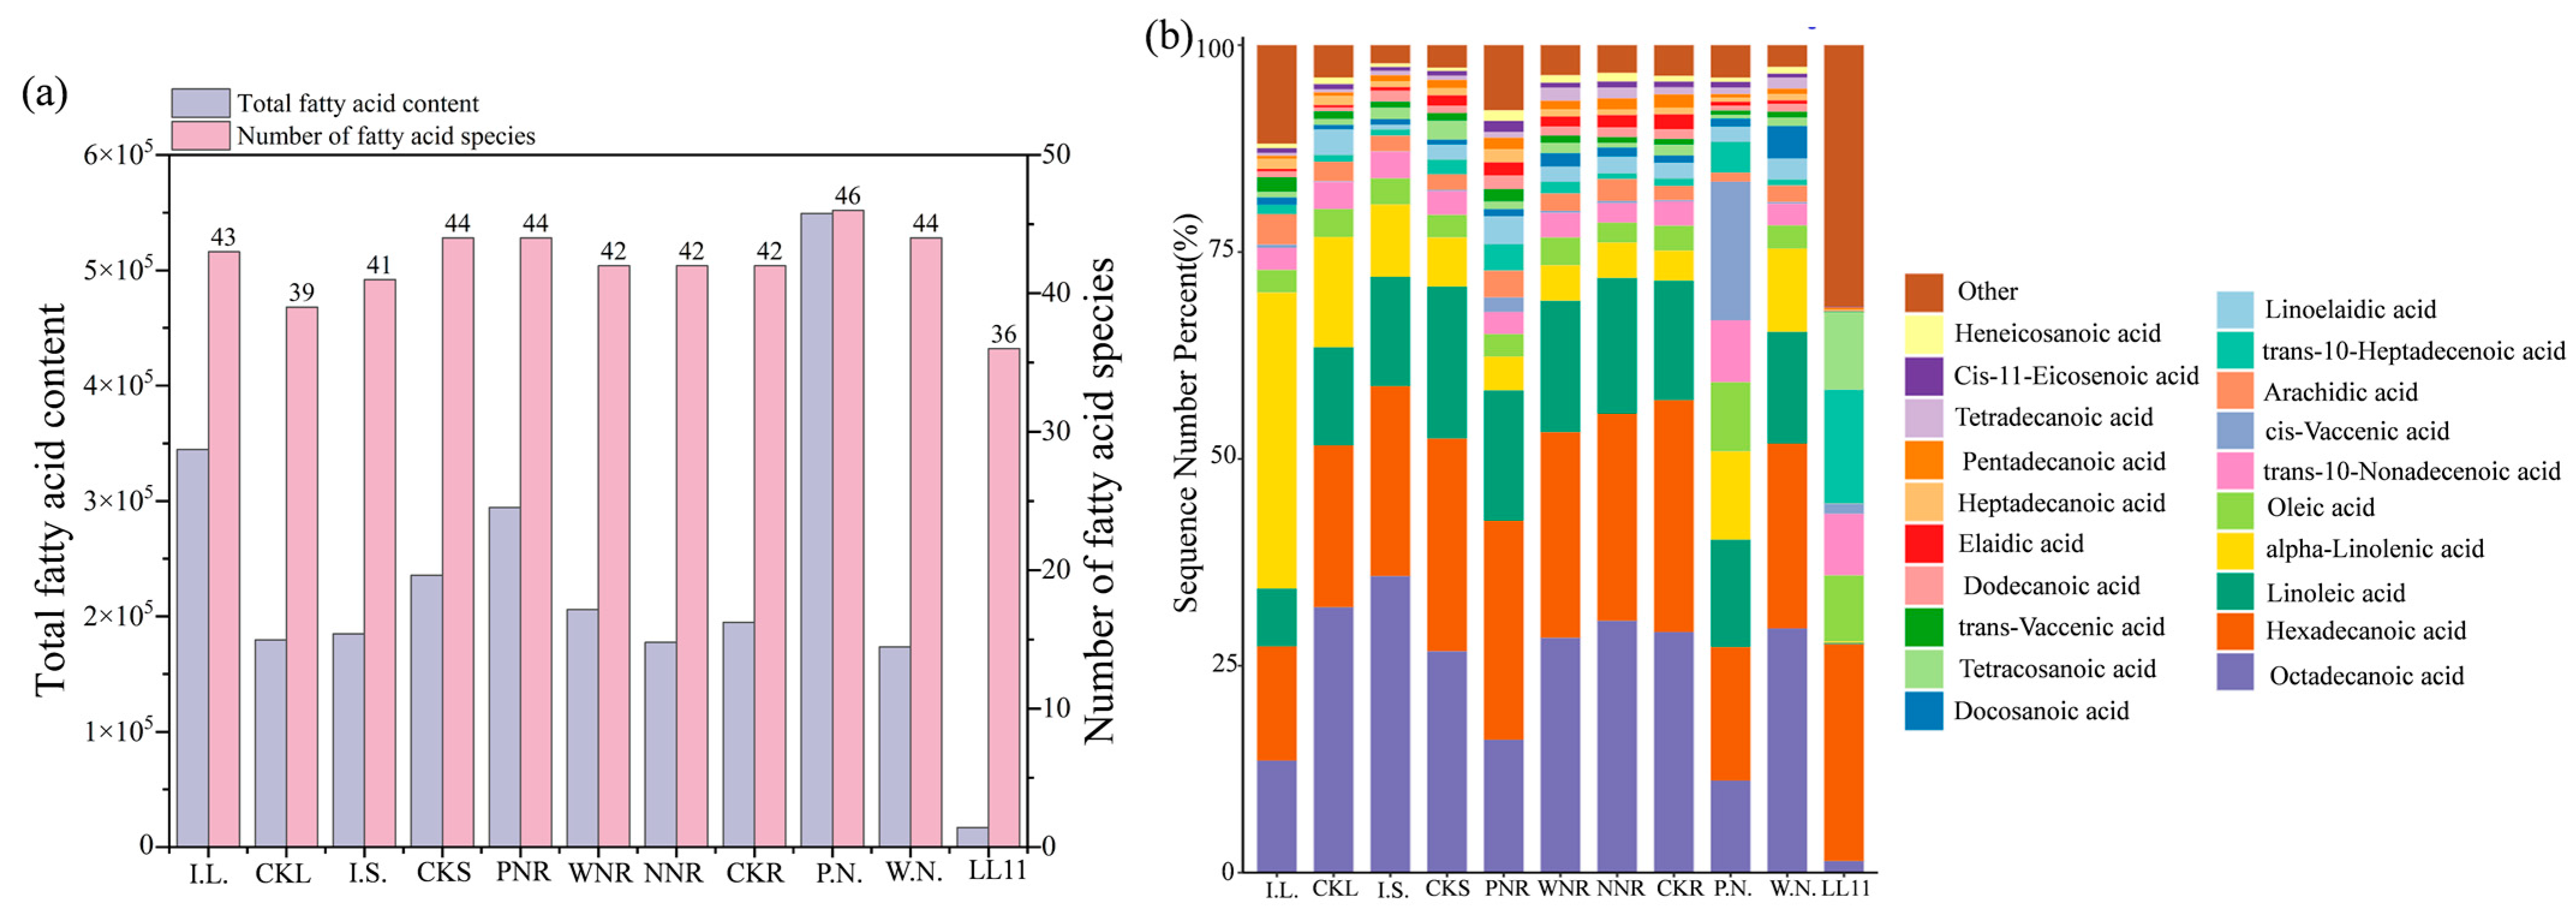
3.4. F.A. and Central Carbon-Targeted Metabolomic Analysis of Rhizobia

Next, we performed a targeted metabolomic study of F.A. and central carbon compounds in S. meliloti LL11. A total of 40 F.A. metabolites were detected using F.A.-targeted metabolomics. The top five F.A. metabolites, which accounted for 91.38% of total LL11 F.A. content, included hexadecenoic acid, palmitoleic acid, trans-10-heptadecenoic acid, tetradecanoic acid, and oleic acid. We found that the levels of hexadecenoic acid and palmitoleic acid exceeded 4700 ng·mL−1, whereas those of arachidonic acid, erucic acid, cis-4,7,10,13,16-docosapentaenoic acid (DPA), and cis-5,8,11,14,17-eicosapentaenoic acid were all <1 ng·mL−1 (Figure 4a). LL11 contains 40 different F.A.s, with 15 being saturated (accounting for 38.89% of total F.A. content) and 25 being unsaturated (accounting for 61.11% of total F.A. content; Table 2). Next, a central carbon-targeted metabolomic study detected 32 central carbon metabolites. Of these, succinate, lactate, malate, pyruvate, and D-glucose were found to be highly abundant, whereas adenosine triphosphate and fumarate were not detected. We identified 13 TCA cycle-related metabolites, 14 PPP-related metabolites, and 16 EMP pathway-related metabolites (Figure 4b).

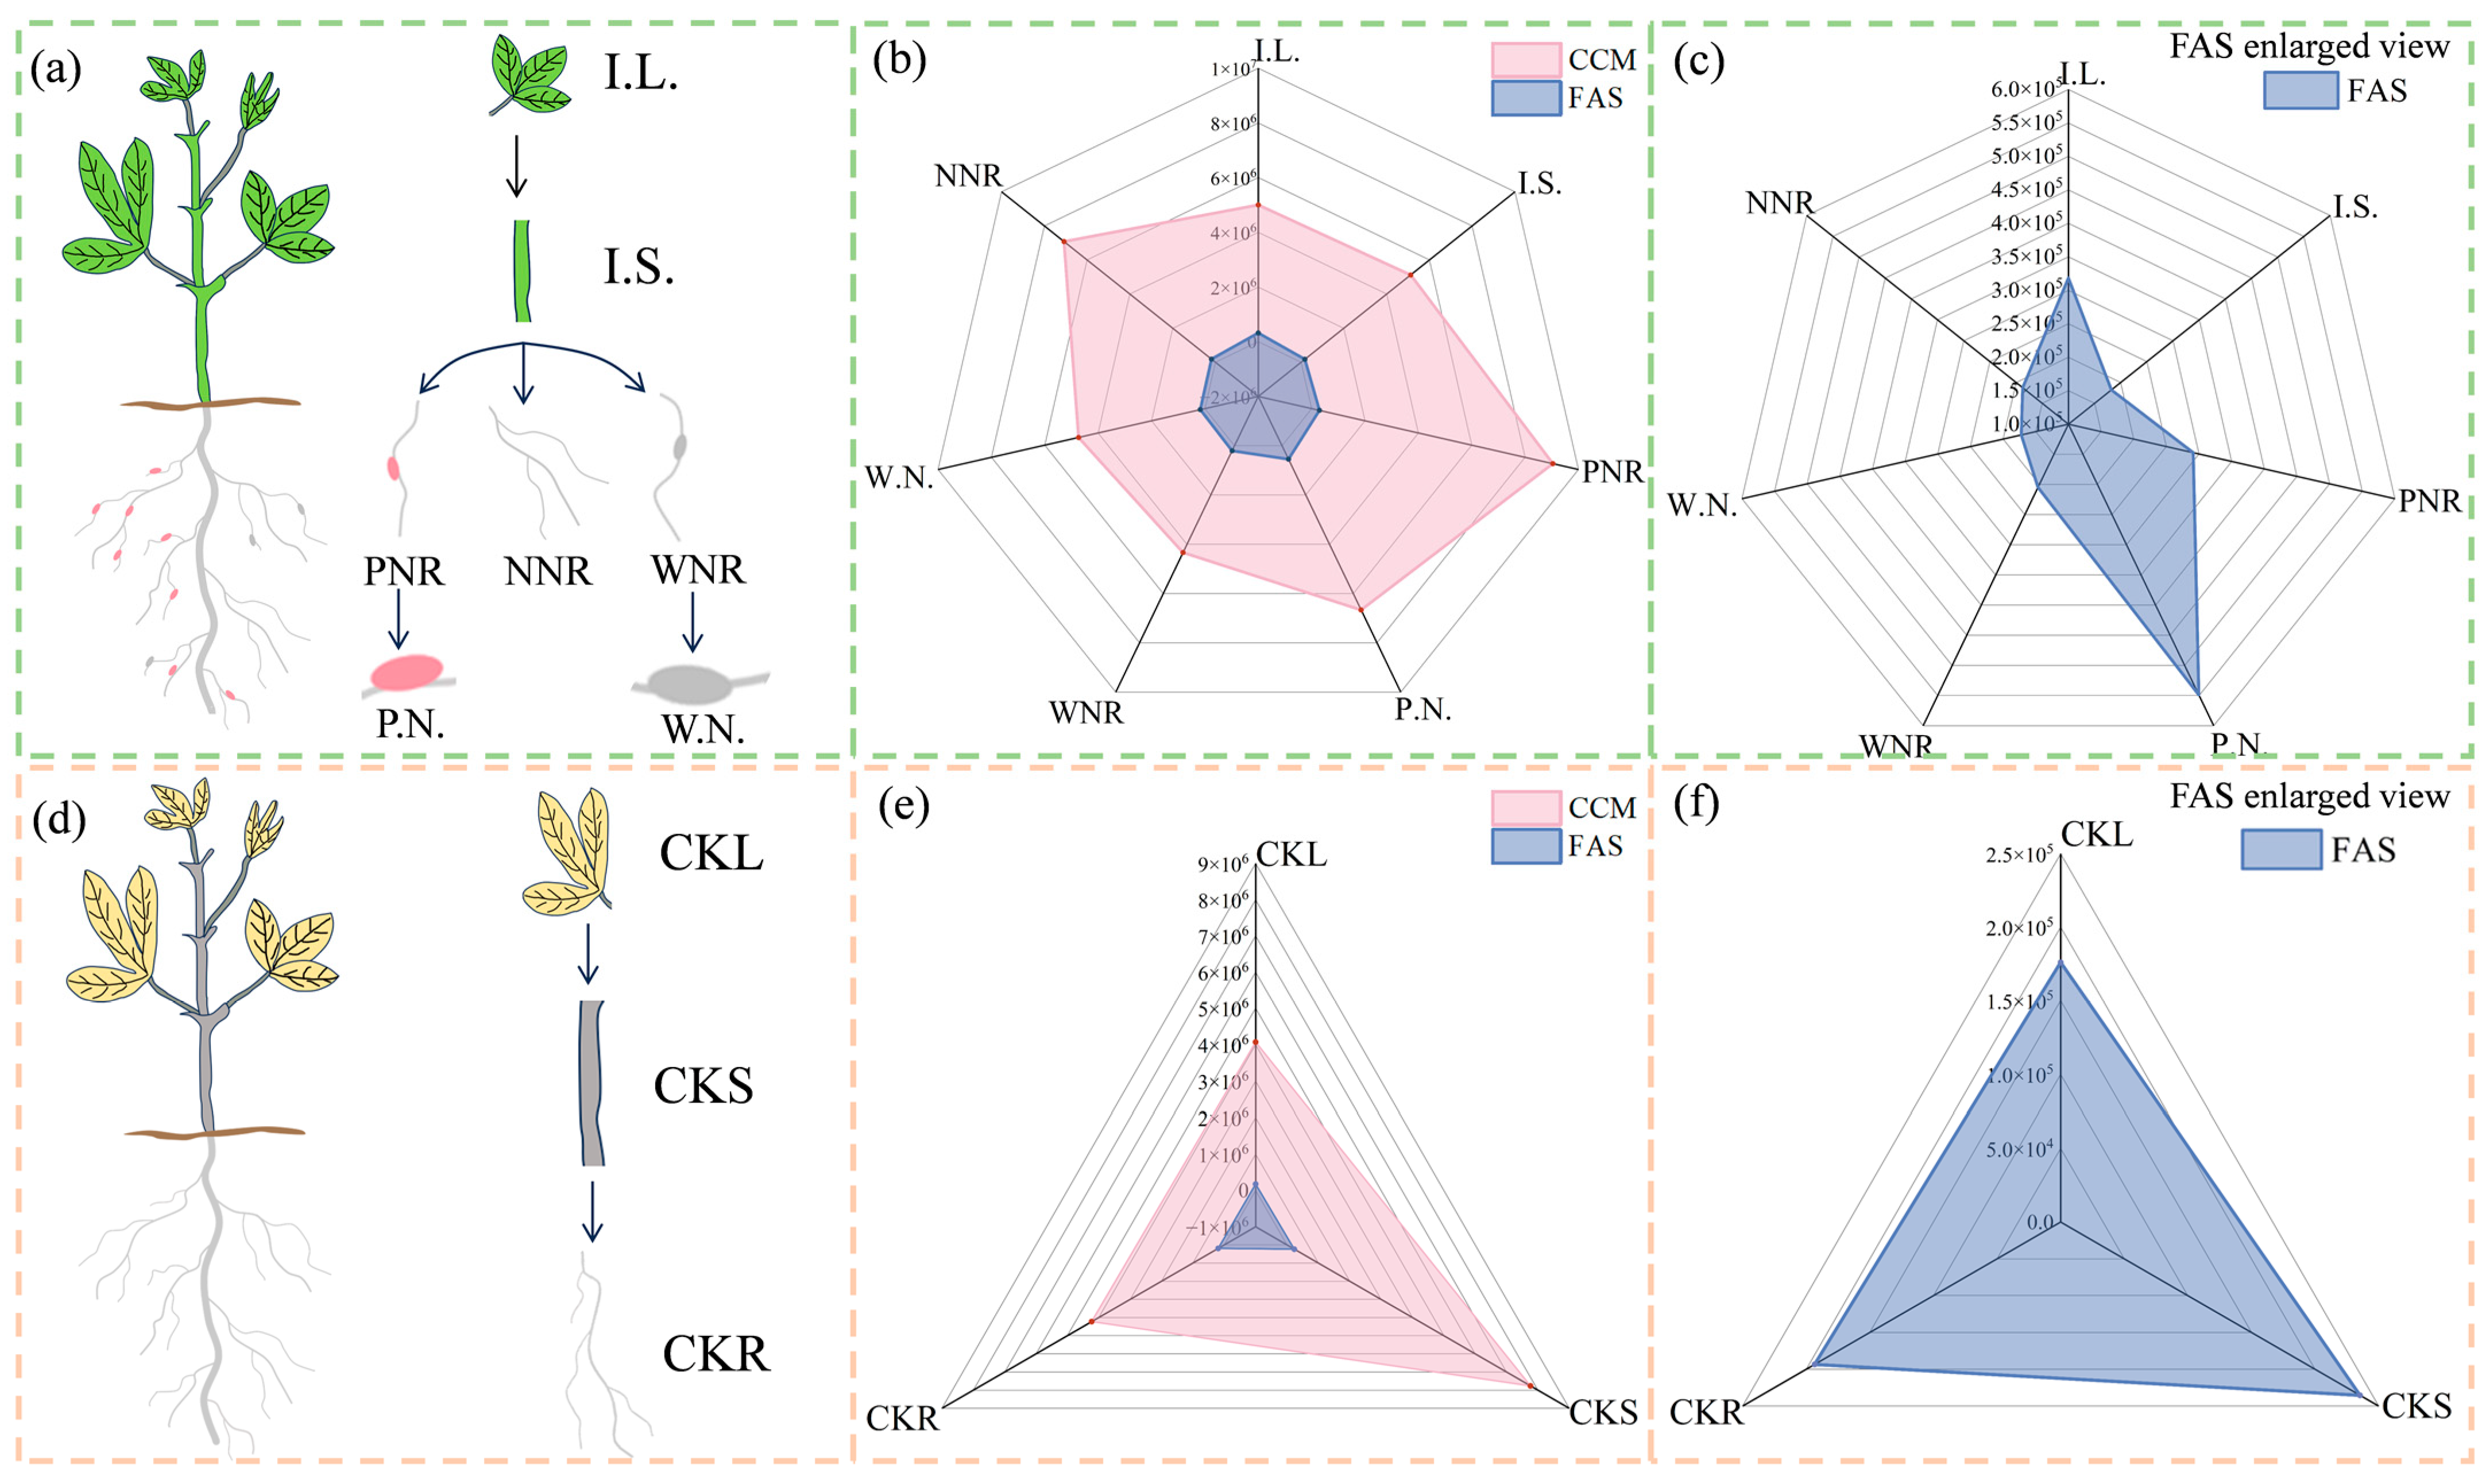
3.5. F.A. and Central Carbon-Targeted Metabolic Analyses of Plant Tissues

F.A. and central carbon-targeted metabolomics analyses were then performed on different tissues of symbiotic and C.K. plants, and these results were then subjected to statistical analysis. PCA results for F.A. metabolites showed that the total cumulative contribution rate of the first two principal components was 64.55%, with the first principal component explaining 35.11% of the total variance and the second principal component explaining 29.44% of the total variance (Figure 5a). The results of the PCA for central carbon metabolites showed that the total cumulative contribution rate of the first two principal components was 57.38%, with the first principal component explaining 35.38% of the total variance and the second principal component explaining 22% of the total variance (Figure 5b). Subsequent cluster analysis of F.A. and central carbon metabolites in different tissues showed that F.A. metabolites were highly expressed in P.N., PNR, and I.L. (Figure 5c), whereas central carbon metabolites were highly expressed in P.N. (Figure 5d).
We also observed differences in the type and content of F.A.s among different tissues and between symbiotic and C.K. plants. We found that the relative content of hexadecenoic acid, cis-11,14,17-eicosatrienoic acid, linoleic acid, and α-linolenic acid showed differences between the treatment and control groups; their proportions in symbiotic plants were 19.55%, 18.98%, 12.93%, and 12.58%, respectively, whereas in C.K. plants, their proportions were 24.44%, 28.53%, 15.09%, and 7.22%, respectively. Additionally, the content of unsaturated F.A.s was higher in P.N., and accounted for 67.96% of total fatty acid content. W.N. contained more saturated F.A.s, accounting for 62.81% of total fatty acid content (Figure 5a). Overall, IL’s unsaturated fatty acid content was 1.52 times higher than in CKL. However, we observed no significant differences in the saturated and unsaturated fatty acid content of the four types of roots (i.e., PNR, WNR., NNR., and CKR), I.S., or CKS (Table 3).

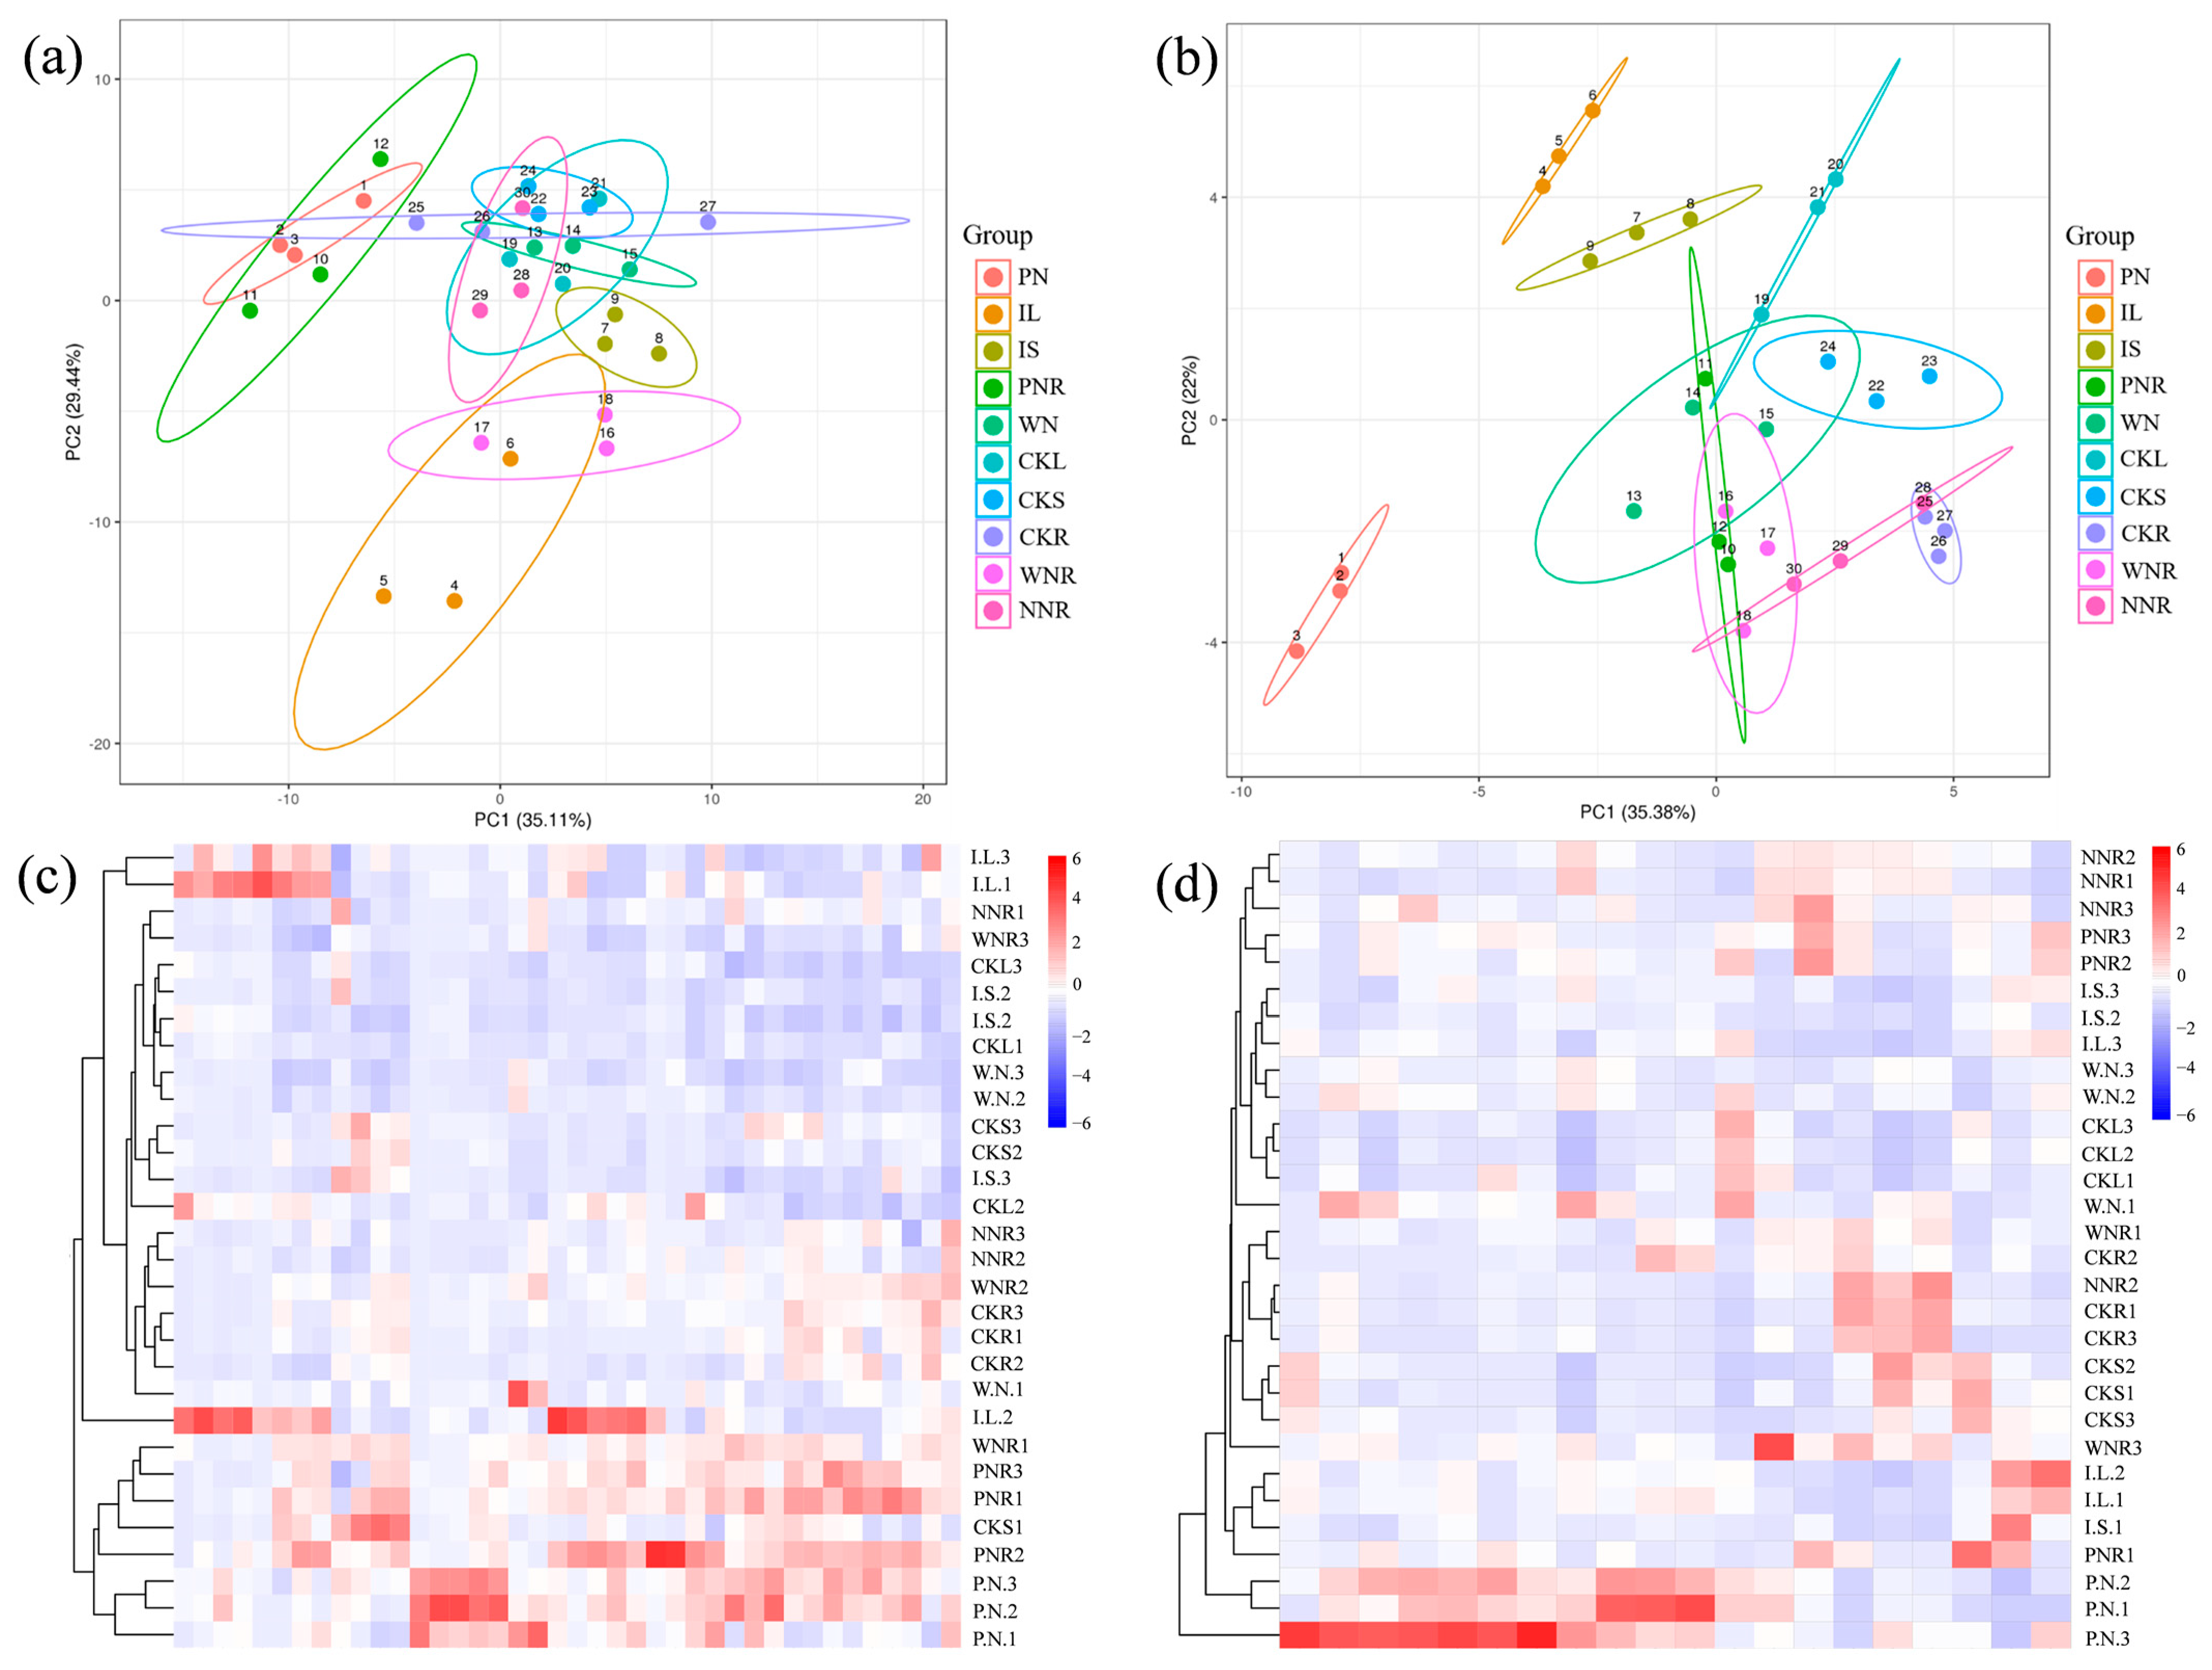
3.5.1. Differences in Leaf and Stem Metabolism

During FA metabolic analyses, we detected 43 F.A.s in I.L. and 42 in CKL. We found similar patterns in these samples for 38 of the 43 F.A.s, but also found notable differences between leaf samples. The leaf content of α-linolenic acid, hexadecenoic acid, cis-11,14,17-eicosatrienoic acid, and linoleic acid were high in both I.L. and CKL, and these four F.A.s collectively accounted for 65.23% of the total F.A. content of I.L. samples and 74.42% for CKL samples. In terms of unique metabolites, we found a unique profile in I.L. for caprylic acid, decanoic acid, endecanoic acid, petroselaidic acid, and cis-7,10,13,16-docosatetraenoic acid, whereas CKL showed a unique profile for tomyristelaidic acid, cis-10-pentadecenoic acid, linoleic acid, and cis-7,10,13,16,19-DPA (Figure 6a,b and Figure 7a). We also found 11 differentially produced F.A.s by comparing the I.L. and CKL groups. Ten of these were upregulated in response to inoculation, with the most strongly upregulated F.A. being cis-11,14,17-eicosatrienoic acid. The only F.A. that was downregulated in response to inoculation was cis-11,14,17-eicosatrienoic acid (Figure 7a). When we ran similar analyses on central carbon metabolites; we detected 21 metabolites in both I.L. and CKL, of which 18 were the same metabolites. Guanosine monophosphate and nicotinamide adenine dinucleotide NAD+ levels were significantly higher in I.L. than in CKL, and other metabolites were similar (Figure 4b). Nine different central carbon metabolites were in the I.L. vs. CKL group, of which six were upregulated. Here, the most upregulated was NAD+; we found three types of downregulated expression and the least downregulated was cis-aconitic acid (Figure 7b).
A total of 41 F.A.s were detected in I.S. and CKS, 39 of which were the same. Of these, hexadecenoic acid, cis-11,14,17-eicosatrienoic acid, linoleic acid, and α-linolenic acid were higher. We identified several unique F.A.s in I.S. and CKS, including caprylic acid, trans-11-eicosenoic acid, hexadecenoic acid, and DPA (Figure 4a and Figure 6a,b). There were six F.A.s that differed between the I.S. and CKS groups, all downregulated. Here, the smallest downregulation was observed for heptadecanoic acid (Figure 7c). In terms of CCM, 23 metabolites were detected in I.S., 22 metabolites were detected in CKS, and 21 identical metabolites were detected. Among them, the levels of 6-phosphogluconic acid, lactic acid, phosphoenolpyruvate (PEP), and NAD+ were significantly higher in I.S. than in CKS (Figure 4b and Figure 6b). There were eight different central carbon metabolites; three of these were upregulated, with PEP being the most upregulated. We also identified five metabolites that showed downregulated expression after inoculation, with the least downregulated being cis-aconitic acid (Figure 7d).

3.5.2. Differences in Root Metabolism

After inoculation with rhizobia, roots were divided into three categories according to their nodulation status, i.e., PNR, WNR, and NNR. Additionally, we examined a control condition without rhizobial inoculation, i.e., CKR. Regarding F.A.s, we identified 45 F.A.s in both PNR and WNR, 43 F.A.s in NNR., 44 F.A.s in C.K.R, and 40 F.A.s in all four root types (Figure 8a,d,g,j,m,p). The total F.A. content was highest in PNR, followed by WNR, and was lowest in NNR. The contents of hexadecenoic acid, cis-11,14,17-eicosatrienoic acid, and linoleic acid were upregulated in response to inoculation in all four root types. Moreover, the contents of hexadecenoic acid and linoleic acid in PNR were as high as 76,447.96 ng·g−1 and 46,359.78 ng·g−1, and the contents of cis-11,14,17-eicosatrienoic acid and α-linolenic acid in PNR were lower than those in the other three root types (Figure 4a and Figure 6b).
Regarding central carbon metabolites, we detected 22 metabolites in PNR, 24 metabolites in WNR, and 21 metabolites in NNR and CKR. The contents of 6-phosphogluconic acid, malate, and D-xylulose 5-phosphate in PNR were significantly higher than those in other roots. Succinate content was highest in NNR, followed by PNR, CKR, and WNR. The contents of D-glucose-1-phosphate and isocitrate in PNR were significantly lower than in other roots. Moreover, the contents of sedoheptulose 7-phosphate, glucose 6-phosphate, and cis-aconitic acid were higher in CKR than in the other three root types (Figure 4b). There were eight differentially produced F.A.s between the PNR and WNR groups; of these, seven were upregulated, with trans-10-nonadecenoic acid being the most highly upregulated. Conversely, the expression of tetracosanoic acid was downregulated (Figure 8b). We also identified six differentially produced central carbon metabolites, three of which were upregulated, the most highly upregulated of which was NAD+. Three were downregulated, including glucose 6-phosphate, the most strongly downregulated (Figure 8c). There were 18 differential F.A.s in the PNR vs. NNR group comparison. Here, all 18 were upregulated, and the most upregulated was trans-10-heptadecenoic acid (Figure 8e). This comparison also showed six differentially produced central carbon metabolites, three of which were upregulated, with NAD+ the most highly upregulated. The other three were downregulated, with isocitrate being the most strongly downregulated (Figure 8f). Next, we identified 16 differentially produced F.A.s in the PNR vs. CKR group. Of these, 15 were upregulated, and the most upregulated was cis-13,16-docosadienoic acid. Only tridecanoic acid was downregulated in this comparison (Figure 8h). Furthermore, this pair revealed ten differentially produced central carbon metabolites, six of which were upregulated, with NAD+ being the most upregulated. Conversely, four metabolites were downregulated, the most strongly downregulated being glucose 6-phosphate (Figure 8i). Next, the WNR vs. CKR group showed that two F.A.s were upregulated, with the most upregulated being docosanoic acid (Figure 8k). We also found seven key differentially regulated central carbon metabolites. Here, four were upregulated, with lactic acid being the most upregulated. Three metabolites were also downregulated, with the greatest degree of downregulation affecting D-glucose-1-phosphate (Figure 8l). Palmitoleic acid was the only fatty acid that was upregulated in the WNR vs. NNR group (Figure 8n). The key differentially produced central carbon metabolites were cis-aconitic acid and dTMP, both of which were upregulated, with dTMP being the most highly upregulated (Figure 8o). We also identified seven differentially produced F.A.s in the NNR vs. CKR group comparison. Here, five were upregulated, with the most upregulated being tridecanoic acid; we also found downregulated expression of arachidonic acid and tetracosanoic acid (Figure 8q). There were six differentially produced central carbon metabolites, five of which were upregulated, including sedohep-tulose 7-phosphate, which was the most highly upregulated. In this comparison, only isocitrate was downregulated (Figure 8r).

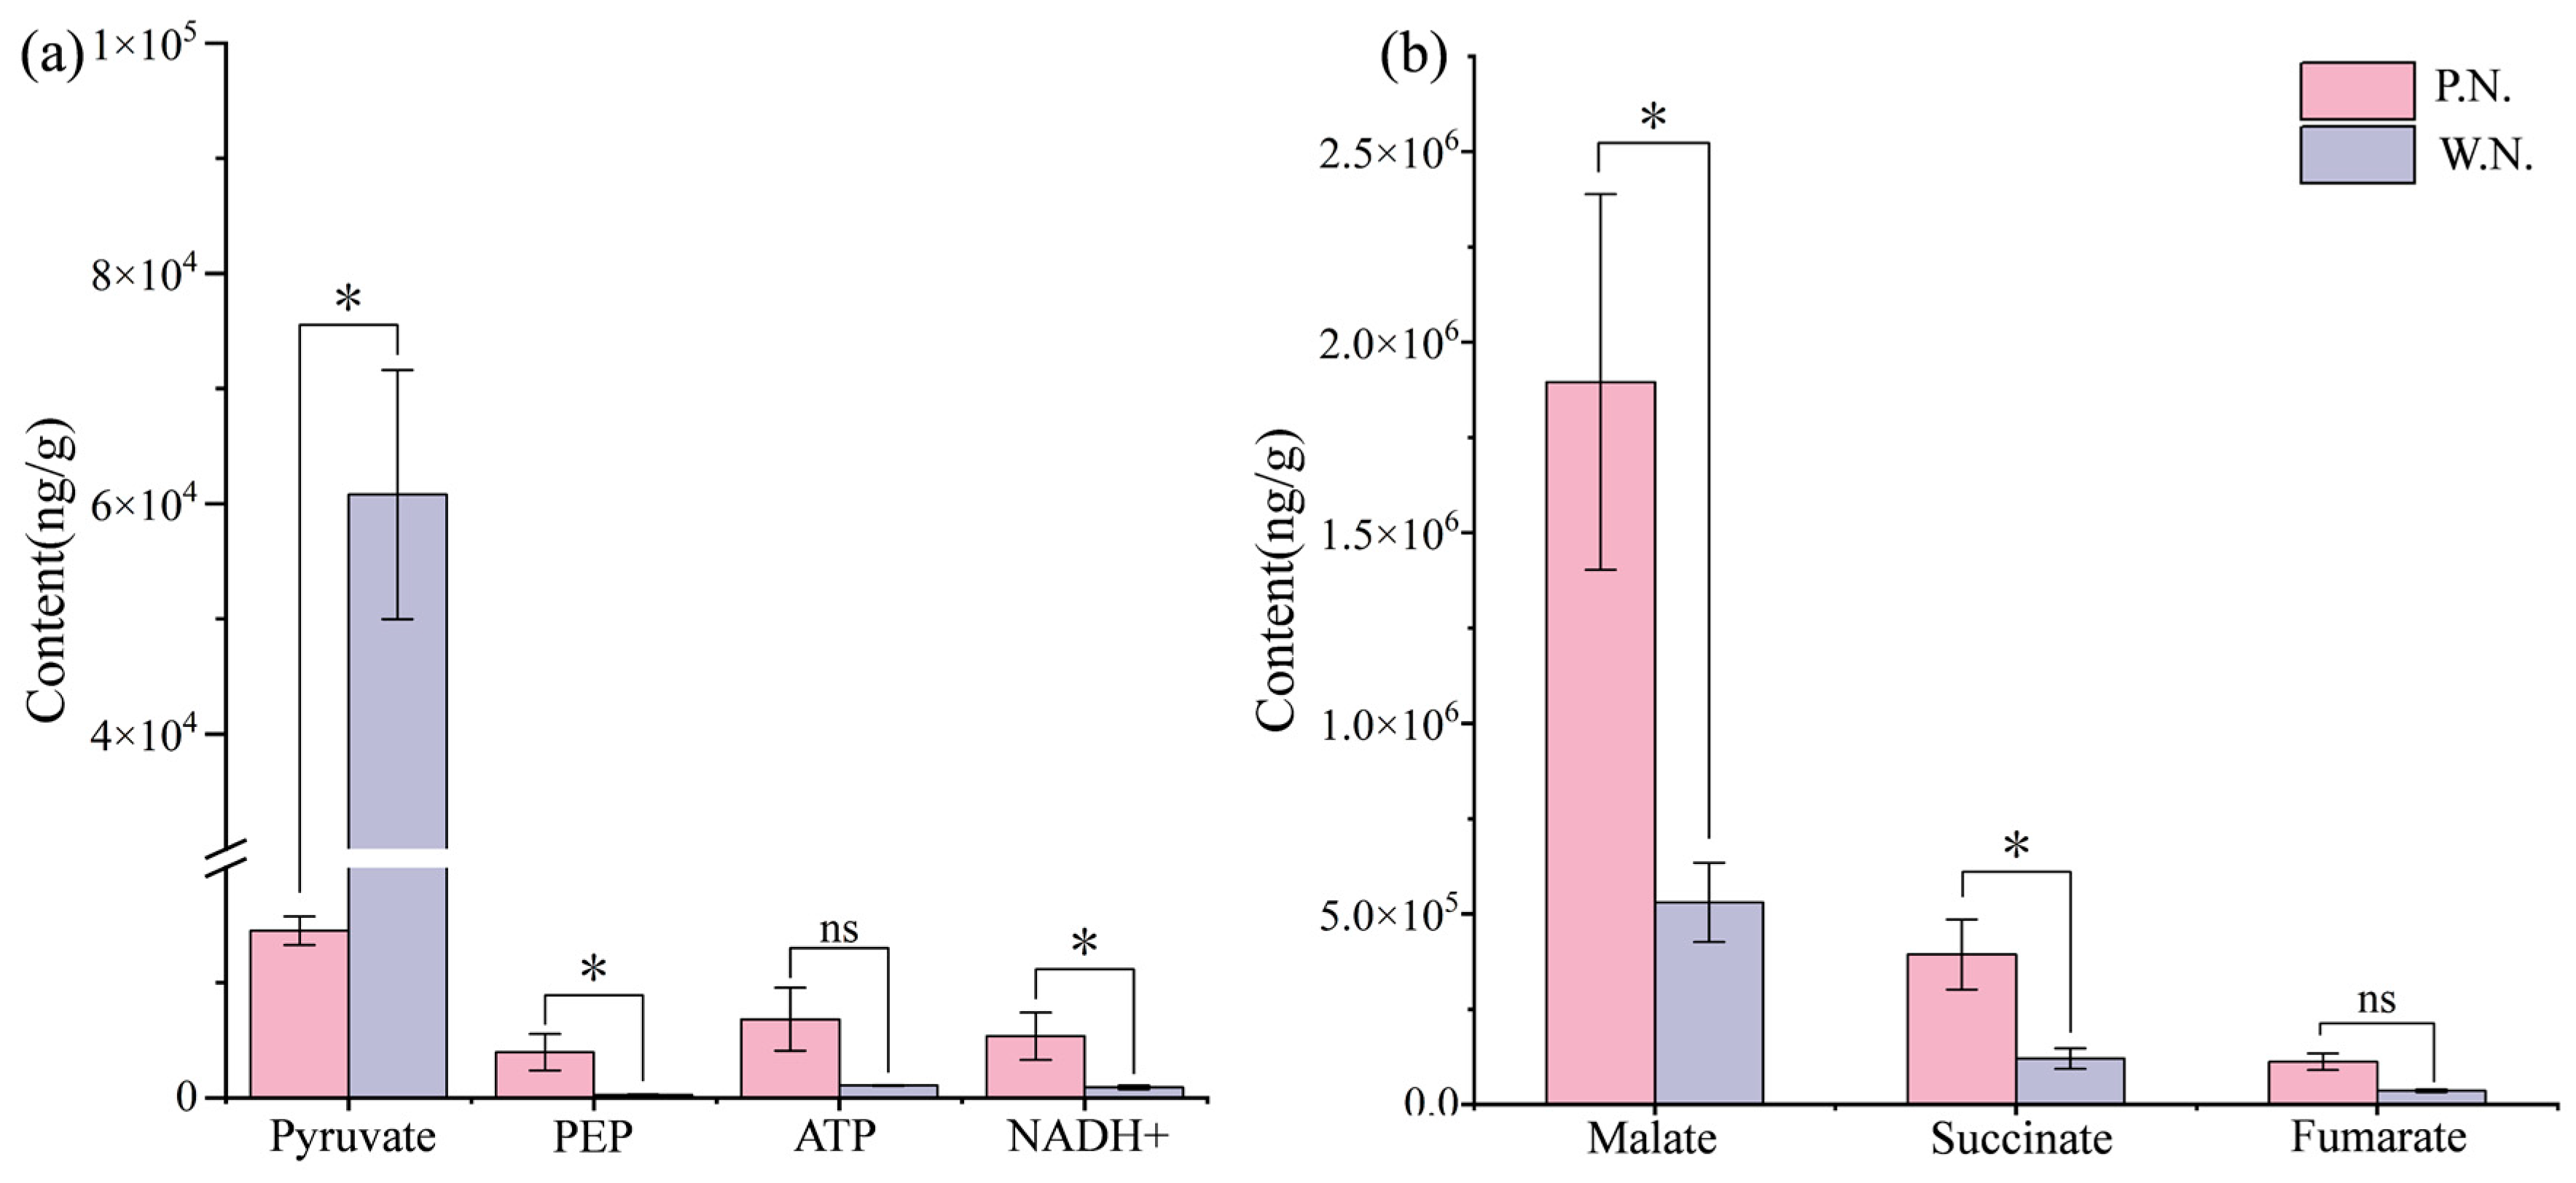
3.5.3. Differences in Nodule Metabolism

Alfalfa inoculated with rhizobia can produce two different types of nodules: P.N. and W.N. We detected a total of 46 F.A.s in P.N. and 43 F.A.s in W.N., of which 42 were identical. Moreover, the total F.A. content of P.N. was 3.37 times higher than W.N. Specifically, we found that the contents of hexadecenoic acid, cis-11,14,17-eicosatrienoic acid, linoleic acid, and α-linolenic acid were all quite high in both P.N. and W.N. The F.A.s found to be unique to P.N. included decanoic acid, palmitelaidic acid, petroselaidic acid, and docosahexaenoic acid, all of which may be involved in symbiotic nitrogen fixation (Figure 6a,b). We also found 13 differentially produced F.A.s in the P.N. vs. W.N. group comparison. All of these were upregulated, with the most upregulated being trans-10-nonadecenoic acid (Figure 9b).
Regarding central carbon metabolites, we detected 28 metabolites in P.N., 22 in W.N., and 21 that were common to both. Next, we analyzed the metabolites related to TCA in P.N. and W.N. We found that, except for pyruvate, which was lower in P.N. than in W.N., all other substances showed higher levels in P.N. than in W.N., with some metabolites such as PEP showing a content level in P.N. that was 27 times higher than that in W.N. (Figure 10a). Moreover, the concentration of dicarboxylic acid in P.N. was 2.87 times higher than in W.N. (p < 0.05). Additionally, malate, the main component of dicarboxylic acid, showed its highest concentration in P.N. (1,562,205.961 ng·g−1), which was 3.97 and 13.95 times higher than the levels of succinate and fumarate present in P.N. (Figure 10b). The P.N. vs. W.N. group comparison showed four differentially produced central carbon metabolites, three of which were upregulated. The most upregulated of these was D-xylulose 5-phosphate, whereas the only downregulated metabolite was pyruvate (Figure 9c).

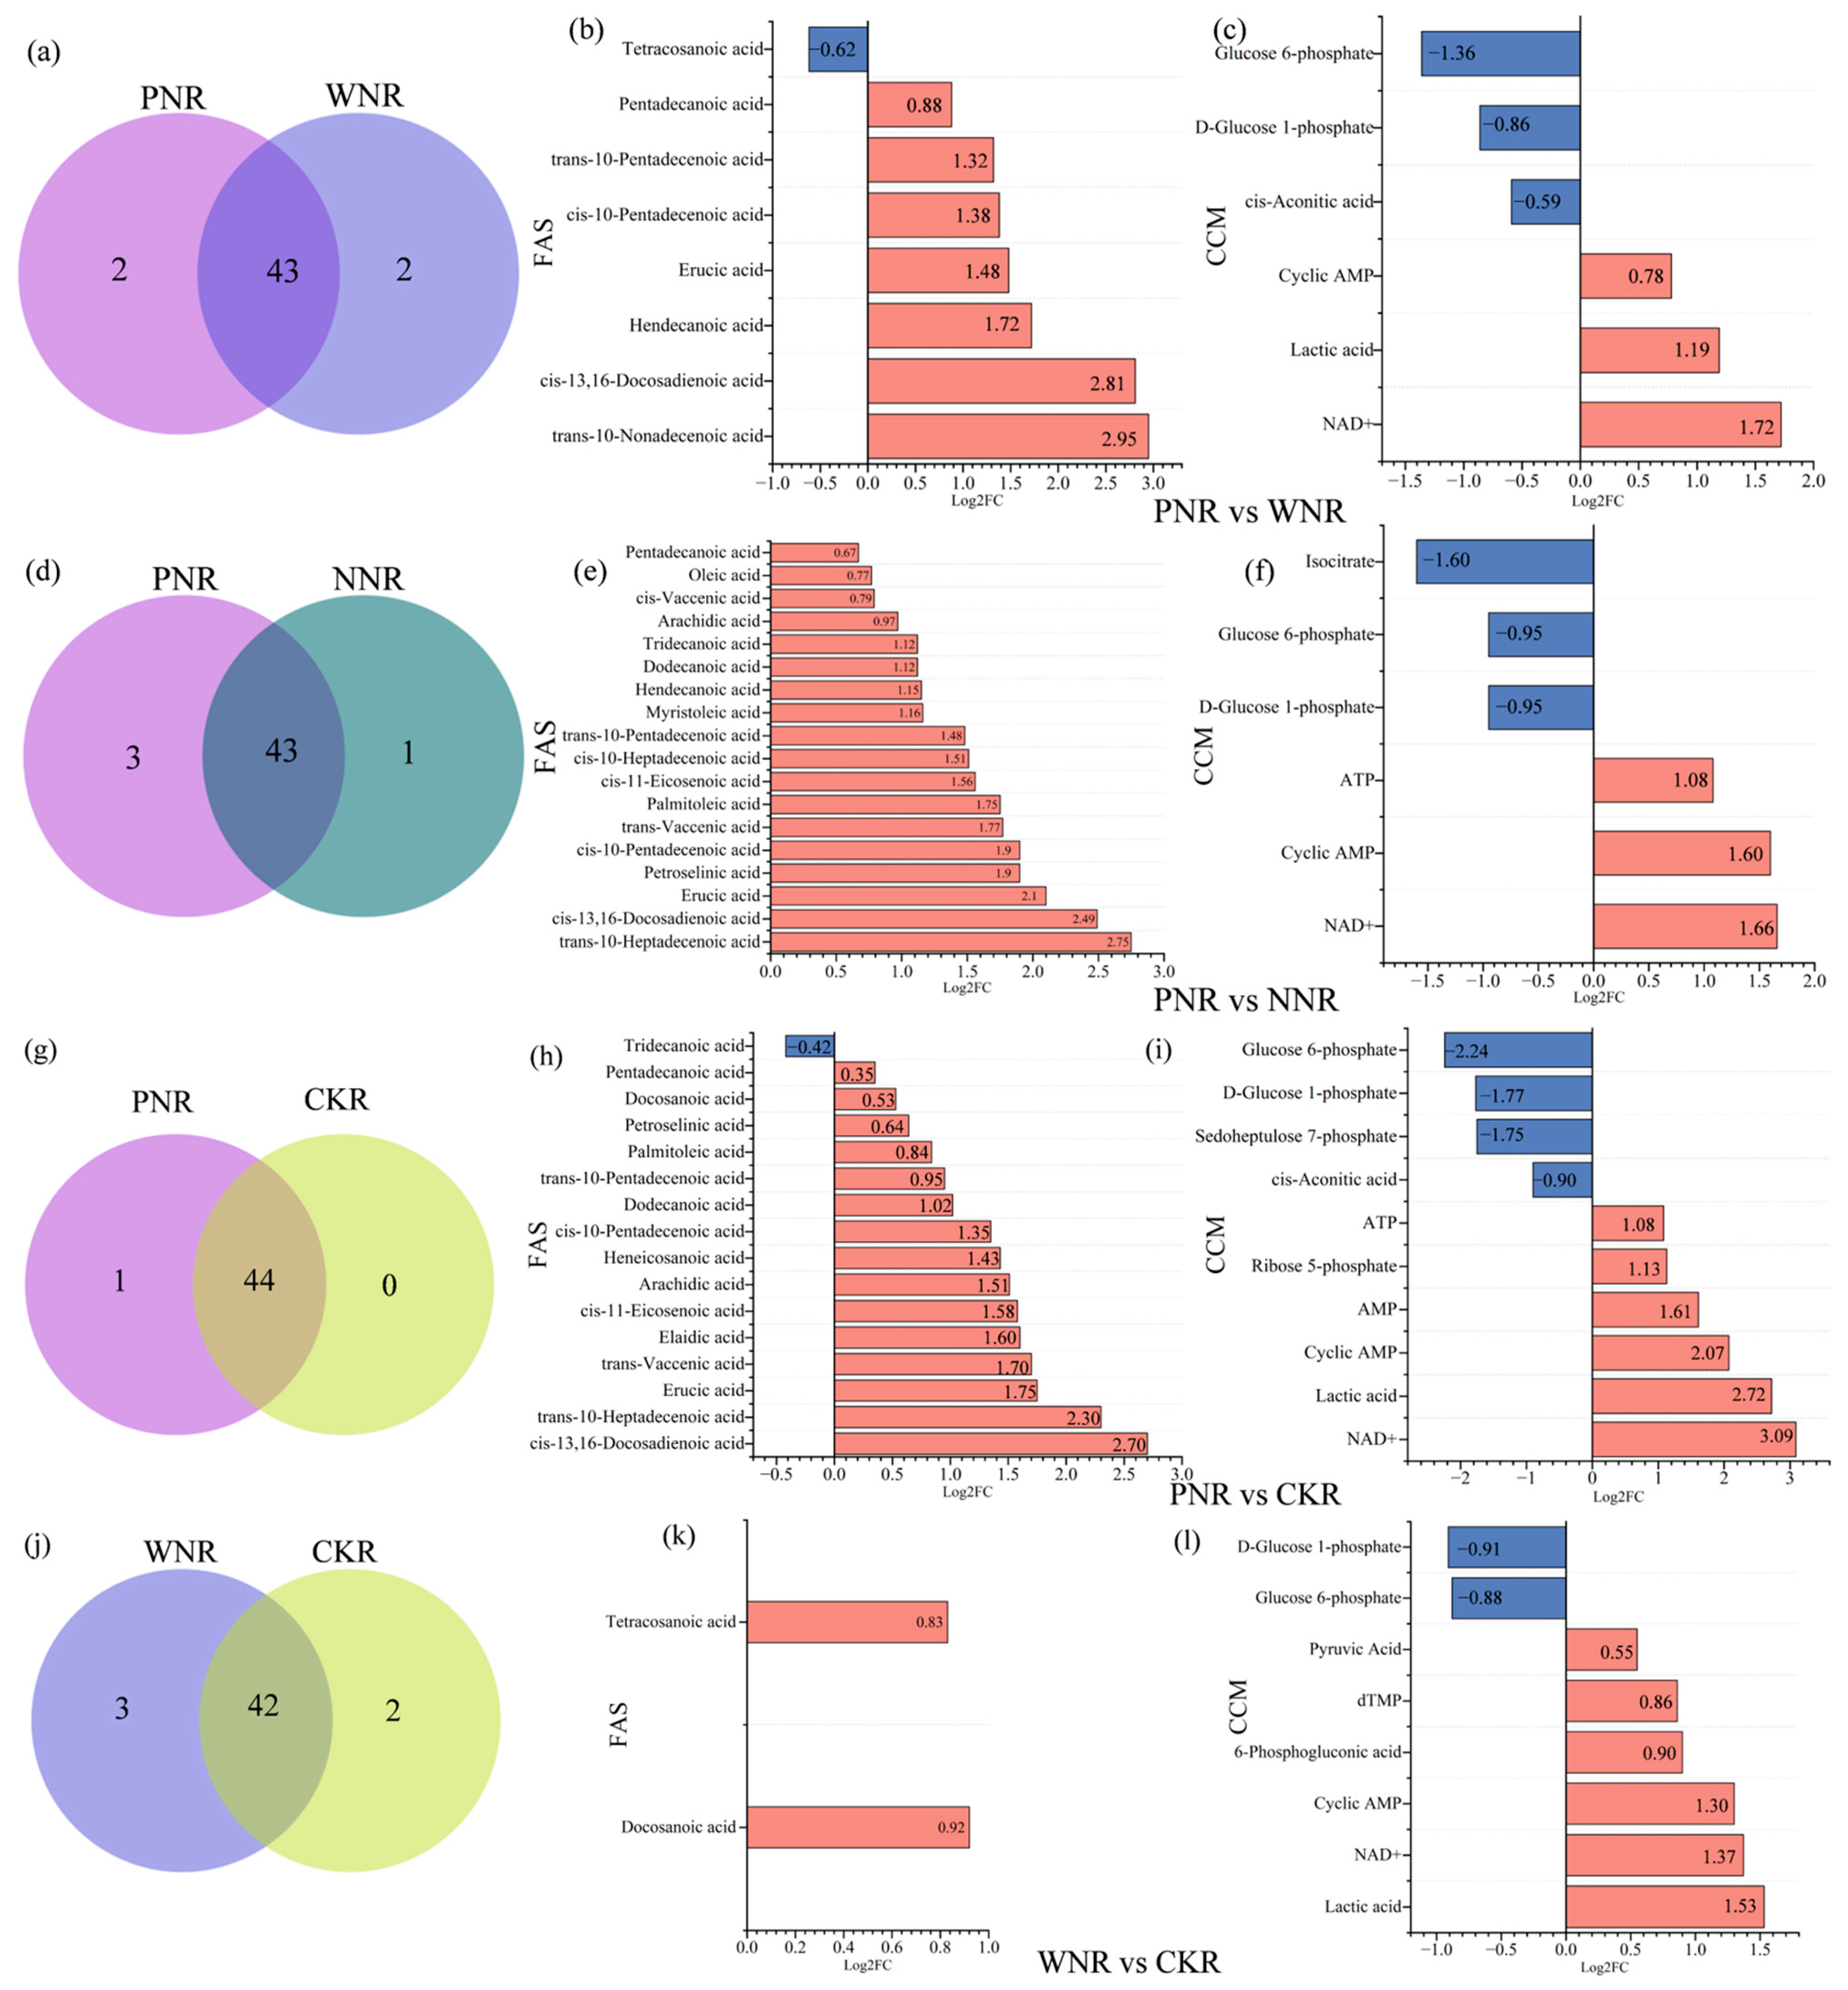
3.5.4. Differences in Root and Nodule Metabolism

We found similarities in F.A. content among root and root nodule samples. For example, P.N. and PNR had 42 identical F.A.s, and W.N. and WNR had 43 identical F.A.s (Figure 11a,d). The total F.A. content of P.N. was 1.89 times that of PNR, whereas the content of W.N. was only 84.2% of that of WNR. The P.N. vs. PNR group comparison showed 13 different F.A.s, all of which were upregulated, with trans-10-nonadecenoic acid being the most upregulated. The P.N. vs. PNR group comparison showed five differentially produced F.A. metabolites, two of which were upregulated. The most upregulated metabolite was trans-10-nonadecenoic acid. Furthermore, this comparison revealed three downregulated metabolites, the most strongly downregulated of which was tetra-decanoic acid (Figure 11b). Next, the W.N. vs. WNR group comparison identified 24 F.A. differentially produced metabolites, 23 of which were upregulated. Tetradecanoic acid was the most strongly upregulated, and the only downtegulated metabolite was brassidic acid (Figure 11c).
Regarding central carbon metabolites, we found that P.N. had significantly higher levels of PEP, AMP, ATP, sedoheptulose 7-phosphate, GDP, and NAD+ relative to PNR. Conversely, PNR had significantly higher levels of lactic acid and pyruvate than P.N. Additionally, W.N. had significantly higher levels of 6-phosphogluconic acid, succinate, 7-phosphoheptose, and NAD+ than WNR. However, the content of isocitrate, PEP, and cis-aconitic acid in WNR was significantly higher than in W.N. Furthermore, the content of PEP in WNR was 12.32 times higher than in W.N. During the P.N. vs. PNR group comparison, we identified four differentially produced central carbon metabolites, two of which were upregulated, and the most upregulated metabolite of which was succinate. Conversely, two metabolites were downregulated, with cis-aconitic acid showing the strongest downregulation (Figure 11c). Finally, the W.N. vs. WNR group comparison exhibited five differentially produced central carbon metabolites, of which three were upregulated, including the most upregulated, lactic acid. Conversely, glucose 6-phosphate showed the lowest level of expression (Figure 11d).

3.6. Differences in F.A. Metabolism between Rhizobia and Symbiotic Plants

S. meliloti LL11 was found to have 40 detectable F.A.s. A comparison of F.A. metabolites between rhizobia LL11 and symbiotic plants revealed that LL11 and P.N. shared the most F.A. species (37) in common, whereas LL11 and I.L. shared the least (only 33). Next, when comparing rhizobia strain LL11 with various plant parts, we found that this strain contained 11 unique F.A.s, including myristelaidic acid, decanoic acid, and caprylic acid. Conversely, other parts of the plant contained hexadecenoic acid, trans-11-eicosenoic acid, petroselaidic acid, and 14 other F.A.s (Figure S1).

3.7. Differences in F.A. and Central Carbon Changes between Symbiotic and C.K. Plants

The total central carbon metabolite content was significantly higher than the total F.A. metabolite content in the tissues of symbiotic and C.K. plants (Figure 10b). Based on observable differences in the root and nodule types of symbiotic plants, three types of energy use systems can be identified, i.e., I.L.–I.S.–PNR–P.N., I.L.–I.S.–WNR–W.N., and I.L.–I.S.–NNR. C.K. plants had a CKL–CKS–CKR energy utilization system (Figure 12a,d).
By analyzing differences in total metabolite content across various tissues within the same energy system, we discovered that for each of the three symbiotic energy utilization systems, the content of F.A. metabolites in I.S. was 42.8% lower than in I.L. Additionally, the central carbon metabolite content increased by only 2.42% compared to I.L. For example, the concentration of central carbon metabolites in I.L. was 15.71 times higher than it was for F.A. metabolites, which was 28.13 times higher in I.S. Within I.L.–I.S.–PNR–P.N., the highest concentration of carbon metabolites was found in the center of PNR at 40.95%, which was 26.3% higher than P.N. and 31.07 times higher than the total F.A. metabolite concentration. We also found that P.N. had the highest overall F.A. metabolite content (i.e., 548,932.5128 ng·g−1), which accounted for 35% of total content, and was 88.63% higher than that of PNR. Conversely, the central carbon metabolite content of P.N. was only 12.14 times that of F.A. metabolites.
In I.L.–I.S.–WNR–W.N., we found that I.L. had the highest F.A. metabolite content (36.28%) and W.N. had the lowest (19.64%). I.S. had the highest central carbon metabolite content (26.69%), whereas WNR had the lowest (22.57%). The content of F.A. metabolites was 9.33% higher in W.N. relative to WNR, whereas the central carbon metabolite content of W.N. was 15.82% lower than WNR. Next, the results of the ‘I.L.–I.S.–NNR’ experiment showed that the tissue with the highest total F.A. metabolite content was I.L., and here it accounted for 46.30% of the total content. Conversely, NNR had the highest total central carbon metabolite content, where it accounted for 41.14% of total content. Moreover, the central carbon metabolite content of NNR was 37.81 times higher than that of F.A. metabolites, and this difference was the largest in I.L.–I.S.–NNR (Figure 12a–c).
Next, in CKL–CKS–CKR, we found that CKS had both the highest F.A. and central carbon metabolite contents, accounting for 38.91% and 48.35% of C.K. plants, respectively. The total F.A. metabolite content of CKS samples was approximately 1.87 times that of CKL and CKR, and the total central carbon metabolite content was approximately 1.35 times that of CKL and CKR (Figure 12d–f).

4. Discussion

4.1. Effects of Rhizobia Inoculation on Plant Biomass, Nodules, Nitrogen Fixation, and Key Enzymes Related to Nitrogen Metabolism

Legume plants and rhizobia have specific interactions. Efficient nitrogen fixation can only occur when the two function symbiotically. This prompts plants to improve nitrogen utilization, thereby enhancing plant yield and quality [27,28,29]. Here, inoculation with S. meliloti LL11 caused improvement in the overall growth of alfalfa plants and the development of dark green leaves. Conversely, the dwarf leaves of C.K. plants remained yellow. We also found that the nodulation and nitrogen fixation capacity, plant height, root length, aboveground fresh and dry weight, and underground fresh and dry weight of symbiotic plants were significantly higher than in C.K. plants. Additionally, we found that the aboveground dry weight of symbiotic plants was 123.67% higher than C.K. plants, indicating that inoculation promotes growth and increased biomass accumulation in rhizobia-associated alfalfa [30,31].
Nitrogen metabolism is an important physiological process for plants, and requires the participation of many enzymes, including N.R., NiR, G.S., and GOGAT. N.R. and NiR catalyze the reduction of NO3 to NH4+, whereas G.S. and GOGAT are involved in ammonia assimilation. N.R. and NiR are present in both roots and leaves, but exhibit higher activity in roots [32]. G.S. is widely distributed throughout many tissues, but its activity is also much higher in roots than in leaves [33]. There are two types of GOGAT: Fd-GOGAT mainly exists in green tissues, whereas NADH-GOGAT mainly exists in non-green tissues [34]. In this study, we found that the activities of four nitrogen metabolism enzymes in symbiotic plants were significantly higher than in C.K. plants, a finding that is consistent with previous studies [35]. It is, therefore, evident that following the inoculation of rhizobia, plants expedite nitrogen utilization via enhancing the activity of enzymes related to nitrogen metabolism. Here, we found that the activity of Fd-GOGAT was higher than that of NADH-GOGAT, possibly because plant leaves produce more NH4+ via photorespiration, and NH4+ requires assimilation to be catalyzed by Fd-GOGAT [36]. We also found no significant difference in NiR activity between leaves and roots. However, the activities of N.R. and G.S. in roots were significantly higher than in leaves. This difference may be due to the presence of nitrogen fixation nodules on the roots. Plants require nitrogen to be supplied following nitrogen fixation by bacteroids in nodules, which results in the accumulation of both untransformed nitrogen and transformed ammonia in roots. To optimize the use of these substances, plants must enhance the activity of N.R. and G.S. to facilitate nitrogen transformation and ammonia assimilation.

4.2. Differences in Energy Metabolism among Different Tissues

4.2.1. Differences in Central Carbon Metabolites

D-glucose is broken down into other metabolites during CCM to provide energy [37]. This process includes EMP, TCA, and PPP. CCM in plants is closely related to other metabolic processes, including F.A. and amino acid metabolism. These metabolic pathways coordinate with each other to contribute to plant growth and development.
We found that the total central carbon metabolite content was 2.61 times higher in symbiotic plants than in C.K. plants. Moreover, among the tissues of symbiotic plants, PNR had the highest central carbon metabolite content, whereas W.N. and WNR had the lowest. In comparison, CKS had the highest central carbon metabolite content in C.K. plants. During symbiotic nitrogen fixation, plants convert photosynthetic products into D-glucose. This is then decomposed into dicarboxylic acid, mainly malate, via the TCA to supply bacteroids and maintain symbiotic nitrogen fixation. For this reason, in this study, we focused on D-glucose, dicarboxylic acid, and the related central carbon metabolites that are involved in the TCA in nodules.
The D-glucose content of the leaves, stems, and roots of symbiotic and C.K. plants varied, but not to a high degree. For example, the content of D-glucose in I.L. and I.S. was higher than in CKL and CKS, but this difference was not significant. Moreover, the D-glucose content of I.S. and CKS was slightly higher than in I.L. and CKL. This is because symbiotic plants absorb nitrogen from the atmosphere via nitrogen fixation. Additionally, the dark green leaves of the plants enhance photosynthesis, resulting in the accumulation of more photosynthetic products. Conversely, due to the lack of nitrogen, the leaves of C.K. plants turned yellow, which weakens photosynthesis and reduces the accumulation of photosynthetic products. Furthermore, leaves produce organic matter via photosynthesis, and these products are then transported to other plant tissues via stems. Here, we found that D-glucose levels differed between leaves and stems.
Plants supply photosynthetic products to nodules via the roots. In P.N., a highly energy consuming nitrogen fixation reaction is required. Conversely, there is no nitrogen fixation reaction in the W.N., but metabolites are required to maintain tissue health and facilitate growth. There are no nodules on the NNR, and its energy consumption is low. Here, the D-glucose content in roots was highest in the NNR, followed by the WNR and PNR. After entering a nodule, D-glucose participates in the TCA. Except for the higher pyruvate content found in W.N. relative to P.N., the content of all other central carbon metabolites involved in the TCA are higher in P.N. than in W.N. This is due to the scale of nitrogen fixation reactions in P.N., where pyruvate, an important participant in TCA, is consumed in large quantities. Conversely, W.N. does not undergo the same degree of nitrogen fixation, which results in a slower rate of pyruvate consumption and, subsequently, a lower TCA production. The concentration of dicarboxylic acids, such as malate and succinate, is also higher in P.N. than in W.N. Taken together, these findings support the conclusion that dicarboxylic acid, mainly malate, provides energy for symbiotic nitrogen fixation.

4.2.2. Differences in F.A. Metabolite Abundance

Rhizobia are generally rich in F.A.s. The strain QHCD22 of Vicia faba and the related rhizobial species Agrobacterium tumefaciens have high palmitoleic acid content [38]. In one study, the wild-type ANU843 strain of Leguminosaturn biovar trifolii was found to contain isooleic acid as the most abundant F.A., followed by palmitoleic acid, hexadecenoic acid, cis-11,14,17-eicosatrienoic acid, and arachidic acid [39]. The same study found that S. meliloti LL11 had higher levels of hexadecenoic acid and palmitoleic acid, followed by trans-10-heptadecenoic acid, tetradecanoic acid, and oleic acid.
Here, the four most abundant F.A.s found in both symbiotic and C.K. plants were cis-11,14,17-eicosatrienoic acid, hexadecenoic acid, α-linolenic acid, and linoleic acid. However, we also found that their relative abundances varied among tissues. These results are consistent with those of Liao [40] and Fan [41], who found that alfalfa leaves had the highest content of hexadecenoic acid, cis-11,14,17-eicosatrienoic acid, oleic acid, linoleic acid, and linolenic acid. Because leaves are the primary site of photosynthesis, they are expected to have higher nutrient content than stems, and F.A.s are a primary product of photosynthesis [42]. We also found that the total F.A. content of I.L. was significantly higher than CKL, whereas I.S.’s total F.A. content was lower than CKS. These differences may be due to the slower growth of C.K. plants, which results in a gentler degree of cell division. As a result, the F.A.s produced in stems are not used and, therefore, accumulate. Due to the growth requirements of symbiotic plants, they produce various types of cells in large quantities and this process can require the transportation of many types of nutrients. A significant proportion of F.A.s in I.S. are either used to create biofilms or are consumed, leading to reduced accumulation.
The roots are the primary site for nodule attachment, and rhizobia are heterotrophic aerobic strains of bacterial symbionts. In general, host plants transport energy substances to support nodule growth and rhizobia reproduction in nodules via the roots. However, the different functions of P.N. and W.N. cause a distinction between PNR and WNR. Following inoculation with rhizobia, significant differences in the content of tetracosanoic acid, α-linolenic acid, lauric acid, and tetradecanoic acid have been observed in soybean roots [43,44]. However, earlier studies did not perform a difference analysis of the F.A.s found in roots associated with different types of nodules. The total F.A. content of PNR was found to be significantly higher than the other three types of roots. Moreover, among the 40 F.A.s shared by all four types of roots, all F.A.s, except cis-11,14,17-eicosatrienoic acid, were found to be more abundant in PNR than in the other three types of roots.
P.N. use the energy plants provided for nitrogen fixation, whereas white nodules consume energy to maintain growth without engaging in nitrogen fixation. The most abundant F.A.s in soybean P.N. are hexadecenoic acid, oleic acid, linoleic acid, and linolenic acid [5]. We found that both P.N. and W.N. contained hexadecenoic acid, linoleic acid, α-linolenic acid, cis-11,14,17-eicosatrienoic acid, and oleic acid, which is consistent with previous studies. We also found that the total F.A. content of P.N. was three times higher than W.N. Moreover, the most abundant F.A. in P.N. was trans-10-nonadecenoic acid, which was 245.16 times more abundant than it was in W.N. The high concentration of F.A.s in P.N. may be necessary for cell membrane growth during bacterial expansion. However, it is unclear whether F.A.s also serve other purposes. Furthermore, P.N. contains a higher proportion of unsaturated F.A.s than W.N., although both may enhance membrane fluidity [45]. In P.N. vs. W.N. and P.N. vs. PNR, decanoic acid, palmitelaidic acid, and petroselaidic acid were all specific fatty acids in PN. We found that the content of decanoic acid was relatively low, while the content of palmitelaidic acid and petroselaidic acid was relatively high. This seems to indicate that more anti-palmititelaidic acid and petroselaidic acid may be involved in symbiotic nitrogen fixation, providing a prerequisite material or energy for symbiotic nitrogen fixation. In W.N. vs. WNR, there is no specific fatty acid in W.N., which is a very interesting phenomenon, which may be closely related to the absence of nitrogen fixation in W.N. However, the specific role of these three fatty acids unique to P.N.in the symbiotic nitrogen fixation process has not been reported, which requires further research to determine.

4.2.3. Differences in F.A. and Central Carbon Content between Symbiotic and C.K. Plants

In this study of symbiotic plants, the central carbon metabolite abundance found in different plant parts were found to be in the following order: PNR > NNR > P.N. > I.S. > I.L. > W.N. > WNR. Similarly, F.A. metabolites were found to be in the order: P.N. > I.L. > PNR > WNR > NNR > I.S. > W.N. This order agrees with previous findings; for example, IL requires several precursors for various complex physiological reactions, and F.A.s can be used as raw materials for the synthesis of many important biomolecules. This may explain the presence of up to 16.72% F.A. metabolites in I.L. Additionally, the primary function of I.S. is to transport water and nutrients. This ensures that nutrients are distributed evenly and do not accumulate to excessive amounts in the I.S. In the I.L.–I.S.–PNR–P.N. energy utilization system, P.N. is the main site of symbiotic nitrogen fixation and requires a significant amount of energy. The reproduction and differentiation of free rhizobia and bacteroids in P.N. also requires energy. Host plants transport central carbon metabolites to the P.N. via the PNR.to facilitate symbiotic nitrogen fixation. However, P.N. has limited capacity to absorb and utilize these metabolites. Therefore, only a portion of the metabolites enter P.N., resulting in the accumulation of excess metabolites in PNR. Furthermore, this phenomenon is known to follow a logistic relationship. When the energy of the system reaches a saturation period, the energy input naturally decreases. F.A. metabolites were distributed in 28.82% of the P.N., and are presumably connected to the nitrogen fixation reactions occurring in P.N. Nitrogen fixation is a complex physiological process that involves frequent communication between various substances. Biofilms, which are synthesized and decomposed in large quantities, play an important role in this process, as they are mainly composed of F.A.s. F.A.s are the second most important energy source after D-glucose. β-oxidation can produce a large amount of energy, and is, therefore, essential for the stable operation of symbiotic nitrogen fixation and the growth and reproduction of rhizobia in P.N.
In the I.L.–I.S.–WNR–W.N. energy utilization system, some rhizobia manipulate host plants to produce W.N. Although W.N. sites do not fix nitrogen, they still require energy to grow. In general, host plants reduce the energy allocated to W.N. via enacting ‘sanctions’, which slow down the frequency of CCM in the W.N. and reduce the central carbon metabolite content [46,47]. The low central carbon metabolite content found in the WNR may be related to the high demand for W.N., resulting in many central carbon metabolites being transported to W.N., which can absorb many nutrients produced by host plants. Once the energy demand for growth and reproduction is met, the demand for F.A. metabolites will decrease. Furthermore, in the I.L.–I.S.–NNR energy utilization system, even though the NNR has no nodules, it can be used as a ‘reservoir’ for plant energy storage. It, therefore, accumulates central carbon metabolites to provide energy for other physiological activities. However, the level of physiological activity in NNR may be relatively low; therefore, F.A. metabolites do not accumulate excessively.
Overall, the distribution of F.A.s and central carbon metabolites in C.K. plants differed significantly from the distribution observed in symbiotic plants. In the ‘CKL–CKS–CKR’ energy utilization system, F.A.s and central carbon metabolites were predominantly present in CKS. Conversely, CKL, which acts as a ‘source’, produces fewer total photosynthetic products. However, to facilitate its own growth and development, plants still transport most F.A.s and central carbon metabolites to CKS and other tissues with greater demand for growth and development. CKR, therefore, acts as a ‘bank’ for energy storage and accumulates only a small portion of total available metabolites.

5. Conclusions

The inoculation of S. meliloti LL11 significantly increased the biomass, nodulation, and nitrogen fixation capacity of alfalfa plants. Additionally, the activities of key enzymes involved in nitrogen metabolism were enhanced, both in leaves and roots. Moreover, we found that S. meliloti LL11 contained 32 central carbon metabolites and 40 F.A. metabolites, with the highest levels of 6-phosphogluconic acid and hexadecenoic acid. Among the tissues of symbiotic plants, P.N. showed the highest abundance of central carbon metabolites (28 species) and F.A. metabolites (46 species). PNR had the highest total central carbon metabolite content (9,043,219.646 ng·g−1), whereas P.N. had the highest total F.A. metabolite content (549,223.5625 ng·g−1). In C.K. plants, CKR showed the greatest variety of F.A. metabolites (44 species), whereas CKS had the greatest variety of central carbon metabolites (22 species). CKS also showed the highest total combined content of central carbon and FA metabolites, with a total F.A. metabolite content of 235,750.3161 ng·g−1 and a total central carbon metabolite content of 7,802,451.318 ng·g−1. We also observed differences in fatty acid and central carbon metabolites among different tissues. Within the I.L.–I.S.–PNR–P.N. and I.L.–I.S.–NNR energy systems, a decline in F.A. metabolites corresponds to an increase in central carbon metabolites, and vice versa. Conversely, in the I.L.–I.S.–WNR–W.N. and CKL–CKS–CKR energy systems, the pattern of alterations in both fatty acid and central carbon metabolite contents of specific tissues were consistent. In general, these differences highlight the unique regulatory mechanisms of energy use systems in different plants and show that symbiotic relationships and environmental growth may influence them conditions. The metabolic process of symbiotic plants is highly complex, and the transfer and use of central carbon metabolites play a crucial role. To ensure a sufficient energy supply for symbiotic nitrogen fixation, symbiotic plants must effectively transport central carbon metabolites via PNR to P.N. However, the usage capacity of P.N. is limited, and can lead to the concentration of these metabolites mainly in PNR. It is worth noting that within P.N., F.A. metabolites are the major metabolic molecule class due to the substantial metabolic demands of nitrogen fixation. In particular, the metabolite petroselaidic acid is unique to P.N., which suggests its potential importance for nitrogen fixation. However, the precise mechanism of action by which petroselaidic acid acts remains unclear and, therefore, warrants further research. Additionally, we found that the distribution of central carbon and F.A. metabolites differed in C.K. plants due to the absence of nitrogen fixation. These metabolites are primarily allocated to CKS, and provide C.K. plants with the essential energy and nutrients required for growth. Taken together, our results show significant differences in the distribution and use of central carbon and FA metabolites between symbiotic and C.K. plants. These differences reflect the uniqueness and complexity of different growth and metabolic processes of plants, and provide a rich exploration space for improving the efficiency of the symbiotic system. This study, therefore, provides a solid theoretical foundation for improving the efficiency of symbiotic nitrogen fixation via the improvement of the dialog between alfalfa and rhizobia.

Supplementary Materials

The following supporting information can be downloaded at: https://www.mdpi.com/article/10.3390/agronomy14030511/s1, Figure S1: Venn diagram showing species differences between Sinorhizobium meliloti LL11 and various symbiotic plant parts; Table S1. Original fatty acid test results. Table S2. Central carbon raw test results

Author Contributions

Conceptualization, B.-F.L., S.-L.S. and W.-J.K.; methodology, B.-F.L.; software, B.-F.L.; validation, B.-F.L.; formal analysis, B.-F.L., S.-L.S. and W.-J.K.; investigation, J.G., F.J., and B.W.; resources, S.-L.S. and W.-J.K.; data curation, B.-F.L.; writing—original draft preparation, B.-F.L.; writing—review and editing, B.-F.L., S.-L.S., and W.-J.K.; visualization, S.-L.S. and W.-J.K.; supervision, S.-L.S. and W.-J.K.; project administration, S.-L.S. and W.-J.K.; funding acquisition, S.-L.S. and W.-J.K. All authors have read and agreed to the published version of the manuscript.

Funding

This study was supported by the Open project of Key Laboratory of Grassland Ecosystem,Ministry of Education (KLGE-2022-01), Gansu Provincial Science and Technology Project “Innovation and Breeding of Important Native Grass and Forage Germplasm in Gansu”(23ZDKA013) and the National Natural Science Founda-tion of China “Study on the Regulation and Response Mechanism of Alfalfa NCRs on the Synthesis of Rhizobium Surface Polysaccharides” (Project No.: 32101427).

Data Availability Statement

The data presented in this study are available on request from the corresponding authors.

Acknowledgments

We thank the College of Pratacultural Science at Gansu Agricultural University and the Key Laboratory of Pratacultural Ecosystems of the Ministry of Education for providing support for our experimental platform.

Conflicts of Interest

The authors declare no conflict of interest.

References

  1. Medina, C.A.; Kaur, H.; Ray, I.; Yu, L.X. Strategies to Increase Prediction Accuracy in Genomic Selection of Complex Traits in Alfalfa (Medicago sativa L.). Cells 2021, 10, 3372. [Google Scholar] [CrossRef] [PubMed]
  2. Haag, A.F.; Arnold, M.F.; Myka, K.K.; Kerscher, B.; Dall’Angelo, S.; Zanda, M.; Mergaert, P.; Ferguson, G.P. Molecular insights into bacteroid development during Rhizobia—Legume symbiosis. FEMS Microbiol. Rev. 2013, 37, 364–383. [Google Scholar] [CrossRef] [PubMed]
  3. Booth, N.J.; Smith, P.M.C.; Ramesh, S.A.; Day, D.A. Malate Transport and Metabolism in Nitrogen-Fixing Legume Nodules. Molecules 2021, 26, 6876. [Google Scholar] [CrossRef] [PubMed]
  4. diCenzo, G.C.; Tesi, M.; Pfau, T.; Mengoni, A.; Fondi, M. Genome-scale metabolic reconstruction of the symbiosis between a leguminous plant and a nitrogen-fixing bacterium. Nat. Commun. 2020, 11, 2574. [Google Scholar] [CrossRef]
  5. Zhang, G.; Ahmad, M.Z.; Chen, B.; Manan, S.; Zhang, Y.; Jin, H.; Wang, X.; Zhao, J. Lipidomic and transcriptomic profiling of developing nodules reveals the essential roles of active glycolysis and fatty acid and membrane lipid biosynthesis in soybean nodulation. Plant J. 2020, 103, 1351–1371. [Google Scholar] [CrossRef]
  6. Oldroyd, G.E.; Murray, J.D.; Poole, P.S.; Downie, J.A. The rules of engagement in the legume-rhizobial symbiosis. Annu. Rev. Genet. 2011, 45, 119–144. [Google Scholar] [CrossRef]
  7. Masson-Boivin, C.; Sachs, J.L. Symbiotic nitrogen fixation by rhizobia-the roots of a success story. Curr. Opin. Plant Biol. 2018, 44, 7–15. [Google Scholar] [CrossRef]
  8. Sulieman, S.; Tran, L.S. Symbiotic nitrogen fixation in legume nodules: Metabolism and regulatory mechanisms. Int. J. Mol. Sci. 2014, 15, 19389–19393. [Google Scholar] [CrossRef]
  9. Yang, J.; Liu, C.W.; Li, X. Advances in the legume–rhizobia symbiosis. Plant Physiol. J. 2023, 59, 1407–1435. [Google Scholar] [CrossRef]
  10. Wang, D.; Dong, W.; Murray, J.; Wang, E. Innovation and appropriation in mycorrhizal and rhizobial Symbioses. Plant Cell 2022, 34, 1573–1599. [Google Scholar] [CrossRef]
  11. Jiang, Y.; Wang, W.; Xie, Q.; Liu, N.; Liu, L.; Wang, D.; Zhang, X.; Yang, C.; Chen, X.; Tang, D.; et al. Plants transfer lipids to sustain colonization by mutualistic mycorrhizal and parasitic fungi. Science 2017, 356, 1172–1175. [Google Scholar] [CrossRef]
  12. Keymer, A.; Gutjahr, C. Cross-kingdom lipid transfer in arbuscular mycorrhiza symbiosis and beyond. Curr. Opin. Plant Biol. 2018, 44, 137–144. [Google Scholar] [CrossRef]
  13. Luginbuehl, L.; HMenard, G.N.; Kurup, S.; Van Erp, H.; Radhakrishnan, G.V.; Breakspear, A.; Oldroyd, G.E.D.; Eastmond, P.J. Fatty acids in arbuscular mycorrhizal fungi are synthesized by the host plant. Science 2017, 356, 1175–1178. [Google Scholar] [CrossRef] [PubMed]
  14. de Carvalho, C.C.C.R.; Caramujo, M.J. The Various Roles of Fatty Acids. Molecules 2018, 23, 2583. [Google Scholar] [CrossRef] [PubMed]
  15. Peng, J.L. Study Mesorhizobia Huakuii 7653R Bacteroid Differentiation and Nitrogen Fixation Mechanism Based Global Transcriptomr Analysis. Ph.D. Thesis, Huazhong Agricultural University, Wuhan, China, 2014. [Google Scholar]
  16. Dai, J. Involvement of Utilization of the Plant-Derived Sugars and Lipids and the Protease CSE1 in the Symbiotic Interactions between Metarhizium Robertsii and Plants. Ph.D. Thesis, Zhejiang University, Hangzhou, China, 2022. [Google Scholar] [CrossRef]
  17. Xu, H.; Li, Z.; Tong, Z.; He, F.; Li, X. Metabolomic analyses reveal substances that contribute to the increased freezing tolerance of alfalfa (Medicago sativa L.) after continuous water deficit. BMC Plant Biol. 2020, 20, 15. [Google Scholar] [CrossRef] [PubMed]
  18. Lin, J.; Frank, M.; Reid, D. No Home without Hormones: How Plant Hormones Control Legume Nodule Organogenesis. Plant Commun. 2020, 1, 100104. [Google Scholar] [CrossRef] [PubMed]
  19. Dong, X.; Chen, W.; Wang, W.; Zhang, H.; Liu, X.; Luo, J. Comprehensive profiling and natural variation of flavonoids in rice. J. Integr. Plant Biol. 2014, 56, 876–886. [Google Scholar] [CrossRef]
  20. Lv, H.; Guo, S. Comparative analysis of flavonoid metabolites from different parts of Hemerocallis citrina. BMC Plant Biol. 2023, 23, 491. [Google Scholar] [CrossRef] [PubMed]
  21. Gao, M.; Cao, X.; Wei, S.; Huang, X.; Ouyang, H.; Chang, Y.; Shi, R.; He, J. Quantitative Comparison and Chemical Profile of Different Botanical Parts of Panax notoginseng from Different Regions. Front. Nutr. 2022, 9, 841541. [Google Scholar] [CrossRef]
  22. Wang, L.; Zhou, W.; Liu, C.; Chen, P.; Zhou, L. Study on the accumulation pattern of anthocyanins, sugars and organic acids in medicinal Vitis vinifera ‘SuoSuo’ during ripening. Food Chem. 2024, 433, 137294. [Google Scholar] [CrossRef]
  23. He, L.; Shi, S.L.; Kang, W.J.; Liu, C.C.; Wang, W.J.; Wu, B. Location and Sterilization of Endogenous Rhizobia in Alfalfa Seeds. Acta Sgrestia Sin. 2022, 30, 2892–2898. [Google Scholar]
  24. Kang, W.J.; Lu, B.F.; Guan, J.; He, L.; Liu, C.C.; Nan, P.; Ma, R.H. A Hydroponic Device That Is Easy to Move and Observe the Nodulation Status of Alfalfa Roots. Patent CN202222289363.4, 14 March 2023. [Google Scholar]
  25. Wang, S.Q.; Han, X.Z.; Qiao, Y.F.; Yan, J.; Li, X.H. Effects of low molecular organic acids on nitrogen accumulation, nodulation, and nitrogen fixation of soybean (Glycine max L.) under phosphorus deficiency stress. Chin. J. Appl. Ecol. 2009, 20, 1079–1084. [Google Scholar] [CrossRef]
  26. Zuo, Y.M.; Liu, Y.X.; Zhang, F.S. Effects of Improvement of Iron Nutrition by Mixed Cropping with Maize on Nodule Microstructure and Leghaemoglobin Content of Peanut. J. Plant Physiol. Mol. Biol. 2003, 29, 33–38. [Google Scholar]
  27. Basile, L.A.; Lepek, V.C. Legume-rhizobia dance: An agricultural tool that could be improved? Microb. Biotechnol. 2021, 14, 1897–1917. [Google Scholar] [CrossRef] [PubMed]
  28. Hu, Y.; Chen, Y.; Yang, X.; Deng, L.; Lu, X. Enhancing Soybean Yield: The Synergy of Sulfur and Rhizobia Inoculation. Plants 2023, 12, 3911. [Google Scholar] [CrossRef] [PubMed]
  29. Allito, B.B.; Ewusi-Mensah, N.; Logah, V.; Hunegnaw, D.K. Legume-rhizobia specificity effect on nodulation, biomass production and partitioning of faba bean (Vicia faba L.). Sci. Rep. 2021, 11, 3678. [Google Scholar] [CrossRef] [PubMed]
  30. Zeng, Z.H.; Sui, X.H.; Hu, Y.G.; Chen, D.M.; Chen, W.X.; Gao, R.l. 3Screening of highly-effective Sinorhizobia meliloti strains for Medicago sativa cultivars and their field inoculation. Acta Prataculturae Sin. 2004, 13, 95–100. [Google Scholar]
  31. Li, S.S.; Yang, Z.; Li, H.; Yang, W.G.; Wang, X.L.; Chai, H.; Wu, Y. Effect of rhizobia inoculation on yield and quality of alfalfa. Heilongjiang Anim. Sci. Vet. Med. 2021, 20, 98–101+107. [Google Scholar] [CrossRef]
  32. Li, X.L.; Gao, D.S.; Mi, R.F. Study on the niteate reductase activity of apple trees in orchard. J. Shandong Agric. Univ. 1997, 3–6. [Google Scholar]
  33. Li, Y.; Ma, C.M.; Gong, Z.P. Study on glutamine synthetase activity in spring soybean. J. Northeast. Agric. Univ. 2006, 729–732. [Google Scholar] [CrossRef]
  34. Sun, F. Studies on Enzyme Activities of Nitrogen Metabolism and the Content of Nitrogen-Containing Compounds in Roots of Soybean Varieties Released at Different Age. Ph.D. Thesis, Jilin Agricultural University, Changchun, China, 2020. [Google Scholar] [CrossRef]
  35. Liu, S.X. Study on the Mechanism of Sinorhizobia Meliloti SD101 Improving Salt Tolerance of Alfalfa (Medicago sativa L.). Ph.D. Thesis, Heilongjiang Bayi Agricultural University, Heilongjiang, China, 2022. [Google Scholar] [CrossRef]
  36. Yoneyama, T.; Fujimori, T.; Yanagisawa, S.; Hase, T.; Suzuki, A. 15N Tracing Studies on In Vitro Reactions of Ferredoxin-Dependent Nitrite Reductase and Glutamate Synthase Using Reconstituted Electron Donation Systems. Plant Cell Physiol. 2015, 56, 1154–1161. [Google Scholar] [CrossRef] [PubMed]
  37. Brechenmacher, L.; Lei, Z.; Libault, M.; Findley, S.; Sugawara, M.; Sadowsky, M.J.; Sumner, L.W.; Stacey, G. Soybean metabolites regulated in root hairs in response to the symbiotic bacterium Bradyrhizobia japonicum. Plant Physiol. 2010, 153, 1808–1822. [Google Scholar] [CrossRef] [PubMed]
  38. Li, P.; Teng, C.C.; Liu, Y.J.; Zhang, J.F.; Hou, W.W.; He, T.; Zhang, X.L.; Wang, J.Z. Identification of Vicia faba Rhizobia and drought resistance verification in arid region of Qinghai. Acta Microbiol. Sin. 2022, 62, 4030–4046. [Google Scholar] [CrossRef]
  39. Orgambide, G.G.; Huang, Z.H.; Gage, D.A.; Dazzo, F.B. Phospholipid and fatty acid compositions of Rhizobia leguminosarum biovar trifolii ANU843 in relation to flavone-activated pSym nod gene expression. Lipids 1993, 28, 975–979. [Google Scholar] [CrossRef] [PubMed]
  40. Liao, X.M. Cloning and Functional Analysis of FAD2 Gene Family of Artemisia sphaerocephala and Evaluation of Transgenic Alfalfa. Ph.D. Thesis, Lanzhou University, Lanzhou, China, 2021. [Google Scholar] [CrossRef]
  41. Fan, Q.; Creamer, R.; Li, Y. Time-course metabolic profiling in alfalfa leaves under Phoma medicaginis infection. PLoS ONE. 2018, 13, e0206641. [Google Scholar] [CrossRef] [PubMed]
  42. Gutiérrez, S.; Svahn, S.L.; Johansson, M.E. Effects of Omega-3 Fatty Acids on Immune Cells. Int. J. Mol. Sci. 2019, 20, 5028. [Google Scholar] [CrossRef]
  43. Ogden, A.J. Metabolic Progression during Development of Symbiotic Nitrogen Fixation in the Medicago-Sinorhizobia Symbiosis and the Role of HslUV and ClpXP Protease Machinery; Washington State University: Washington, DC, USA, 2018. [Google Scholar]
  44. Colebatch, G.; Desbrosses, G.; Ott, T.; Krusell, L.; Montanari, O.; Kloska, S.; Kopka, J.; Udvardi, M.K. Global changes in transcription orchestrate metabolic differentiation during symbiotic nitrogen fixation in Lotus japonicus. Plant J. 2004, 39, 487–512. [Google Scholar] [CrossRef]
  45. Théberge, M.C.; Prévost, D.; Chalifour, F.P. The effect of different temperatures on the fatty acid composition of Rhizobia leguminosarum bv. viciae in the faba bean symbiosis. New Phytol. 1996, 134, 657–664. [Google Scholar] [CrossRef]
  46. Ledermann, R.; Schulte, C.C.M.; Poole, P.S. How Rhizobia Adapt to the Nodule Environment. J. Bacteriol. 2021, 203, e0053920. [Google Scholar] [CrossRef] [PubMed]
  47. Westhoek, A.; Clark, L.J.; Culbert, M.; Dalchau, N.; Griffiths, M.; Jorrin, B.; Karunakaran, R.; Ledermann, R.; Tkacz, A.; Webb, I.; et al. Conditional sanctioning in a legume—Rhizobia mutualism. Proc. Natl. Acad. Sci. USA 2021, 118, e2025760118. [Google Scholar] [CrossRef] [PubMed]
Figure 1. Differences in plant height, root length, and dry and fresh weights both above and below ground. (a,b) show phenotypic differences between symbiotic and C.K. plants at 35 dpi. (c) shows plant height and root length differences between symbiotic and C.K. plants. (d,e) show differences in above- and belowground fresh and dry weight between symbiotic and C.K. plants. * indicates p < 0.05, denoting a statistically significant difference; *** indicates p < 0.001, denoting a highly statistically significant difference. This experiment involved symbiotic plants inoculated with rhizobia and a control group of uninoculated plants.
Agronomy 14 00511 g001
Figure 2. Changes in nodulation and nitrogen fixation capacity following rhizobial inoculation. (ac) show the nodulation and nodule size of symbiotic plants at 35 dpi; (d,e) show toluidine blue-stained sections of pink and white nodules.
Agronomy 14 00511 g002
Figure 3. Activities of GOGAT, G.S., NiR, and N.R. in the leaves and roots of symbiotic and C.K. plants. (a) Glu-tamate synthetase (GOGAT) activity in leaves and roots of symbiotic plants and C.K. plants; (b) is glutamine synthetase (G.S.) activity in leaves and roots of symbiotic plants and C.K. plants; (c) Nitrogen reductase (NiR) activity in leaves and roots of symbiotic plants and C.K. plants; (d) Nitrate reductase (N.R.) activity in leaves and roots of symbiotic plants and C.K. plants. * indicates p < 0.05, denoting a statistically significant difference; ** indicates p < 0.01, *** indicates p < 0.001, denoting a highly statistically significant difference.
Agronomy 14 00511 g003
Figure 4. 3D histogram of F.A. and central carbon metabolite content. Abundance is shown per species for symbiotic plants, C.K. plants, and Sinorhizobium meliloti LL11. (a) F.A. metabolites; (b) central carbon metabolites. The unit of measurement for F.A. content of plants was ng·g−1, whereas that of rhizobia was ng·mL−1. Specific detection information is shown in Table S1.
Agronomy 14 00511 g004
Figure 5. PCA and cluster heat maps showing the results of F.A.- and central carbon-targeted metabolomics analyses. (a,b) show PCA results for F.A. and central carbon metabolites for specific plant tissues. The X-axis represents the first principal component and the Y-axis represents the second principal component. Each point in the plot represents one sample. Samples from the same group are represented in the same color, and samples from different groups are represented as different colors. (c,d) show cluster heat maps for F.A. and central carbon metabolites.
Agronomy 14 00511 g005
Figure 6. Total F.A. content and relative abundance in the tissues of symbiotic and C.K. plants. (a) the total content and types of fatty acids in different tissues of symbiotic plants, C.K. plants, and S. meliloti LL11; (b) the abundance of various fatty acids in different tissues of symbiotic plants, C.K. plants, and S. meliloti LL11.
Agronomy 14 00511 g006
Figure 7. Differences in F.A. species abundance in leaves and stems. Venn diagram and bar charts depicting the profiles of differential metabolites are shown. The abscissa is the log2FC of the differential metabolites and the ordinate shows differential metabolite expression. Red represents upregulated differentially expressed metabolites, and blue represents downregulated differentially expressed metabolites. F.A.s, fatty acids; CCM, central carbon metabolism. Red represents downregulation and blue represent upregulation. (a,d) are the Venn diagrams of common fatty acids in I.L. vs. CKL and I.S. vs. CKS, respectively; (b,e) are the bar graphs of the number of up-and down-regulated fatty acid metabolites in I.L. vs. CKL, I.S. vs. CKS; (c,f) are the bar graphs of the number of up-and down-regulated carbon metabolites in the difference center of I.L. vs. CKL, I.S. vs. CKS.
Agronomy 14 00511 g007
Figure 8. Differences in root F.A. species, as revealed by Venn diagrams and differential metabolite expression bar charts. (a,d,g,j,m,p) are denoted as PNR vs. WNR, PNR vs. NNR, PNR vs. CKR, WNR vs. CKR, WNR vs. NNR and NNR vs. CKR identical fatty acid Venn diagram, respectively. (b,e,h,k,n,q) were expressed as PNR vs. WNR, PNR vs. NNR, PNR vs. CKR, WNR vs. CKR, WNR vs. NNR and NNR vs. CKR, respectively. (c,f,i,l,o,r) are respectively expressed as the number of up and down bars of carbon metabolites in PNR vs. WNR, PNR vs. NNR, PNR vs. CKR, WNR vs. CKR, WNR vs. NNR and NNR vs. CKR. Red represents downregulation and blue represent upregulation.
Agronomy 14 00511 g008aAgronomy 14 00511 g008b
Figure 9. Differences in F.A. species among root nodules, as visualized by a Venn diagram and metabolite bar charts. (a) is the Venn diagram of P.N. vs. W.N. common fatty acids; (b) is expressed as a bar chart of the number of up-and down-regulated fatty acid metabolites in P.N. vs. W.N.; (c) is expressed as a bar chart of the number of up-and down-regulated carbon metabolites in the P.N. vs. W.N. difference center. Red represents downregulation and blue represent upregulation.
Agronomy 14 00511 g009
Figure 10. P.N. and W.N. tricarboxylic acid cycle related metabolite content charts. (a) represents the metabolic differences related to the tricarboxylic acid cycle in P.N. vs. W.N.; (b) represents the difference in dicarboxylic acid metabolism between P.N. vs. W.N. * means p < 0.05, the difference is significant; ns indicates that the difference is not significant.
Agronomy 14 00511 g010
Figure 11. Differences in F.A. species among roots and nodules, as shown by Venn diagram and bar chart. (a,d) are Venn diagrams of common fatty acids in pn and PNR, wn and WNR, respectively; (b,e) are the bar graphs of the number of up-and down-regulated fatty acid metabolites in P.N. vs. PNR and W.N. vs. WNR; (c,f) are the bar graphs of the number of up-and down-regulated carbon metabolites in the difference center of P.N. vs. PNR and W.N. vs. WNR.
Agronomy 14 00511 g011
Figure 12. The total fatty acid and central carbon metabolite content from different plant parts. (a,d) represent energy utilization patterns of symbiotic and C.K. plants; (b,e) show radar maps of total fatty acid and central carbon metabolite content in symbiotic and C.K. plants; (c,f) show radar maps of total F.A. metabolite content for C.K. plants shown in (b,e).
Agronomy 14 00511 g012
Table 1. Targeted metabolomics sample abbreviations.
ItemsSiteAbbreviation
Inoculation of rhizobia LL11LeafI.L.
StemI.S.
Pink nodule rootsPNR
White nodule rootsWNR
No nodule rootsNNR
Pink root nodulesP.N.
White root nodulesW.N.
Inoculation of the same amount of sterile water C.K.C.K. LeavesCKL
C.K. stemsCKS
C.K. rootsCKR
Sinorhizobia meliloti LL11ThallusLL11
Table 2. Changes in nodulation and nitrogen fixation capacity following rhizobial inoculation.
ItemsI.N.C.K.
Number of effective nodules7.100 ± 0.83070.
Number of invalid nodules1.7143 ± 0.69990
Nodule weight per plant(g)0.0295 ± 0.00090
Nodule diameter(mm)0.8731 ± 0.30570
Nitrogenase activity(μmol·g−1·h−1)0.962 ± 0.04620
Leghemoglobin content(mg·g−1)2.5636 ± 0.05480
Mean nitrogen fixation potential (μmol·h−1)0.0283 ± 0.00110
Table 3. SFA and UFA content and relative abundance in different plant tissues and organs.
GroupSaturated Fatty Acid (SFA)Unsaturated Fatty Acid (UFA)
Species NumberTotal Content (ng)Percentage (%)Species NumberTotal Content (ng)Percentage (%)
I.L.15114,204.0133.0328231,581.5466.97
I.S.13121,995.2465.952862,978.5634.05
PNR14148,878.0251.8430138,322.1948.16
WNR14131,443.5463.853174,425.3836.15
NNR14118,166.6766.592859,299.4133.41
P.N.14175,968.9932.0432373,254.5767.96
W.N.14108,971.1162.812964,513.5237.19
CKL12100,687.8755.923079,378.6544.08
CKS13144,945.3161.502890,805.0038.50
CKR14131,650.4967.573063,196.0832.43
Disclaimer/Publisher’s Note: The statements, opinions and data contained in all publications are solely those of the individual author(s) and contributor(s) and not of MDPI and/or the editor(s). MDPI and/or the editor(s) disclaim responsibility for any injury to people or property resulting from any ideas, methods, instructions or products referred to in the content.

