Article

An Analysis of the Influence of Construct Parameters on the Solar Radiation Input in an Insulated Plastic Greenhouse

1
College of Water Resources and Civil Engineering, China Agricultural University, Beijing 100083, China
2
Vegetable Research Institute, Tibet Academy of Agricultural and Animal Husbandry Sciences, Lhasa 850032, China
3
Key Laboratory of Agricultural Engineering in Structure and Environment, Ministry of Agriculture and Rural Affairs, Beijing 100083, China
*
Author to whom correspondence should be addressed.
Agronomy 2024, 14(3), 510; https://doi.org/10.3390/agronomy14030510
Submission received: 26 January 2024 / Revised: 23 February 2024 / Accepted: 27 February 2024 / Published: 29 February 2024
(This article belongs to the Section Farming Sustainability)

Abstract

:
Insulated plastic greenhouses (IPG) were a new type of facility emerging in production in China. The mechanism of construct parameters on the indoor solar radiation deserves further study. A mathematical model that can well describe the spatial and temporal distribution of solar radiation in the greenhouse was established. Based on this model, the effects of multiple construct parameters, such as insulation blanket shading, height–span ratio, greenhouse azimuth, and geographical latitude, on the indoor solar radiation of IPG were quantitatively specified. The results showed that the spatial and temporal distribution of inside solar radiation was highly variable along the span direction of IPG. And by analyzing the simulation data, it was found that for different heights of greenhouses, the corresponding optimal span is different. Therefore, in the construction of greenhouses, the appropriate height–span ratio should be selected according to the planting demand. And by simulating the inside solar radiation under different greenhouse azimuth angles, it was found that accumulated daily solar radiation in the greenhouse reaches the optimum value when the greenhouse azimuth angle is in the range of 0–20°. This paper can provide theoretical guidance for the design and optimization of structure parameters of IPG in China.

1. Introduction

According to the different construction methods, the existing facility greenhouses in China are divided into spring-autumn greenhouses and winter-warm greenhouses. The winter-warm greenhouse, also known as the Chinese solar greenhouse (CSG), has thermal insulation and a heat storage back wall, which can produce fruits and vegetables in winter with no or little heating in the colder regions of China at latitudes of 32–41° N and even beyond 43° N [1,2]. It has the advantages of good heat preservation performance and energy savings. However, there are also some disadvantages, such as high construction costs, low land utilization, and serious damage to soil resources [3]. The spring-autumn greenhouse, also called the normal plastic greenhouse, is mainly used in southern China for the production of vegetables and fruits in spring and autumn. It has the advantages of low construction cost and high land utilization rate [4], and its main problems are poor heat preservation performance and small internal operating space [5]. Currently, with the increasing shortage of cultivated land and labor resources [6,7,8,9], the shortcomings of Chinese solar greenhouses and normal plastic greenhouses have become increasingly prominent, which has become an obstacle to the green and sustainable development of the facility horticulture industry.
As an important area to achieve China’s “Green Sustainable Development” strategic goal, facility horticulture is in urgent need of upgrading and renovation [10,11]. Based on that, a new type of greenhouse, insulated plastic greenhouse (IPG), has emerged in production. It combines the advantages of both Chinese solar greenhouses and normal plastic greenhouses. The IPG has the characteristics of low construction cost, large internal operating space, high land utilization rate, small damage to soil resources, and good heat preservation performance. Therefore, it has been widely used throughout the country. According to preliminary research, IPG can produce tomatoes, peppers, and other vegetables under non-heated conditions in cold winter in northern China, in regions such as Beijing, Shandong, and Inner Mongolia. It can be said that this kind of greenhouse is becoming one of the development trends of horticultural facilities in China.
Solar energy is a renewable and clean energy with little environmental impact. It can be used not only in greenhouse energy-saving buildings [12], but also as an important energy source for greenhouse crops growth [13], extending the growing period of crops [14,15,16]. On the one hand, solar energy as a heat source is the most important energy source for IPG and directly determines the changes in temperature and humidity, which can affect the amount of absorbed solar radiation and heat distribution in the greenhouse [17]. On the other hand, solar radiation as a light source controls the photosynthesis of crops in greenhouses and has an important impact on the yield and quality of crops. IPG, as one of the types of greenhouses, is an agricultural building with a large shape coefficient [18]. Its spatial construct directly affects the indoor solar radiation, thereby affecting the quality and yield of crops [19]. Therefore, a reasonable construct design allows the IPG to obtain the most solar energy to produce crops efficiently with little or no heating during the cold winter months in northern China [20,21]. The construct parameters of IPG mainly include the insulated blanket shading, height–span ratio, greenhouse azimuth, and geographical latitude, all of which are necessary to be considered in IPG design and construction.
Solar radiation transmission and solar incidence angle depend strongly on the greenhouse azimuth and the shape of the greenhouse [22,23]. Sethi established a solar radiation model to calculate transmitted total solar radiation (beam, diffuse, and ground reflected) at each hour, for each month, and at any latitude. Five shapes of greenhouses were selected for comparison to choose the best shape of greenhouses and greenhouse orientation that can maximize the annual amount of solar radiation and minimize the heat load of the greenhouse. The study concluded that at all latitudes, uneven span-shaped greenhouses have the highest solar radiation for each month of the year, and semicircular greenhouses have the lowest solar radiation for each month of the year. The east–west orientation is most suitable for year-round greenhouse applications at all latitudes [24]. El-Maghlany et al. developed a model to obtain the amount of energy captured by the greenhouse surface throughout the winter in the north tropics. The study considered a range of ellipse aspect ratios, the latitude (from 24° N to 31.2° N), and the orientation of the greenhouse. The study concludes that the elliptical aspect ratio has a significant effect on the captured solar energy. As the aspect ratio increased, the energy captured per square meter of land also increased. The best orientation of the greenhouse is toward the south, when it can reach the maximum amount of captured heat [25]. Singh and Tiwari studied energy conservation in winter by calculating the amount of solar energy captured in different shapes and orientations of greenhouses to choose the optimum ones. The uneven span shape of the greenhouse is the best shape for a compound climate [26]. Chen et al. developed a mathematical model to calculate the amount of global solar radiation captured by greenhouses at different latitudes. Within the latitude range of 20° N to 30.6° N, the solar radiation model was used to compare and calculate six typical greenhouse shapes commonly found in southern China (even span, uneven span, ellipse, arch, sawtooth, and vinery), and to select the most suitable type of greenhouse for maximum solar radiation capture. The sawtooth greenhouse captures the highest amount of global solar radiation in winter at all latitudes. The east–west greenhouses capture the greatest amount of global solar radiation in winter at all latitudes [27]. Zhang et al. established a mathematical model to calculate the captured solar radiation energy in a solar greenhouse and derive the optimal orientation for maximizing the captured global solar energy. The inclination of the lighting surface can lead to nonuniform beam radiation intensity and beam transmission rate, which has a large impact on the solar radiation in the solar greenhouse. In addition, the spatial distribution of solar radiation shows a decrease in both directions from south to north and from bottom to top in solar greenhouses [28]. Considering structural parameters, including the transmittance of the greenhouse frame, the radiometric properties of the greenhouse cladding, and the floor and the type of condensation (as a film or as drop), Pieters et al. investigated the effect of these constructional parameters on the solar energy collecting efficiency of greenhouses under climate conditions in Western Europe by the semi-one-dimensional climate model [22]. Lin et al. developed a mathematical expression to calculate the equivalent reflected transmissivity of a solar greenhouse curved surface to calculate the global solar radiation transmitted into the greenhouse through the curved surface. The optimal solar greenhouse aspect ratio was determined for different latitudes in six cities in China using the solar radiation analytical model [29].
The transparency, color, thickness, and cleanliness of the covering materials have an important influence on the transmittance of direct and diffuse solar radiation [30] and determine the extent to which solar energy is utilized [31,32,33,34]. Additionally, the humid air, crops, and soil in the greenhouse have some influence on the transmission of solar radiation [35]. In addition, in preliminary research, it was found that the insulation cover had a serious occlusion on the solar radiation of IPG. One of the special configurations of the IPG is that both sides of the light-transmitting surface are covered with an insulation blanket. During the daytime, the blankets on both sides are rolled up and fixed on the top of the greenhouse. At night, both sides of the blankets are put down to play the role of heat preservation. Since the blanket has a certain thickness, when rolled up and fixed on the top of the greenhouse, it will not only affect the transmission of captured solar radiation of the greenhouse, but also produce a certain area of shadow inside the greenhouse, thus influencing the intensity of inside solar radiation and its distribution in time and space. Therefore, the influence of the insulation blanket on indoor solar radiation inside the IPG cannot be ignored. To accurately design and regulate the greenhouse environment, it is necessary to carry out a quantitative theoretical analysis of this influence.
In this study, the influence of various factors on the solar radiation in the greenhouse was comprehensively considered, and the solar radiation model of IPG was established by using the geometric relation of sunlight and the inverse ray tracing method. It can be used to calculate the direct and diffuse solar radiation captured in different geographical locations, different greenhouse azimuths and different shapes of greenhouse. And four regions were selected to simulate and apply the model. Chifeng, which is located in the northeast of China, belongs to the cold region of high latitudes. Its temperature difference between day and night is large, which requires a high level of thermal insulation for greenhouses. Caoxian in the central region and Yinchuan in the north-central region have poorer solar radiation resources and require higher solar radiation environment for greenhouses. Lhasa in the western region belongs to the high cold and high-altitude region. Its temperature is lower, and the greenhouse thermal insulation requirements are higher. These four regions span most of China’s latitude and represent different altitudes. The regions are shown in Figure 1.

2. Model Development
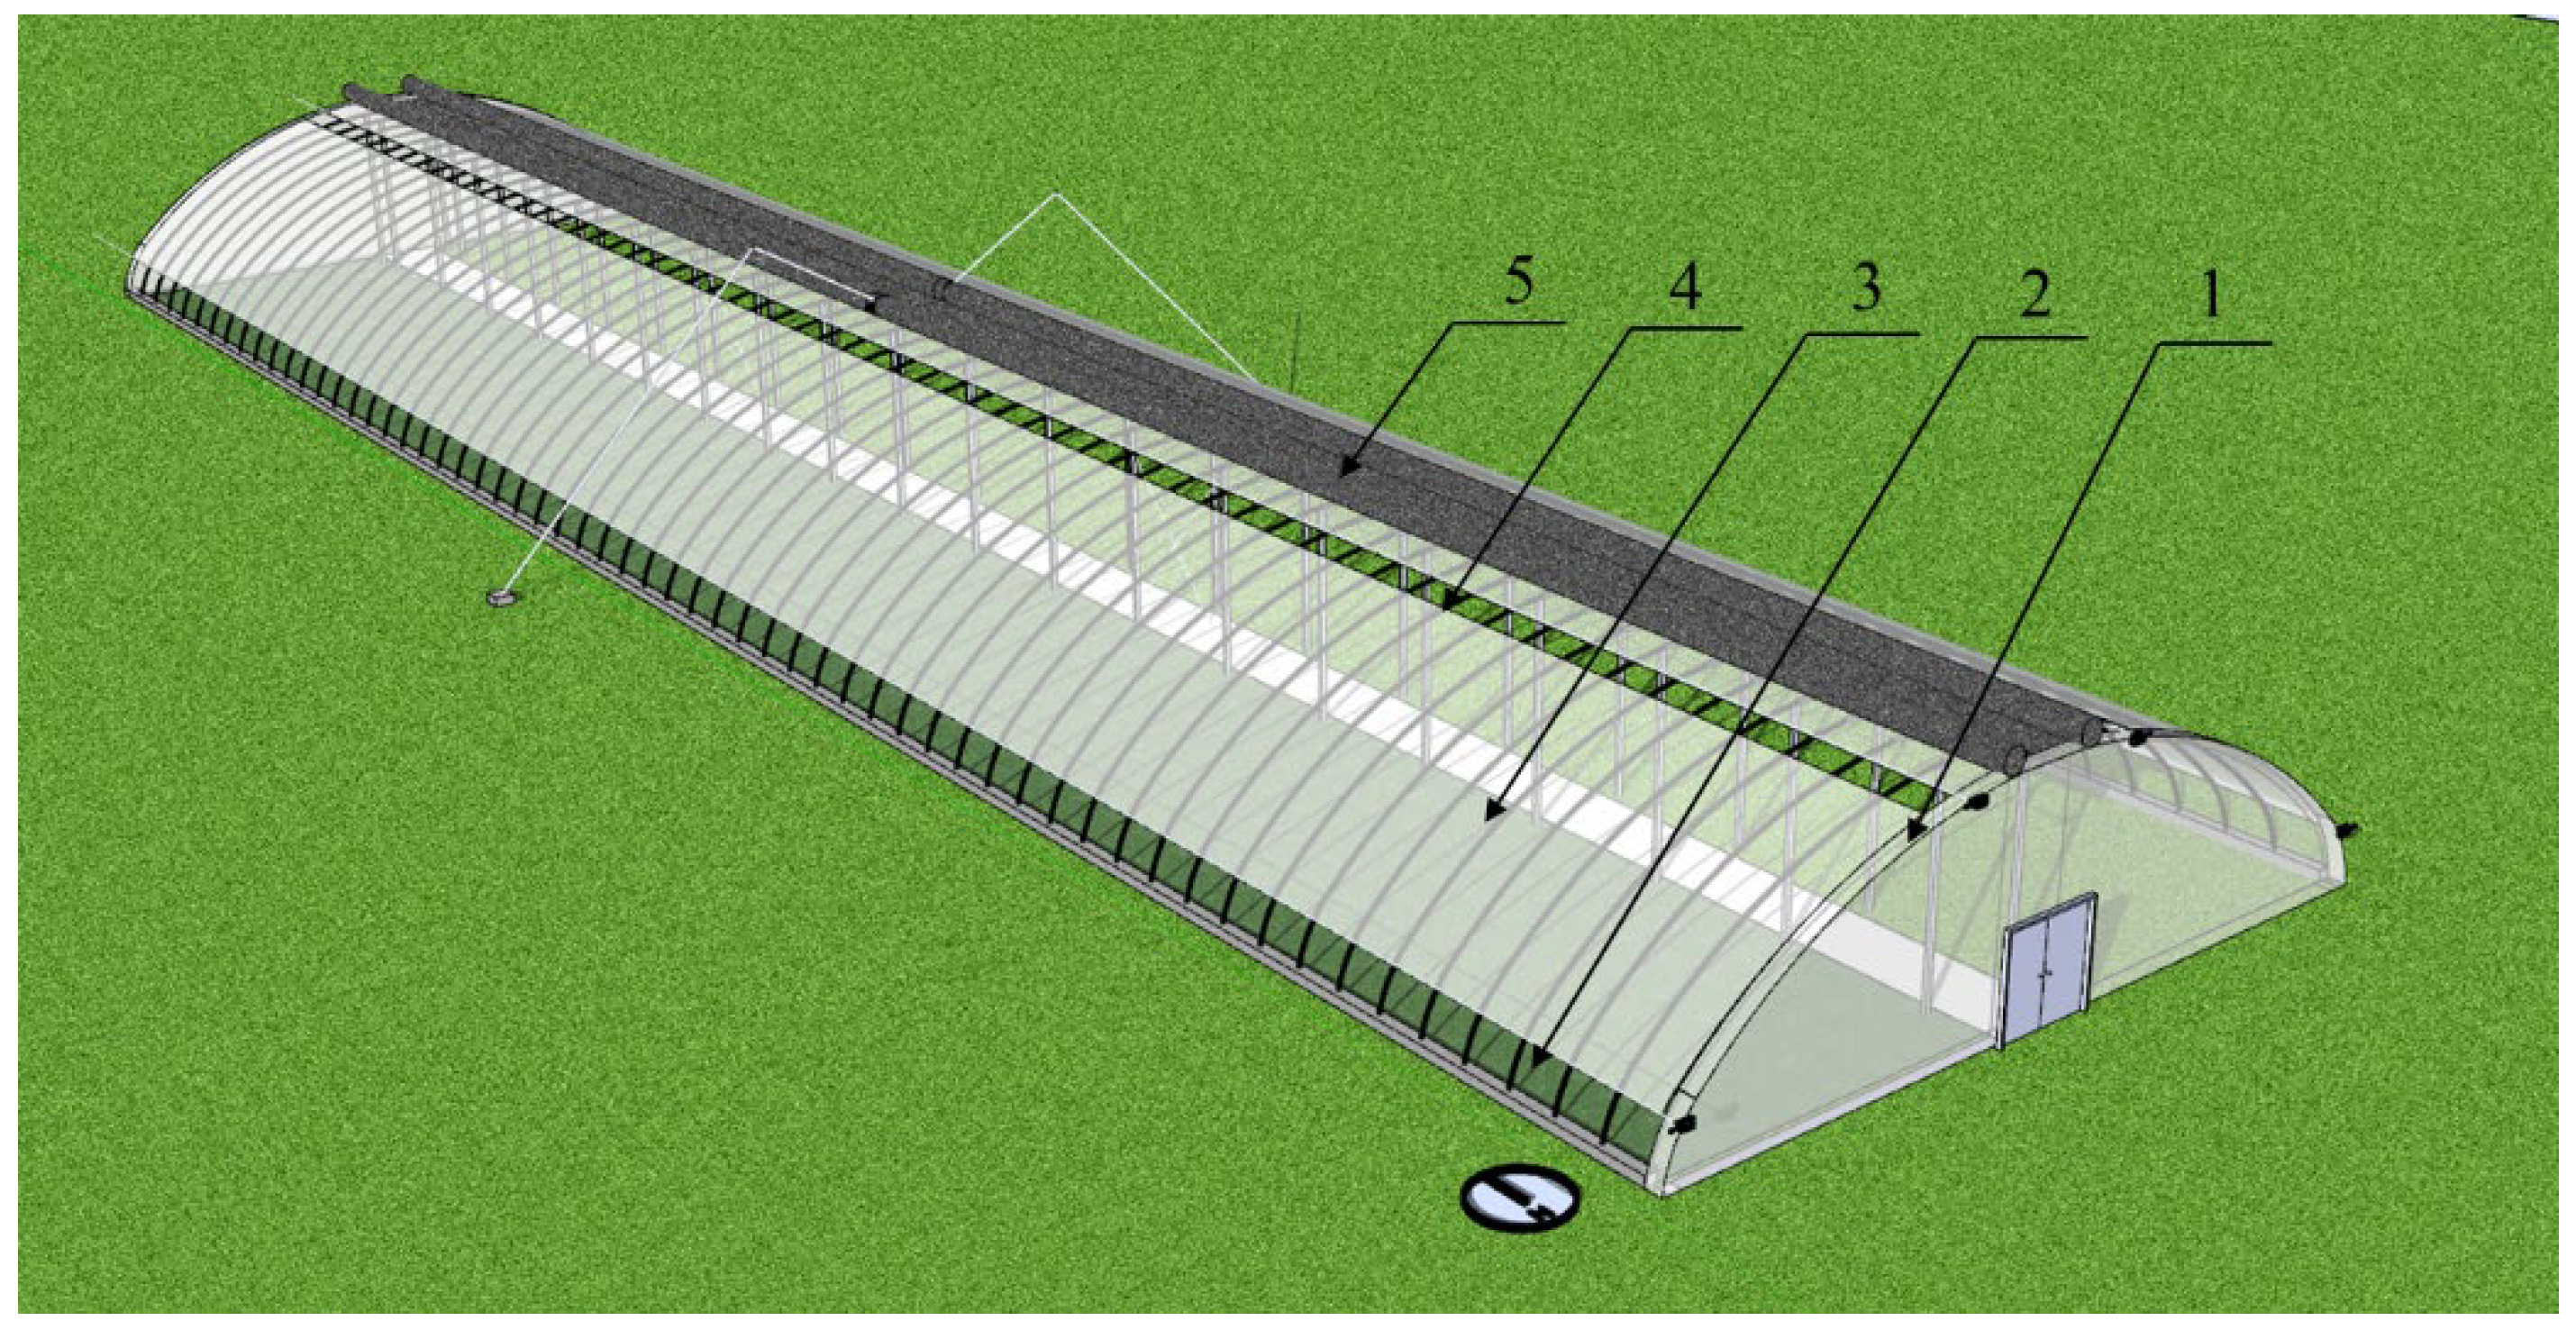
2.1. Physical Model

In production, there are IPGs with a north–south roof direction (N–S IPG) and IPGs with an east–west roof direction (E–W IPG). Since there are more N–S IPGs, this paper took N–S IPGs as an example to study solar radiation inside a greenhouse. Figure 2 shows a typical three-dimensional geometric model of an N–S IPG. It is composed of a symmetrical transparent roof, insulation blanket, and gables. The transparent roof is clad with a single-layer polyethylene film on a steel frame, and an external insulation blanket covers the film. During the day, the thermal insulation is rolled up to the top of the greenhouse. At night, the thermal insulation is put down to cover the whole transparent roof to play the role of heat preservation. The gables are composed of opaque thermal insulation materials or double-layer transparent materials. The main structural parameters of the greenhouse include the length, height, and span.

2.2. Solar Radiation Outside the Greenhouse

The formula for calculating direct solar radiation on the inclined plane outside the greenhouse on a sunny day is expressed as [36]:
I D = I 0 p m cos θ
where p is the atmospheric transparency, m is the atmospheric quality, and I0 is the normal solar radiation in the upper atmosphere, which can be calculated by Equation (2).
I 0 = 1367 1 + 0.033 cos 360 n 365
In Equation (2), n is the number of days counted from 1 January, on the first of January n = 1.
θ is the solar angle of incidence, which is an angle between the sun’s light and the normal line of the calculated surface, as shown below:
cos θ = sin ω cos h cos γ + cos ω sin h
In the above formula, ω is the inclination angle of the inclined surface, and γ is the angle between the sun’s ray and n’ (the normal line of the calculated surface) projected in the horizontal plane. According to their geometric relations, as shown in Figure 3, it can be expressed as Equation (4).
γ = α ε
α is the solar azimuth (the included angle between the projection of sunlight on the horizontal plane and the local meridian). It is 0° in the due south direction and gradually increases in the west and gradually decreases in the east until it is close to 180° in the due north direction. ε is the calculated surface azimuth, which is calculated from the greenhouse azimuth εg. εg is the greenhouse azimuth, the angle between the projection of the calculated surface’s normal line on the horizontal plane and the local meridian. The clockwise deviation from the meridian is positive, and the counter-clockwise deviation from the meridian is negative. For the IPG, the azimuth of the surface of the light transmission part of the east roof is approximately –90°, and the azimuth of the surface of the light transmission part of the west roof is approximately 90°.
Figure 3. Schematic diagram of the geometric relationship of angles (γ, ε, α).
Agronomy 14 00510 g003
The diffuse solar radiation on the inclined plane outside the greenhouse can be expressed as [36]:
I d = 1 p m I 0 sin h cos 2 ω 2 2 1 1.4 ln p
Therefore, the amount of global solar radiation available on an inclined surface is as given below:
I = I D + I d

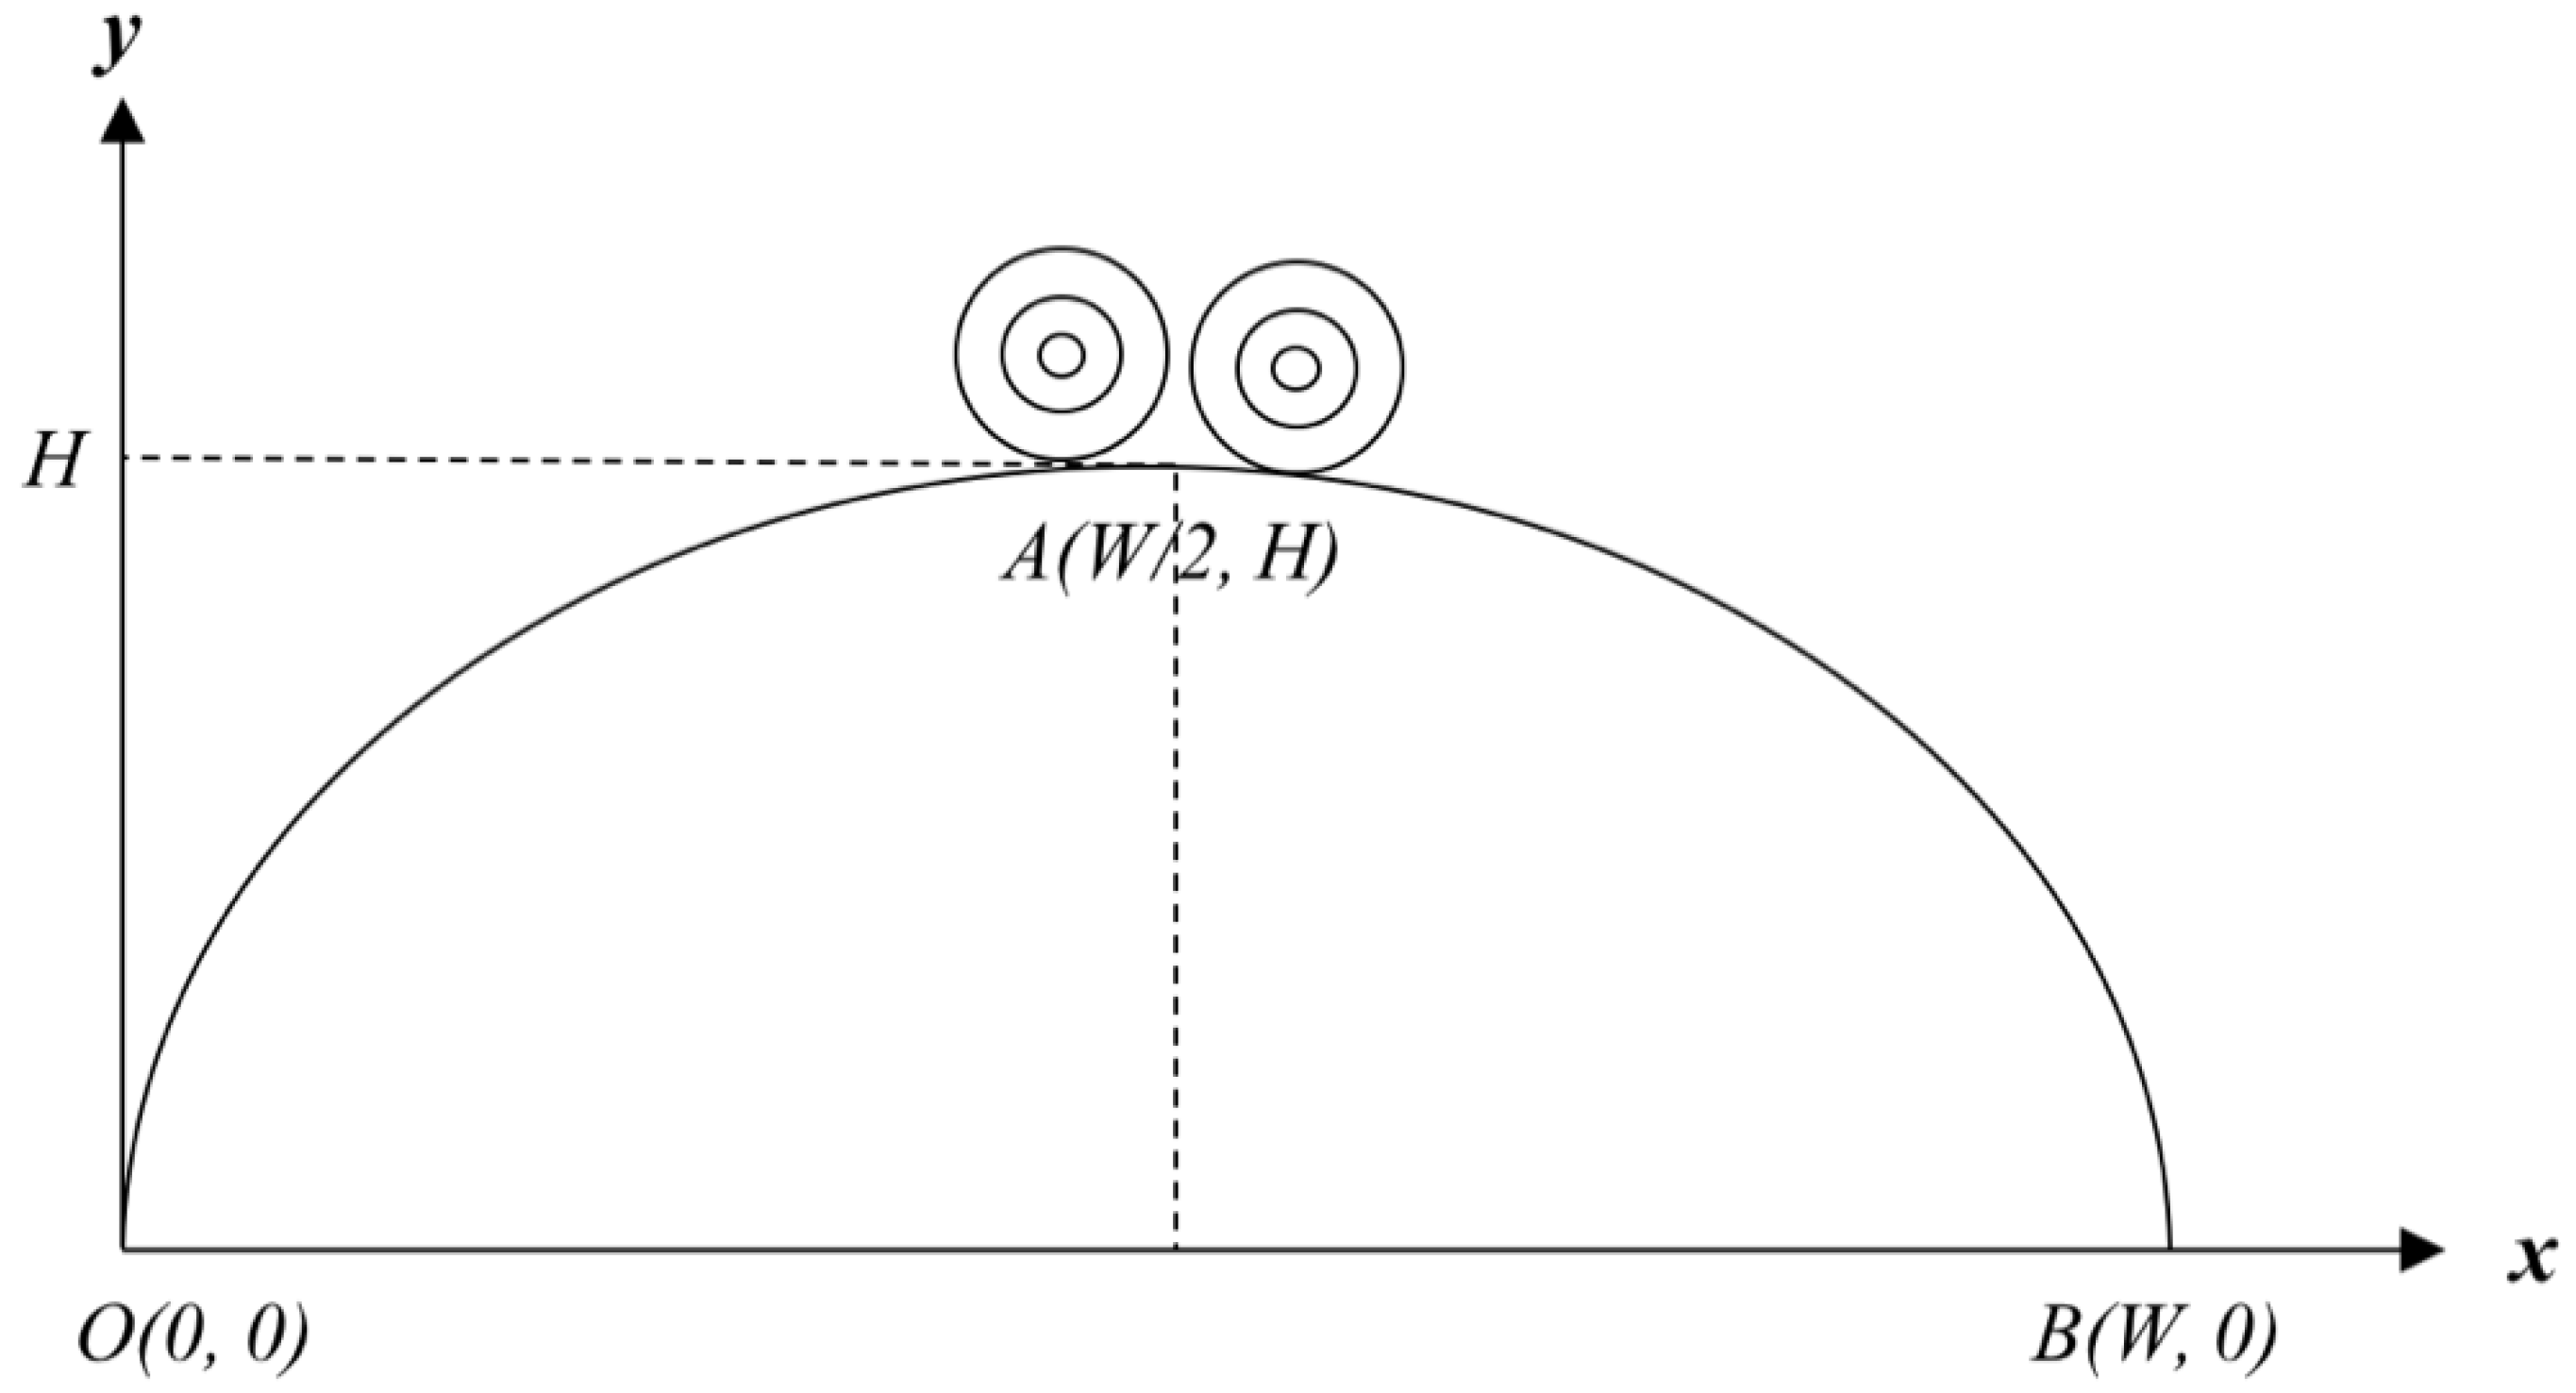
2.3. Control Equation of the Transparent Surface Curve

Currently, greenhouse roofs are designed with various cross-sectional shapes, such as single-circle, double-circle, and elliptic curves. In view of the current research and considering the simplification of the curve equation, the solar radiation model is constructed in this paper with a double circle as an example. However, in production, it should not be limited to the double-circle according to the needs of production practice. Using the southwest corner of the greenhouse as the coordinate origin O, with the X-axis along the span direction of the greenhouse and the Y-axis along the height direction of the greenhouse, a coordinate system is established, as shown in Figure 4. The general expression of the control equation of the transparent roof curve is as follows:
y = F x
The surface inclination of any point on the transparent roof is calculated by the following formula:
ω = arctan y

2.4. Solar Radiation Transfer in IPG

According to the references, the greenhouse can be regarded as a solar collector [35,37]. In this study, during the daytime, the greenhouse system is divided into three components: transparent roof, crop layer, and soil absorption layer. The solar radiation transfer process between the different components in the greenhouse is shown in Figure 5. The solar radiation transfer analysis was performed according to the following assumptions:
(i)
The reflected radiation between components in the greenhouse is ignored;
(ii)
The crop canopy is a semi-transparent layer including aerial parts of plant tissues and air and is characterized by an effective transmittance to global solar radiation incident downward.
Figure 5. Solar radiation transfer among the different components in the greenhouse.
Agronomy 14 00510 g005

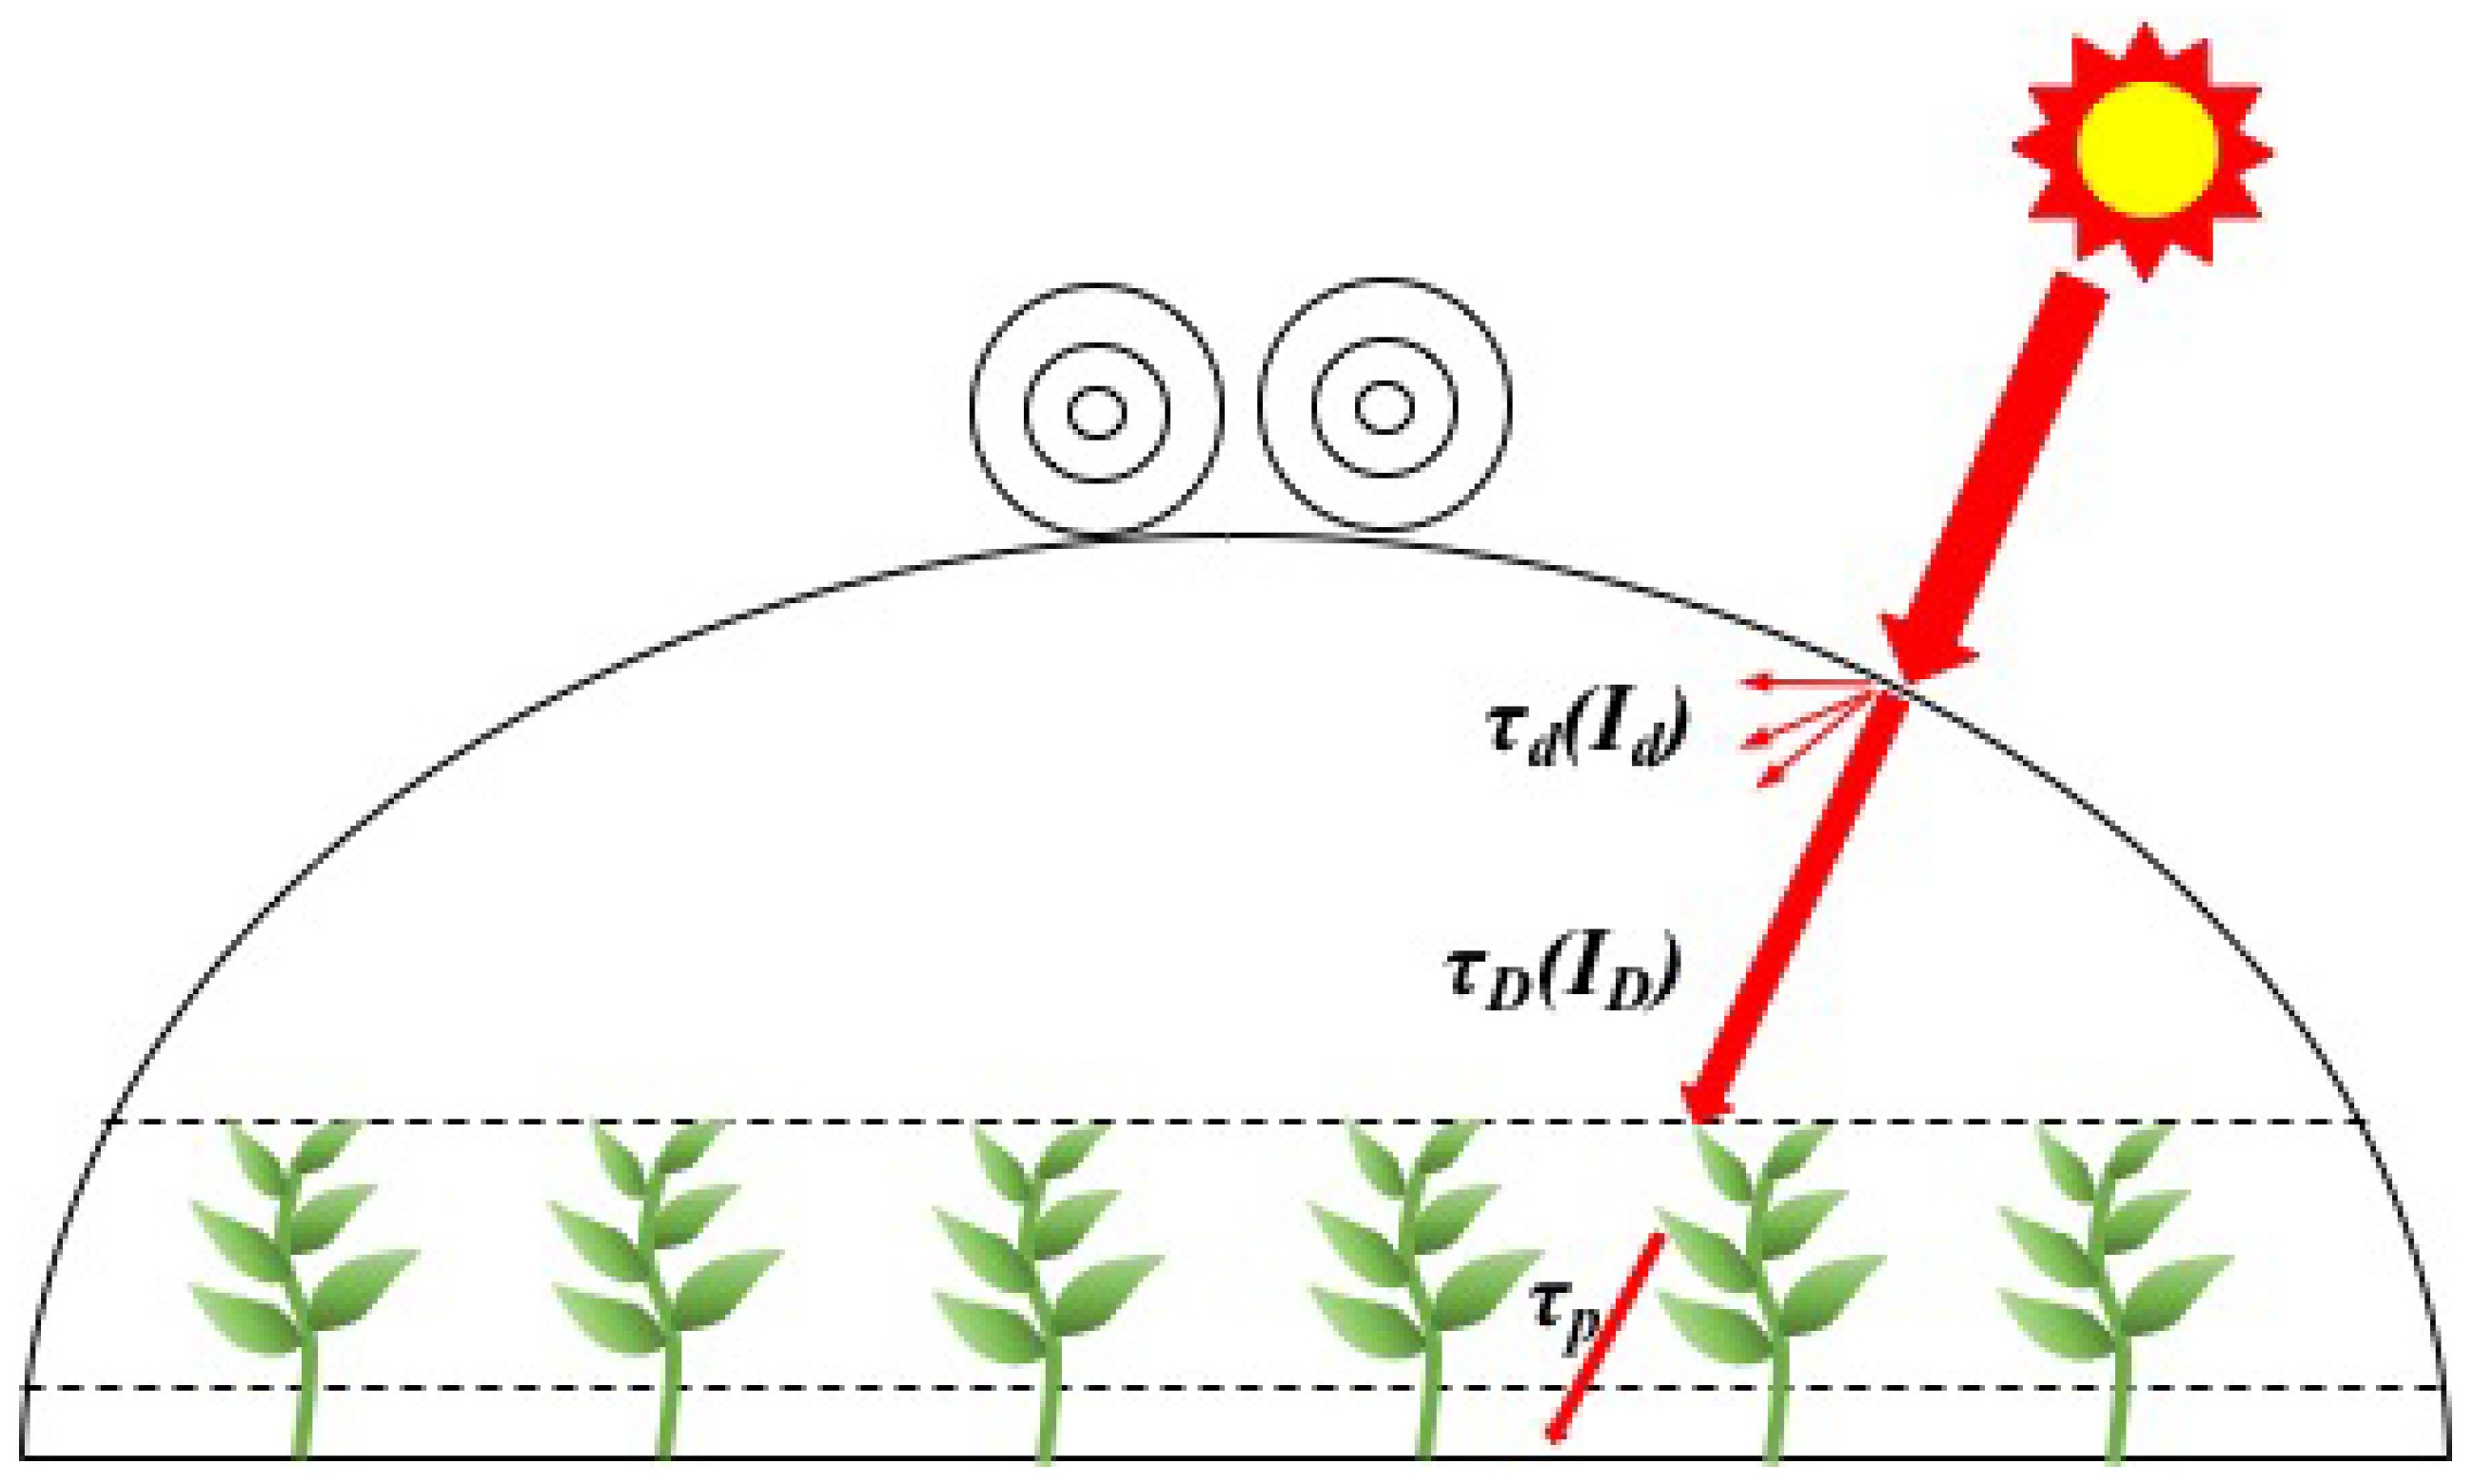
2.4.1. Transmission of Solar Radiation in the Transparent Roof

The transmittance of the greenhouse transparent roof covering layer includes the transmittance of direct solar radiation and diffuse solar radiation. The transmittance of direct solar radiation is expressed as [36]:
τ D = τ D θ 1 μ 1 1 μ 2 1 μ 3
μ1, μ2, and μ3 are the shading loss of structural materials, transmission loss of covering material due to aging, and transmission loss of covering material due to dust and condensation, respectively; τ is the transmittance of dry cleaning new covering material to direct solar radiation, which is calculated as follows [36]:
τ D θ = τ D 0 1 0.93 90 θ 1 θ 1000
where τD0 is the transmittance of the dry cleaning new covering material to direct solar radiation when the incident angle is 0°.
According to the literature [34], the transmittance of diffuse solar radiation is affected by film aging, dust, and condensation on the greenhouse roof, so its deposition is given as follows:
τ d = τ d 0 1 μ 1 1 μ 2 1 μ 3

2.4.2. Transmission of Solar Radiation in the Crop Layer

The direct solar radiation effective transmittance of the crop layer in the greenhouse is given by [35] as:
τ p = exp C 2 L A I
C 2 = C 1 1 τ L 2 ρ L 2
where exp C 2 L A I represents the fraction of floor area uncovered by plant stands. The coefficient C1 (C1 = 0–1) depends on the plant geometry and leaf orientations [38]. ρL is the reflectance of green leaves, and τL is the transmittance of green leaves. The mean values for τL and ρL were taken as 0.25 and 0.25 [38].

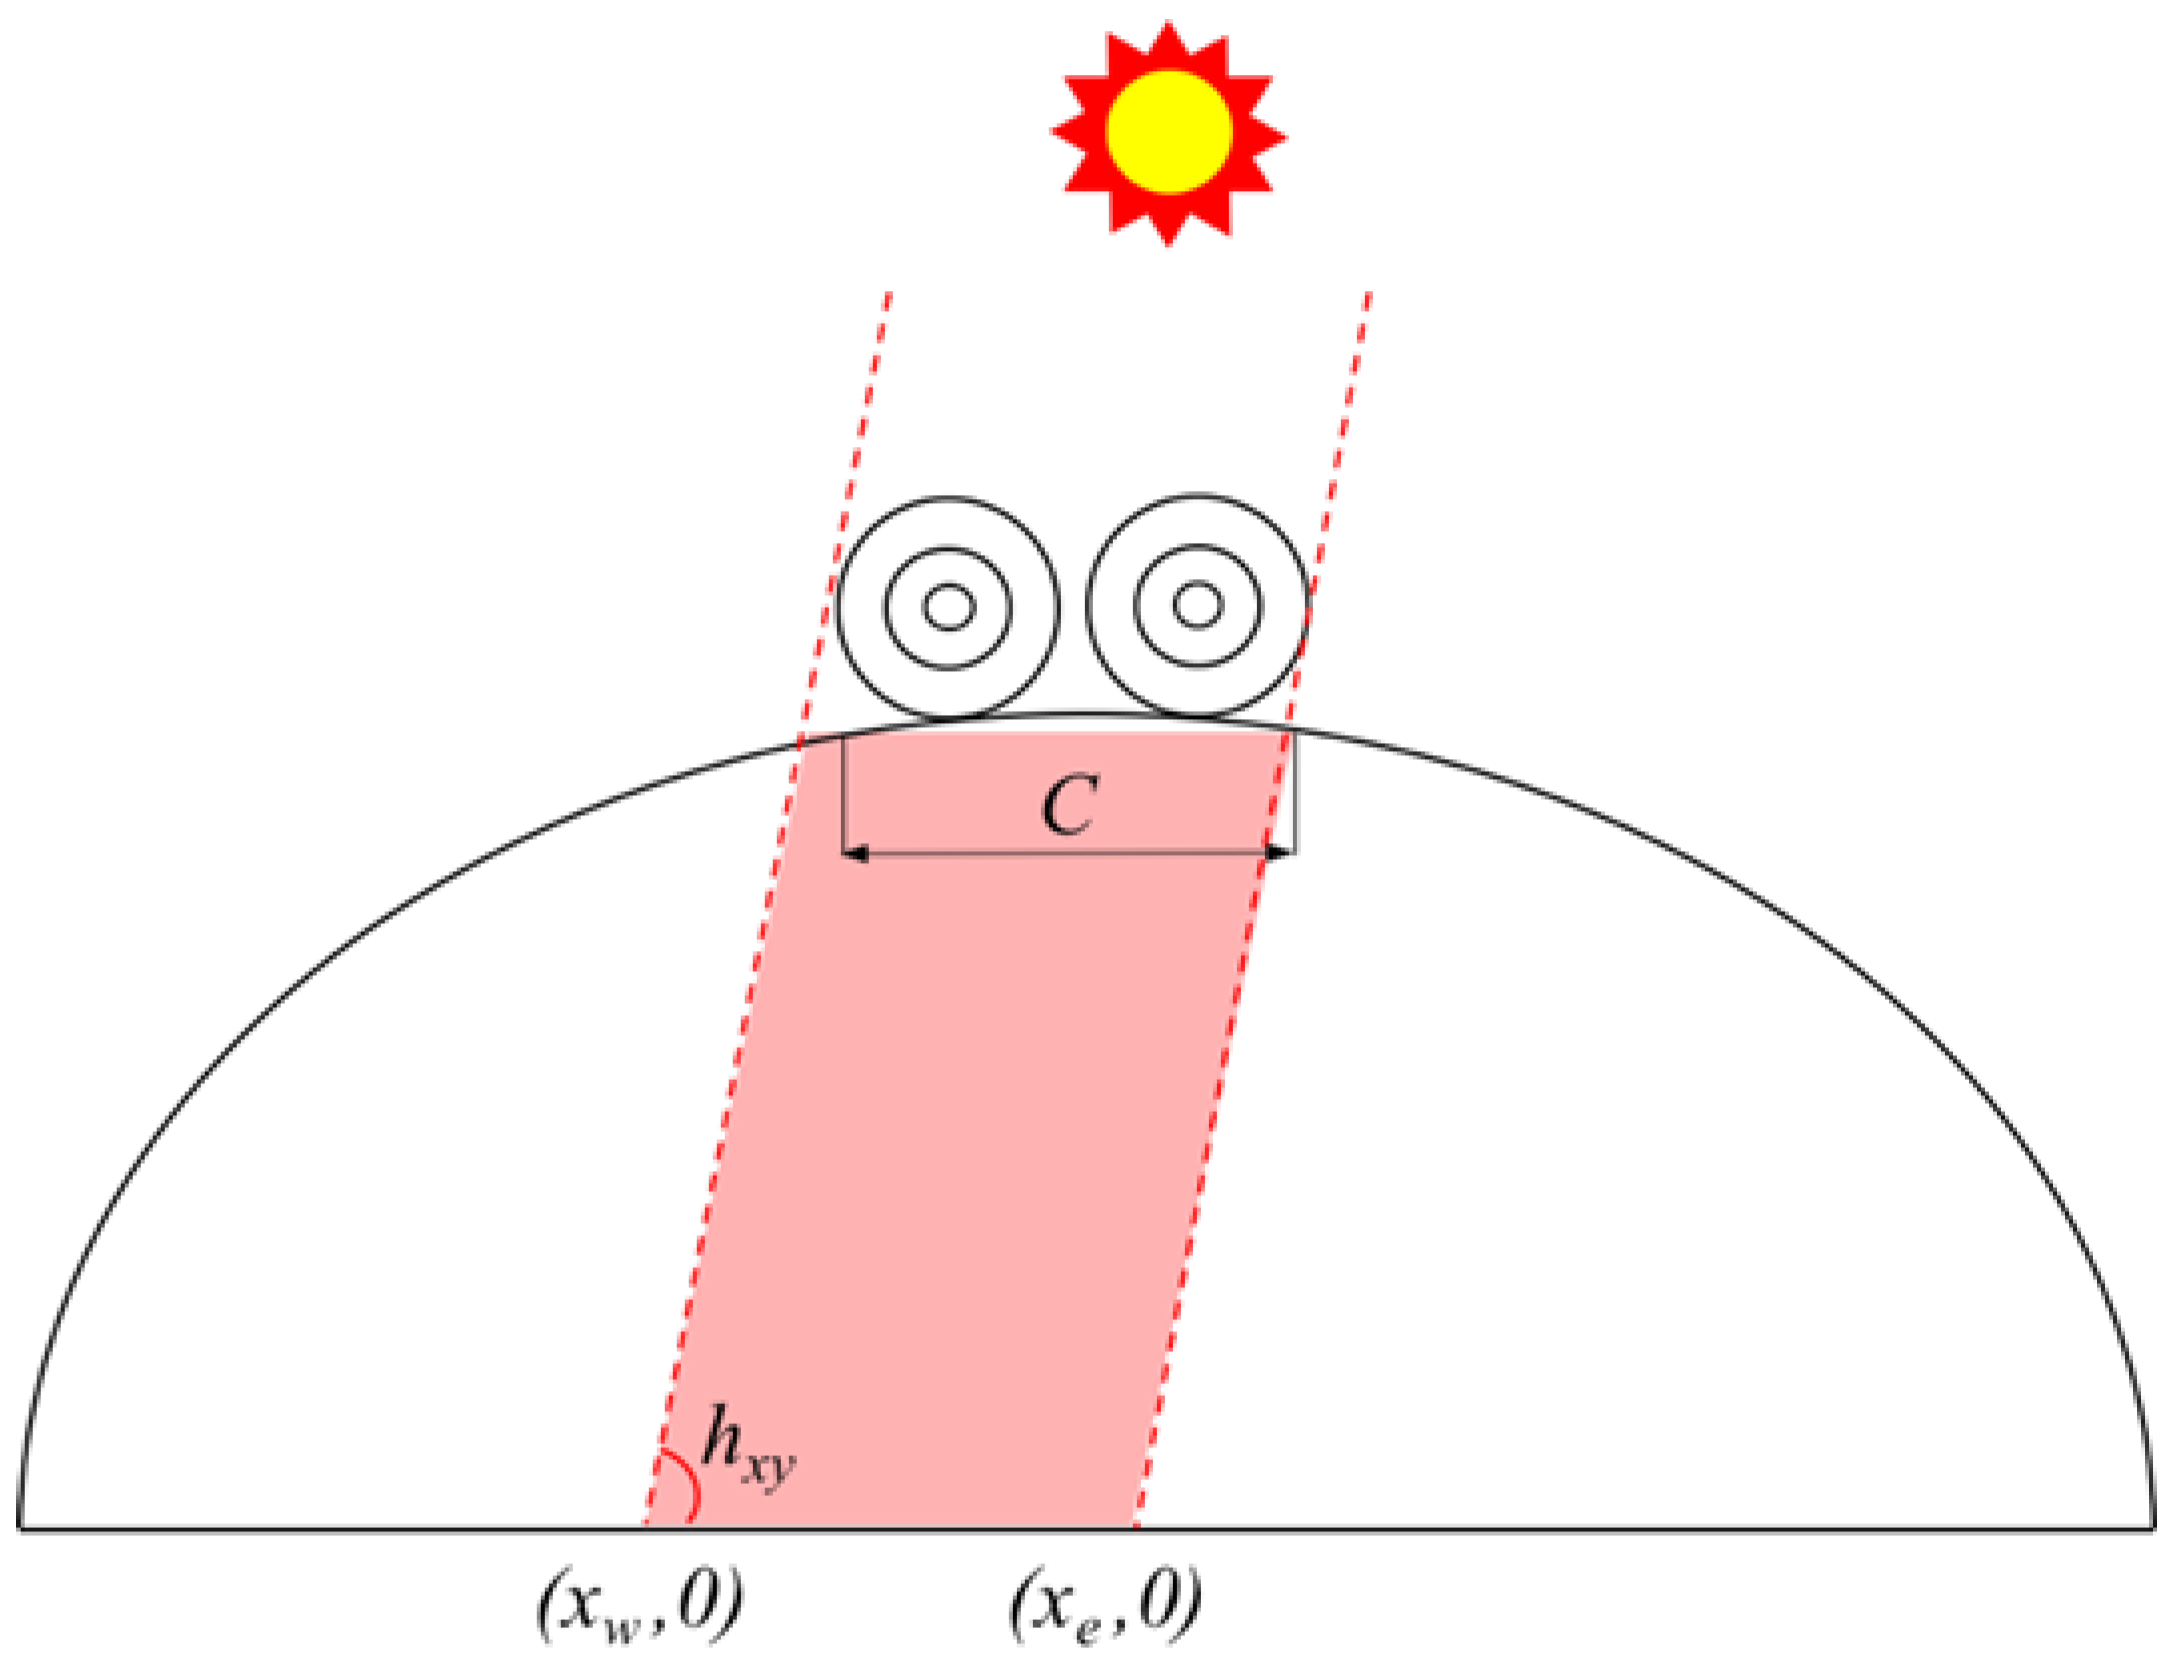
2.4.3. Effect of Insulation Blanket on Shading of IPG

Limited to the characteristics of the existing rolling machine mechanism, the insulation blanket covering the transmit roof is rolled up from the bottom of both sides during the day, folded, and placed on the top of the greenhouse. Due to the large width of the rolled insulation blanket, the impact of the insulation blanket on the solar radiation in the greenhouse cannot be ignored. It is assumed that the width when the insulation is rolled up on top of the greenhouse is C, as shown in Figure 6. Determine the position of the insulation shade on the ground according to the following methods.
The solar altitude angle in the cross section of the greenhouse (assumed to be expressed by hxy), that is, the included angle between the projection of the solar ray in the cross section of IPG and the horizontal plane, and its calculation formula is:
tan h x y = tan h cos γ
According to the solar height angle hxy in the cross section of the greenhouse, the projection positions of the center of the insulation blanket on the east and west sides of the ground are (xOe, 0), (xOw, 0). Then, the abscissa of the east boundary of the insulation shadow is given as:
x e = x O e + C 4 sin h x y
The abscissa of the west boundary of the insulation shadow is expressed as follows:
x w = x O w C 4 sin h x y
Therefore, the total shadow length of the insulation is:
S = x e x w
Figure 6. Schematic diagram of shadow change of insulation in IPG.
Agronomy 14 00510 g006

2.5. Incidence Point and Angle of Solar Radiation on the Transparent Roof Corresponding to the Calculation Point in IPG

As shown in Figure 7, according to the inverse ray tracing method, calculating the direct solar radiation at a point in the greenhouse can be transformed into finding the incident point (the intersection of the sun’s rays received at that point with the transparent roof of the greenhouse). Then, the direct solar radiation is calculated based on the angle of incidence corresponding to the inclination of the transparent roof and the incidence point. It is assumed that the coordinates of the calculated point E in the greenhouse are (xE, yE). According to the inverse ray tracing method [36], the intersection of the sun’s light received at point E with the transparent roof of the greenhouse is point F at any time. It is known that the solar altitude angle is h, the solar azimuth is α, and the transparent roof inclination is ω. The coordinate of point F is obtained from the simultaneous sun’s light equation and transparent roof curve equation, as shown in the formula:
x E = x F + y E y F cos γ tan h
y E = F x E
When γ = 90°, xE = xF.
Figure 7. Schematic diagram of solar direct radiation at the calculation point and incident point in the greenhouse.
Agronomy 14 00510 g007
Considering the transmission characteristics of transparent roof covering materials and the effect of haze on the reduction in the intensity of direct solar radiation, the direct radiation at incidence point F is calculated as follows:
I D F = I D τ D 1 K h
Kh is the correction factor of the haze of the transparent surface covering materials and is a unique physical property parameter of materials, which is generally taken as 0.3 [17].
The diffuse radiation at incident point F is given as:
I d F = I d τ d + I D τ D K h
The global radiation at incident point F is expressed as:
I F = I D F + I d F

2.6. Solar Radiation at Calculated Points in IPG

2.6.1. Direct Solar Radiation at Calculated Points in IPG

The calculation of direct solar radiation at point E in the greenhouse is complicated by many factors, such as the transmittance of the covering materials on the transparent roof of the greenhouse, the haze, the shadow of the greenhouse insulation blanket and the plants.
When the calculation point E is not shaded:
(i)
When HE (the height of calculation point E) ˃ Hp (the height of the plant), the direct solar radiation transmittance at calculation point E is only influenced by the greenhouse covering layer, and the direct solar radiation of calculation point E is calculated as follows:
I D E = I D F
(ii)
When HE ˂ Hp, the direct solar radiation transmittance of calculation point E is affected by the greenhouse covering layer and plants, and the direct solar radiation of calculation point E is given by:
I D E = I D F τ p
(iii)
When calculation point E is shaded, the direct solar radiation of calculation point E is equal to 0.

2.6.2. Diffuse Solar Radiation at Calculated Points in IPG

According to the literature, assuming that the sky is of equal grayscale, the diffuse solar radiation at point E in the greenhouse is proportional to the view of the sky visible at point E in the whole sky (considering the hemispherical surface, the view is 180°), as shown in Figure 8. In addition, considering the effect of the haze of the covering material on the transmittance of the transparent roof, when solar radiation enters the greenhouse through the covering material, part of the direct solar radiation is converted to diffuse solar radiation, and the diffuse solar radiation at calculation point E in the greenhouse is given as follows:
(i)
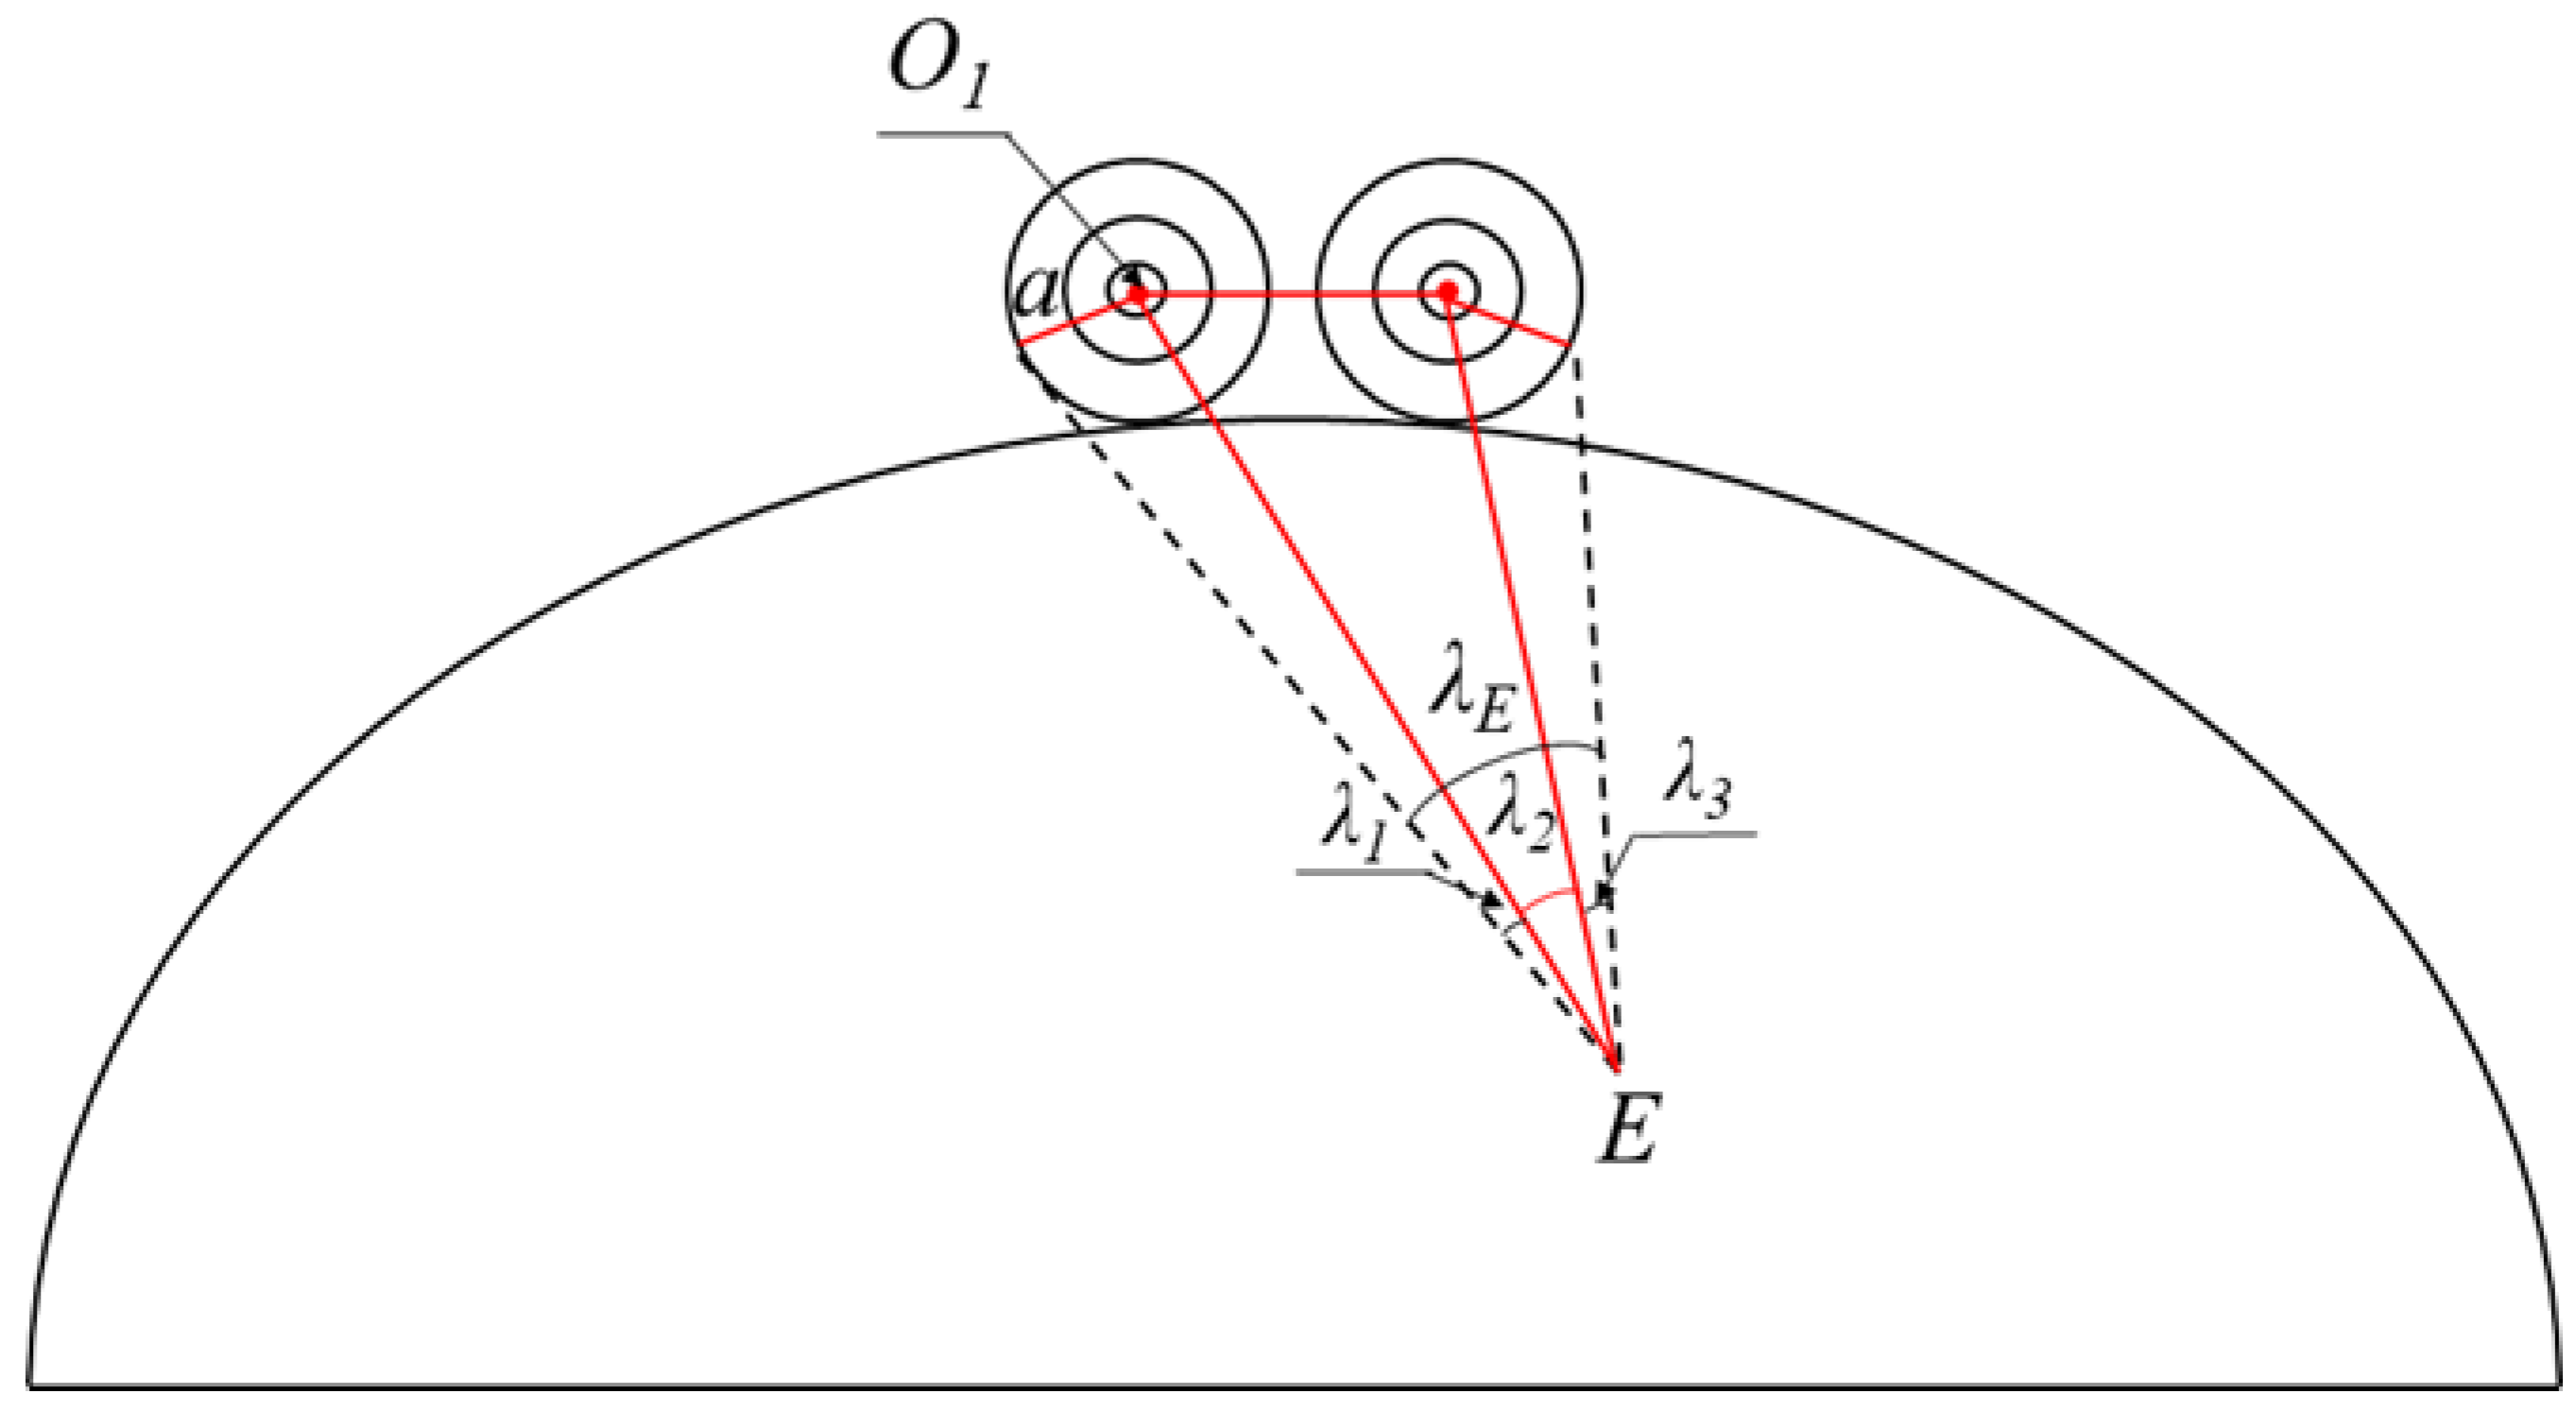
When HE ˃ Hp, the diffuse solar radiation transmittance of calculation point E is only affected by the greenhouse covering layer, and the diffuse solar radiation of calculation point E is calculated as follows:
I d E = 180 λ E 180 I d τ d + I D F τ D F K h
where λE is the included angle between calculation point E and the connecting line of the boundary points of thermal insulation on both sides, as shown in Figure 7. λE is related to λ1, λ2, and λ3. According to the triangular geometric relationship between them, λE is calculated as:
λ E = λ 1 + λ 2 + λ 3
λ 1 = arcsin a x E x O 1 2 + y O 1 y E 2
Similarly, we can calculate λ2 and λ3.
(ii)
When HE ˂ Hp, the diffuse solar radiation transmittance of calculation point E is affected by the greenhouse covering layer and plants, and the diffuse solar radiation of calculation point E is given by:
I d F = 180 λ E 180 I d τ d + I D F τ D F K h τ p
Figure 8. Visual angle diagram of calculation points in IPG.
Agronomy 14 00510 g008

2.6.3. Global Solar Radiation at Calculated Points in the IPG

In summary, the global solar radiation at calculated point E in the greenhouse is known as:
I E = I D E + I d E

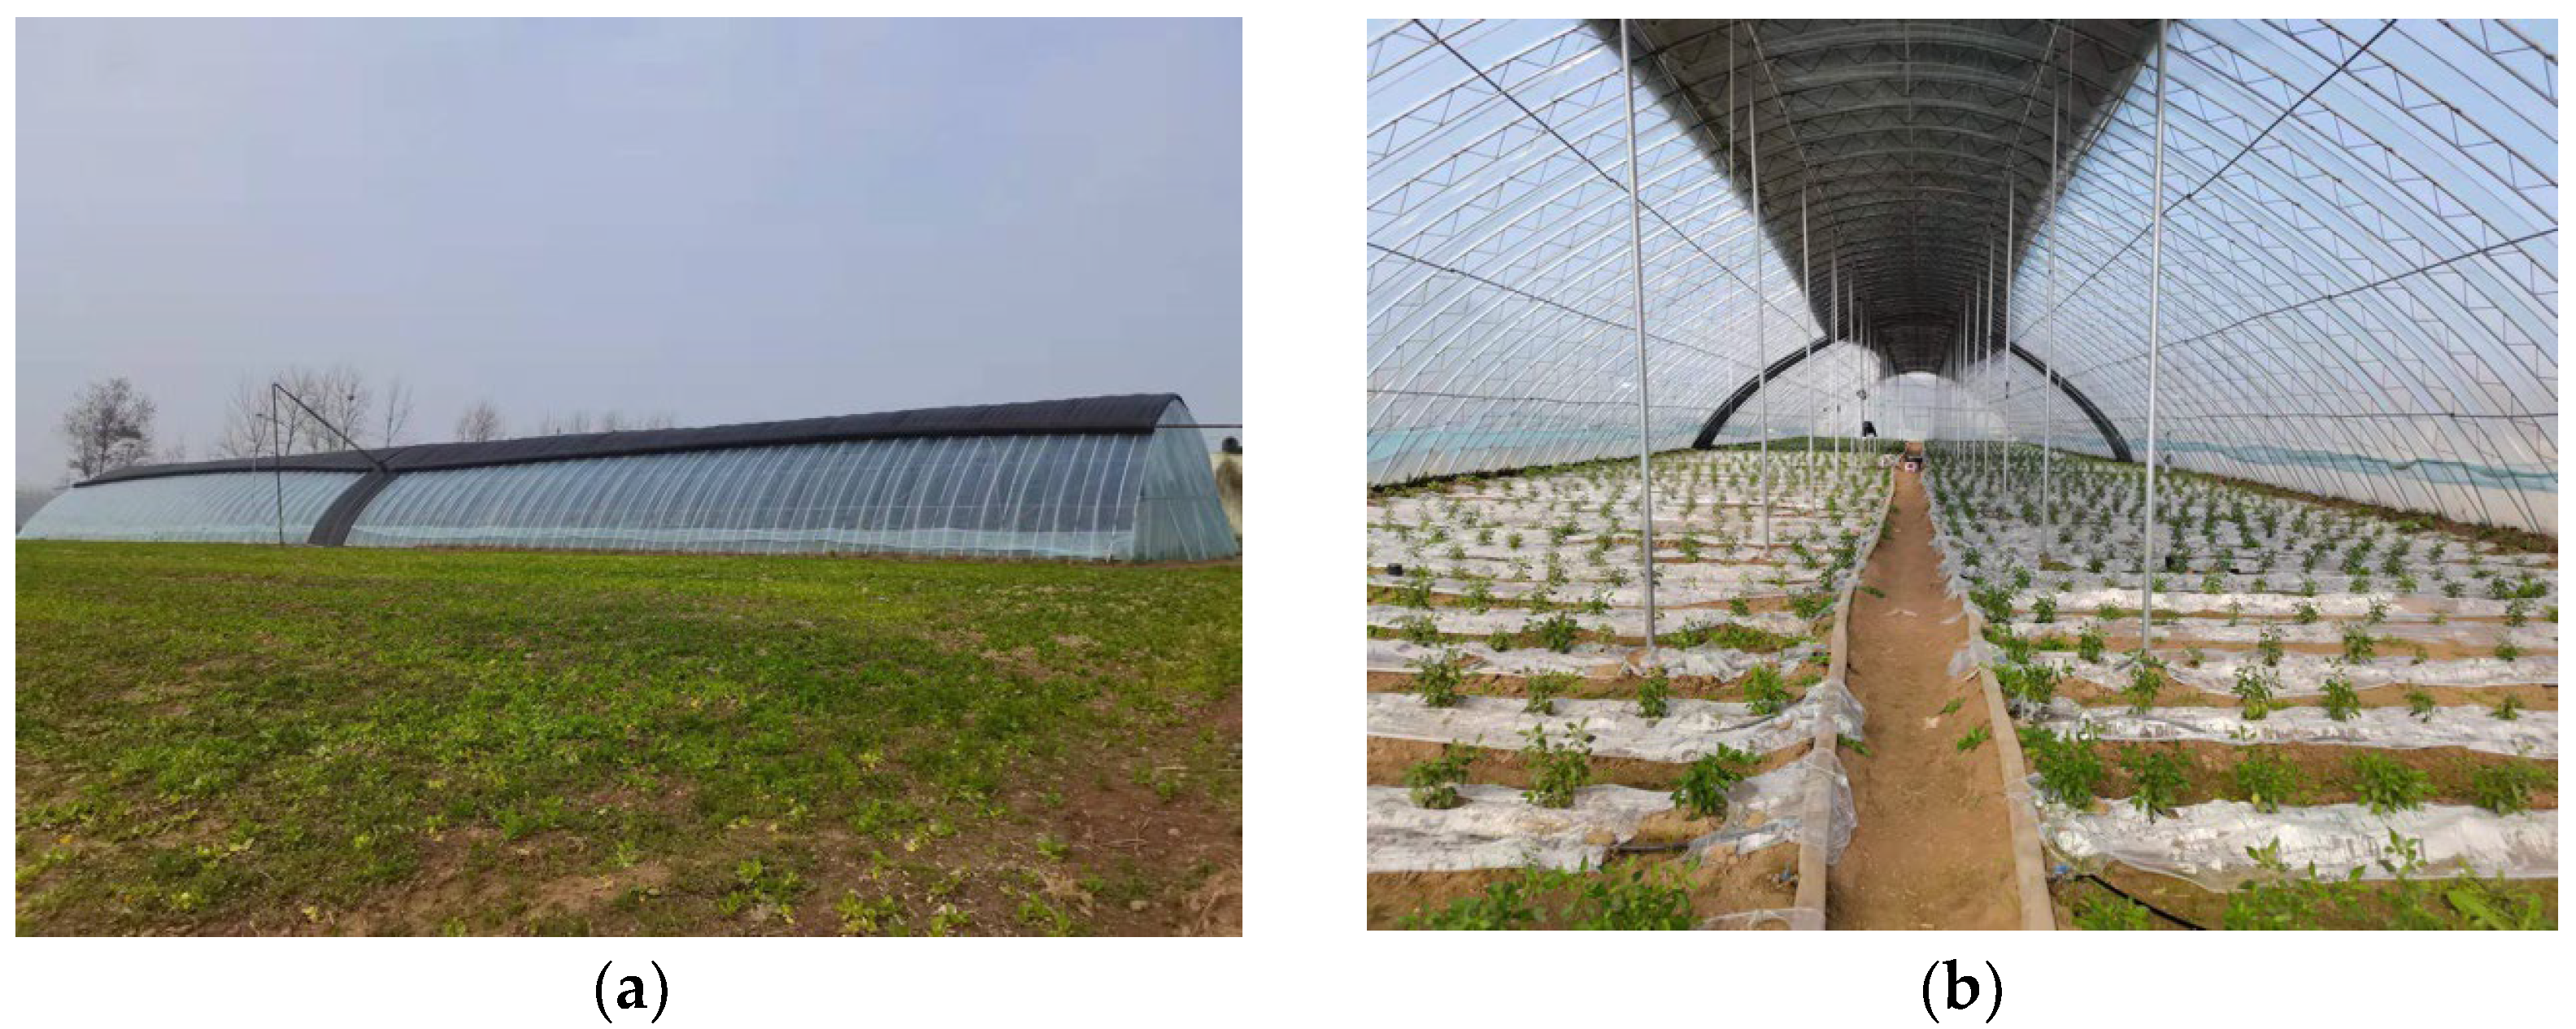
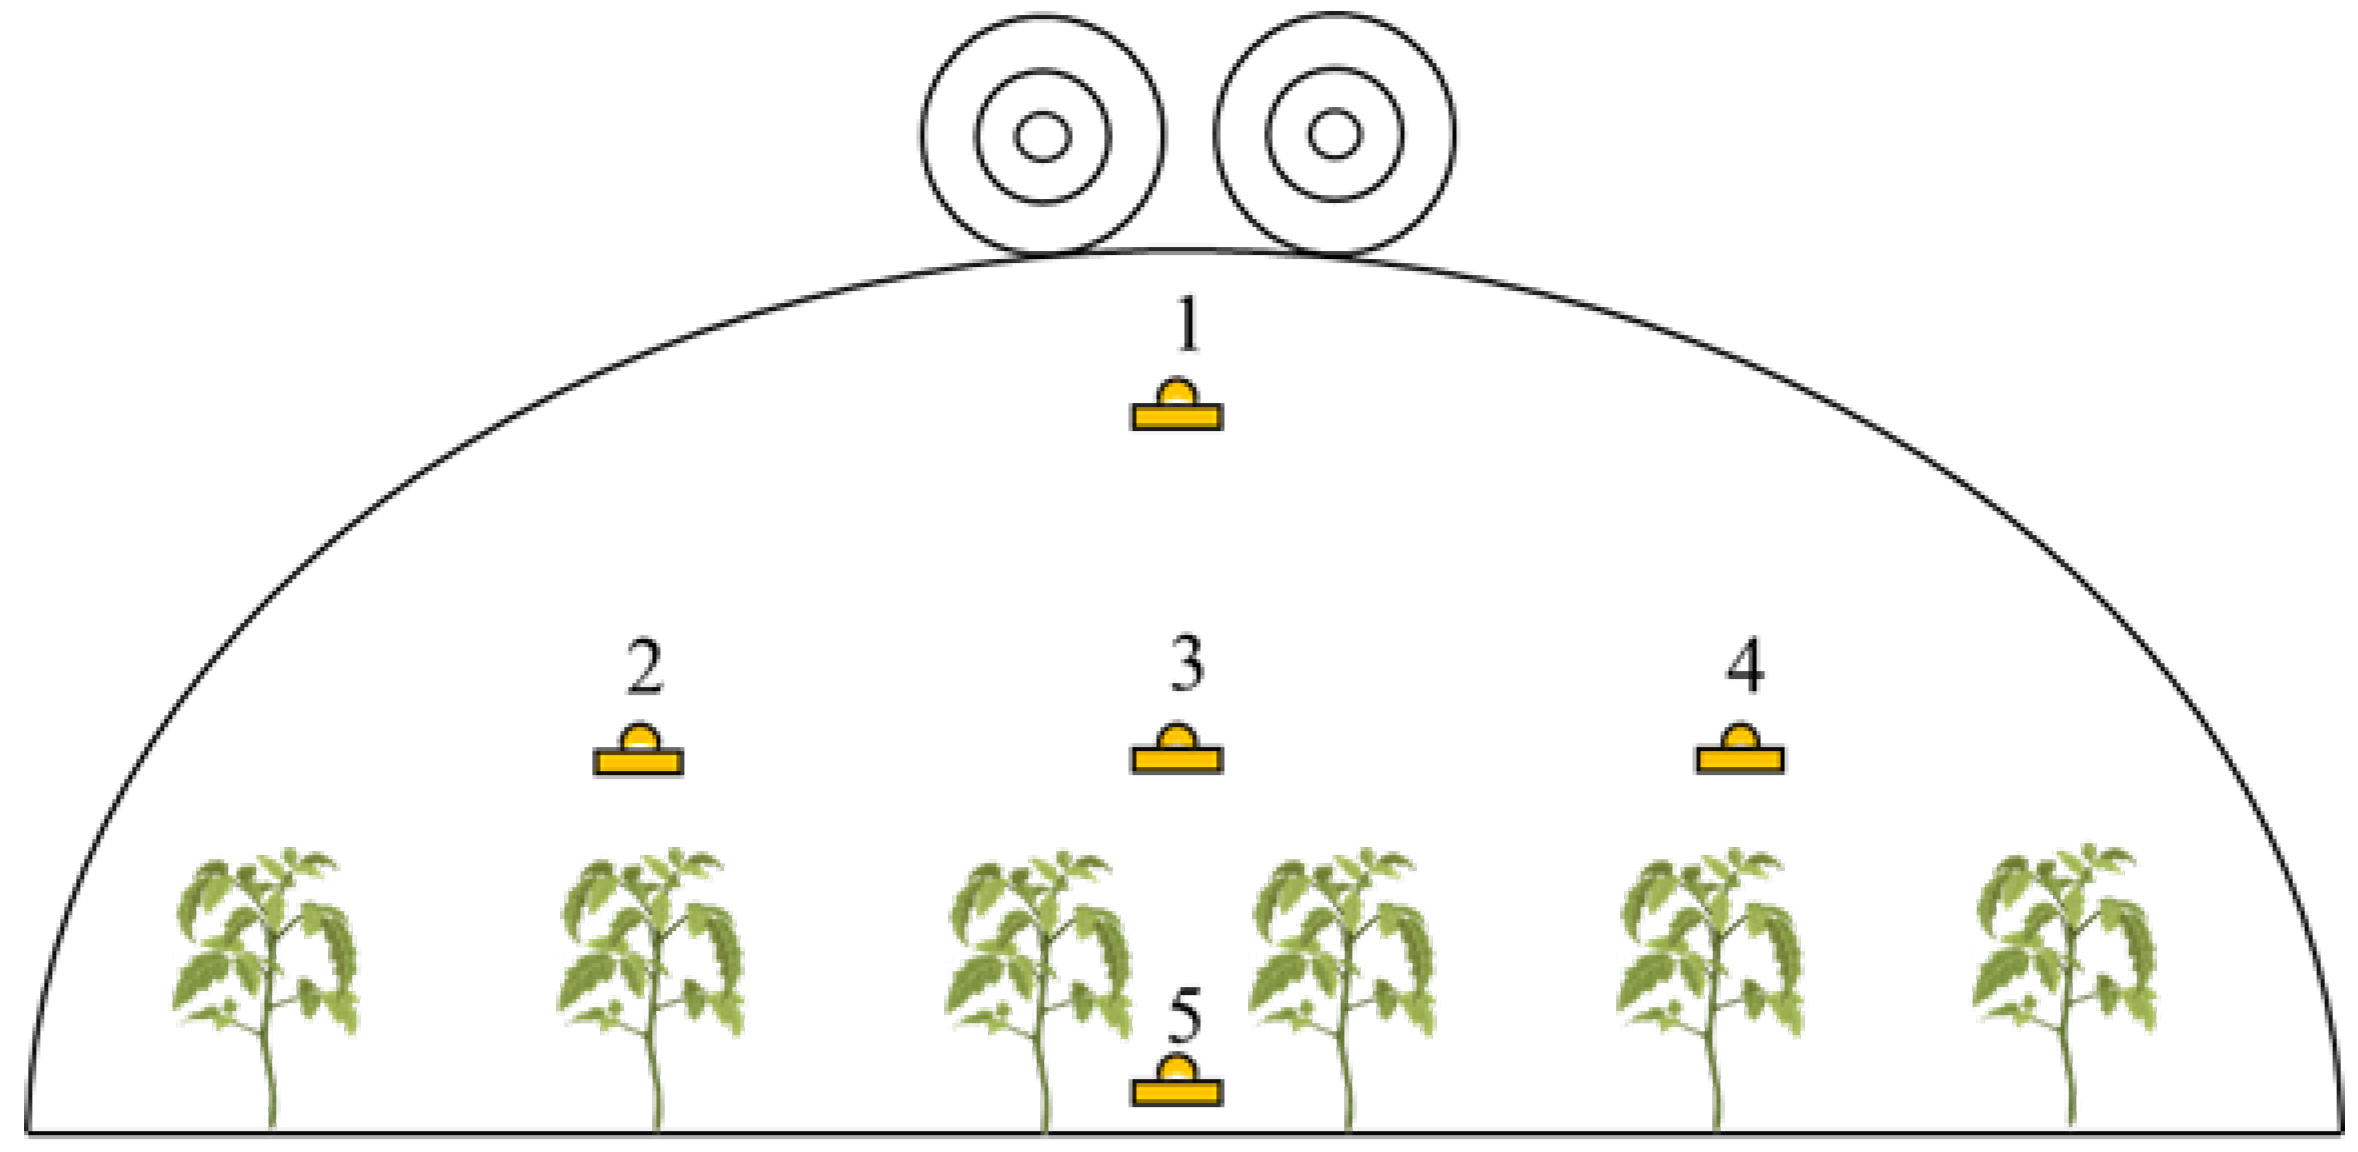
3. Experimental Setup

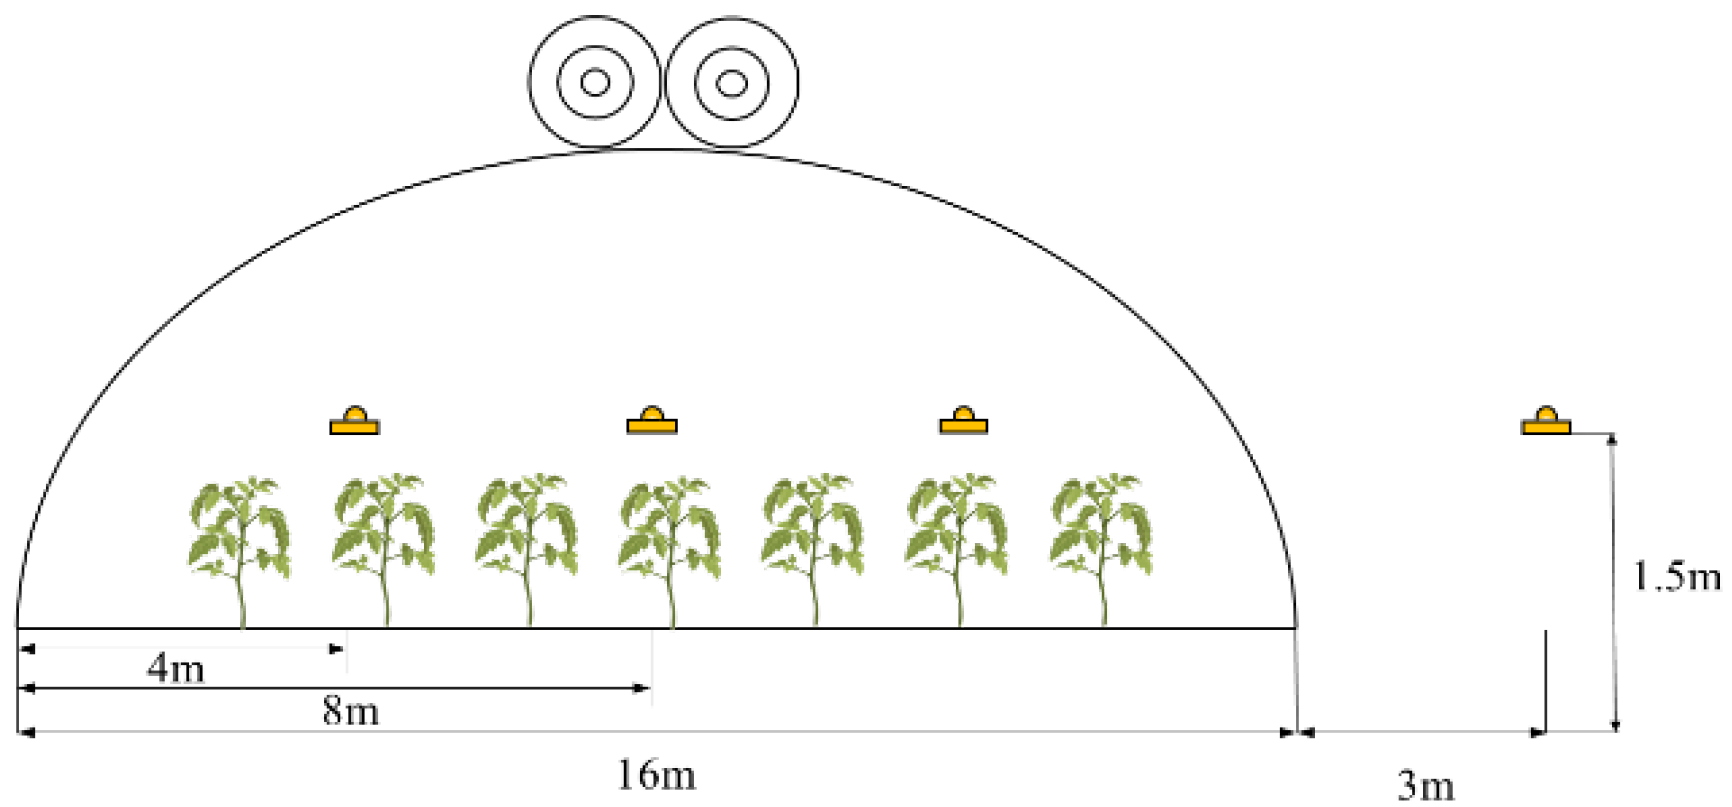
3.1. Experiment Design

To verify the reliability of the established solar radiation model, an experiment was performed from 12 December 2020 to 26 January 2021. And it was carried out at the N–S IPG in Cao County, Shandong (34.6° N, 115.5° E), as shown in Figure 9. The IPG is 70 m long (north–south) and 16 m wide (east–west), and the ridge is 5 m high. The azimuth of the greenhouse is 25° west of south. The transparent roof of the greenhouse is covered with EVC plastic film, an extra layer of silk wool insulation is added on the outside of the transparent film, and the thickness of the insulation blanket is 4 cm. The insulation blanket is rolled up at approximately 9:00 a.m. during the day to allow solar radiation to enter the IPG and put down at approximately 16:30 p.m. to reduce the heat dissipation of the transparent roof. The north–south gables are insulated with double-layer plastic film.
The indoor solar radiation observation points were arranged along the span direction of the greenhouse. The outdoor solar radiation sensor was located more than 3 m away from the IPG without shelter. And all the sensors were situated 1.5 m above the ground. The pyranometer’s radiation sensing plane was parallel to the greenhouse surface. The solar radiation was measured by pyranometer sensors (HOBO SLIB-M003, Onset Computer Crop, Cape Cod, MA, USA, accuracy: ±10 W/m2), and the data were collected by a HOBO data collector (Onset Company, Cape Cod, MA, USA) at an interval of 10 min. The sensor locations are shown in Figure 10.

3.2. Data Analysis

Maximum global solar radiation has an important impact on crop growth and morphology. By comparing the maximum value of indoor and outdoor solar radiation, the solar radiation transmittance of a greenhouse can be evaluated. And for IPG, solar radiation is its main source of heat. During the day, solar radiation enters the interior of the greenhouse through the transparent roof, and the surfaces of each envelope of the greenhouse receive and accumulate solar radiation so that it is converted into heat. Thus, maximum global solar radiation and daily cumulative radiation were selected as a key evaluation index of greenhouse solar radiation environment.
The captured global solar radiation amount entering IPG during the day is calculated as the following calculation:
I d a y = A i I i n
Ai is the surface area of each part of the greenhouse, and Iin is the daily accumulated amount of captured global solar radiation per square meter for each part of the greenhouse.
I i n = t 1 t 2 I E d t
t1 and t2 are the sunrise and sunset times, respectively.

3.3. Uncertainty Analysis

The experimental error consists of external and internal error. These errors were calculated as below:
(a)
Internal uncertainty (U1): Experimental error in term of percent uncertainty is determined using following relationship:
U 1 = σ 1 2 + σ 2 2 + + σ N 2 N
where σ 1 2 + σ 2 2 + + σ N 2 is the standard deviation of each set of observations; N is the total number of set of observations.
(b)
External uncertainty (U2): External uncertainty during the test were analyzed mainly considering the instrument uncertainties. Errors in measurement of solar radiation came from the pyranometer sensors and the data acquisition system. The pyranometer sensors together with the data logger were calibrated by National Institute of Metrology, China, before the experiment. And the least count of the sensors was 1.2 W/m2. The error in measuring greenhouse solar radiation was 5%.

4. Results and Discussion

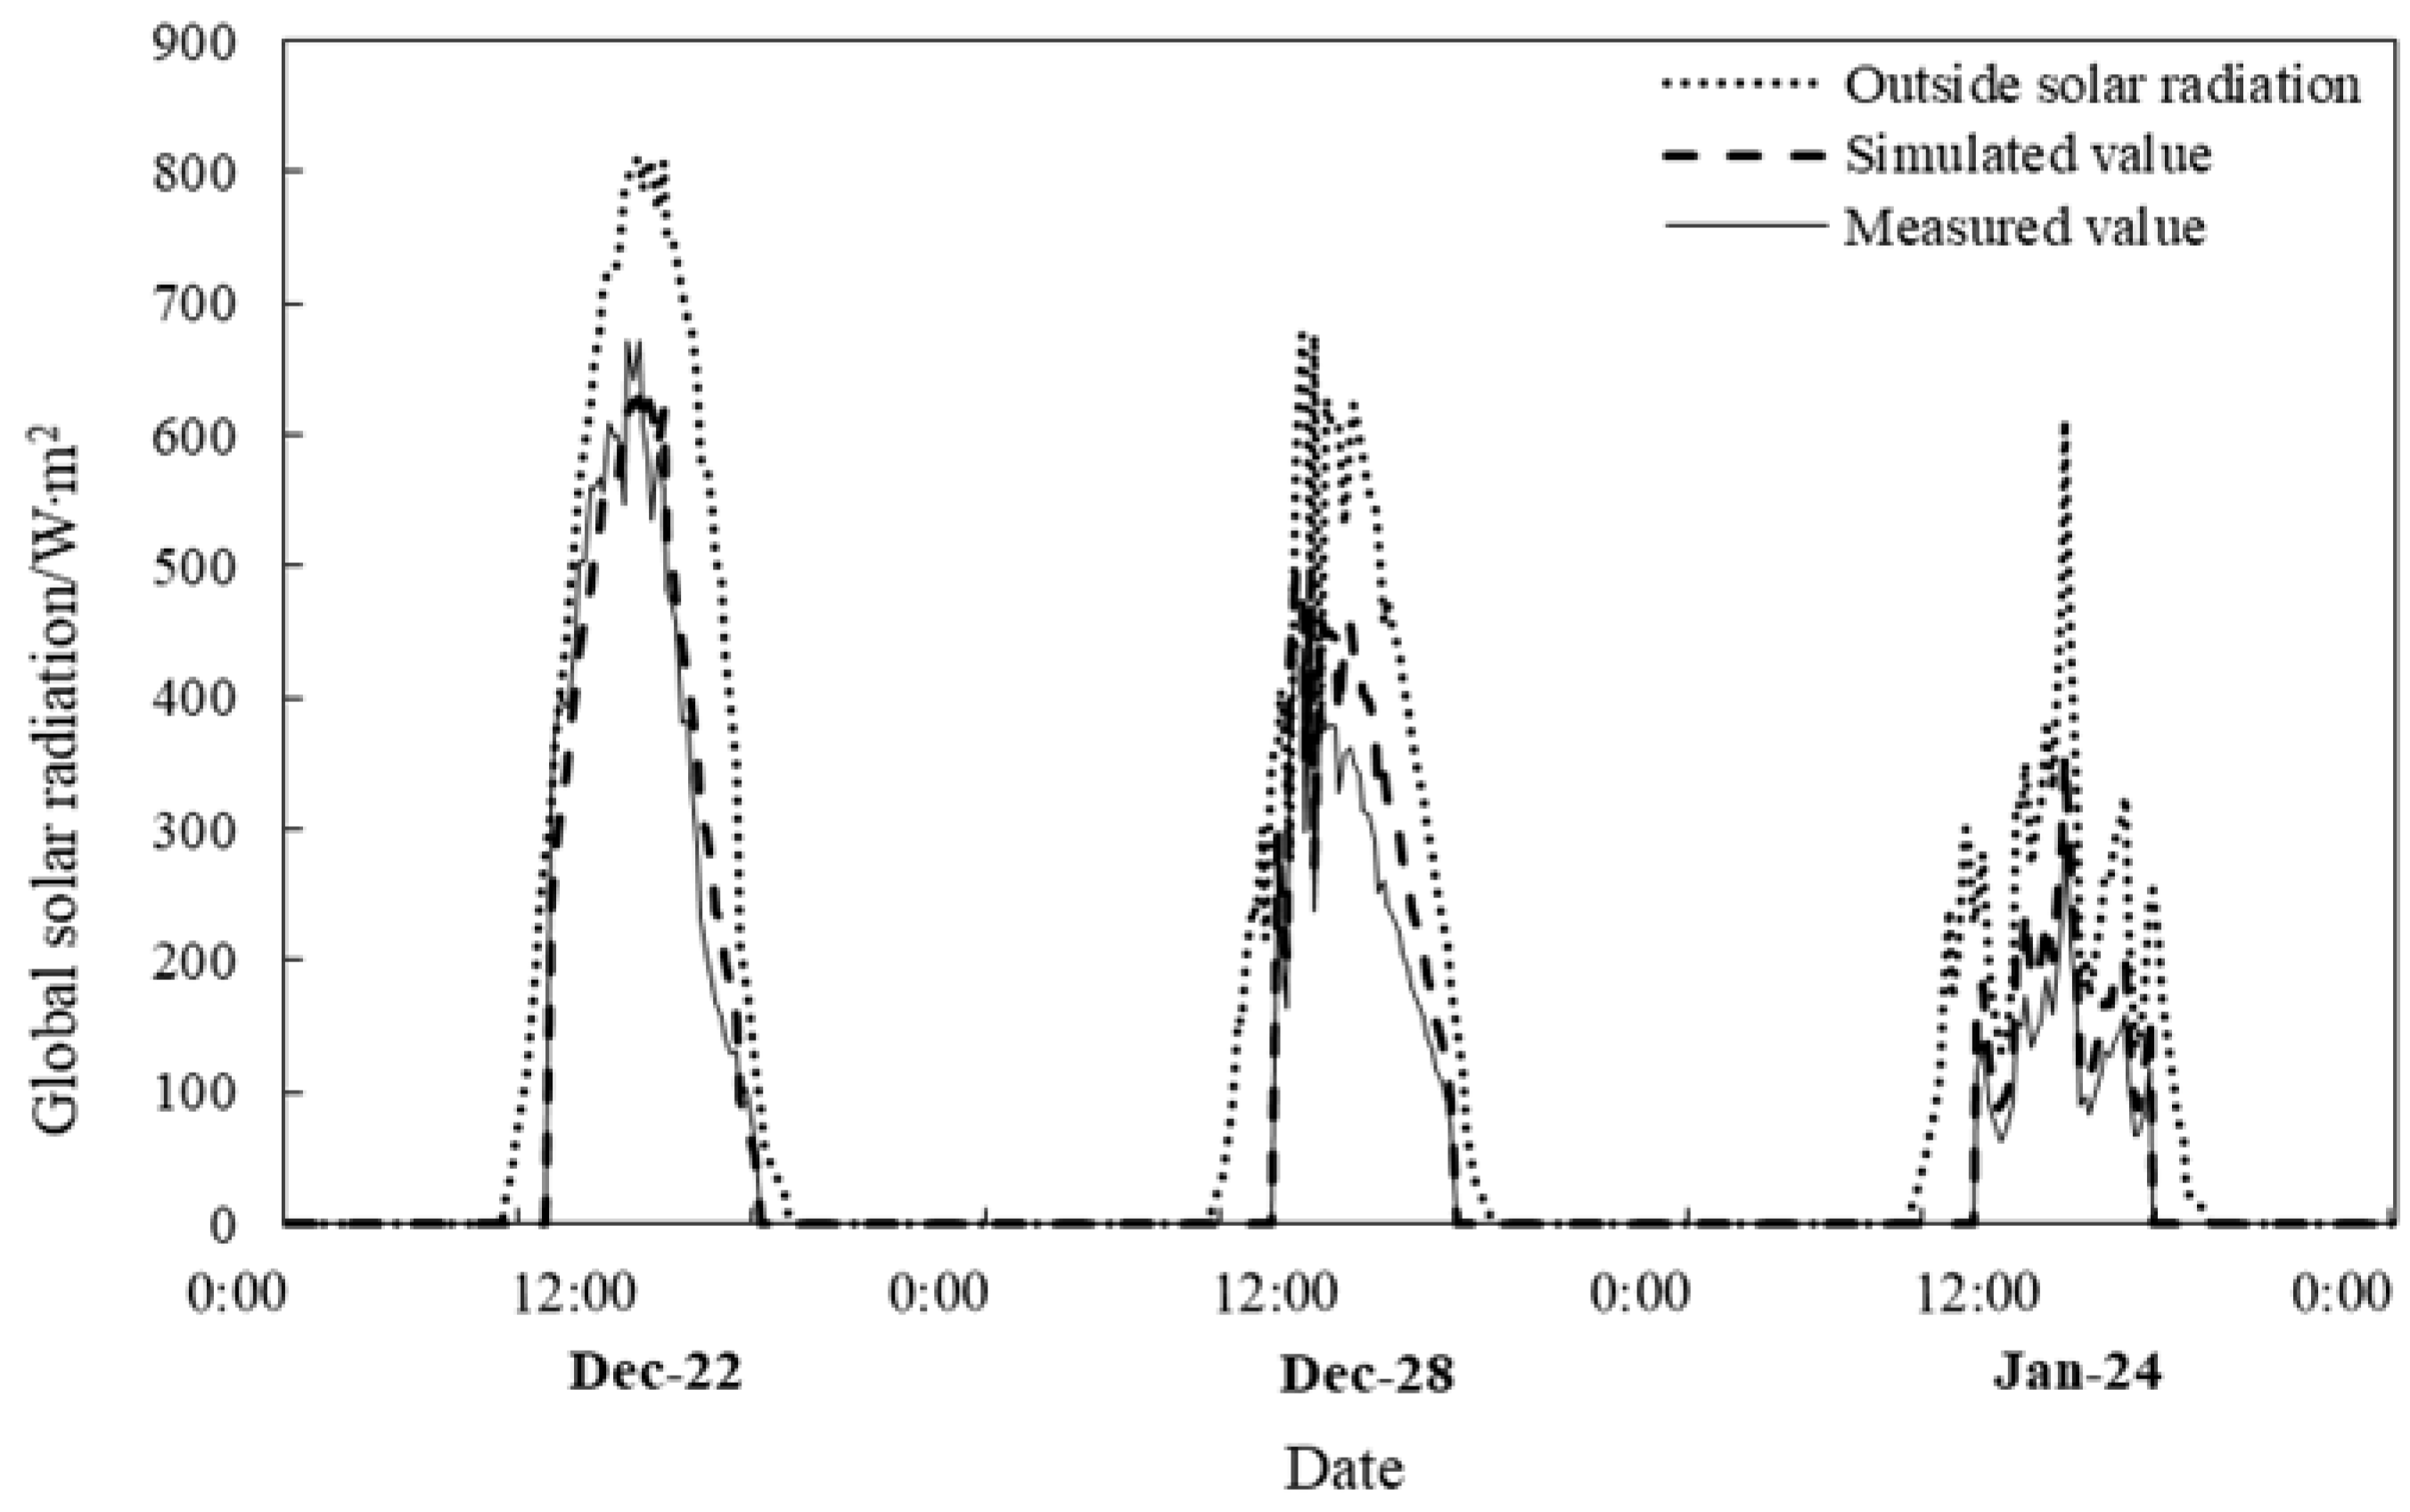
4.1. Model Validation

This paper took the N–S IPG as an example to simulate, verify, and apply solar radiation. The outside solar radiation is measured, and the inside solar radiation is obtained through calculation. To verify the accuracy of the model, four days of typical weather test data were selected for validation, including sunny day 22 December, cloudy day 28 December, and cloudy to rain day 24 January. Figure 11 shows the results of comparing the global solar radiation obtained from the model calculation and the measurement inside the experimental greenhouse in different weather conditions. From the results, the simulated and measured results matched well. The trends of the simulated and measured values are consistent. To evaluate the accuracy of the model, four evaluation metrics commonly used in solar radiation models are introduced [39], which are the mean bias error (MBE), mean absolute error (MAE), root mean square error (RMSE), and coefficient of determination (R2). They are calculated as shown in Equations (33)–(36), and the model test data are shown in Table 1. The maximum MBE is 15.6 W·m−2, the maximum MAE is 15.6 W·m−2, and the maximum RMSE is 32.5 W·m−2. The R2 of the model ranges from 0.90 to 0.98. These results indicated that the model was reliable.
M B E = 1 n i = 1 n I c I m
M A E = 1 n i = 1 n I c I m
R M S E = 1 n i = 1 n I c I m 2
R 2 = 1 i = 1 n I m I c 2 i = 1 n I m I ¯ 2
where the Ic is the simulated value of solar radiation, W/m2. Im is the measured value of solar greenhouse, W/m2. I ¯ is the average value of measured solar radiation, W/m2. n is the total number of solar radiation data in one day.
On sunny days, the indoor measured daily cumulative radiation is 17.4 kW∙m−2, and the simulated daily cumulative radiation is 17.6 kW∙m−2. The difference between them is 0.2 kW∙m−2, which is 1.1% of the measured value. On cloudy days, the measured daily cumulative radiation is 12.2 kW∙m−2, and the simulated one is 10.8 kW∙m−2. The difference between them is 1.4 kW∙m−2, which is 11.5% of the measured value. And on cloudy to rainy days, the measured daily cumulative radiation is 0.6 kW∙m−2, and the simulated one is 0.51 kW∙m−2. The difference between them is 0.09 kW∙m−2, which is 15.0% of the measured value. By comparing the simulated and measured solar radiation under different weather conditions, it can be found that the difference between the measured and simulated daily cumulative radiation accounts for a larger percentage as the cloudiness increases. This is caused by the effect of cloudiness on the direct scattering separation of solar radiation. The amount of diffuse solar radiation increases with higher cloudiness in the sky, but the simulated value of diffuse solar radiation in the model is small for this case.

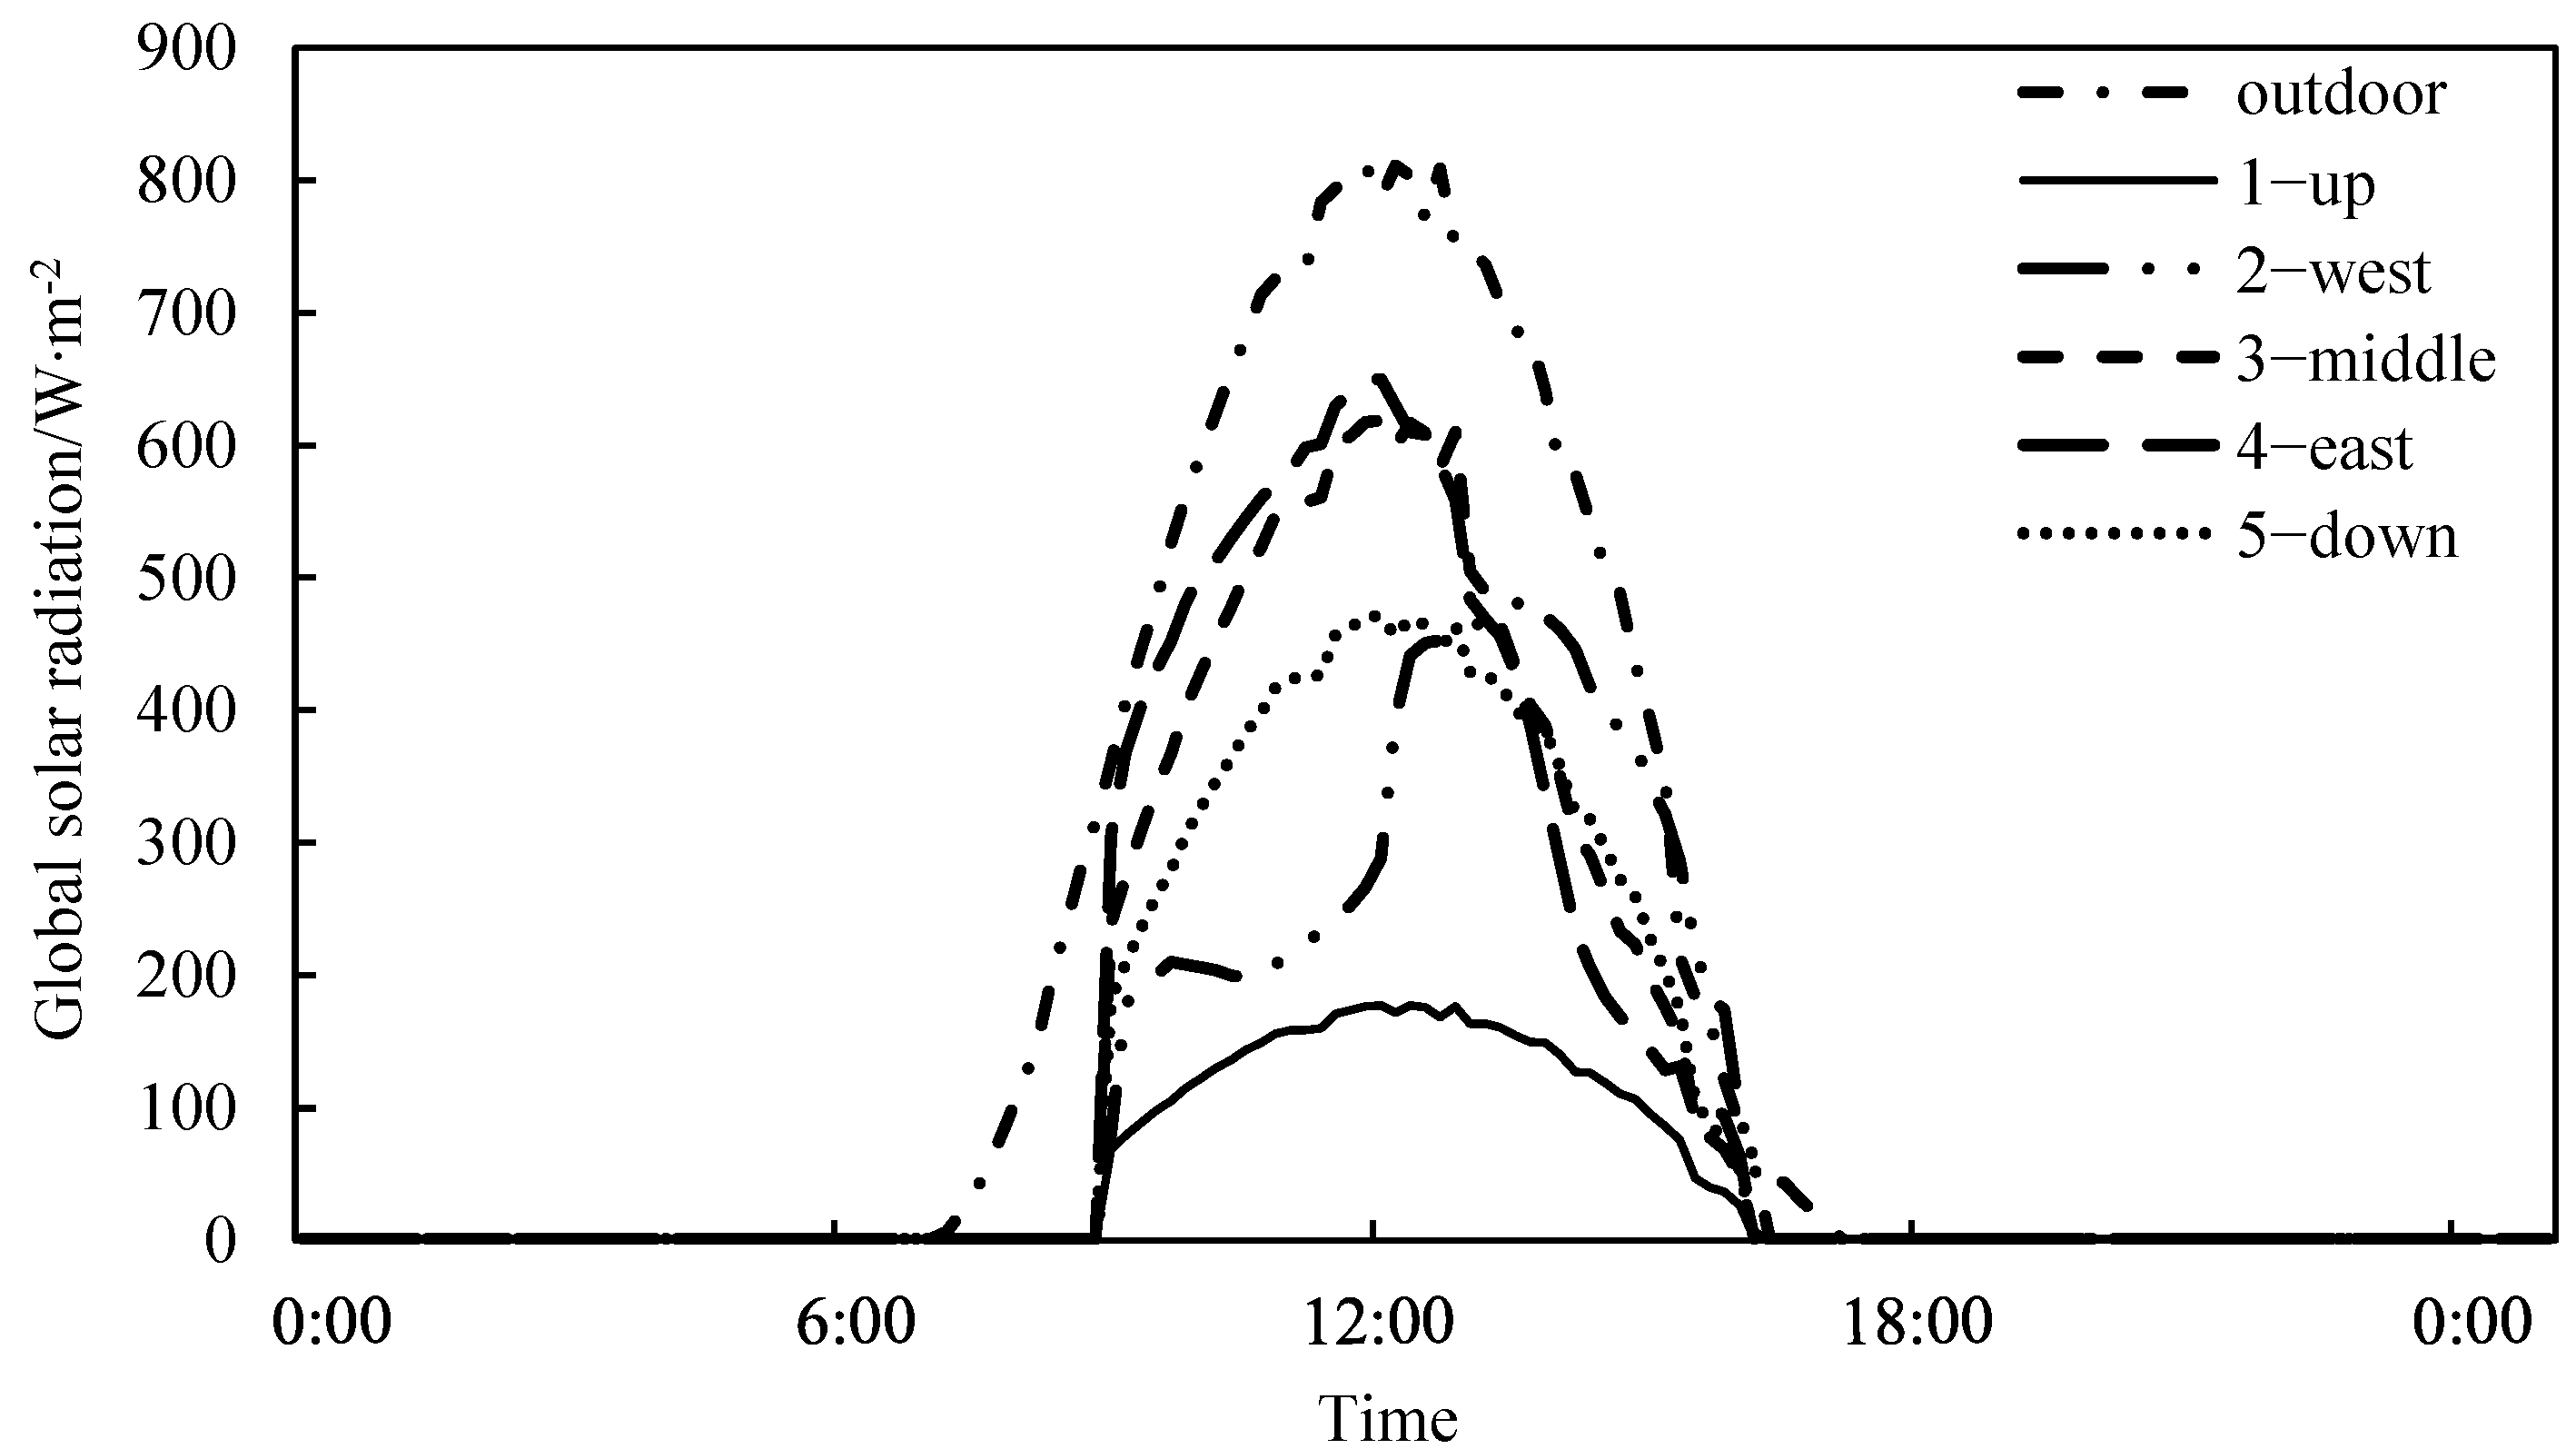
4.2. Analysis of the Solar Radiation Distribution

Based on the model, the distribution of solar radiation in the greenhouse under sunny conditions is simulated and analysed by taking an N–S IPG with an azimuth of 0° in Shandong as an example. The solar radiation at different locations inside the N–S IPG cross-section was simulated, as shown in Figure 12. Point 1 is located at the top of the greenhouse, below the insulation blanket; points 2, 3, and 4 are located above the crop canopy; and point 5 is located at the bottom of the crop canopy. The simulation results are shown in Figure 13. Figure 13 shows that the solar radiation at each point is different in the height direction of the greenhouse. Point 1 has the weakest solar radiation due to the effect of insulation blanket shading and only receives diffuse solar radiation from other components in the greenhouse. Its maximum solar radiation is 177 W∙m−2 and is smaller than that at point 3 by 442 W∙m−2. Its daily cumulative radiation per square meter of cultivated area in the greenhouse is 5.7 kW∙m−2, which is smaller than that of point 3 by approximately 67.9%. Since point 3 is only affected by the transmittance of the transparent roof, the solar radiation is strongest at that point. Its maximum solar radiation is 619 W∙m−2, and the daily cumulative radiation is 17.3 kW∙m−2. According to the model assumption conditions, the crop canopy in the greenhouse is a semi-transparent layer, so after absorption and reflection by the crop canopy, the intensity of solar radiation at point 5 becomes weaker than that at point 3. The maximum solar radiation at point 5 is 471 W∙m−2, which is approximately 148 W∙m−2 less than the maximum solar radiation at point 3. The daily cumulative radiation is 14.5 kW∙m−2, which is smaller than that of point 3 by approximately 16.7%.
Regarding the width of the greenhouse, the result shows that the difference in the span direction of the greenhouse is also greater. The maximum solar radiation on the east side is 650 W∙m−2 at approximately 12:00 noon. The maximum solar radiation in the middle of the greenhouse is 619 W∙m−2 at approximately 12:10 p.m. The maximum solar radiation on the west side is 486 W∙m−2 at approximately 1:00 p.m. The maximum difference in solar radiation between the east and west sides is 386 W∙m−2, and the average difference is 211 W∙m−2. Similarly, the daily cumulative radiation differs between the east and west sides. The daily cumulative radiation was 17.8 kW∙m−2, 17.3 kW∙m−2, 13.3 kW∙m−2, with the east side being larger than the west sides by approximately 33.3%. Therefore, for the N–S IPG, the uniformity of the solar radiation distribution along the east–west direction is poor. The most important reason for analyzing this phenomenon, in addition to the shape of the transparent roof of the IPG and the orientation and latitude of the greenhouse, is the influence of the shadows caused by the thermal insulation blanket on top of the IPG. Based on this phenomenon, producers can grow crops in a north–south monopoly orientation. This not only allows the crop to receive solar radiation evenly. Moreover, the longer length of the north–south monopoly orientation is more conducive to the operation of agricultural machinery in greenhouses [40], thus giving full play to the role of agricultural machinery in greenhouses and promoting the development of greenhouse production toward intensification and scale [40].

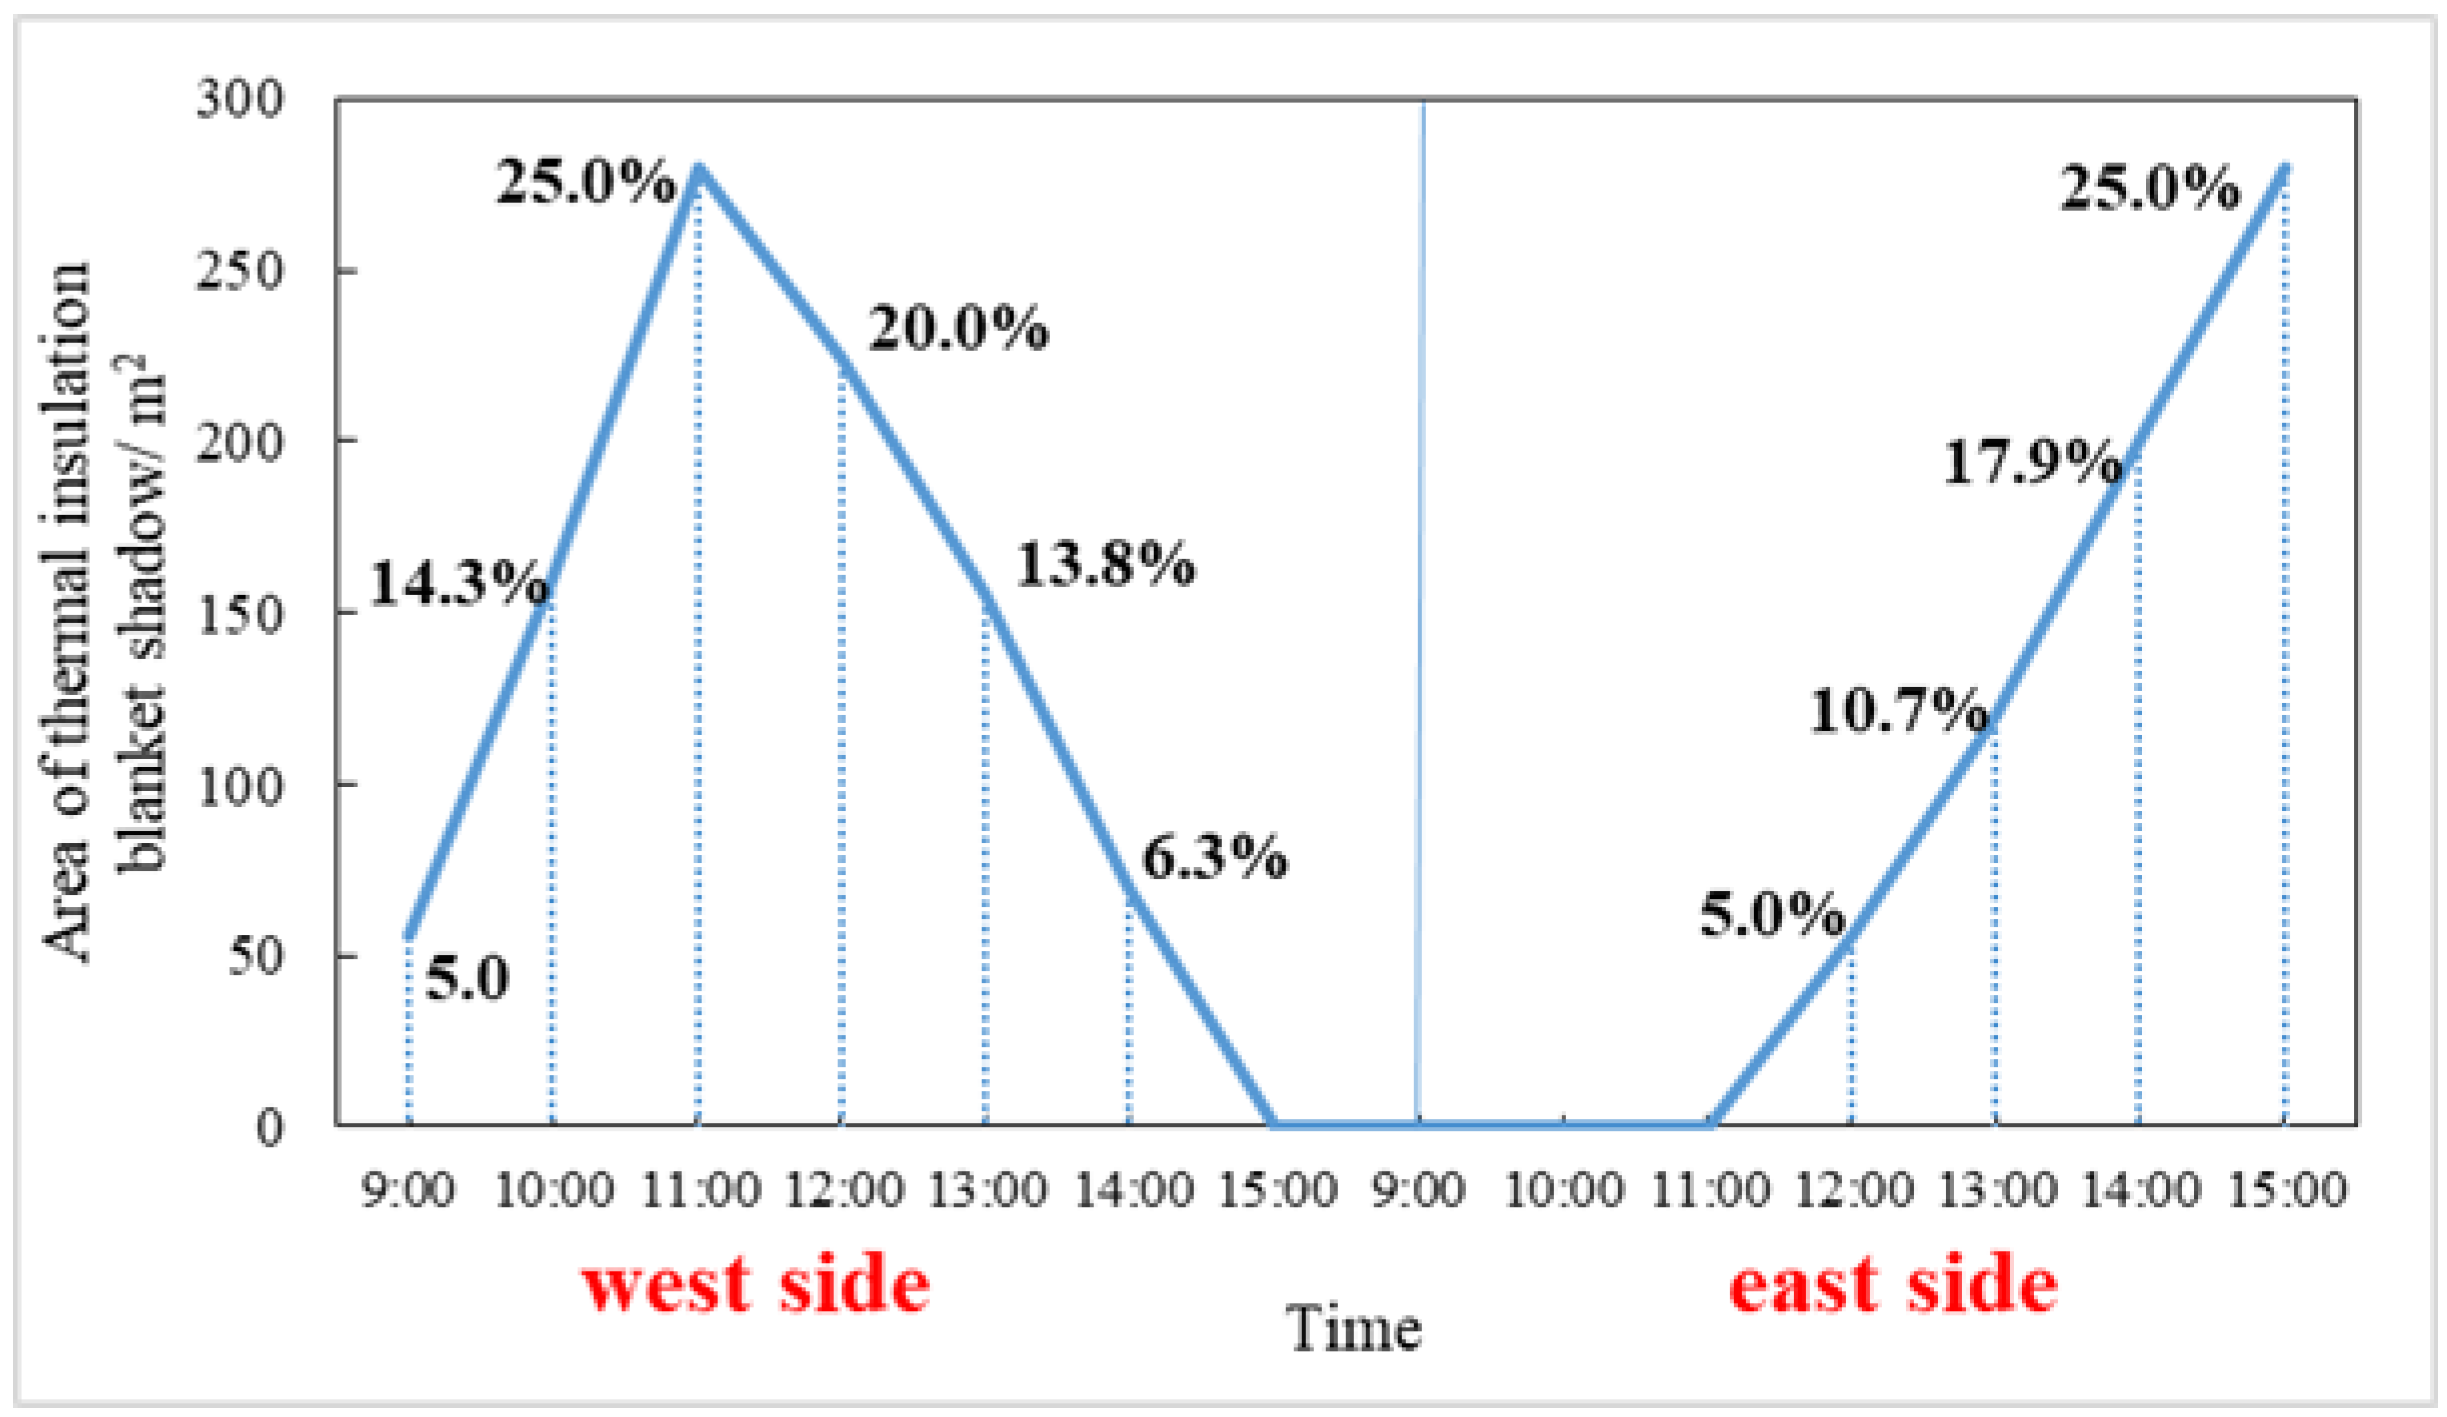
4.3. Influence of Shadows Caused by Insulation Blankets on Solar Radiation

According to Equations (14)–(17), the width of the insulation blanket when rolled up on both sides is assumed to be 4 m. The simulation results are shown in Figure 14. The shading of the insulation blanket on top of the IPG has a significant effect on the global solar radiation captured in the greenhouse. The size and position of the insulation blanket shading varies with time. At approximately 9:00 a.m., when the insulation blanket is rolled up, the shading caused by the blanket blocks the reception of direct solar radiation in the greenhouse cultivation area. At this time, the area shaded by the blanket was minimal due to the small solar altitude angle. Subsequently, the shaded area of the blanket gradually increased until approximately 11:30 a.m. Prior to this time, the shadows were all located on the west side of the greenhouse, and the shaded area was 5.2 m wide, with a shaded area of up to 32.5% of the cultivated area in the greenhouse. At noon, the shadow area cast by the blanket was equal to the width of the blanket fixed on the greenhouse roof. The width of the shaded area was 4 m, and the shaded area was 25.0% of the cultivated area in the greenhouse. In the afternoon, the shade gradually shifted to the east side of the greenhouse.
According to the simulation results, the maximum solar radiation top of the shaded crop canopy is only 289 W∙m−2, which is 43.1% of the maximum solar radiation indoors. Although the thermal insulation blanket shading affects the maximum solar radiation in the shaded area, since the location of the shading moves with time, the daily cumulative radiation in the western area of the worst solar radiation in the IPG reaches 13.1 kW∙m−2 even under the influence of blanket shading. Through the above calculation and analysis, it can be seen that since the shadow band of the blanket moves in the greenhouse during the daytime, it has a direct impact on the solar radiation inside the greenhouse. This leads to a reduction of 2.9–4.9 kW∙m−2 in the daily cumulative radiation in the greenhouse. In terms of indirect effects, the soil absorbs solar radiation during the day to store heat and releases this heat at night to keep the air temperature in the greenhouse at a high level. If the amount of solar radiation entering the greenhouse decreases during the day, less heat will be stored in the soil, and less heat will be released from the soil at night, which will not maintain the air temperature inside the greenhouse at a high level, thus affecting crop growth. According to the study [41], if the soil absorbs this part of the lost solar radiation to increase its own temperature, the average temperature rise of the soil in the greenhouse can be calculated according to Equation (37):
Δ t = Q d a y , l o s s α s τ p V s γ s C s
where the ∆t is the average temperature rise of the soil in the greenhouse, °C. αs is the soil absorption rate. τp is the crop layer transmission rate. Vs is the volume of soil, m3. γs is the soil wet bulk density, kg/m3. Cs is the soil specific heat capacity, W/(kg∙m3).
For the experimental IPG, taken αs = 0.7, τp = 0.3, Vs = 560 m3, γs = 1530 kg/m3, Cs = 0.58 W/(kg∙m3), when the daily cumulative radiation decreases by 2.9–4.9 kW∙m−2, the soil temperature inside the greenhouse will decrease by 0.7–1.1 °C. Currently, the greenhouse layout is usually laid out in such a way that the middle of the greenhouse is used as a management walkway to overcome part of the effect of blanket shading on growing crops. However, the effect of blanket shading on both sides still cannot be ignored. Therefore, there is a need to develop new rolling methods and equipment to reform the existing rolling up and placing methods, which is an urgent problem to be solved in production practice.

4.4. Influence of Height–Span Ratio on Solar Radiation

The ratio of greenhouse height to span determines the shape of the greenhouse transparent roof, and the shape of the greenhouse transparent roof is related to the inclination of the roof and the incidence angle of sunlight. Three combinations of height and span were selected for simulation and analysis (simulating a point in the middle of the east side of the greenhouse at a height of 1.5 m). Figure 15 shows that when the span is certain, the higher the height, the greater the daily cumulative radiation and the maximum solar radiation in the IPG. This is because when the span is the same, the higher the height, the greater the inclination angle of the greenhouse transparent roof, the greater the solar incident angle, so the more solar radiation captured by the surface of each enclosure structure. And the larger the span, the more obvious the advantages brought by the increase of height.
When the height is constant, the larger the span, the smaller the accumulated daily solar radiation. This was because when the height of the greenhouse was certain, the larger the span, the smaller the inclination angle of the transparent roof, the smaller the incident angle of the sun light, then the maximum solar radiation and the accumulated daily solar radiation was smaller, and the worse the indoor solar radiation. When the height of the greenhouse was 6 m, the difference between the span of 14–18 m was not significant, and its reduction was between 0.8–2.3%. And the reduction increased to 3.2%, when the span was greater than 18 m. When the height was 5 m, the variability of the span between 14–16 m was not significant, with a reduction of about 1.5%. While after the span was greater than 16 m, its reduction increased to 3.1%. And the variability was not significant between spans of 16–20 m. When the height was 4 m, the reduction was 3.7% after the span was greater than 14 m. And the reduction was between 2.1–2.2% for the span between 16–20 m.
Therefore, it can be seen that for IPG with a height of 6 m, the optimal span range is 14–18 m, and the range of the height–span ratio is 0.34–0.43; for IPG with a height of 5 m, the optimal span range is 14–16 m, and the range of the height–span ratio is 0.31–0.35; for IPG with a height of 4 m, the optimal span range is less than 14 m, and the range of the height–span ratio is less than 0.29.

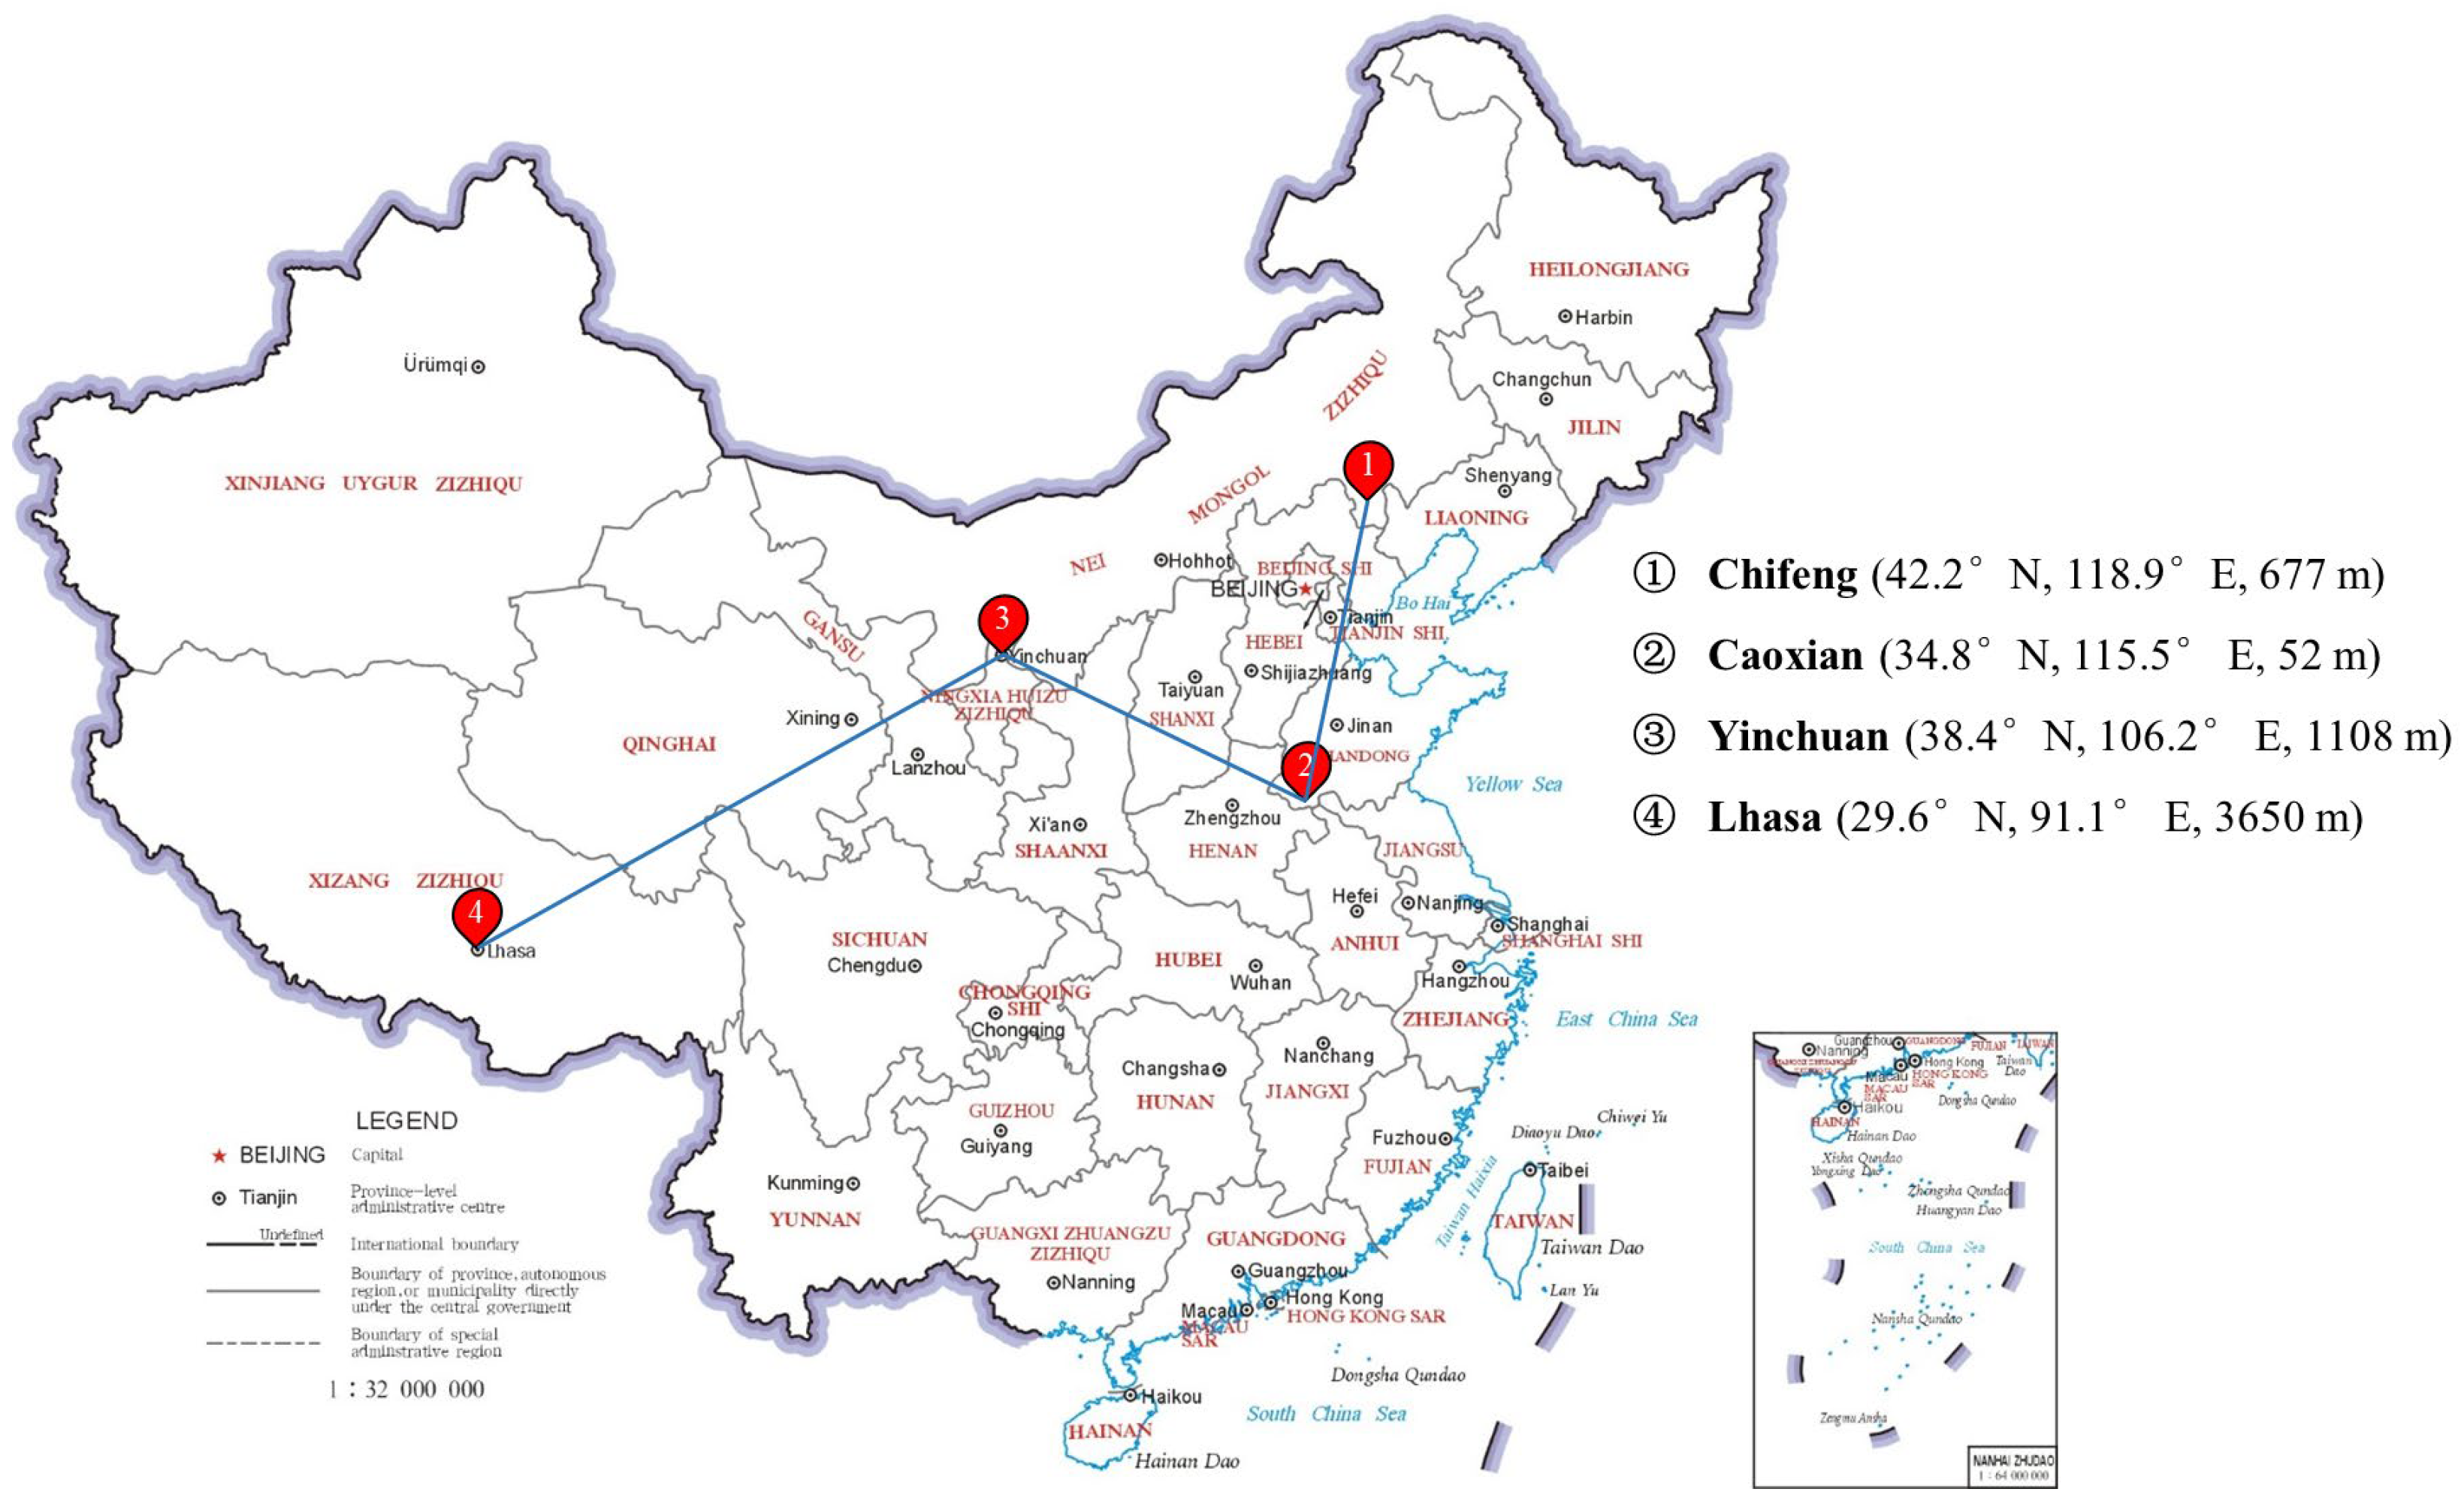
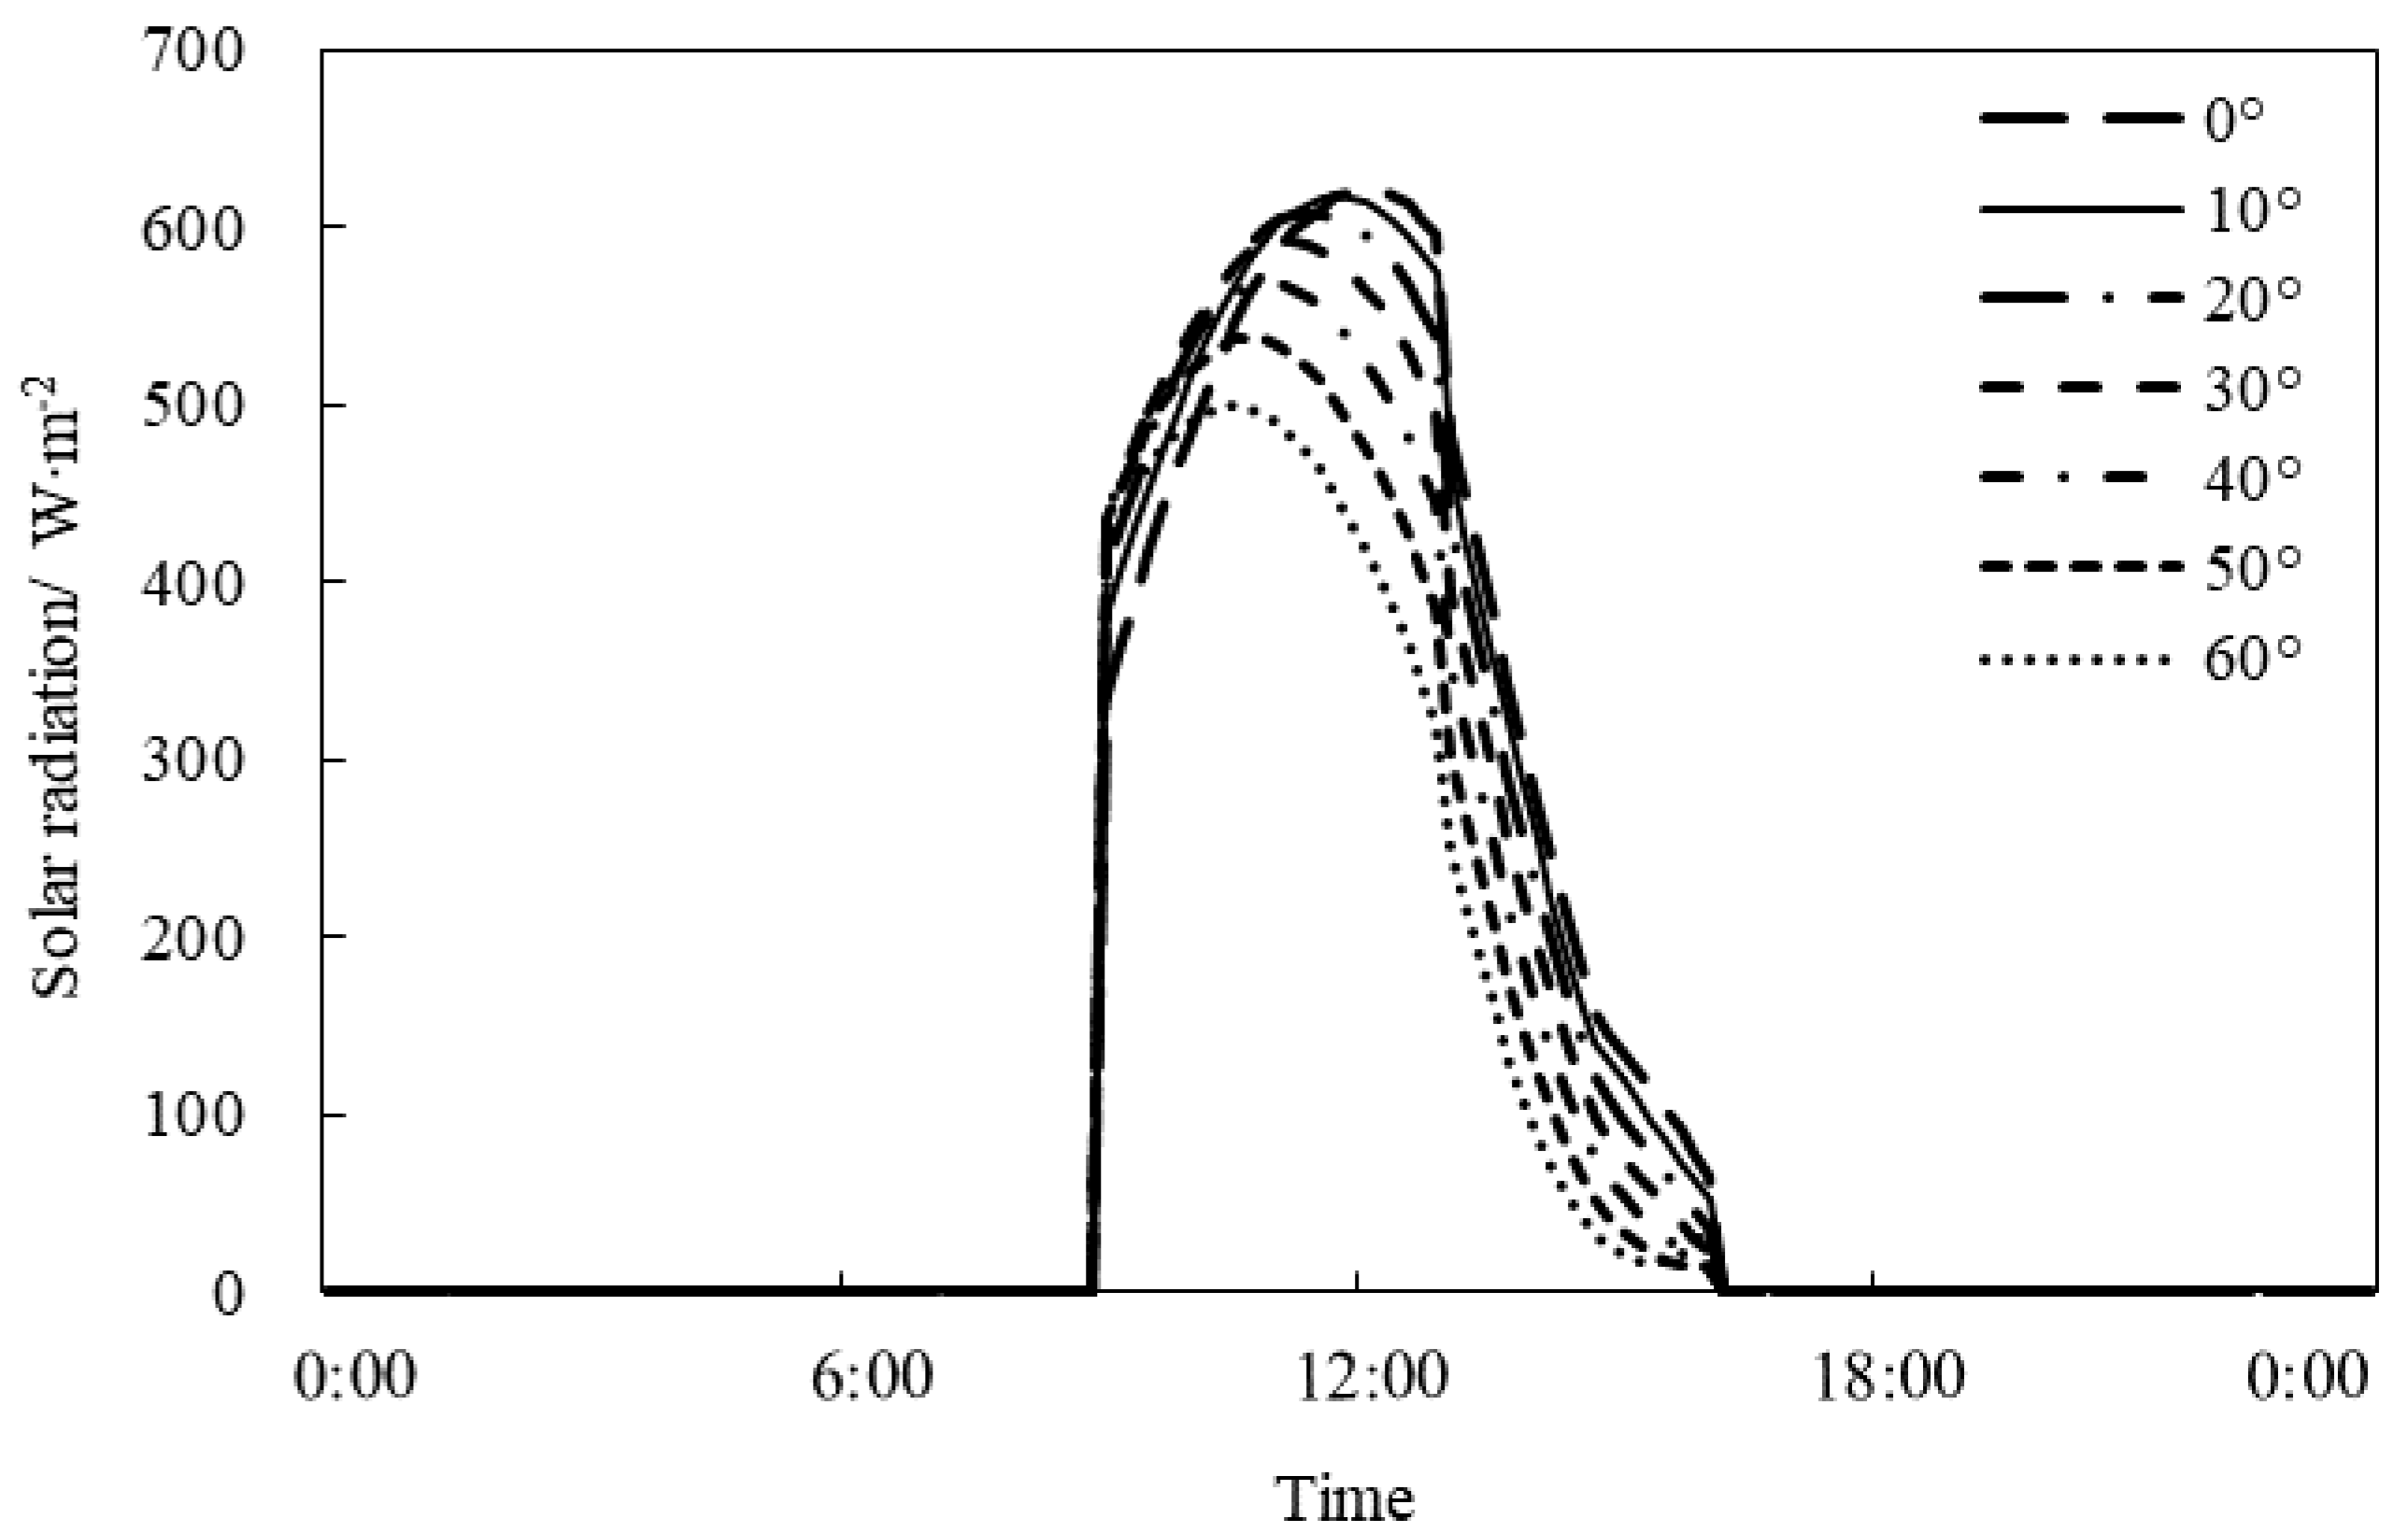
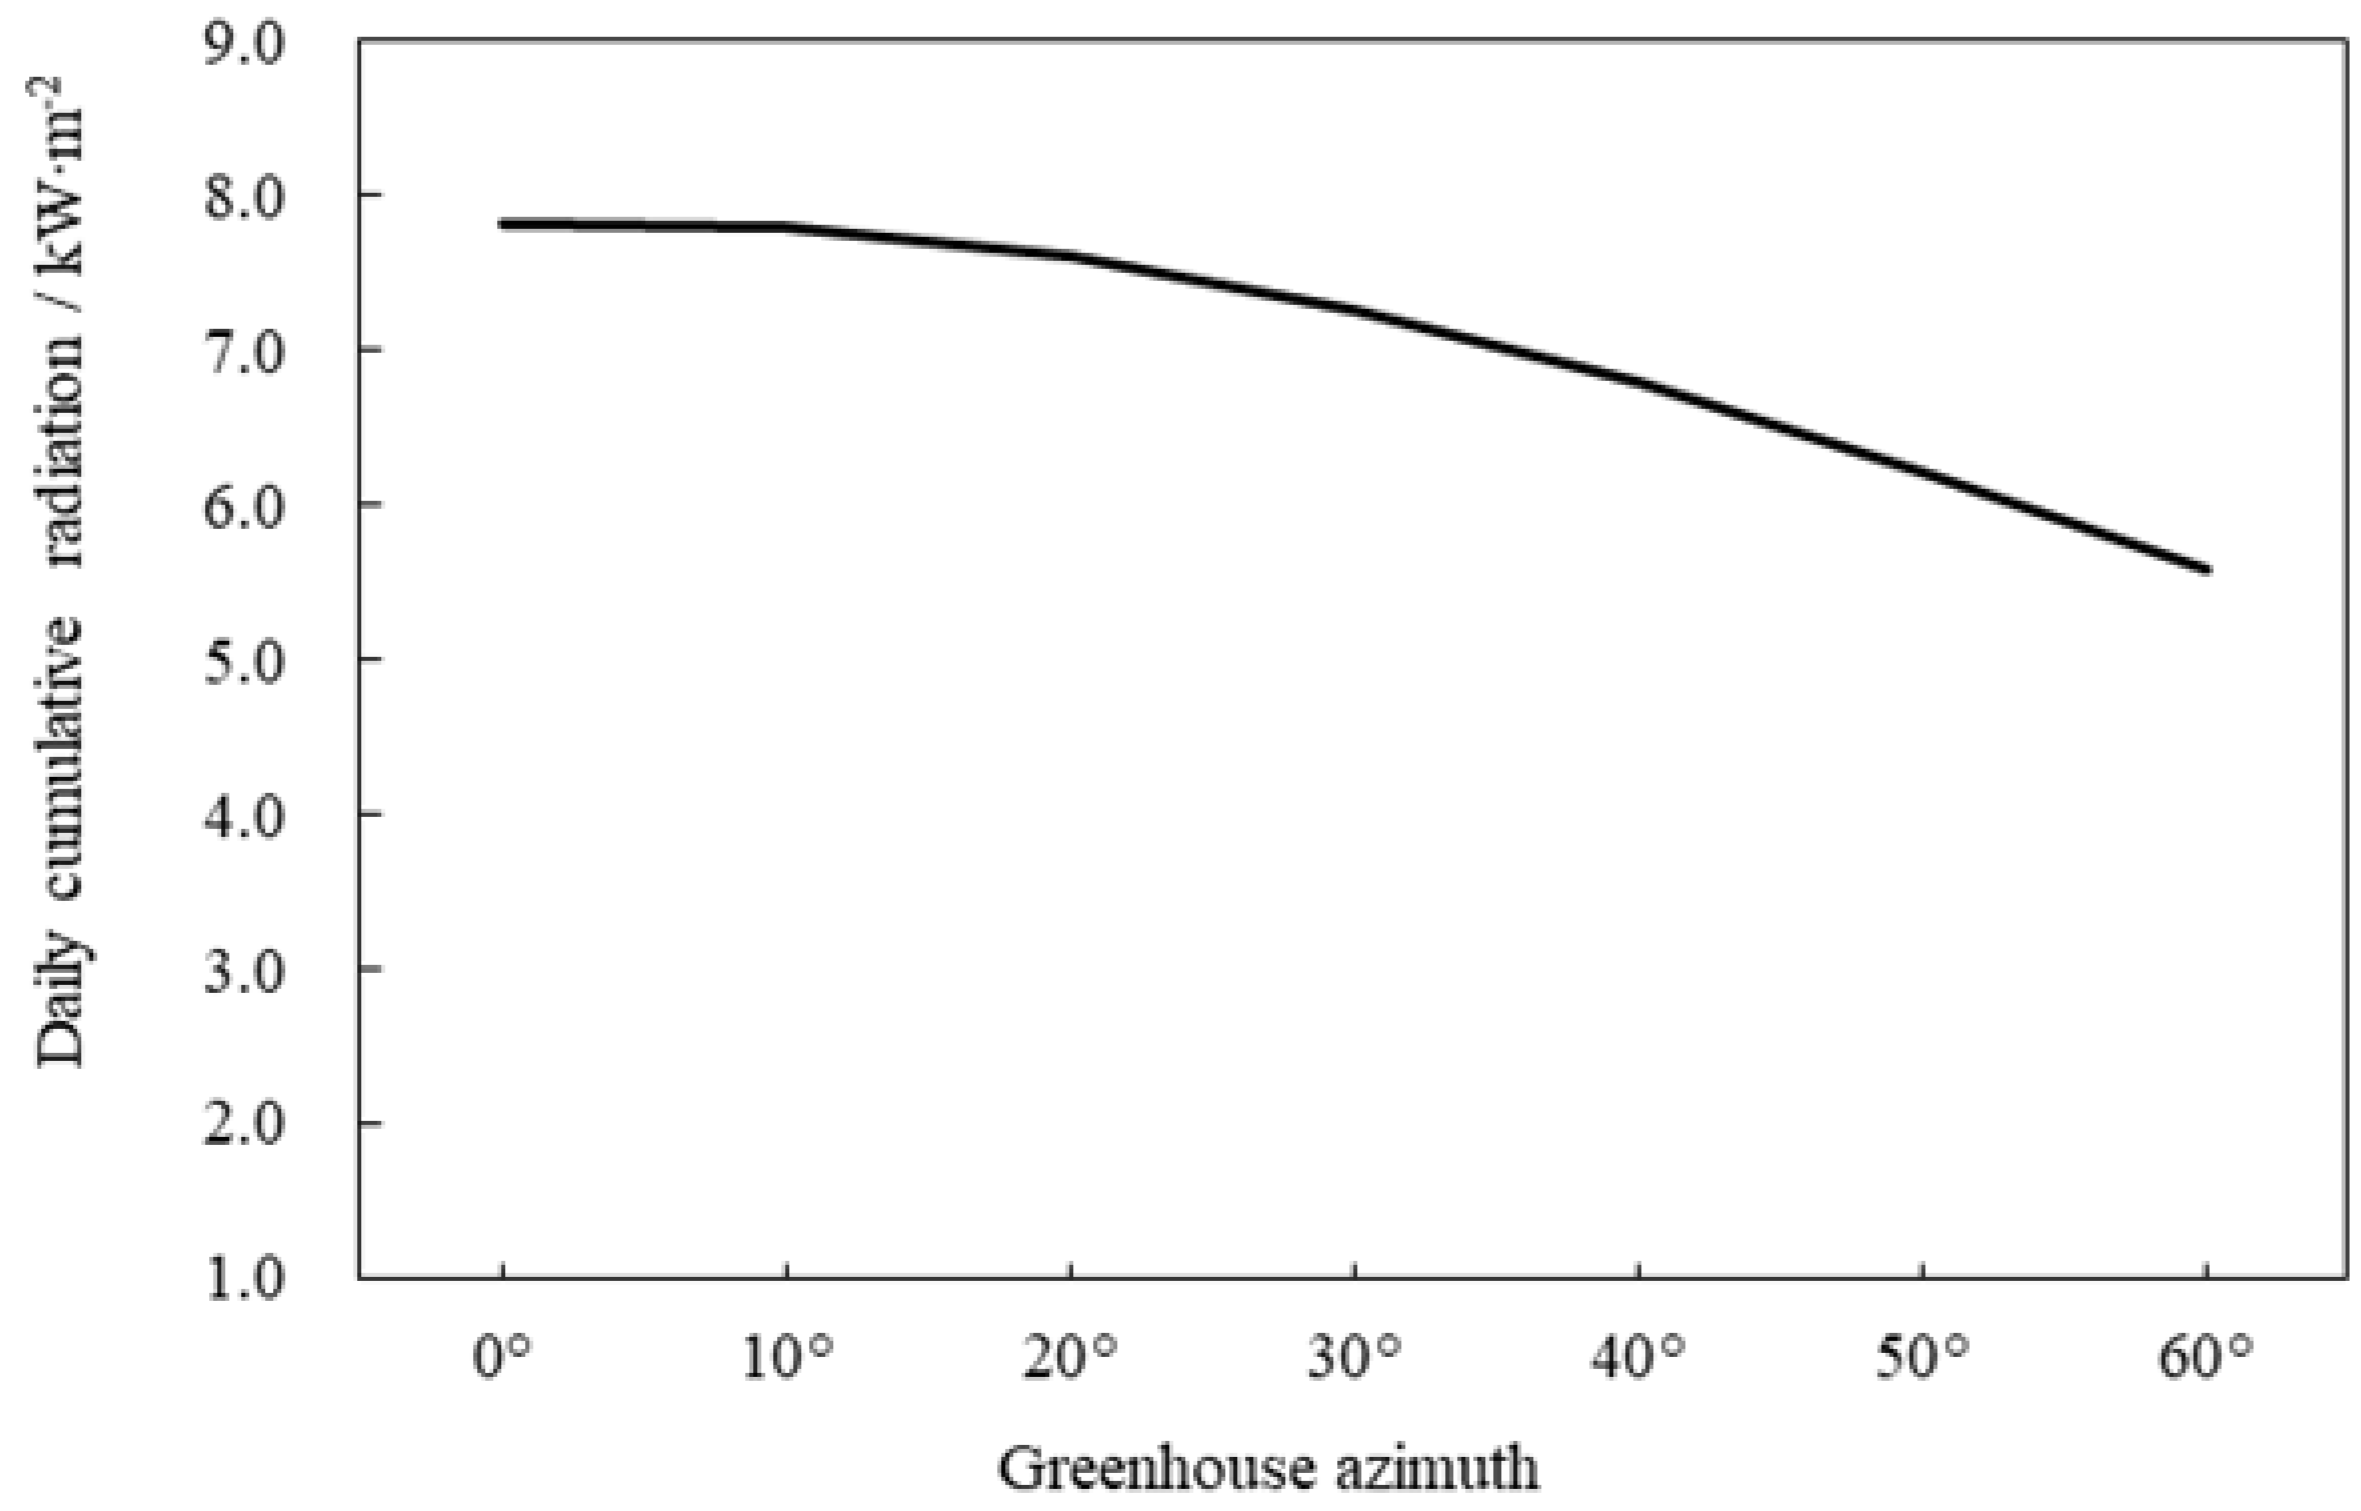
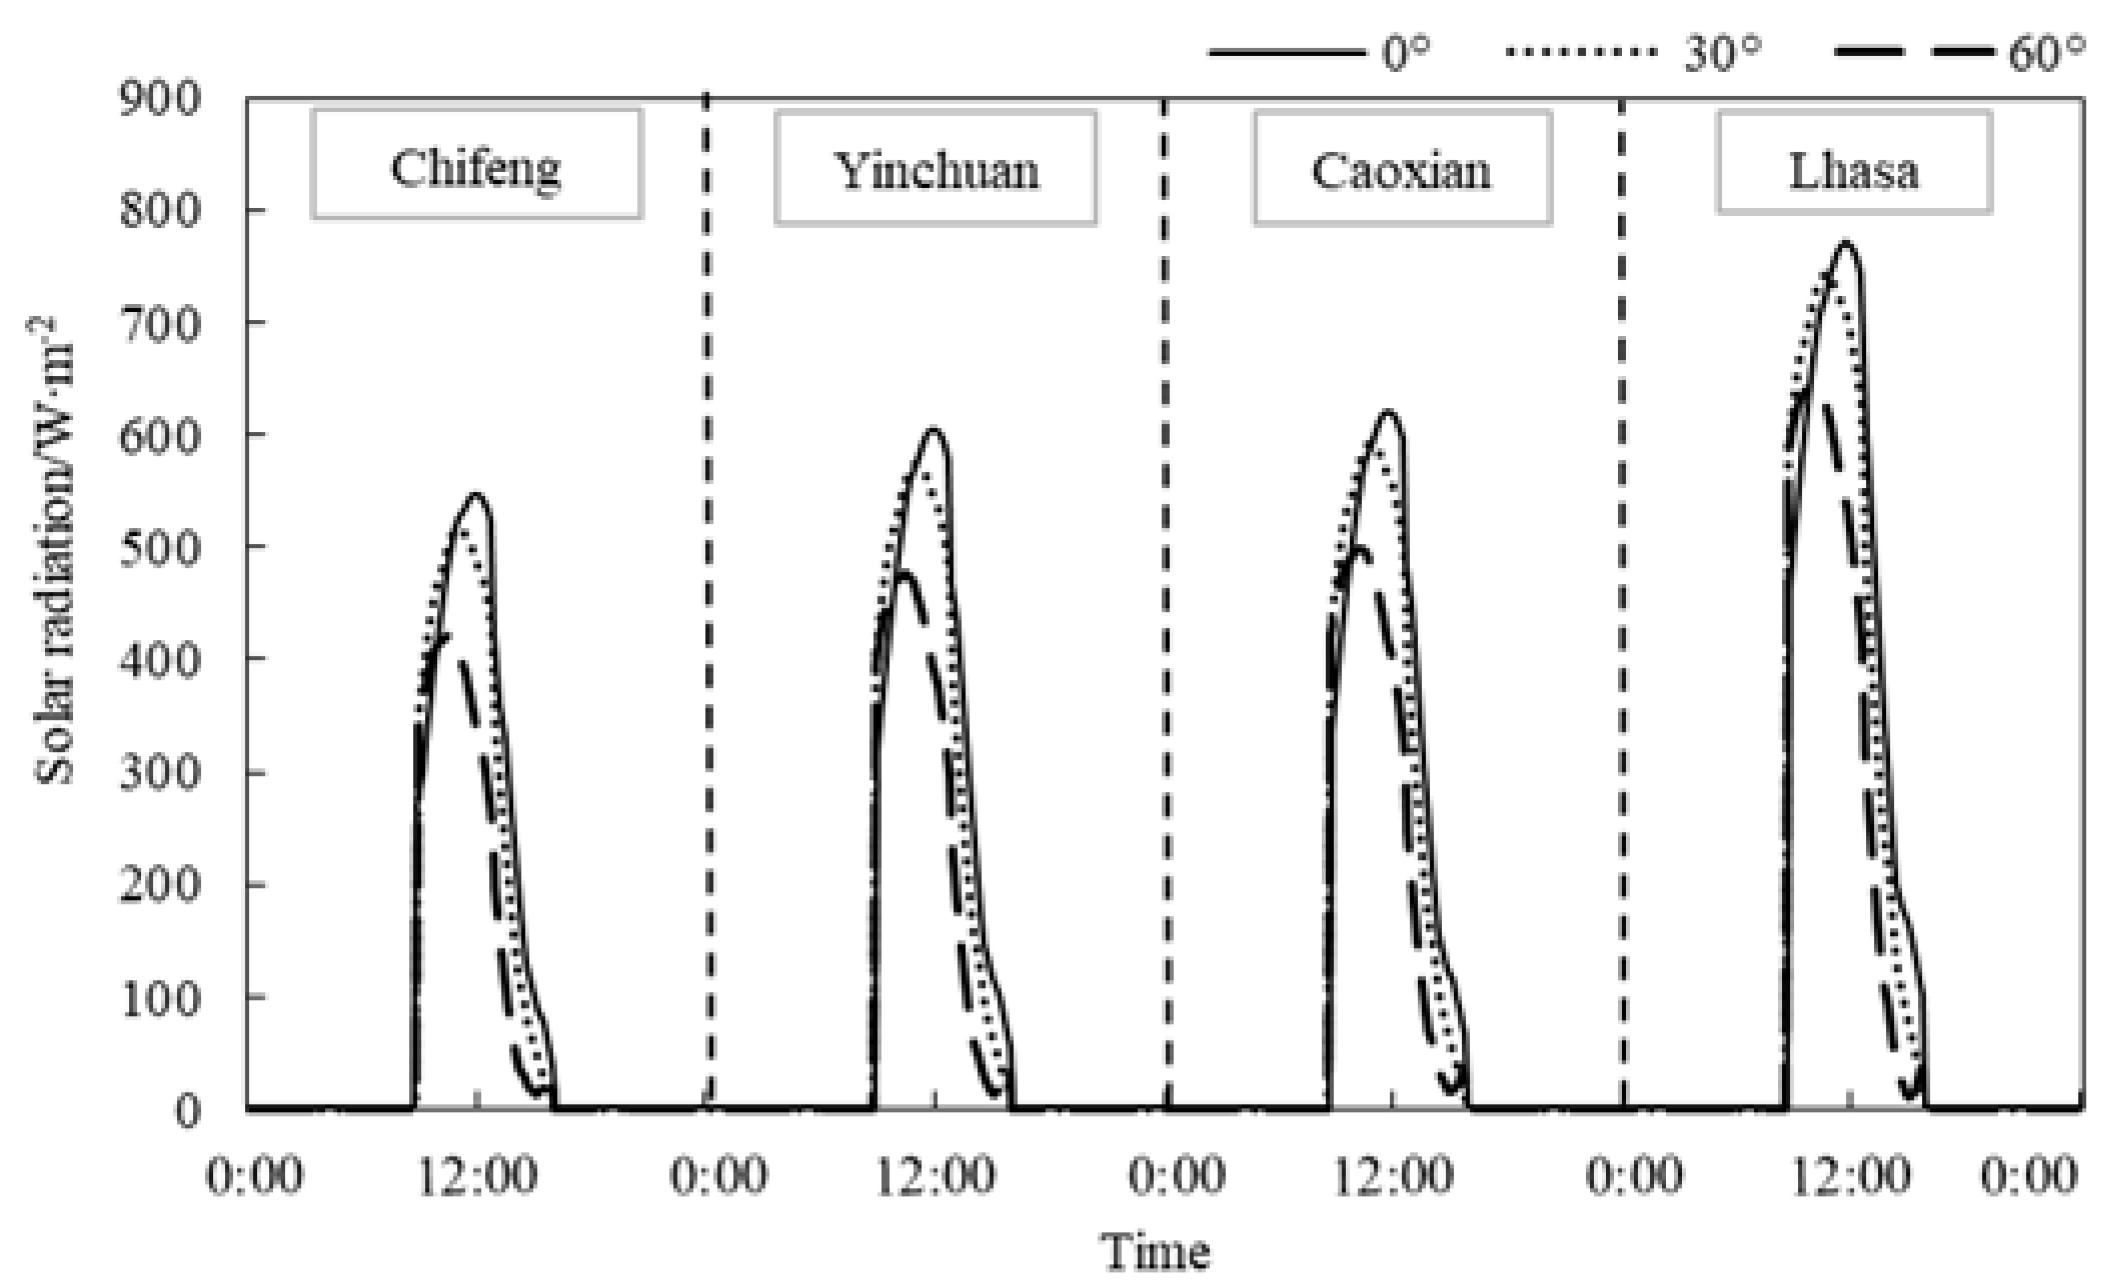
4.5. Influence of Greenhouse Azimuth and Geographic Location on Solar Radiation

In studying the effect on solar radiation inside the IPG for different greenhouse azimuths and regions, the solar radiation on the east side of the greenhouse was simulated and analyzed as an example. Figure 16 shows the daily variation in global solar radiation captured by the greenhouse when the greenhouse azimuth angle is changed from 0° to 60°. When the greenhouse azimuth is in the range of 0–20°, the trend of daily variation in solar radiation is basically the same, and there is little difference between the maximum and the time of occurrence of the maximum solar radiation. When the greenhouse azimuth angle increased to 30°, differences began to appear. Compared with the greenhouse azimuth in the range of 0–20°, the maximum solar radiation decreased by approximately 30 W∙m−2 when the greenhouse azimuth was 30°, and the time of maximum value appeared earlier by approximately 0.67 h. This difference increases with increasing greenhouse azimuth. When the azimuth angle is 60°, the maximum solar radiation decreases by 167 W∙m−2, which is approximately 26.9% compared with the maximum solar radiation in the range of 0–20°. At the same time, the maximum solar radiation appears approximately 1.5 h earlier. Thus, for a greenhouse, the size of its azimuth angle has a large influence on the spatial and temporal distribution of solar radiation in the greenhouse.
The variation pattern of daily cumulative radiation is shown in Figure 17. The daily cumulative radiation is linearly related to the declination angle of the greenhouse azimuth. As the azimuth angle increases, the value of daily cumulative radiation decreases. The greenhouse azimuth of 0° has the largest daily cumulative radiation, which is approximately 54.2% larger than the greenhouse azimuth of 60°. Combined with the spatial and temporal distribution of solar radiation in the greenhouse under different azimuth angles, it can be seen that for N–S IPG, the spatial and temporal distribution of solar radiation and daily cumulative radiation reach the best when its azimuth angle is in the range of 0–20°. Therefore, when constructing IPG in actual production, a suitable greenhouse azimuth should be selected according to the solar radiation demand of growing crops, local climatic conditions, and the heat load or cold load of the greenhouse.
The purpose of this section was to observe the applicability of IPG to production in northern China by predicting the distribution of solar radiation for different regions and greenhouse azimuths in winter. Four typical regions were simulated using the solar radiation model in this paper, including Chifeng (42.2° N, 118.9° E, 677 m), Yinchuan (38.4° N, 106.2° E, 1108 m), Caoxian (34.8° N, 115.5° E, 52 m), and Lhasa (29.6° N, 91.1° E, 3650 m), which cover most of the latitudinal range in northern China. Three greenhouse azimuths of 0°, 30°, and 60° were selected in each region for simulation and analysis. Figure 18 shows the daily variation pattern of solar radiation in the four regions. The simulation results show that when the greenhouse azimuth is the same, the daily variation trends of solar radiation in different regions are approximately the same. For the IPG, when the thermal insulation blanket was rolled up, the solar radiation in the greenhouse gradually increased until it reached a maximum at approximately 12:00 noon. Then, at approximately 2:00 p.m., the solar radiation rapidly decreases due to the shadow of the thermal insulation blanket on top of the IPG until the blanket is closed. Table 2 shows the solar radiation statistics within the IPG for different regions and different greenhouse azimuths. Lhasa has the largest global solar radiation, with a daily cumulative radiation of 22 kW∙m−2. The daily cumulative radiation of both Caoxian and Yinchuan are smaller than that of Lhasa, is 17.3 kW∙m−2 and 16.7 kW∙m−2, respectively. The weakest area of solar radiation is Chifeng, whose daily cumulative radiation is approximately 33% smaller than that of Lhasa. Through the fitting analysis of the calculation results, it is found that the geographical latitude is linearly negatively correlated with the daily cumulative radiation, and the correlation coefficient is 0.54. In addition, Figure 18 and Table 2 show that the maximum solar radiation and daily cumulative radiation in the greenhouse decrease with increasing greenhouse azimuth in all four regions, which is consistent with the conclusions reached in the previous section.
Therefore, based on the results of this simulation and combined with the local climate, the thermal environment of IPGs with different construction parameters in winter in different regions can be predicted, such as how the inside thermal environment of greenhouses behaves in severely cold regions at high altitudes. This is the next problem to be studied and solved.

5. Conclusions

In this paper, a theoretical study on the formation mechanism of solar radiation formation inside the IPG that is being rapidly promoted in current production is presented. Based on the results, the following conclusions can be drawn:
(1)
A mathematical model to calculate the solar radiation model suitable for IPG is constructed by using the reverse ray tracing method. The developed model was tested and evaluated by experimental test data and four model test indicators. The test results showed that the model had a strong consistency between the predicted and measured values. In addition, the model can also be used to simulate and predict the solar radiation inside a traditional plastic greenhouse if the boundary condition of the thermal insulation blanket is ignored in the model.
(2)
Through the model, a quantitative analysis of the influence of IPG thermal insulation blanket shading on the indoor solar radiation can be realized. For example, an analysis of the situation in Shandong Cao County showed that the shadow caused by the thermal insulation blanket on top of the greenhouse was one of the most important factors causing the uneven distribution of solar radiation between the east and west sides. During the day, the area and location of this shadow varied with time. The maximum shadow area was up to 32.5% of the cultivation area inside the greenhouse at approximately 11:30 a.m., and it was all located on the west side of the greenhouse. Since the direct influence of the thermal insulation blanket shadow moving in the greenhouse during the day, it caused the daily cumulative radiation inside the greenhouse to decrease by 2.9–4.9 kW∙m−2 respectively. If this part of global solar radiation is absorbed by the soil inside the greenhouse, then the soil temperature inside the greenhouse can be increased by 0.7–1.1 °C. This result showed that the equipment and methods of rolling up and putting down the thermal insulation blanket need to be updated and improved urgently.
(3)
The influence of construct parameters (the height–span ratio, the greenhouse azimuth, and geographic location) on the indoor solar radiation were systematically expounded and quantitatively described and analyzed. According to the analysis of the simulation data, the optimal range of height–span ratio was obtained. The higher the height, the greater the range of the optimal height–span ratio of the greenhouse. And for the N–S IPG, when the greenhouse azimuth is in the range of 0–20°, the solar radiation of the greenhouse is better. Meanwhile, by predicting the dynamic characteristics of the solar radiation that may be formed by greenhouses in different regions, it is found that the linear correlation coefficient between geographic latitude and daily cumulative radiation is 0.54. The model constructed in this paper can provide a theoretical approach for the design, construction, and use of IPGs in different regions from the perspective of the spatial and temporal distribution of the solar radiation.

Author Contributions

Conceptualization, D.T.; methodology, D.T. and C.M.; validation, D.T.; formal analysis, D.T.; investigation, D.T., Y.L. and Q.W.; resources, Y.L., S.Z. and Q.W.; data curation, D.T.; writing—original draft preparation, D.T.; writing—review and editing, S.Z. and C.M.; supervision, Y.L., S.Z. and W.S.; project administration, S.Z. and W.S.; funding acquisition, S.Z. All authors have read and agreed to the published version of the manuscript.

Funding

This research was funded by National Natural Science Foundation Program, grant number U20A2020, and Beijing Agriculture Innovation Consortium, grant number BAIC01-2024-20.

Data Availability Statement

Restrictions apply to the datasets: The datasets presented in this article are not readily available because the data are part of an ongoing study.

Acknowledgments

We would also like to thank Shandong Caoxian Baicao Manor Co., Ltd. (Caoxian, China) for providing experimental sites and help.

Conflicts of Interest

The authors declare no conflicts of interest.

Abbreviations

The following abbreviations are used in this manuscript:
IDdirect solar radiation on the inclined plane outside the greenhouse, (W∙m−2)
Iddiffuse solar radiation on the inclined plane outside the greenhouse, (W∙m−2)
I0normal solar radiation in the upper atmosphere, (W∙m−2)
ndate of year
patmospheric transparency
matmospheric quality
θsolar angle of incidence, (°)
ωinclination angle of the inclined surface, (°)
hsolar altitude angle, (°)
γangle between the sun’s ray and the Normal Line of the calculated surface projected in the horizontal plane, (°)
εcalculated surface azimuth, (°)
εggreenhouse azimuth, (°)
αsolar azimuth (the included angle between the projection of sunlight on the horizontal plane and the local meridian, (°)
Iglobal solar radiation on the inclined plane outside the greenhouse, (W∙m−2)
τDtransmittance of direct solar radiation
τtransmittance of dry cleaning new covering material to direct solar radiation
τD0transmittance of dry cleaning new covering material to direct solar radiation when the incident angle is 0°
μ1shading loss of structural materials
μ2transmission loss of covering material due to aging
μ3transmission loss of covering material due to dust and condensation
τdtransmittance of diffuse solar radiation
τptransmittance of the crop layer in the greenhouse
τLreflectance of green leaf
C1, C2coefficient, depends on the plant geometry and the leaves orientations
hxysolar altitude angle in the cross section of the greenhouse, (°)
Cwidth when the insulation is rolled up on top of the greenhouse, (m)
xoeprojection positions of the center of the thermal insulation blanket on the ground on the east side
xowprojection positions of the center of the thermal insulation blanket on the ground on the west side
Stotal shadow length s of the insulation, (m)
Ecalculation point
Fthe intersection of the sun’s ray received at calculation point and the transparent surface of the greenhouse
Khcorrection factor of the haze of the transparent surface covering material
λΕincluded angle between the calculation point E and the connecting line of boundary points of thermal insulation on both sides, (°)
Idaycaptured global solar radiation amount entering greenhouse during day, (kW∙m−2)
Aisurface area of each part of the greenhouse, (m2)
Iindaily cumulative amount of captured global solar radiation per square meter for each part of the greenhouse, (kW∙m−2)

References

  1. Xu, W.; Guo, H.; Ma, C. An active solar water wall for passive solar greenhouse heating. Appl. Energy 2021, 308, 118270. [Google Scholar] [CrossRef]
  2. He, X.; Wang, P.; Song, W.; Wu, G.; Ma, C.; Li, M. Experimental study on the feasibility and thermal performance of a multifunctional air conditioning system using surplus air thermal energy to heat a Chinese solar greenhouse. Renew. Energy 2022, 198, 1148–1161. [Google Scholar] [CrossRef]
  3. Chen, X.; Liang, H.; Wu, G.; Feng, C.; Tao, T.; Ji, Y.; Ma, Q.; Tong, Y. Coupled heat and humidity control system of narrow-trough solar collector and solid desiccant in Chinese solar greenhouse: Analysis of optical / thermal characteristics and experimental study. Energy 2023, 273, 127198. [Google Scholar] [CrossRef]
  4. Wang, S.; Li, X.; Liu, Y.; Lv, X.; Zheng, W. Comparison of a new knapsack mist sprayer and three traditional sprayers for pesticide application in plastic tunnel greenhouse. Phytoparasitica 2022, 50, 177–190. [Google Scholar] [CrossRef]
  5. Qi, F.; Li, K.; Li, S.; He, F.; Zhou, X. Development of intelligent equipment for protected horticulture in world and enlightenment to China. Trans. Chin. Soc. Agric. Eng. 2019, 35, 183–195. [Google Scholar] [CrossRef]
  6. Sui, B.; Dong, S.; Meng, H.; Wang, J.; Shen, Y.; Ding, J.; Zhou, H.; Feng, J. Innovation in agricultural engineering and technology to accelerate green development of agriculture. Trans. Chin. Soc. Agric. Eng. 2020, 36, 1–6. [Google Scholar] [CrossRef]
  7. Ma, R.; Ma, R.; Han, D.; Yun, W. Construction of cultivated land quality evaluation system in provincial level based on multilevel indicators. Trans. Chin. Soc. Agric. Eng. 2018, 34, 249–257. [Google Scholar] [CrossRef]
  8. Peng, W.; Lyu, X.; Niu, S. Sustainable intensification of cultivated land use and farming households’ livelihood transition. Trans. Chin. Soc. Agric. Eng. 2022, 38, 270–277. [Google Scholar] [CrossRef]
  9. Zuo, L.; Zhang, Z.; Carlson, K.M.; MacDonald, G.K.; Brauman, K.A.; Liu, Y.; Zhang, W.; Zhang, H.; Wu, W.; Zhao, X.; et al. Progress towards sustainable intensification in China challenged by land-use change. Nat. Sustain. 2018, 1, 304–313. [Google Scholar] [CrossRef]
  10. Tong, G.; Chen, Q.; Xu, H. Passive solar energy utilization: A review of envelope material selection for Chinese solar greenhouses. Sustain. Energy Technol. Assess. 2022, 50, 101833. [Google Scholar] [CrossRef]
  11. Wang, X.; Zhang, J. Basic path and system construction of agricultural green and lowcarbon development with respect to the strategic target of carbon peak and carbon neutrality. Chin. J. Eco-Agric. 2022, 30, 16–26. [Google Scholar] [CrossRef]
  12. Hassanien, R.H.E.; Li, M.; Dong Lin, W. Advanced applications of solar energy in agricultural greenhouses. Renew. Sustain. Energy Rev. 2016, 54, 989–1001. [Google Scholar] [CrossRef]
  13. Parastoo, M.; Ramin, R. Optimal design and operation of solar energy system with heat storage for agricultural greenhouse heating. Energy Convers. Manag. X 2023, 18, 100353. [Google Scholar] [CrossRef]
  14. Panwar, N.L.; Kaushik, S.C.; Kothari, S. Solar greenhouse an option for renewable and sustainable farming. Renew. Sustain. Energy Rev. 2011, 15, 34–45. [Google Scholar] [CrossRef]
  15. Gorjian, S.; Calise, F.; Kant, K.; Ahamed, M.S.; Copertaro, B.; Najafi, G.; Zhang, X.; Aghaei, M.; Shamshiri, R.R. A review on opportunities for implementation of solar energy technologies in agricultural greenhouses. J. Clean. Prod. 2021, 285, 124807. [Google Scholar] [CrossRef]
  16. Mazzeo, D.; Baglivo, C.; Panico, S.; Congedo, P.M. Solar greenhouses: Climates, glass selection, and plant well-being. Sol. Energy 2021, 230, 22–41. [Google Scholar] [CrossRef]
  17. Wang, S. Research on the Simulation of Radiation Intensity in Solar Greenhouse. Master’s Thesis, China Agricultural University, Beijing, China, 2012. [Google Scholar]
  18. Chen, C.; Yu, N.; Yang, F.; Mahkamov, K.; Han, F.; Li, Y.; Ling, H. Theoretical and experimental study on selection of physical dimensions of passive solar greenhouses for enhanced energy performance. Sol. Energy 2019, 191, 46–56. [Google Scholar] [CrossRef]
  19. Choab, N.; Allouhi, A.; el Maakoul, A.; Kousksou, T.; Saadeddine, S.; Jamil, A. Review on greenhouse microclimate and application: Design parameters, thermal modeling and simulation, climate controlling technologies. Sol. Energy 2019, 191, 109–137. [Google Scholar] [CrossRef]
  20. Esmaeli, H.; Roshandel, R. Optimal design for solar greenhouses based on climate conditions. Renew. Energy 2020, 145, 55–65. [Google Scholar] [CrossRef]
  21. Wu, X.; Li, Y.; Jiang, L.; Wang, Y.; Liu, X.; Li, T. A systematic analysis of multiple structural parameters of Chinese solar greenhouse based on the thermal performance. Energy 2023, 273, 127193. [Google Scholar] [CrossRef]
  22. Pieters, J.G.; Deltour, J.M. Modelling solar energy input in greenhouses. Sol. Energy 1999, 67, 119–130. [Google Scholar] [CrossRef]
  23. Elsner, B.; Briassoulis, D.; Waaijenberg, D.; Mistriotis, A.; Zabeltitz Chr Gratra-ud, J.; Russo, G.; Suay-Cortes, R. Review of Structural and Functional Characteristics of Greenhouses in European Union Countries: Part I, Design Requirements. J. Agric. Eng. Res. 2020, 75, 1–16. [Google Scholar] [CrossRef]
  24. Sethi, V.P. On the selection of shape and orientation of a greenhouse: Thermal modeling and experimental validation. Sol. Energy 2009, 83, 21–38. [Google Scholar] [CrossRef]
  25. El-Maghlany, W.M.; Teamah, M.A.; Tanaka, H. Optimum design and orientation of the greenhouses for maximum capture of solar energy in North Tropical Region. Energy Convers. Manag. 2015, 105, 1096–1104. [Google Scholar] [CrossRef]
  26. Singh, R.D.; Tiwari, G.N. Energy conservation in the greenhouse system: A steady state analysis. Energy 2010, 35, 2367–2373. [Google Scholar] [CrossRef]
  27. Chen, J.; Ma, Y.; Pang, Z. A mathematical model of global solar radiation to select the optimal shape and orientation of the greenhouses in southern China. Sol. Energy 2020, 205, 380–389. [Google Scholar] [CrossRef]
  28. Zhang, X.; Lv, J.; Xie, J.; Yu, J.; Zhang, J.; Tang, C.; Li, J.; He, Z.; Wang, C. Solar radiation allocation and spatial distribution in Chinese solar greenhouses: Model Development and application. Energies 2020, 13, 1108. [Google Scholar] [CrossRef]
  29. Huang, L.; Deng, L.; Li, A.; Gao, R.; Zhang, L.; Lei, W. Analytical model for solar radiation transmitting the curved transparent surface of solar greenhouse. J. Build. Eng. 2020, 32, 101785. [Google Scholar] [CrossRef]
  30. Papadopoulos, A.P.; Pararajasingham, S. The influence of plant spacing on light interception and use in greenhouse tomato (Lycopersicon esculentum Mill.): A review. Sci. Hortic. 1997, 69, 1–29. [Google Scholar] [CrossRef]
  31. Lamnatou, C.; Chemisana, D. Solar radiation manipulations and their role in greenhouse claddings: Fresnel lenses, NIR- and UV-blocking materials. Renew. Sustain. Energy Rev. 2013, 18, 271–287. [Google Scholar] [CrossRef]
  32. Al-Mahdouri, A.; Baneshi, M.; Gonome, H.; Okajima, J.; Maruyama, S. Evaluation of optical properties and thermal performances of different greenhouse covering materials. Sol. Energy 2013, 96, 21–32. [Google Scholar] [CrossRef]
  33. Mashonjowa, E.; Ronsse, F.; Mhizha, T.; Milford, J.R.; Lemeur, R.; Pieters, J.G. The effects of whitening and dust accumulation on the microclimate and canopy behaviour of rose plants (Rosa hybrida) in a greenhouse in Zimbabwe. Sol. Energy 2010, 84, 10–23. [Google Scholar] [CrossRef]
  34. Cabrera, F.J.; Lopez, J.C.; Baille, A.; Gonzalez-Real, M.M.; Perez-Parra, J. Effects of cover diffusive properties on the components of greenhouse solar radiation. Biosyst. Eng. 2009, 103, 344–356. [Google Scholar] [CrossRef]
  35. Abdel-Ghany, A.M.; Al-Helal, I.M. Solar energy utilization by a greenhouse: General relations. Renew. Energy Int. J. 2011, 36, 189–196. [Google Scholar] [CrossRef]
  36. Ma, C.; Zhao, S.; Cheng, J.; Wang, N.; Jiang, Y.; Wang, S.; Li, B. On establishing light environment model in Chinese solar greenhouse. J. Shenyang Agric. Univ. 2013, 44, 513–517. [Google Scholar] [CrossRef]
  37. Boulard, B.; Baille, A. Analysis of thermal performance of a greenhouse as a solar collector. Energy Agric. 1987, 6, 17–26. [Google Scholar] [CrossRef]
  38. Stanghellini, C. Transpiration of the Greenhouse Crop Canopies: An Aid to Climate Management. Ph.D. Thesis, Agriculture University of Wageningen, Wageningen, The Netherlands, 1987. [Google Scholar]
  39. Xu, H.; Cao, Y.; Gao, J.; Jiang, W.; Zou, Z. Establishment and application of solar radiation model in solar greenhouse. Trans. Chin. Soc. Agric. Eng. 2019, 35, 160–169. [Google Scholar] [CrossRef]
  40. Song, W.; Li, C.; Sun, X.; Wang, P.; Zhao, S. Effects of ridge direction on growth and yield of tomato in solar greenhouse with diffuse film. Trans. Chin. Soc. Agric. Eng. 2017, 33, 242–248. [Google Scholar] [CrossRef]
  41. Pakari, A.; Ghani, S. Evaluation of a novel greenhouse design for reduced cooling loads during the hot season in subtropical regions. Sol. Energy 2019, 181, 234–242. [Google Scholar] [CrossRef]
Figure 1. Solar radiation model simulated and applied at different regions in China.
Agronomy 14 00510 g001
Figure 2. Three-dimensional geometric model of the N–S IPG. 1 is the gable; 2 is the vent—downside; 3 is the transparent surface; 4 is the vent—upside; 5 is the thermal insulation blanket.
Agronomy 14 00510 g002
Figure 4. Coordinate system in the cross section of the IPG.
Agronomy 14 00510 g004
Figure 9. This is the test greenhouse. (a) Exterior view of the test greenhouse. (b) Inner view of the test greenhouse.
Agronomy 14 00510 g009
Figure 10. Schematic of the sensor locations.
Agronomy 14 00510 g010
Figure 11. Comparison between simulated and measured global solar radiation values in IPG.
Agronomy 14 00510 g011
Figure 12. Simulation point location diagram. 1 is the measurement point at the top of the greenhouse; 2–4 are the measurement points at the crop canopy; and 5 is the measurement point at the bottom of the crop canopy.
Agronomy 14 00510 g012
Figure 13. Variations in global solar radiation at different locations of IPG during the day.
Agronomy 14 00510 g013
Figure 14. Daily variation in shadow area caused by the thermal insulation blanket in the IPG.
Agronomy 14 00510 g014
Figure 15. Effect of variation of height–span ratio on the daily accumulative solar radiation in the greenhouse.
Agronomy 14 00510 g015
Figure 16. Diurnal variation in global solar radiation in the IPG with different azimuth angles (varying from 0° to 60°) in Shandong (34.8° N, 115.5° E).
Agronomy 14 00510 g016
Figure 17. Daily cumulative radiation per square meter of cultivated area in the greenhouse with different azimuth angles in Shandong (34.8° N, 115.5° E).
Agronomy 14 00510 g017
Figure 18. Daily variation in global solar radiation in IPG in different regions and greenhouse azimuths.
Agronomy 14 00510 g018
Table 1. Test index data of the greenhouse solar radiation model.
DateWeatherMBE/
(W·m−2)
MAE/
(W·m−2)
RMSE/
(W·m−2)
R2
22 December 2020Sunny1.014.029.40.98
28 December 2020Cloudy15.615.632.50.93
24 January 2021Cloudy to rain9.79.720.30.90
Table 2. Solar radiation statistics in the IPG for different regions and greenhouse azimuths.
RegionLongitude and LatitudeElevation/mGreenhouse AzimuthMaximum Solar Radiation/W∙m−2Daily Cumulative Radiation/kW∙m−2
Chifeng42.2° N, 118.9° E67754814.9
30°51713.8
60°42210.2
Yinchuan38.4° N, 106.2° E110860416.7
30°57415.6
60°47611.8
Caoxian34.8° N, 115.5° E5262117.3
30°59216.2
60°49912.4
Lhasa29.6° N, 91.1° E365077122.0
30°74320.4
60°64516.0
Disclaimer/Publisher’s Note: The statements, opinions and data contained in all publications are solely those of the individual author(s) and contributor(s) and not of MDPI and/or the editor(s). MDPI and/or the editor(s) disclaim responsibility for any injury to people or property resulting from any ideas, methods, instructions or products referred to in the content.

