Article

Estimation of Relative Chlorophyll Content in Lettuce (Lactuca sativa L.) Leaves under Cadmium Stress Using Visible—Near-Infrared Reflectance and Machine-Learning Models

College of Engineering and Technology, Jilin Agricultural University, Changchun 130118, China
*
Author to whom correspondence should be addressed.
Agronomy 2024, 14(3), 427; https://doi.org/10.3390/agronomy14030427
Submission received: 31 January 2024 / Revised: 17 February 2024 / Accepted: 20 February 2024 / Published: 22 February 2024
(This article belongs to the Section Precision and Digital Agriculture)

Abstract

:
Chlorophyll content is a crucial assessment parameter in the growth monitoring of lettuce, particularly in cases when it is affected by disease. Accurate estimation of chlorophyll content is beneficial for early detection and prevention of diseases and holds significant importance in practical production. To construct a model for estimating the chlorophyll content in lettuce leaves under cadmium stress, this study utilized lettuce as the experimental material. The visible–near-infrared reflectance spectra of lettuce leaves, as well as the relative chlorophyll content of the leaves, were detected and analyzed under different concentrations of cadmium stress. Subsequently, an inversion model for estimating the relative chlorophyll content in lettuce leaves was established. First, to determine the optimal spectral preprocessing method, eight techniques are utilized: Savitzky–Golay smoothing (SG), multiplicative scatter correction (MSC), standard normal variable transformation (SNV), mean normalization (MN), baseline offset (B), detrending (D), gap derivatives—first derivative (FD), and gap derivatives—second derivative (SD). These methods are used to preprocess the spectra and establish a partial least squares regression (PLSR) monitoring model. The optimal spectral preprocessing method is then selected. Next, the feature bands are extracted from the preprocessed spectral data using the correlation coefficient method. Finally, the selected feature bands will be combined with support vector regression (SVR) to establish a chlorophyll content estimation model using a training-to-testing set ratio of 4:1. The results showed that the PLSR model established after preprocessing with detrending (D) had the highest accuracy, with the coefficient of determination (Rv2) and root mean squared error (RMSEv) values of 0.87 and 1.16, respectively. The feature bands selected by the correlation coefficient method were used to establish SVR models for estimating the chlorophyll content of lettuce leaves under cadmium stress, with the highest accuracy being achieved by the genetic algorithm (GA)–SVR model. It can be seen that near-infrared spectroscopy technology provides a scientific basis for rapid, nondestructive, and accurate detection of lettuce diseases and stress.

1. Introduction

Cadmium stress not only affects the quality and yield of vegetables but also poses a threat to human health through the food chain [1]. Rapid, nondestructive, and accurate diagnosis of the degree of cadmium stress in vegetables is of great significance in ensuring food safety. Lettuce has high nutritional value and is rich in vitamin C. It has various benefits, such as weight loss, cholesterol reduction, and promotion of blood circulation [2]. However, lettuce is highly sensitive to environmental conditions. Under high concentrations of cadmium stress, it often exhibits slow growth, poor leaf development, wilting, and even death [3,4]. Chlorophyll, as an important biochemical parameter for photosynthesis in plants, is closely related to plant photosynthetic rate, nitrogen levels, and plant health. It serves as an indicator of plant growth, nutritional status, and photosynthetic activity [5,6].
Currently, methods for determining chlorophyll content include chemical methods, relative chlorophyll content SPAD values, and spectral techniques. Traditional methods for measuring chlorophyll content rely on chemical techniques, which involve field sampling and subsequent laboratory analysis. These methods not only require significant human and material resources but also have a certain degree of destructiveness. Additionally, it is challenging to implement on a large scale and in real time [7,8]. Although the relative chlorophyll content measured by SPAD values enables rapid and nondestructive detection, it is only suitable for small-scale testing [9]. Spectroscopy has the advantages of high resolution and abundant information [10], providing the possibility for real-time, rapid, and nondestructive monitoring of vegetation chlorophyll content.
Currently, there is widespread attention among scholars toward using spectroscopic techniques to detect chlorophyll content in plant leaves. Zhang et al. [11] utilized univariate regression, stepwise multiple regression, and support vector machine regression methods to construct a hyperspectral estimation model for chlorophyll content in cotton canopy leaves. The results showed that the support vector machine regression method can be considered to be the preferred approach for hyperspectral estimation of chlorophyll content in cotton canopy leaves. Yao et al. [12] conducted a study on the quantitative relationship between visible–near-infrared reflectance spectroscopic features and chlorophyll content in rapeseed leaves. The research indicated that visible–near-infrared reflectance spectroscopy can achieve rapid and nondestructive detection of chlorophyll content in rapeseed leaves. Shao et al. [13] utilized the least squares support vector machine, least squares, and backpropagation neural network methods to establish a prediction model for SPAD values based on visible–near-infrared spectral reflectance of rice. The results indicated that the combination of visible–near-infrared spectroscopy and the least squares support vector machine regression method can effectively estimate the SPAD values of rice leaves. Vali et al. [14] suggested that visible–near-infrared spectroscopy has promising applications in estimating chlorophyll content in winter wheat. Tan et al. [15] conducted a study on the chlorophyll content and leaf spectral reflectance of alfalfa and established an estimation model using optimized support vector regression. The results showed that the optimized support vector regression models can be used for estimating the chlorophyll content in alfalfa.
Therefore, this research uses lettuce as the test material and visible–near-infrared spectroscopy technology as the research method. Through the potting planting method with externally added cadmium, it explores the effects of cadmium stress on the relative chlorophyll content and visible–near-infrared reflectance spectrum of lettuce. Additionally, a visible–near-infrared reflectance spectroscopy estimation model for the relative chlorophyll content of lettuce leaves under cadmium stress is developed. The purpose of this study is to provide a new scientific tool for estimating plant chlorophyll under adverse conditions, to provide a theoretical basis and technical support for lettuce growth monitoring, and to have significant implications for ensuring lettuce yield and quality, as well as food safety.

2. Materials and Methods

2.1. Experimental Materials

The test material used was lettuce (Lactuca sativa L. cv. Grand Rapids) purchased from Kuishou Agriculture and Technology Company (Langfang, China). The soil used for the experiment was a full-price seedling substrate purchased from Changchun Saisei Agricultural Development Co., Ltd. (Changchun, China). The organic matter content was 12.59 g/kg, total nitrogen content was 0.727 g/kg, available phosphorus content was 0.007 g/kg, and available potassium content was 0.15 g/kg.

2.2. Experimental Design

The experiment was conducted in July 2023 on the campus of Jilin Agricultural University in Changchun, Jilin Province (125°42′ E, 43°82′ N) using a pot cultivation method with externally added cadmium. The experimental design consisted of five treatments: 0 (control), 1, 5, 10, and 20 mg/kg, each replicated three times, resulting in a total of 15 pots. Within each pot, three lettuce plants were planted. First, the substrate soil was sieved using a 2 mm mesh to remove impurities, and the sieved soil was left to settle in a dry and well-ventilated area for three days. Next, distilled water was used as the solvent, and cadmium nitrate was added as an external source of cadmium to prepare a 200 mL solution. The solution with different concentrations of cadmium was sprayed layer by layer onto the experimental substrate soil, mixed thoroughly, and aged for ten days while maintaining a moisture content of 60% to 70%. After aging, the treated soil was placed into 480 mm × 230 mm × 160 mm flowerpots [16,17], each containing 1.5 kg of substrate soil. Finally, select lettuce seedlings with consistent growth and good health to transplant into the flowerpots. At this stage, the lettuce has reached the stage of two true leaves. Throughout the entire growth period, it is essential to ensure an adequate water supply to promote the normal growth of lettuce. At the same time, it is necessary to change the position of the flowerpots every other day to ensure even exposure to light. The experiment was conducted under natural light conditions, with a day-night temperature of 25 °C/18 °C ± 2 °C and a relative humidity of 60% to 70%. On the 45th day under cadmium stress, various indicators of lettuce leaf were measured for each treatment.

2.3. Spectral Data Acquisition

The visible–near-infrared spectroscopy data were measured using the AvaSpec-ULS2048 versatile fiber spectrometer produced by Aventes, a company based in Apeldoorn, The Netherlands. The wavelength range measured by the instrument is 200 nm–1100 nm, with a spectral resolution of 0.05 nm–20 nm. The light source used is the AvaLight-DHc full-spectrum compact light source produced by the Dutch company Aventes, with the deuterium lamp covering a wavelength range of 200 nm–400 nm and the tungsten halogen lamp covering a wavelength range of 400 nm–2500 nm.
During data acquisition, the weather was clear with light winds. Taking into account the impact of light intensity and photosynthesis [18], the spectral collection time was chosen to be between 12:00 and 14:00. First, connect the reflection probe fiber, respectively, to the spectrometer and the light source. Then, use the reflection probe holder to fix the reflection probe at a 45-degree angle to the leaf direction. Finally, select the deuterium-halogen lamp as the light source, preheat for 8 min, and perform white balance correction and measurement. During the entire experiment, a white balance correction is performed every 30 min. During white balance correction, when the reflectance of the whiteboard reaches 100%, it is considered that the spectrometer has been successfully calibrated. Due to the higher physiological activity of the top leaves, they provide a better observation of the plant’s physiological response to environmental stress. Additionally, cadmium is more prone to migrate and accumulate in new leaves. The top 1 to top 3 leaves are considered the best leaf positions for monitoring crop material content, showing better representativeness across different growth stages compared to lower leaves [19,20]. Therefore, the top 2 or 3 leaves were selected as the sample for measurement, avoiding the main leaf vein. Three spectral data were collected for each lettuce leaf, with 5 treatments and 27 spectral curves measured under each treatment, and a total of 135 spectral curves were obtained.

2.4. Determination of Relative Chlorophyll Content

The relative chlorophyll content (SPAD value) is determined using the handheld chlorophyll meter SPAD-502 Plus, produced by KONICA MINOLTA in Tokyo, Japan. Three SPAD values are measured at the same position on each leaf during spectral measurements. The average value is then taken as the SPAD value for that leaf. The SPAD values correspond one-to-one with the spectral data.

2.5. Data Processing and Analysis

The spectral data are exported using AvaSoft 8 spectral acquisition software. The exported raw data are inputted and analyzed using Excel 2010. The collected spectral data are preprocessed using The Unscrambler X 10.4. The model is trained and validated using MATLAB 2023b software. The plotting is performed using Origin2021.

2.5.1. Significance Analysis

The significance test is used to determine if there are significant differences in the mean SPAD values of different groups of lettuce leaves. Typically, significance levels of 5% and 1% are used as criteria for assessing significance. If the significance level is less than 5% or 1%, it is considered to have a significant or extremely significant degree of difference.

2.5.2. Spectral Data Preprocessing

The original spectral data are susceptible to interference from factors such as stray light, instrument noise, sample background, and baseline drift [5,21]. These factors can impact the quantitative and qualitative analysis results of the spectrum. Therefore, it is necessary to preprocess the raw spectral data. This study employed several data preprocessing techniques to enhance the quality and accuracy of the spectral data. The Savitzky–Golay (SG) smoothing method was utilized to eliminate noise interference, improve signal-to-noise ratio, and enhance the quality of the spectra. Multiplicative Scatter Correction (MSC) was applied to eliminate the influence of scattering and enhance the accuracy and repeatability of the spectral data. Standard normal variable transformation (SNV) was used to normalize the spectra and make them comparable at the same wavelength by eliminating differences between samples. Mean Normalization (MN) was employed to remove dataset offsets. Baseline Offset (B) was performed to eliminate baseline drift in the spectra and restore their original shape. Detrending (D) was applied to remove trends (linear or nonlinear) in the spectral data, reducing systematic errors and improving analysis accuracy. Gap Derivatives—First Derivative (FD) and Gap Derivatives—Second Derivative (SD) were calculated to enhance the spectral features and aid in identifying peaks and valleys in the data.

2.5.3. Methods for Feature Band Extraction

The extraction of feature bands can effectively reduce the dimensionality of data and mitigate the impact of redundant information. In this study, the feature band extraction was conducted using the correlation coefficient method. The determination of feature bands was carried out by calculating the correlation coefficient between the reflectance of each spectral band and the SPAD values of lettuce leaves under cadmium stress. Among them, the larger the absolute value of the correlation coefficient, the more effective information is contained in the reflectance of that spectral band, and thus it is selected as a feature band [22].

2.5.4. Machine-Learning Methods

Partial Least Squares Regression (PLSR) is a modeling method that combines the advantages of Multivariate Linear Regression (MLR) and Principal Component Analysis (PCA). Compared to traditional MLR methods, PLSR is suitable for regression modeling with many spectral bands and high autocorrelation. It also effectively addresses multicollinearity issues. PLSR has been widely applied in the field of spectral inversion [23,24]. This study involved the establishment of nine PLSR models for different spectral data treatments, aiming to determine the best spectral preprocessing method.
Support Vector Regression (SVR) is a machine-learning method based on statistical learning theory, which utilizes a nonlinear transformation to map the input space into a high-dimensional space and establishes an estimation model. Compared to traditional learning methods, SVR demonstrates advantages in handling small sample sizes and nonlinearity [15,25].
The SVR model primarily achieves the modeling of nonlinear functions by selecting different kernel functions. Choosing an appropriate kernel function can enhance the model’s fitting ability, therefore improving its generalization capability and prediction accuracy. The commonly used kernel functions include linear kernel function, polynomial kernel function, radial basis kernel function (RBF), and sigmoid kernel function.
In the SVR model, both the penalty parameter c and the kernel parameter g are crucial hyperparameters. The penalty parameter c controls the model’s complexity and generalization capability. It reflects the degree of punishment for samples that exceed the error. In other words, it represents the degree of punishment for errors. The kernel parameter g influences the degree of nonlinear mapping of data in high-dimensional space and controls the model’s fitting ability [26,27]. Therefore, in this study, the grid search method (GS–SVR), genetic algorithm (GA–SVR), and particle swarm optimization algorithm (PSO-SVR) were utilized to optimize the parameters (c, g) to achieve the best estimation performance.

2.5.5. Model Accuracy Evaluation Methods

Evaluation of model accuracy was conducted using the coefficient of determination R2 and root mean squared error (RMSE). When R2 is closer to 1, and RMSE is closer to 0, it indicates that the model has a higher degree of fit and accuracy. The formulas for calculating R2 and RMSE are shown in (1) and (2), respectively.
R 2 = 1 i = 1 N ( y i y ^ i ) 2 i = 1 N ( y i y ¯ ) 2
R M S E = 1 N i = 1 N ( y i y ^ i ) 2
In the equations provided, N is the number of samples, y i is the actual value of the i-th sample, y ^ i is the predicted value of the i-th sample, and y ¯ is the mean value of all actual values.

3. Results and Discussion

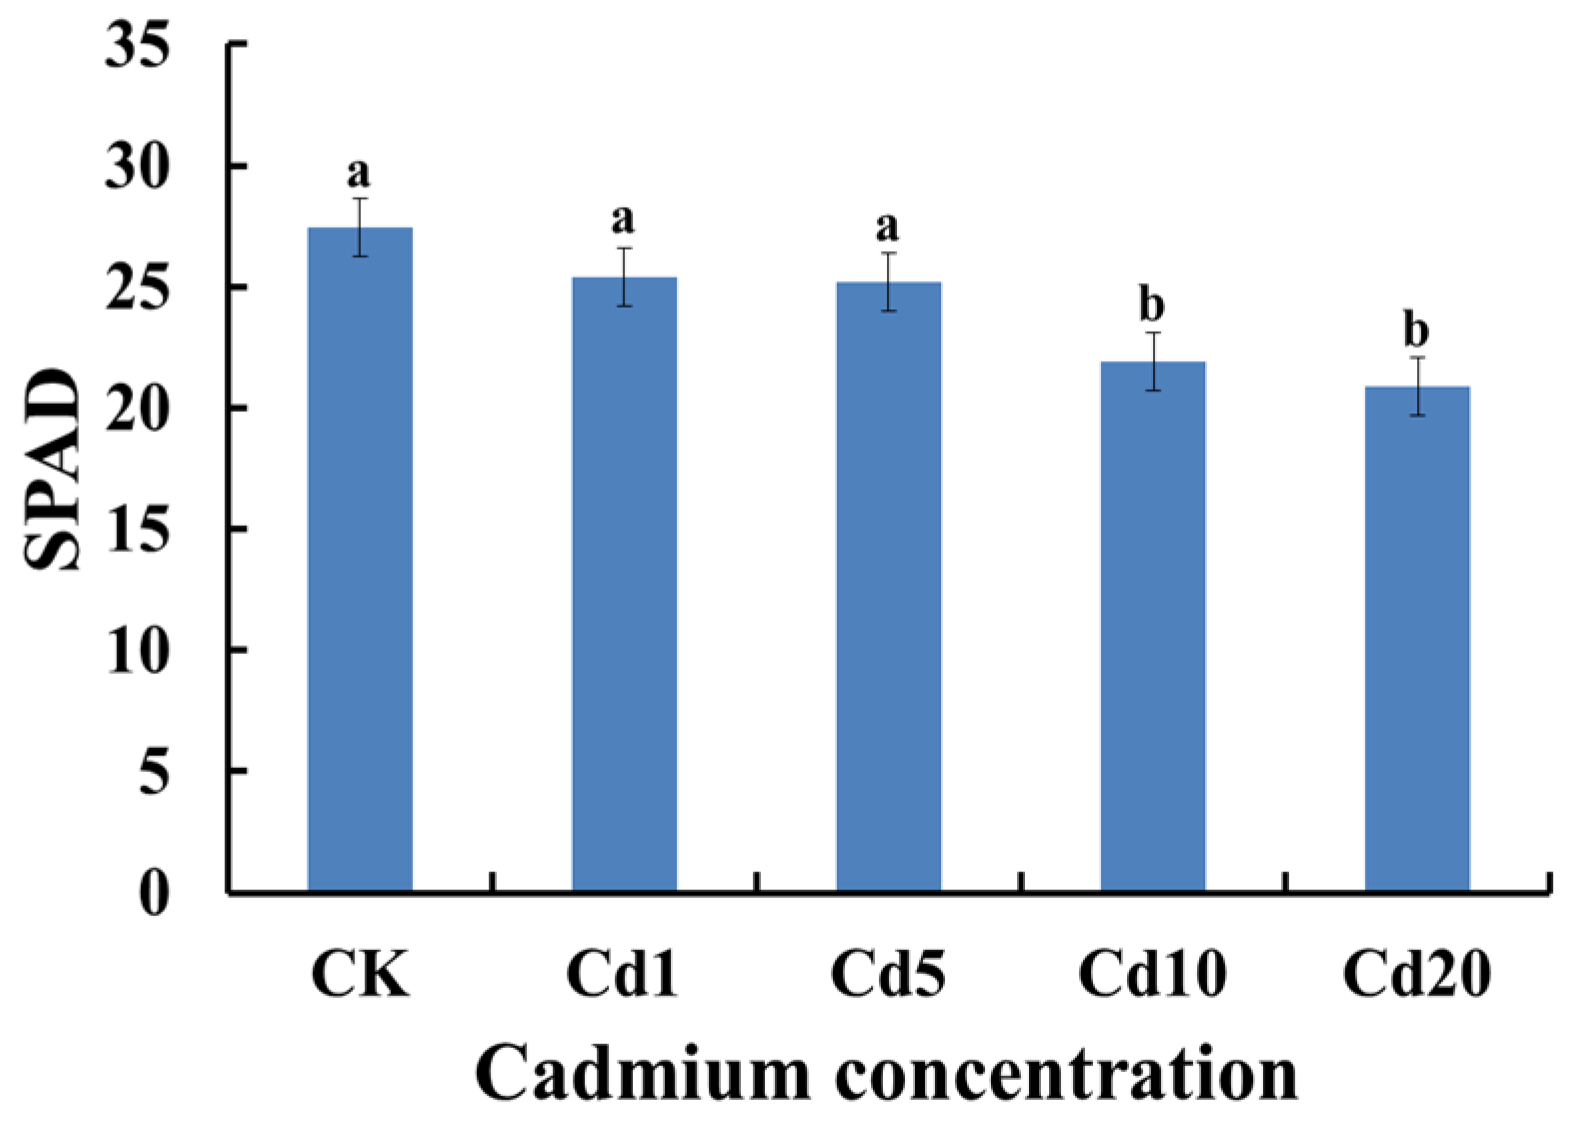
3.1. Effects of Cadmium Stress on the SPAD Values of Lettuce Leaves

Figure 1 shows the changes in SPAD values of lettuce leaves under cadmium stress. Under cadmium stress, the SPAD values of lettuce leaves decrease with an increase in cadmium concentration. Under cadmium stress at concentrations of 1 mg/kg and 5 mg/kg, there was no significant change in the SPAD values of lettuce leaves compared to the control group (CK), suggesting that lettuce may possess a certain level of resistance to cadmium stress at these concentrations [28]. However, under cadmium stress at concentrations of 10 mg/kg and 20 mg/kg, there was a significant change compared to the control group (CK), possibly due to the fact that cadmium stress at these concentrations can damage chloroplast structure affects the synthesis of photosynthetic pigments, disrupt plant growth, and thus cause a significant decrease in SPAD values [29,30].

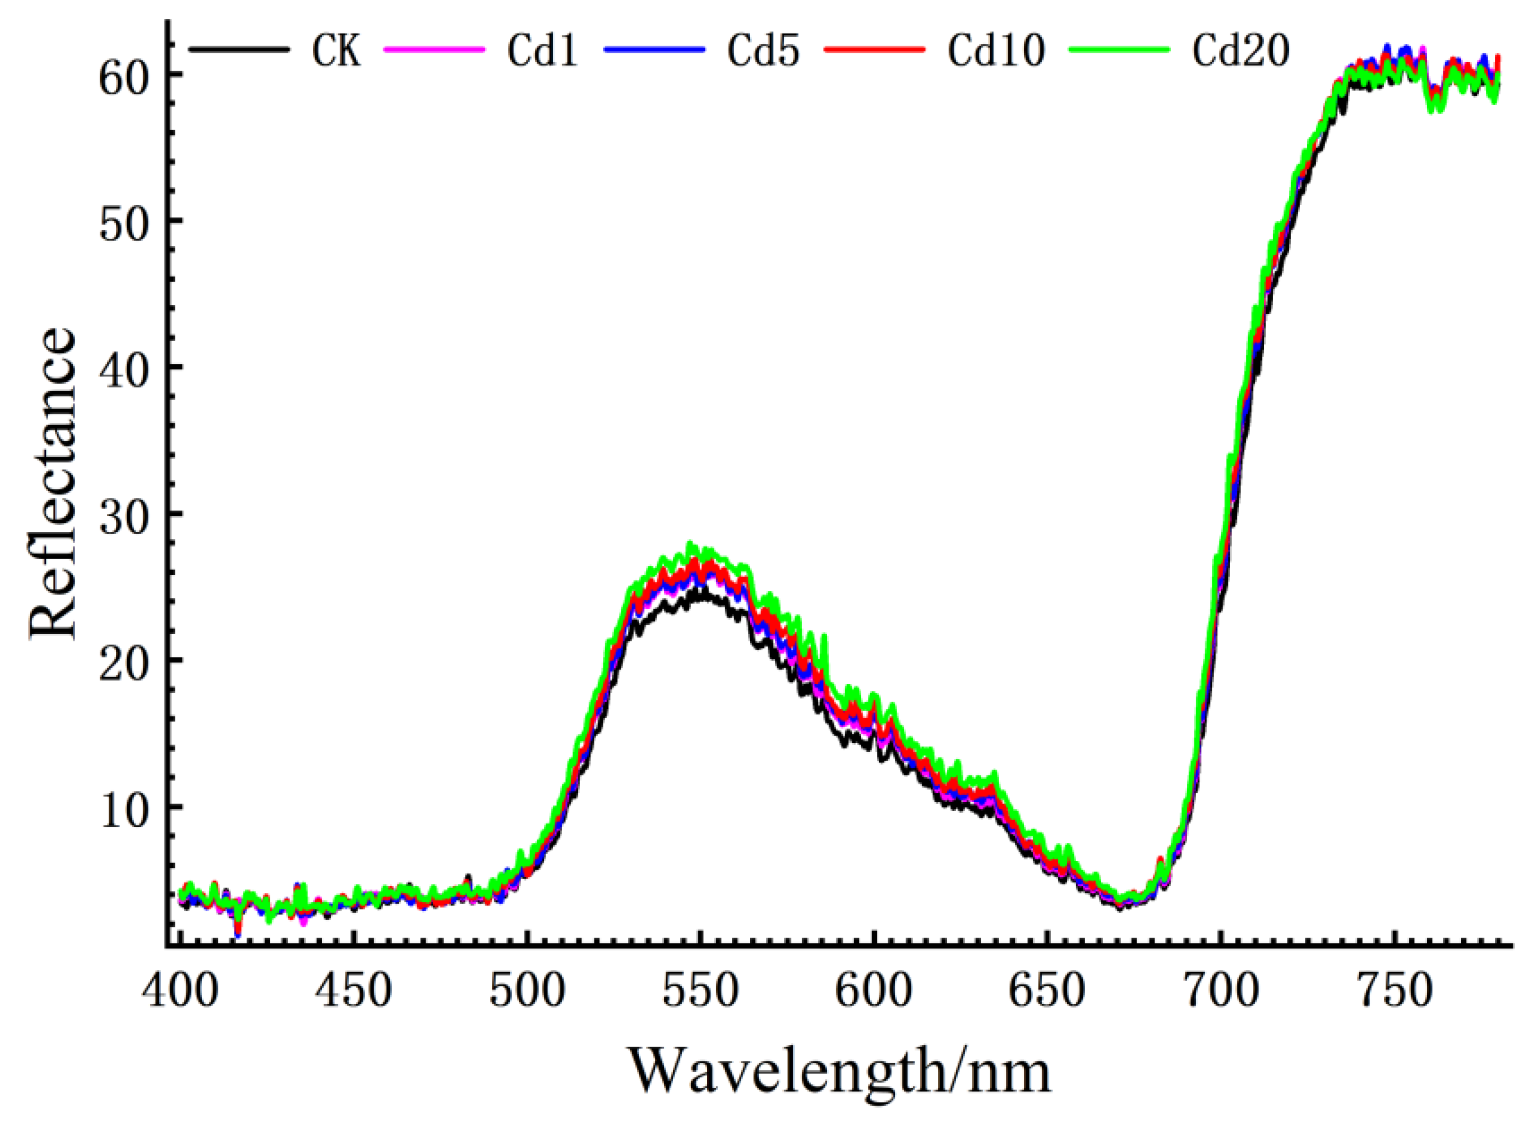
3.2. Spectral Characteristics of Lettuce Leaves under Cadmium Stress

The reflectance of plant leaf spectra in the visible light range is primarily influenced by vegetation pigments [31,32]. Therefore, in this study, the visible light range of 400 nm to 780 nm was selected for analysis. The reflectance spectra of lettuce leaves under each treatment were averaged to obtain the spectral characteristic curve of lettuce leaves under cadmium stress, as shown in Figure 2.
As shown in Figure 2, the spectral curve trends of lettuce leaves under different concentrations of cadmium stress were basically the same. A reflectance peak and two absorption valleys appeared at 550 nm, 430 nm, and 670 nm, respectively, known as the “green peak”, “blue valley”, and “red valley” [33]. This may be because chlorophyll in lettuce leaves has a certain reflection ability for green light, while it has a strong absorption ability for blue and red light [31]. Between 680 nm and 750 nm, there was a significant increase in leaf reflectance, indicating the presence of the typical “red edge effect”. This could be attributed to the strong absorption capacity of chlorophyll for blue and red light or multiple reflections and scattering within the leaf tissue structure [34].
A small absorption dip was observed around the vicinity of 760nm, possibly due to the presence of a narrow absorption band of water in that region, the absorption caused by water vapor [35]. There is a certain difference in the spectral reflectance of lettuce leaves under different cadmium concentrations, which increases with the increase of cadmium concentration in the visible light range. This may be attributed to the fact that cadmium stress can affect chlorophyll synthesis, resulting in a decrease in chlorophyll content and an increase in leaf spectral reflectance [4]. The above phenomenon indicates that utilizing visible–near-infrared reflectance spectroscopy is a feasible approach for estimating the relative chlorophyll content of lettuce leaves under cadmium stress.

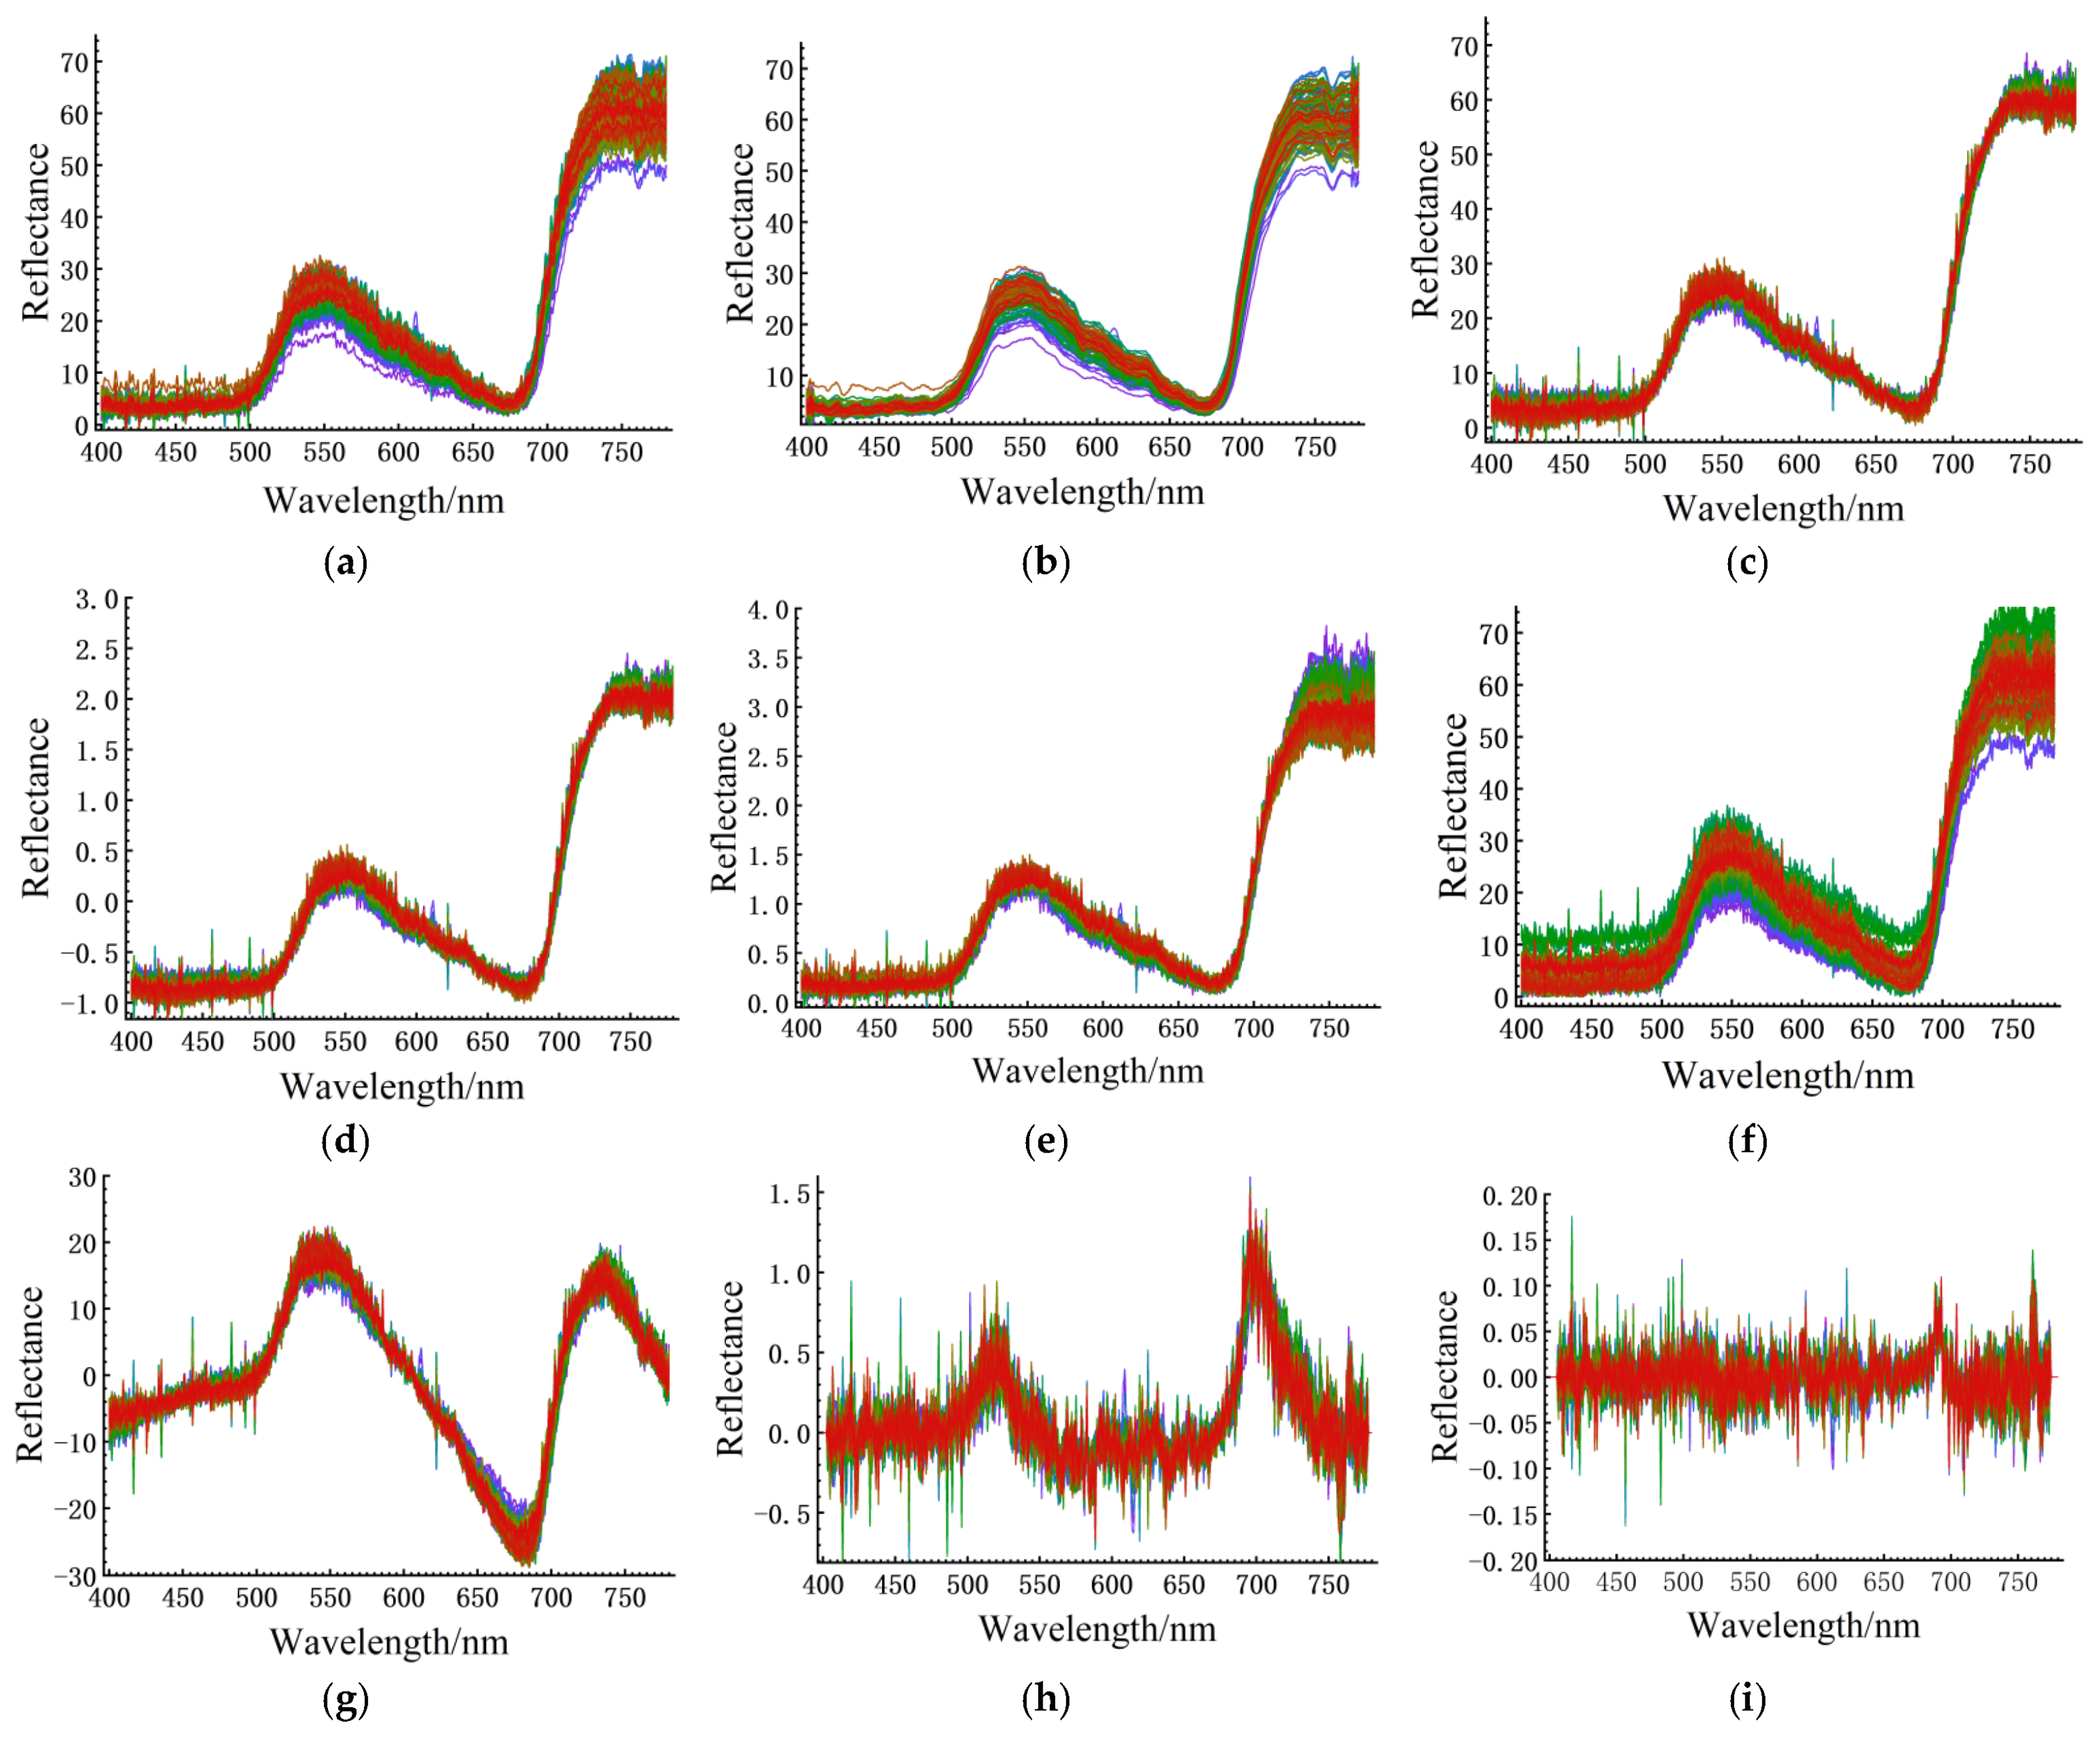
3.3. Spectral Preprocessing

From Figure 3, it can be observed that the SG preprocessing effectively eliminates the interference caused by noise during spectral information extraction. The MSC preprocessing primarily reduces the scattering effect in the spectral curve and enhances the correlation between the spectra and data. The SNV preprocessing is mainly used to eliminate spectral errors caused by variations in light intensity. The MN preprocessing contributes to the normalization of spectral intensity. The B preprocessing removes baseline drift and reduces signal overlap. The D preprocessing eliminates trend terms in the spectral data and improves the signal-to-noise ratio. FD and SD preprocessing result in the amplification of noise [5,36,37].

3.4. The Optimal Choice of Preprocessing

Combining the original spectral data and various preprocessed spectral data with partial least squares regression (PLSR) and using 10-fold cross-validation, different estimation models of relative chlorophyll content in lettuce leaves under cadmium stress were established, as shown in Table 1. The R2 and Rv2 values of different models are all greater than 0.80, indicating that the PLSR models established using the original spectral data and various preprocessed spectral data can be used for estimating the SPAD values of lettuce leaves under cadmium stress. Among them, the model established using the D preprocessing has the highest accuracy. Compared to the model built using the original spectral data, Rv2 has increased by 0.02, and RMSEv has reduced by 0.11. Therefore, subsequent analysis will be conducted using the spectra preprocessed with D.

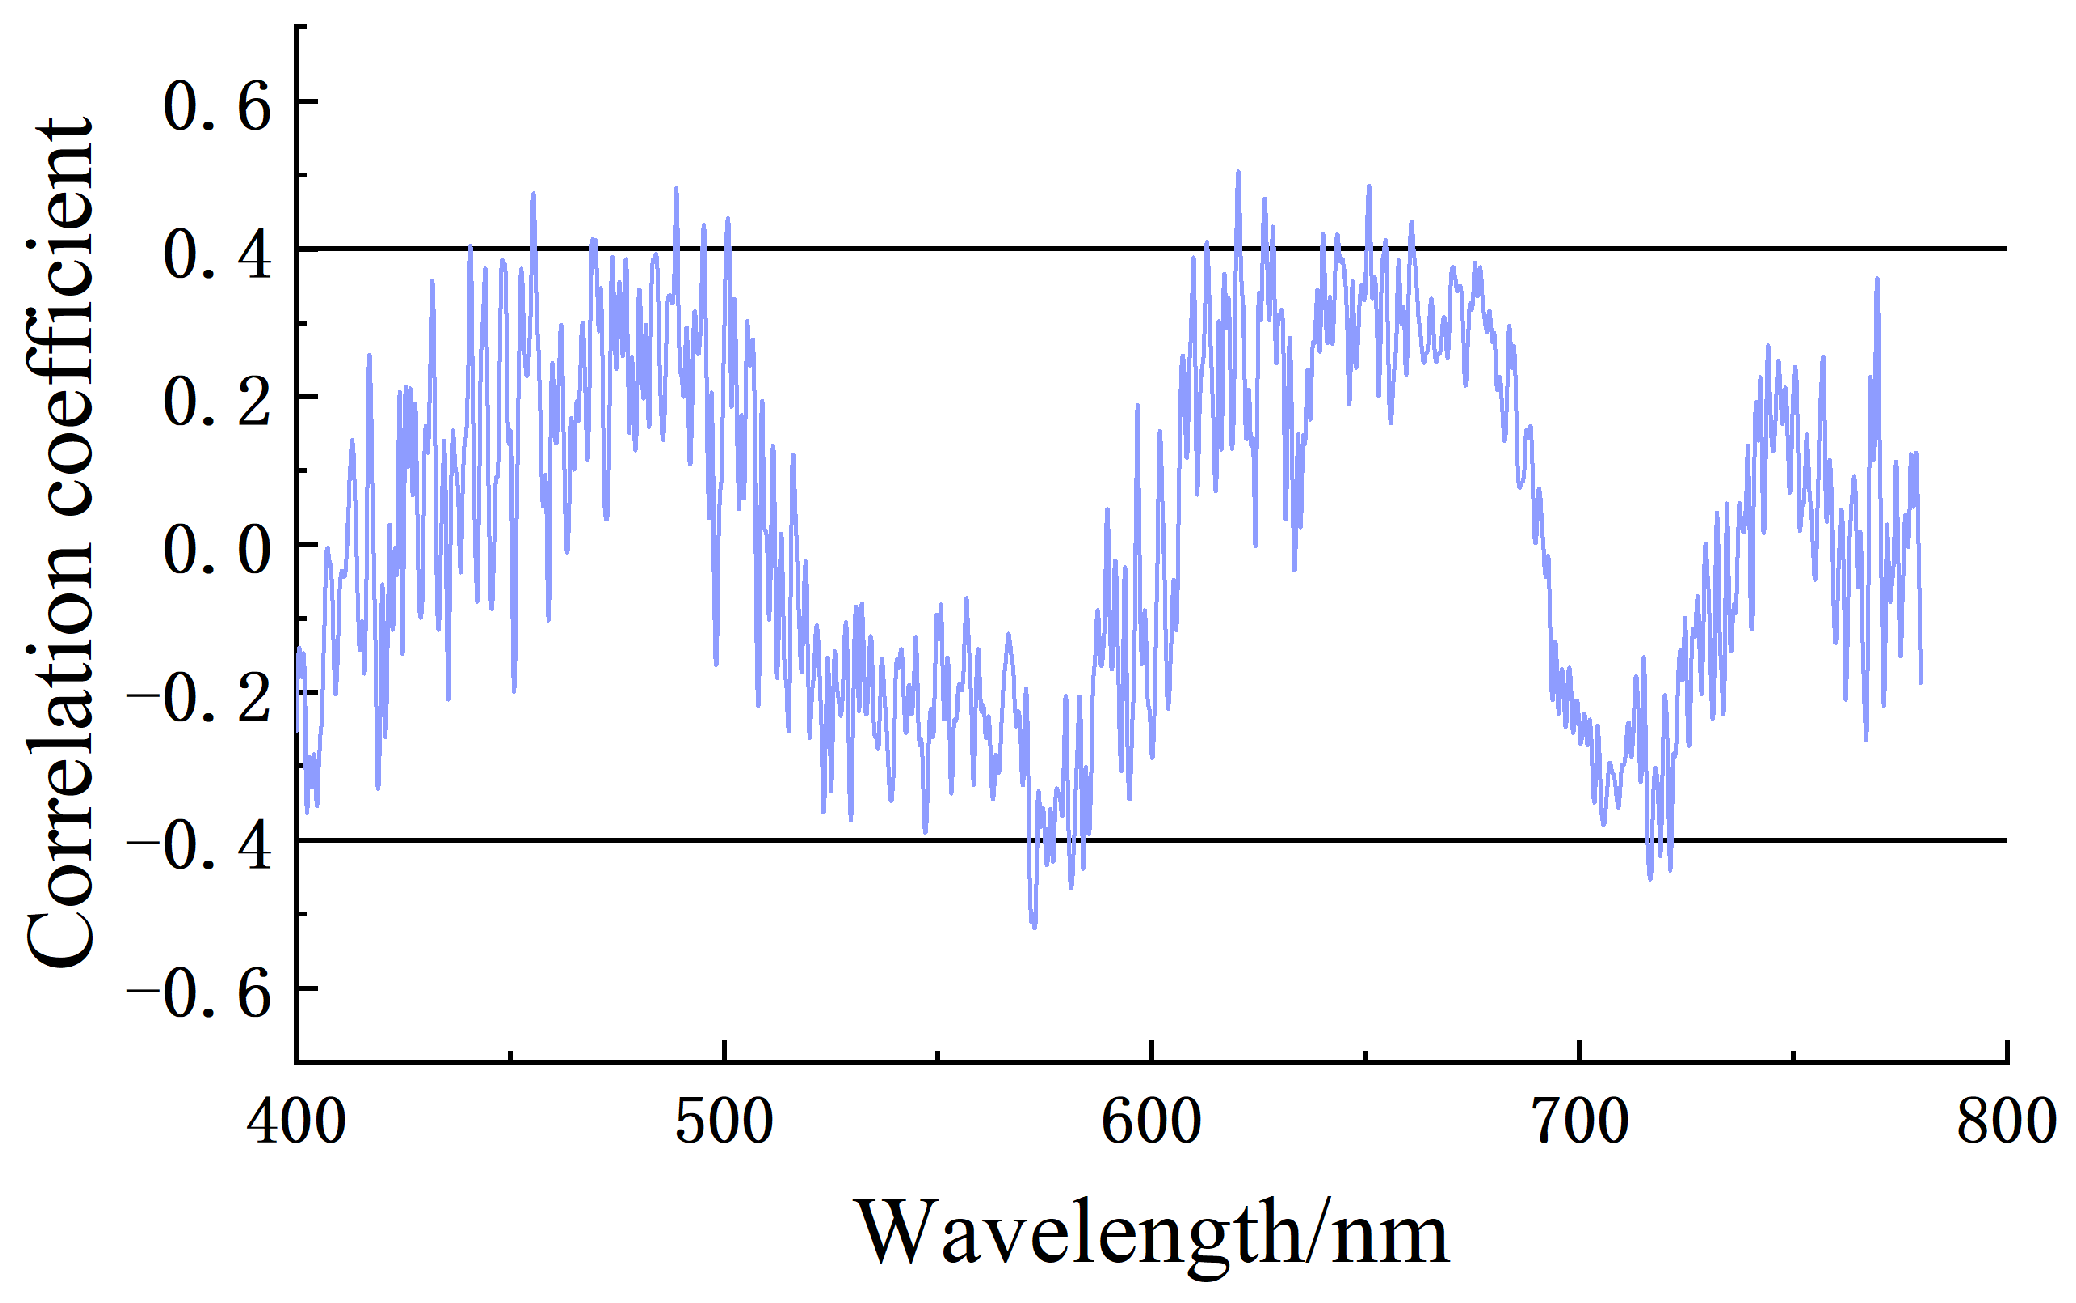
3.5. Feature Band Extraction

Correlation analysis between the D preprocessed spectral data and SPAD values of lettuce leaves under cadmium stress can be conducted using the Pearson correlation coefficient, as shown in Figure 4. The correlation coefficients between the spectral reflectance of different bands after D preprocessing and SPAD values range from −0.577 to 0.594. Among them, there are 71 bands with correlation coefficients with absolute values greater than 0.4. To reduce computational complexity and based on the significance results, the top 15 bands with the highest absolute correlation coefficients are selected for analysis [37]. These bands are 441 nm, 455 nm, 477 nm, 489 nm, 495 nm, 572 nm, 573 nm, 577 nm, 584 nm, 610 nm, 620 nm, 628 nm, 640 nm, 651 nm, and 721 nm.

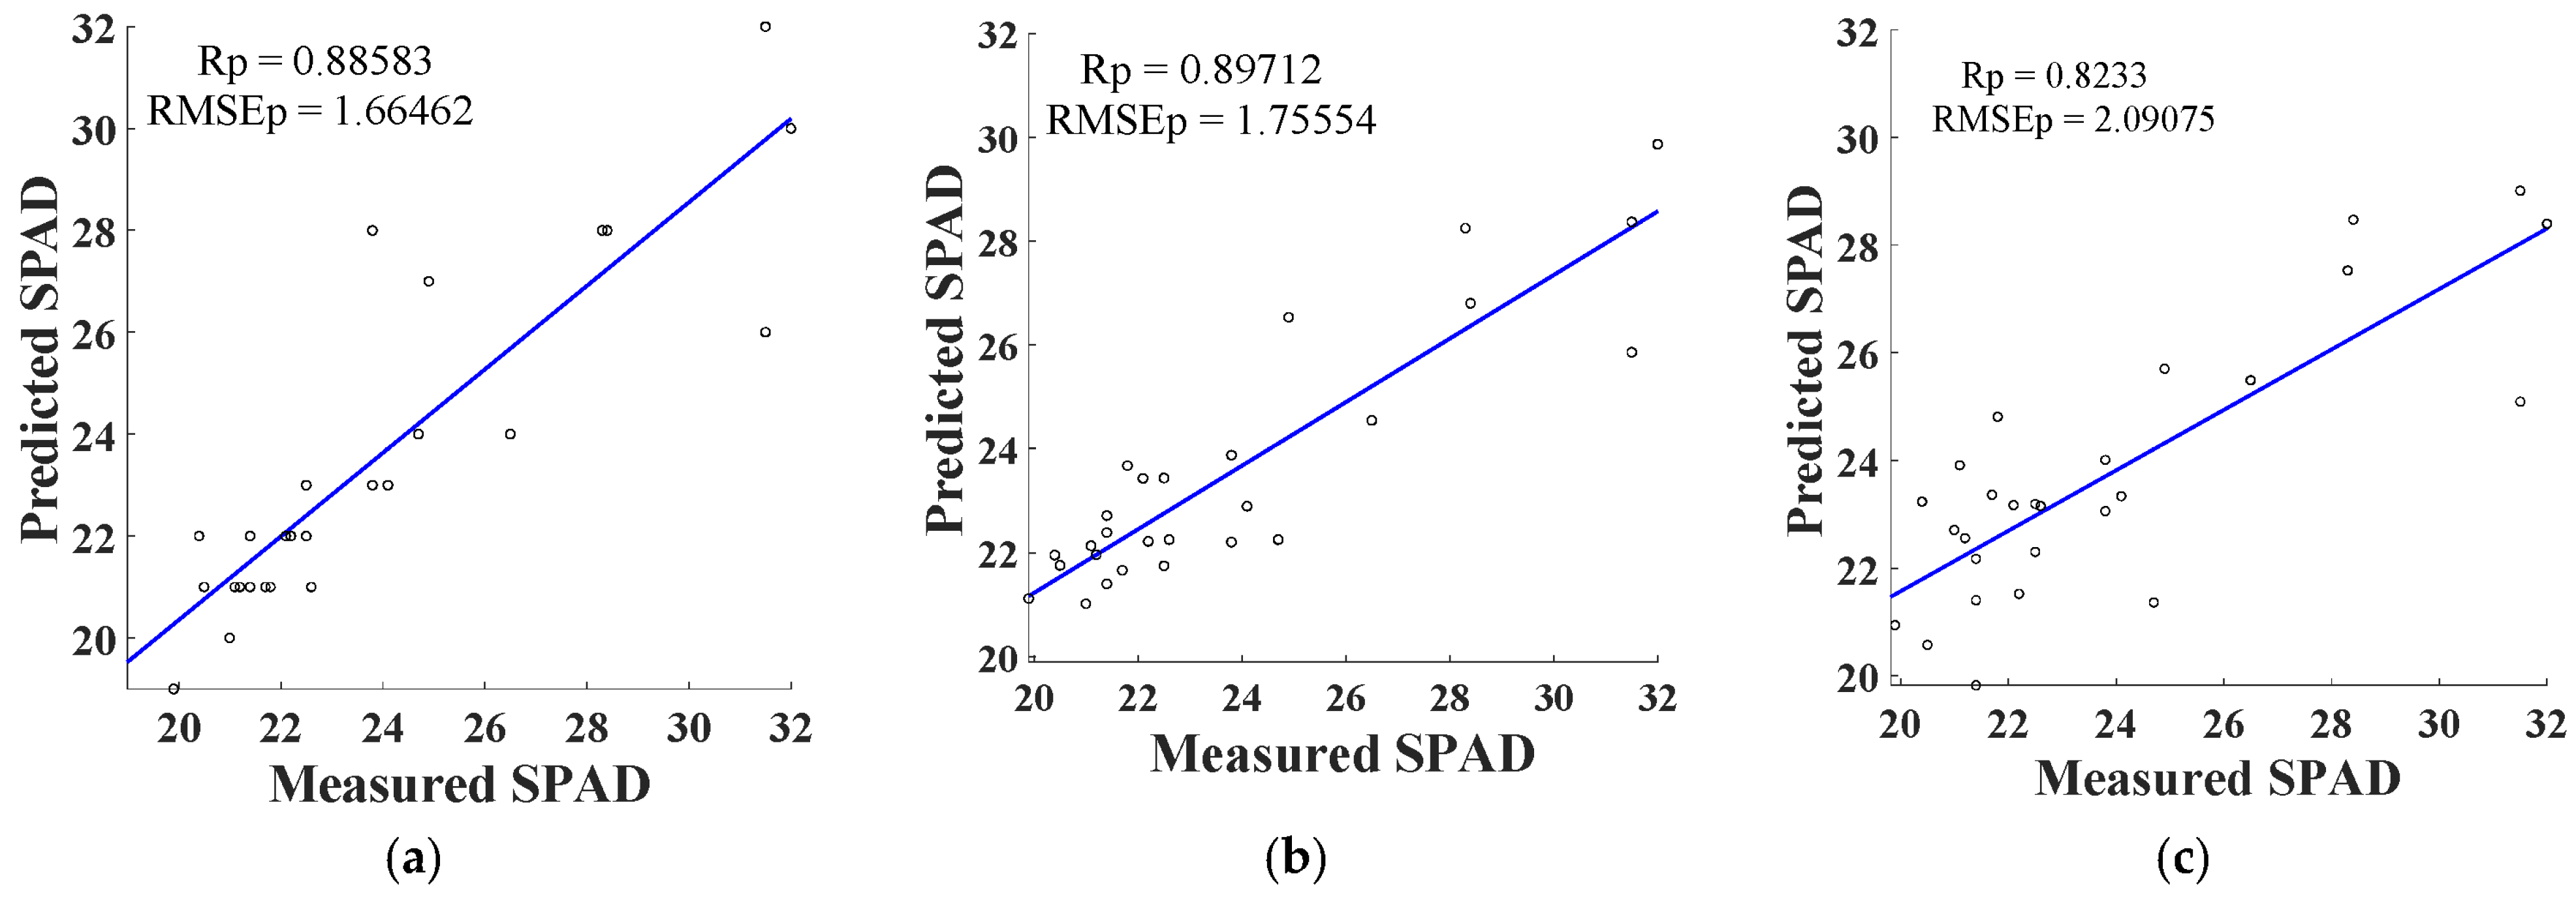
3.6. Feature Band Prediction Model Based on Support Vector Regression (SVR)

The feature bands extracted are used as input variables, and the SPAD values of lettuce leaves under cadmium stress are used as output variables to build prediction models based on support vector regression (SVR), including GA–SVR, POS–SVR, and GS–SVR. The training set and test set are divided in a ratio of 4:1. The modeling results are presented in Table 2. For the GA–SVR model, the best performance is achieved when using a sigmoid kernel function with a penalty parameter c of 6.74 and a kernel parameter g of 3.53. At this configuration, the R2 and RMSE of the training set are 0.98 and 0.27, respectively, while the Rp2 and RMSEp of the testing set are 0.77 and 1.66, respectively. In the POS–SVR model, the best performance is obtained when using a radial basis kernel function with a penalty parameter c of 5.86 and a kernel parameter g of 0.10. At this configuration, the R2 and RMSE of the training set are 0.95 and 0.71, respectively, while the Rp2 and RMSEp of the testing set are 0.75 and 1.76, respectively. In the GS–SVR model, the best performance is achieved when using a polynomial kernel function with a penalty parameter c of 4.00 and a kernel parameter g of 0.25. At this configuration, the R2 and RMSE of the training set are 0.69 and 1.77, respectively, while the Rp2 and RMSEp of the testing set are 0.66 and 2.09, respectively. For both the GA–SVR (linear kernel function) and PSO-SVR (polynomial kernel function) models, the negative Rp2 values in the testing set indicate the presence of overfitting.
Among the GA–SVR, PSO-SVR, and GS–SVR methods, the best models were selected for comparison, as shown in Figure 5. Different SVR models can be used to estimate the SPAD value of lettuce leaves under cadmium stress. Among them, the GA–SVR model has the highest accuracy.

4. Conclusions

With lettuce as the research subject and a pot planting method with exogenous cadmium addition being employed, the SPAD values and visible–near-infrared reflectance spectra of lettuce leaves under cadmium stress were measured and analyzed. A method for predicting the relative chlorophyll content of lettuce leaves under cadmium stress using visible–near-infrared reflectance spectroscopy was proposed. The following conclusions can be drawn:
  • As the cadmium stress intensity increases, the SPAD values of lettuce leaves gradually decrease while the spectral reflectance in the visible light range gradually increases. Therefore, it is feasible to use visible–near-infrared reflectance spectroscopy to invert the relative chlorophyll content of lettuce leaves.
  • By preprocessing the original spectra using SG, MSC, SNV, MN, B, D, FD, and SD and then using PLSR to invert the SPAD values of lettuce leaves, it was found that the spectral accuracy for predicting SPAD values improved when using the D preprocessed spectra compared to the original spectra. The Rv2 and RMSEv were 0.87 and 1.16, respectively.
  • By combining the feature bands selected using the correlation coefficient method with the SVR algorithm, it was found that the GA–SVR (sigmoid kernel function), PSO-SVR (Radial basis kernel function), and GS–SVR (Polynomial kernel function) models can estimate the SPAD values of lettuce leaves under cadmium stress. Among them, the GA–SVR (sigmoid kernel function) model exhibits the highest accuracy.
This study has established a theoretical and technical basis for using spectral remote sensing to monitor the growth status of lettuce leaves under cadmium stress. The use of visible–near-infrared spectroscopy technology can provide a reference for safe production and quality control of lettuce.

Author Contributions

Conceptualization, L.Z. (Leijinyu Zhou) and L.Z. (Lina Zhou); methodology, L.Z. (Leijinyu Zhou) and H.W.; formal analysis, L.Z. (Leijinyu Zhou) and L.K.; investigation, L.Z. (Lina Zhou) and J.L.; resources, L.Z. (Lina Zhou) and J.L.; writing—original draft preparation, L.Z. (Leijinyu Zhou) and T.J.; writing—review and editing, T.L. and L.K.; visualization, H.W. and T.J.; supervision, J.L.; funding acquisition, L.Z. (Lina Zhou). All authors have read and agreed to the published version of the manuscript.

Funding

This study was supported by the Scientific and Technological Research Projects of the Jilin Provincial Department of Education, grant number JJKH20240425KJ, founded by Lina Zhou. This study was supported by the Science and Technology Development Project of Jilin Province, grant number 20210202051NC, founded by Lina Zhou.

Data Availability Statement

The data presented in this study are available on request from the corresponding author. The data are not publicly available due to privacy.

Conflicts of Interest

The authors declare no conflicts of interest.

References

  1. Chen, Z.Q.; Liu, Q.Z.; Lin, Q.; Lu, L.M.; Lu, P.; Jin, H.Y.; Huang, L.L.; Yang, X.E. Evaluation of cadmium accumulation in different leafy vegetable cultivars and approaches for reducing accumulation. J. Agro-Environ. Sci. 2022, 41, 1671–1681. [Google Scholar]
  2. Liu, K.G.; Song, Y.P.; Zhang, L.L.; Gong, F.R. Comprehensive Comparison of Quality between Purple Leaf Lettuce and Green Leaf Lettuce. J. Change Veg. 2021, 6, 51–53. [Google Scholar]
  3. Wang, M.; Chen, Z.Q.; Chen, D.; Liu, L.; Hamid, Y.; Zhang, S.J.; Shan, A.Q.; Kang, K.J.; Feng, Y.; Yang, X.E. Combined cadmium and fluorine inhibit lettuce growth through reducing root elongation, photosynthesis, and nutrient absorption. Environ. Sci. Pollut. Res. Int. 2022, 29, 91255–91267. [Google Scholar] [CrossRef] [PubMed]
  4. Xiao, J.C.; Hui, F.T.; Yong, Z.W.; Xiao, M.X. Effects of Cadmium on metabolism of photosynthetic pigment and photosynthetic system in Lactuca sativa L. revealed by physiological and proteomics analysis. Sci. Hortic. 2022, 305, 111371. [Google Scholar]
  5. Li, M.; Hu, C.L.; Tao, G.L. Estimation of oil tea leaf SPAD values using hyperspectral remote sensing based on different preprocessing methods. J. Jiangsu For. Sci. Technol. 2022, 49, 1–5. [Google Scholar]
  6. Bei, C.; Jun, Q.Z.; Jiang, W.H.; Yu, X.S.; Chun, H.Y.; Feng, X.Z. Leaf chlorophyll content retrieval of wheat by simulated RapidEye, Sentinel-2 and EnMAP data. J. Integr. Agric. 2018, 18, 1230–1245. [Google Scholar]
  7. Cordon, G.; Lagorio, G.M.; Paruelo, M.J. Chlorophyll fluorescence, photochemical reflective index and normalized difference vegetative index during plant senescence. J. Plant Physiol. 2016, 199, 100–110. [Google Scholar] [CrossRef] [PubMed]
  8. Li, Z.; Zhang, F.; Chen, L.H.; Zhang, H.W. Research on Spectrum Variance of Vegetation Leaves and Estimation Model for Leaf Chlorophyll Content Based on the Spectral Index. Spectrosc. Spectr. Anal. 2018, 38, 1533–1539. [Google Scholar]
  9. Qi, H.L.; Wei, H.H.; Paul, J. Use of a SPAD-502 meter to measure leaf chlorophyll concentration in Arabidopsis thaliana. Photosynth. Res. 2011, 107, 209–214. [Google Scholar]
  10. Cao, Y.L.; Zou, H.D.; Zheng, W.; Jiang, K.L.; Yu, F.H. Study on Methods of Reducing Hyperspectral Data and Retrieving Chlorophyll Content from Rice Leaf. J. Shenyang Agric. Univ. 2019, 50, 101–107. [Google Scholar]
  11. Zhang, Z.R.; Chang, Q.R.; Zhang, T.L.; Ban, S.T.; You, M.M. Hyperspectral estimation of chlorophyll content of cotton canopy leaves based on Support Vector Machine. J. Northwest A F Univ. (Nat. Sci. Ed.) 2018, 46, 39–45. [Google Scholar]
  12. Yao, J.S.; Yang, H.Q.; He, Y. Nondestructive detection of rape leaf chlorophyll level based on Vis/NIR spectroscopy. J. Zhejiang Univ. (Agric. Life Sci.) 2009, 35, 433–438. [Google Scholar]
  13. Shao, Y.N.; Zhao, C.J.; Bao, Y.D.; He, Y. Quantification of Nitrogen Status in Rice by Least Squares Support Vector Machines and Reflectance Spectroscopy. Food Bioprocess Technol. 2012, 5, 100–107. [Google Scholar] [CrossRef]
  14. Vali, S.R.; Araz, N.S.; Ebrahim, T.; Ibham, V.; Antoni, S.; Adam, F. Prediction of winter wheat leaf chlorophyll content based on VIS/NIR spectroscopy using ANN and PLSR. Food Sci. Nutr. 2023, 11, 2166–2175. [Google Scholar]
  15. Tan, L.; He, B.Y.; Liu, W.G.; Pang, D. Estimation of chlorophyll content of Eremurus chinensis based on optimization support vector regression machine. Chin. J. Ecol. 2017, 36, 555–562. [Google Scholar]
  16. Tao, L.; Zhang, N.M. Growth Response of Three Leafy Vegetables to Cd Pollution and Their Cd Accumulation Characteristics. Chin. Agric. Sci. Bull. 2018, 34, 99–106. [Google Scholar]
  17. Sun, J.; Zhang, Y.C.; Mao, H.P.; Wu, X.H.; Chen, Y.; Wang, Q.P. Responses Analysis of Lettuce Leaf Pollution in Cadmium Stress Based on Computer Vision. Trans. Chin. Soc. Agric. Mach. 2018, 49, 166–172. [Google Scholar]
  18. Sun, Y.L.; Zhao, J.W.; Liu, X.S.; Li, S.Y.; Ma, C.H.; Wang, X.Z.; Zhang, Q.B. Effect of nitrogen application on photosynthetic daily variation, leaf morphology and dry matter yield of alfalfa at the early flowering growth stage. Acta Pratacult. Sin. 2022, 31, 63–75. [Google Scholar]
  19. Berens, M.L.; Wolinska, K.W.; Spaepen, S.; Ziegler, J.; Nobori, T.; Nair, A.; Krüler, V.; Winkelmüller, T.M.; Wang, Y.M.; Mine, A.; et al. Balancing trade-offs between biotic and abiotic stress responses through leaf age-dependent variation in stress hormone cross-talk. Proc. Natl. Acad. Sci. USA 2019, 116, 2364–2373. [Google Scholar] [CrossRef]
  20. Wang, J.; Chen, S.T.; Ding, S.C.; Yao, X.W.; Zhang, M.M.; Hu, Z.H. Relationships between the Leaf Respiration of Soybean and Vegetation Indexes and Leaf Characteristics. Spectrosc. Spectr. Anal. 2022, 42, 1607–1613. [Google Scholar]
  21. Kang, L.; Yuan, J.Q.; Gao, R.; Kong, Q.M.; Jia, Y.J.; Su, Z.B. Early detection and identification of rice blast based on hyperspectral image. Spectrosc. Spectr. Anal. 2021, 41, 898–902. [Google Scholar]
  22. Liu, J.; Chang, Q.R.; Liu, M.; Yin, Z.; Ma, W.J. Chlorophyll Content Inversion with Hyperspectral Technology for Apple Leaves Based on Support Vector Regression Algorithm. Trans. Chin. Soc. Agric. Mach. 2016, 47, 260–265+272. [Google Scholar]
  23. Leone, P.A.; Viscarra-Rossel, A.R.; Amenta, P.; Buondonno, A. Prediction of Soil Properties with PLSR and vis-NIR Spectroscopy: Application to Mediterranean Soils from Southern Italy. Curr. Anal. Chem. 2012, 8, 283–299. [Google Scholar] [CrossRef]
  24. RebeccaJo, V.; Bhogilal, H.V.; Doug, A.; Chao, C.S.; Adam, G.; Viacheslav, A.; Asim, B. Evaluation of Optimized Preprocessing and Modeling Algorithms for Prediction of Soil Properties Using VIS-NIR Spectroscopy. Sensors 2021, 21, 6745. [Google Scholar]
  25. Ren, X.; Lao, C.L.; Xu, Z.L.; Jin, Y.; Guo, Y.; Li, J.H.; Yang, Y.H. The Study of the Spectral Model for Estimating Pigment Contents of Tobacco Leaves in Field. Spectrosc. Spectr. Anal. 2015, 35, 1654–1659. [Google Scholar]
  26. Zheng, G.H.; Xiao, T.Z.; Meng, Y.L.; Tian, Q.M.; Zhi, C.L. Prediction of Carbon Emission of the Transportation Sector in Jiangsu Province-Regression Prediction Model Based on GA-SVM. Sustainability 2023, 15, 3631. [Google Scholar]
  27. Zhou, X.X.; Li, N.; Pan, Y.Z.; Sun, L.X. Optimized SVR based on artificial bee colony algorithm for leaf area index inversion. Natl. Remote Sens. Bull. 2022, 26, 766–780. [Google Scholar] [CrossRef]
  28. Yu, K.L.; Meng, Q.M.; Zou, J.H. Effects of Cd2+ on Seedling Growth, Chlorophyll Contents and Ultrastructures in Maize. Acta Agric. Boreali-Sin. 2010, 25, 118–123. [Google Scholar]
  29. Wu, Y.Y.; Deng, S.Q.; Liu, S.Q.; Luo, H.B.; Yi, Z.X.; Deng, M. Effects of cadmium stress on the growth and physiological characteristics of maize seedlings from different varieties. J. Hunan Agric. Univ. (Nat. Sci.) 2023, 49, 509–515. [Google Scholar]
  30. Zhou, L.; Zhou, L.; Wu, H.; Kong, L.; Li, J.; Qiao, J.; Chen, L. Analysis of Cadmium Contamination in Lettuce (Lactuca sativa L.) Using Visible-Near Infrared Reflectance Spectroscopy. Sensors 2023, 23, 9562. [Google Scholar] [CrossRef]
  31. Yu, J.Y.; Chang, Q.R.; Ban, S.T.; Tian, M.L.; You, M.M. Hyperspectral models for estimating SPAD values of kiwifruit leaves. Agric. Res. Arid Areas 2018, 36, 168–174. [Google Scholar]
  32. Shu, T.; Li, R.; Chen, Z.; Sun, C.; Liu, C.; Xu, Y. Study on spectral characteristics and SPAD value estimation model of Cucurbita ficifolia leaf. Jiangsu Agric. Sci. 2023, 51, 222–227. [Google Scholar]
  33. Ma, D.H.; Ke, C.Q. Research on Spectral Characteristics of Winter Typical Vegetation in Nanjing. Remote Sens. Technol. Appl. 2016, 31, 702–708. [Google Scholar]
  34. Huang, M.G.; Wang, X.H.; Ma, L.L.; Ye, X.H.; Zhu, X.H.; Kong, W.P.; Wang, N.; Wang, Q.; Ouyang, G.Z.; Zheng, Q.C.; et al. Research progress on remote sensing discrimination techniques for grassland botanical species. Acta Pratacult. Sin. 2023, 32, 167–185. [Google Scholar]
  35. Feng, W.; Guo, T.C.; Xie, Y.X.; Wang, Y.H.; Zhu, Y.J.; Wang, C.Y. Spectrum Analytical Technique and Its Applications for the Crop Growth Detection. Chin. Agric. Sci. Bull. 2009, 25, 182–188. [Google Scholar]
  36. Xin, Z.; Jun, S.; Yan, T.; Quan, S.C.; Xiao, H.W.; Ying, Y.H. A deep learning based regression method on hyperspectral data for rapid prediction of cadmium residue in lettuce leaves. Chemom. Intell. Lab. Syst. 2020, 200, 103996. [Google Scholar] [CrossRef]
  37. Wang, J.Y.; Xie, S.S.; Gai, J.Y.; Wang, Z.T. Hyperspectral Prediction Model of Chlorophyll Content in Sugarcane Leaves Under Stress of Mosaic. Spectrosc. Spectr. Anal. 2023, 43, 2885–2893. [Google Scholar]
Figure 1. Effects of cadmium stress on the SPAD values of lettuce leaves. Note: Different lowercase letters indicate significant differences at the p < 0.05 level.
Agronomy 14 00427 g001
Figure 2. The spectral characteristics of lettuce leaves under cadmium stress.
Agronomy 14 00427 g002
Figure 3. The spectral curves after preprocessing: (a) The original spectral curves; (b) The spectra preprocessed with SG; (c) The spectra preprocessed with MSC; (d) The spectra preprocessed with SNV; (e) The spectra preprocessed with MN; (f) The spectra preprocessed with B; (g) The spectra preprocessed with D; (h) The spectra preprocessed with FD; (i) The spectra preprocessed with SD.
Agronomy 14 00427 g003
Figure 4. The correlation coefficients between the reflectance of each band and SPAD values.
Agronomy 14 00427 g004
Figure 5. Model comparison: (a) GA–SVR; (b) PSO-SVR; (c) GS–SVR.
Agronomy 14 00427 g005
Table 1. Comparative analysis of PLSR models using different preprocessing and original spectral data.
Preprocessing MethodNumber of
Principal Components
Training SetTesting Set
R2RMSERv2RMSEv
original spectral70.910.950.851.27
SG100.901.000.811.41
MSC100.901.030.821.39
SNV110.940.810.841.31
NM70.901.030.821.38
B70.920.920.851.25
D80.940.820.871.16
FD100.901.000.821.37
SD90.891.090.811.42
Table 2. Comparison analysis of SVR models.
ModelsKernel FunctionsPenalty
Parameter c
Kernel
Parameter g
Training SetTesting Set
R2RMSERp2RMSEp
GA–SVRLinear kernel function4.8482.400.980.27−0.653.67
Polynomial kernel function4.620.310.532.000.342.75
Radial basis kernel function 4.443.120.970.330.741.79
Sigmoid kernel function6.743.530.980.270.771.66
PSO-SVRLinear kernel function5.860.100.681.780.602.25
Polynomial kernel function5.860.101.000.14−0.854.69
Radial basis kernel function 5.860.100.950.710.751.76
Sigmoid kernel function5.860.10−0.013.200.003.57
GS–SVRLinear kernel function4.000.250.661.840.612.24
Polynomial kernel function4.000.250.691.770.662.09
Radial basis kernel function 4.000.250.671.810.632.15
Sigmoid kernel function4.000.250.392.470.402.76
Disclaimer/Publisher’s Note: The statements, opinions and data contained in all publications are solely those of the individual author(s) and contributor(s) and not of MDPI and/or the editor(s). MDPI and/or the editor(s) disclaim responsibility for any injury to people or property resulting from any ideas, methods, instructions or products referred to in the content.

