Article

Evaluation of Bioactive Compounds and Antioxidant Activity of Green and Red Kale (Brassica oleracea L. var. acephala) Microgreens Grown Under White, Red, and Blue LED Combinations

by
Anna Podsędek
1,*,
Barbara Frąszczak
2,
Dominika Kajszczak
1 and
Dorota Sosnowska
1
1
Institute of Molecular and Industrial Biotechnology, Faculty of Biotechnology and Food Sciences, Lodz University of Technology, Stefanowskiego 2/22, 90-537 Łódź, Poland
2
Department of Vegetable Crops, Poznań University of Life Sciences, Dąbrowskiego 159, 60-594 Poznań, Poland
*
Author to whom correspondence should be addressed.
Agronomy 2024, 14(11), 2454; https://doi.org/10.3390/agronomy14112454
Submission received: 28 August 2024 / Revised: 3 October 2024 / Accepted: 15 October 2024 / Published: 22 October 2024
(This article belongs to the Section Plant-Crop Biology and Biochemistry)

Abstract

:
Microgreens have great potential for improving the nutritional value of human diets, as well as constituting a promising dietary option for preventing chronic disease. Light-emitting diodes (LEDs) are commercially used as a light source to improve the growth of microgreens, as well as nutrient and bioactive compound accumulation. Here, we provide the first report of the phenolic compound, chlorophyll and carotenoid pigment, and dietary fiber contents of red and green kale microgreens grown in a growth chamber under white LEDs combined with red or blue light. Significant differences in the response of phytocompounds between white light and its combination with blue or red LEDs were determined. These studies showed that a combination of white and blue LEDs positively influenced the accumulation of phenolic compounds, which consequently determined high antioxidant activity. On the contrary, the white LED lights were the most suitable for the accumulation of carotenoids and chlorophylls, including chlorophyll a and b, and Klason lignin. These results suggest that the use of a combination of white light with blue or red light can increase the concentration of phenolic compounds and dietary fiber in red and green kale microgreens and thus may enhance their health-promoting potential.

1. Introduction

Microgreens have the potential to increase the diversity of agricultural production in the world, especially in the face of limited availability of fresh plant products. They have a short growth cycle (7 to 21 days) and can quickly grow with minimum input in a small area year-round [1]. Microgreens are defined as plants that are consumed when their first true leaves appear. They are often more nutrient- and bioactive-compound-dense than mature plant forms [2,3,4,5,6,7]. Many plant species can be cultivated as microgreens, including broccoli (Brassica oleracea var. italica), radish (Raphanus sativus L.), cabbage (B. oleracea L. var. capitata), mustard (B. juncea (L.) Czern.), kohlrabi (B. oleracea L. var. gongylodes), pak choi (B. rapa subsp. Chinensis), and kale (B. oleracea var. acephala) from the genus Brassica [1,5,8]. The slightly bitter flavor and crisp texture of kale microgreens make them an excellent addition to salads, sandwiches, and smoothies [5]. Additionally, kale microgreens have shown antiproliferative effects in colon cancer Caco-2 cells [9], antioxidant properties [10,11,12,13], and anti-diabetic and anti-cholinergic activity [13] due to the bioactive compounds found therein, such as vitamin C, glucosinolates, carotenoids, chlorophylls, and phenolic compounds.
Lighting is one crucial parameter for regulating the production of microgreens. Light-emitting diodes (LEDs) can now be custom-designed and controlled to provide desirable wavelengths that are efficient for the synthesis of bioactive plant secondary metabolites in comparison to traditional fluorescent light or high-pressure sodium light lamps. LED light can be emitted as both white light and monochromatic light (e.g., far-red, UV, green, blue, and red light). The combination of several LEDs allows the emission of monochromatic lights with different intensity or with different spectral composition [1,8,14,15,16]. There have been some studies investigating the effect of LEDs on the morphological parameters and phytochemicals of kale microgreens [10,12,17,18,19,20,21,22,23]. Most of the above-mentioned studies used monochromatic red or blue LEDs or a combination thereof. Red LEDs promoted the growth of green and red kale microgreens, as well as Chinese kale (Brassica oleracea var. alboglabra) [17,18,19]. Chinese kale and kale microgreens grown under blue LEDs showed a higher antioxidant activity and total phenolic content than plants under white and red LEDs [10,12,19]. Contrary, white LEDs were more suitable in terms of carotenoid content and ascorbic acid production, as well as catalase and ascorbate peroxidase activity, in Chinese kale [19]. On the other hand, LED lighting treatments influenced the quantitative composition of glucosinolates and phenolic compounds differently in kale microgreens [10]. For example, blue and red LED illumination resulted in the highest content of glucoraphanin, while white and blue LEDs resulted in higher levels of glucobrassicannapin and progoitrin. The biosynthesis of ferulic, gallic and sinapic acids, as well as catechin and quercetin was the most efficient in microgreens grown under blue LEDs, followed by white and red LEDs. Ying et al. [21], using different proportions of blue light (5% to 30%) and red light (70% to 95%) in the cultivation of Siberian kale, demonstrated that the share of blue light does not affect the levels of total chlorophyll and total carotenoids, while kale microgreens accumulated more total phenolics and anthocyanins at 30% blue light. Similarly, an increasing percentage of blue light (from 10 to 40%) from blue/red LEDs did not significantly affect the total carotenoid and chlorophyll pigment concentrations in Chinese kale microgreens [23]. Kamal et al. [22] demonstrated the positive influence of providing green light with a mixture of red and blue LEDs to improve the growth and morphology of kale Tuscan microgreens. The addition of far-red and ultraviolet A to white light reduced and did not affect the biomass of kale microgreens (cv. Red Russian), respectively [20]. Additionally, neither treatment caused changes in their total phenolic and anthocyanin content compared to white LEDs.
Our previous studies have shown that the addition of red and blue light to white light had a positive effect on the morphological and photosynthetic parameters of green and red kale microgreens [17]. However, the addition of red light stimulated dry matter production and the Chlorophyll Content Index (CCI) in red kale microgreens, whereas blue light supported leaf development and dry matter accumulation only in green kale. On the other hand, a combination of white and blue or red light negatively affected the CCI of green kale microgreens. Furthermore, Raman spectra analysis revealed a worse chemical composition of both microgreens under white light compared to other light combinations. To sum up, a combination of white and blue LEDs had a greater impact on the content of bioactive compounds of red kale, while its growth was increased under red and white LEDs. The opposite situation was observed in green kale microgreens. The differences described above indicated a significant effect of lighting on the growth and color of kale microgreens, which prompted us to continue research to determine the qualitative and quantitative composition of compounds with a beneficial effect on our health. Therefore, the objective of this study was to investigate the effect of white light and its combination with red or blue LEDs on the contents of phenolic compounds, carotenoids, chlorophylls, and fiber in green and red kale microgreens. Additionally, the antioxidant properties as a synthetic radical (DPPH, 2,2-diphenyl-1-picrylhydrazyl), radical cation (ABTS, 2,2′-azinobis (3-ethyl-benzthiazoline-6-sulphonic acid), and peroxyl radical (ORAC, oxygen radical absorbance capacity) scavenger and the reducing power (FRAP, ferric ion reducing antioxidant power) of the extractable microgreen components were assessed.

2. Materials and Methods

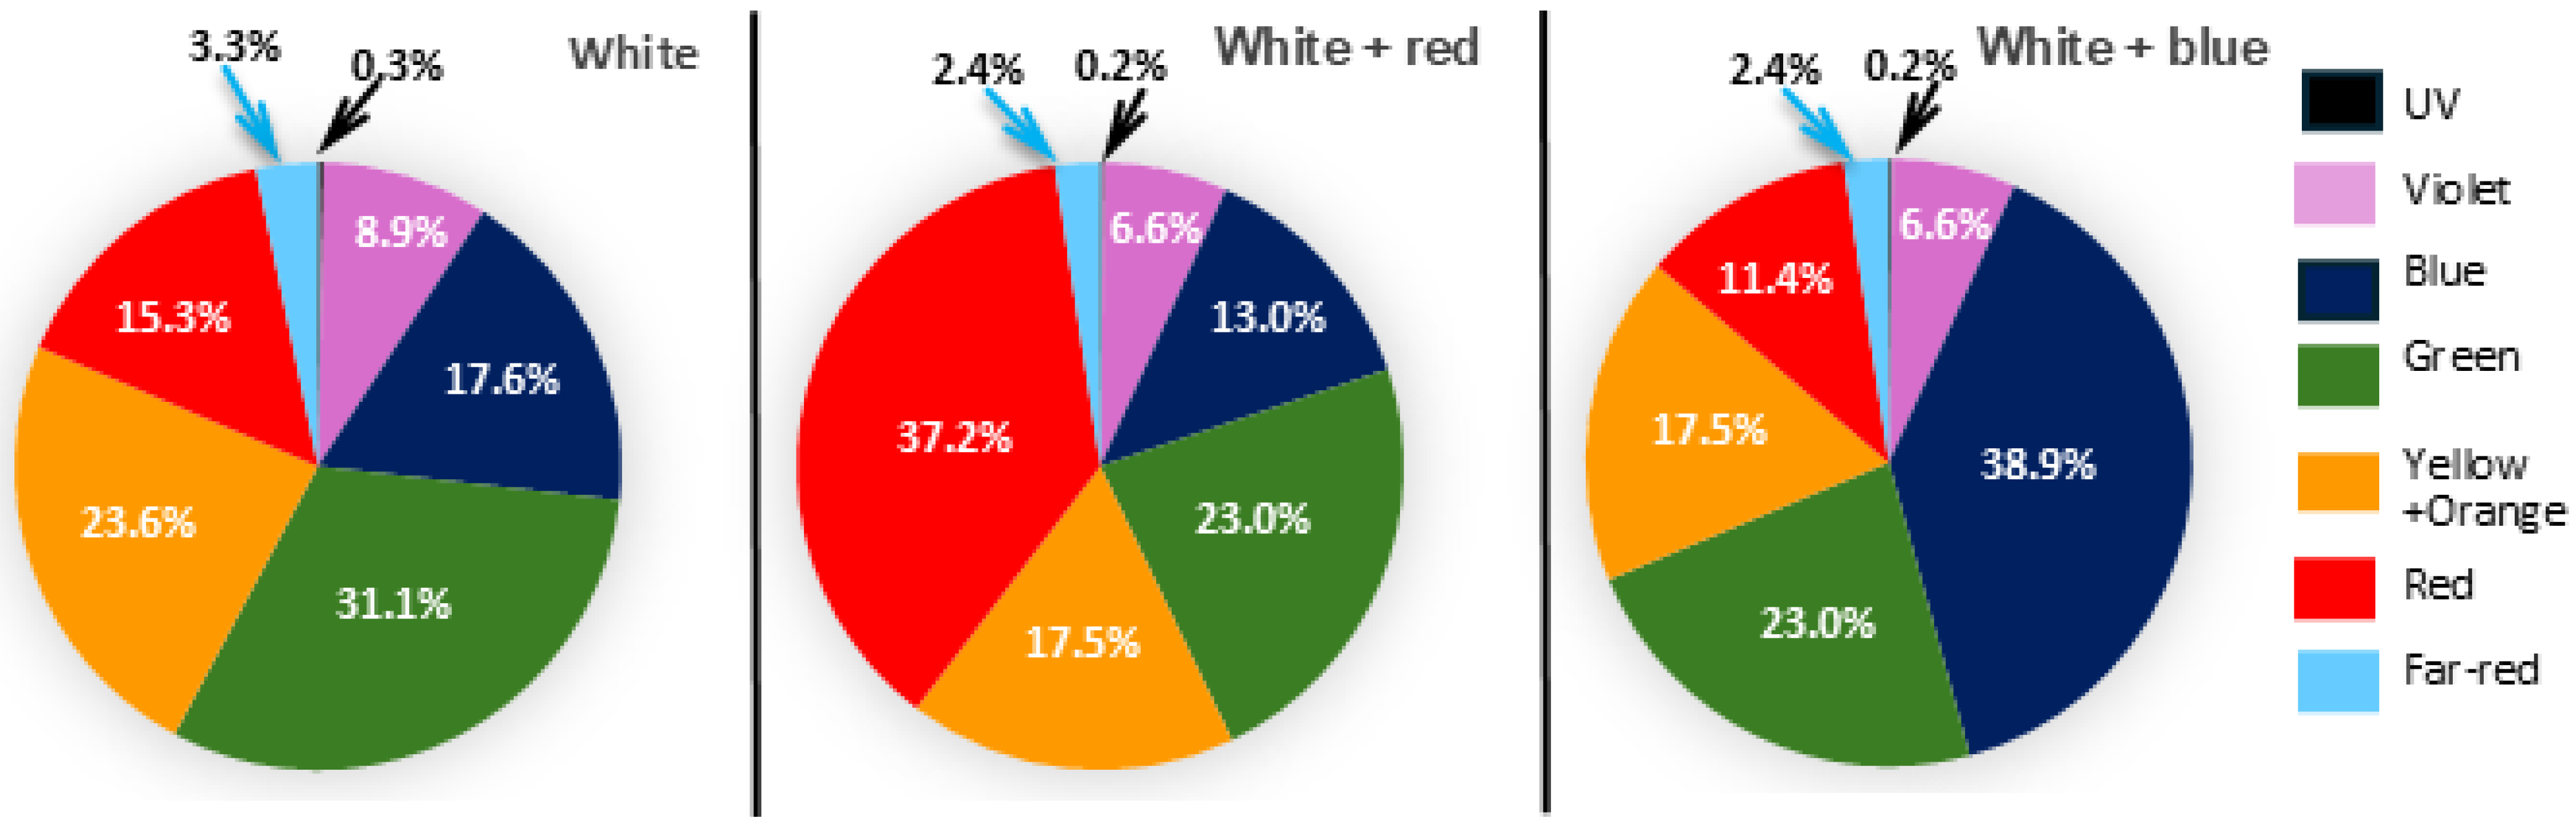
2.1. Plant Material and Growth Conditions

Seeds of red leaf kale ‘Scarlet’ and green leaf kale ‘Kapral’ were purchased from the ‘W. Legutko’ (Jutrosin, Poland). Seeds were spilled in a commercial peat substrate (Hartmann, Poland) on trays (3 g/tray) measuring 30 × 50 × 5 cm (7.5 L). Plants were not additionally fertilized during cultivation; watering was performed every few days, depending on the needs of the plants. Temperature and humidity sensors were placed in the soil (IP67 ZigBee Tuya, Vislone, Guangdong, China). The substrate was irrigated when soil moisture fell below 80%. The growing substrate was irrigated using tap water until the appearance of visible drainage. Microgreens were grown in the growth chambers, each equipped with its own independent lighting and light of different spectral compositions. The temperature was maintained at 23 °C for the first two days, then 21 (day)/17 (night) ± 2 °C. The relative humidity was 60–70%. The red, blue, and white light came from a high-power solid-state lighting module (LED) (SMD type, Seoul Semiconductor Co., Seoul, Republic of Korea). The spectra of the lighting variants used are shown in Figure 1. The photosynthetic photon flux density (PPFD) for white light (W) was 230 µmol m−2 s−1, while for the combination of white light with the addition of red light (W + R) or blue light (W + B), it was about 170 µmol m−2 s−1 (±14 SD) of white light and an additional 60 µmol/m2 × s (±8 SD) of blue and red light. The total PPFD for all combinations was 230 µmol m−2 s−1. The PPFD was measured with a PAR-10 quantum sensor (Sonopan, Białystok, Poland). The daily light dose was approximately 13.2 µmol m−2 s−1 with a 16 h photoperiod. The proportion of red light to blue light for white light was 0.87; white + red light—2.86, and white + blue light—0.29. The spectral distribution of white light was measured with a BLACK-Comet CXR UV-VIS spectroradiometer (280–900 nm, StellarNet Inc., Tampa, FL, USA).
Kale microgreens were harvested after 14 days of cultivation by cuts at the base of the seedling near the substrates using scissors. The microgreens were freeze-dried immediately after harvesting and then used for further analyses.

2.2. Standards and Reagents

Cyanidin cyanidin 3-glucoside and chlorogenic acid were purchased from Extrasynthese (Lyon, France), gallic acid and kaempferol 3-glucoside were obtained from Sigma-Aldrich (Steinheim, Germany), and quercetin 3-glucoside was from PhytoLab (Vestenbergsgreuth, Germany). Protease from Bacillus licheniformis (≥2.4 U/g), anthrone, 2,2′-azinobis(3-ethyl-benzthiazoline-6-sulphonic acid) (ABTS), 3,5-dimethylphenol, 2.2′-azobis(2-methylpropionamidine dihydrochloride (AAPH), fluorescein, 1,1-diphenyl-2-picrylhydrazyl radical (DPPH), 6-hydroxy-2,5,7,8-tetramethychroman-2-carboxylic acid (Trolox), β-nicotinamide adenine dinucleotide, reduced disodium salt (NADH), phenazine methosulfate (PMS), potassium persulfate, tetrazolium blue (NBT), 2,4,6-tris-2-pyridyl-s-triazine (TPTZ), galacturonic acid, and glucose were obtained from Sigma-Aldrich (Steinheim, Germany). Acetonitrile (Merck, Darmstadt, Germany) and formic acid (Sigma-Aldrich, Steinheim, Germany) were hyper-grade for LC-MS. The other reagents were of analytical grade. All solutions were prepared using ultrapure water (SimplicityTM Water Purification System, Millipore, Marlborough, MA, USA).

2.3. Extraction and Analysis of Photosynthetic Pigments

Freeze-dried microgreens (about 50 mg) were extracted thrice with 20 mL of 80% acetone aqueous solution (v/v) on a magnetic stirrer for 10 min at room temperature. The extraction was performed in duplicate. Absorbance of pooled organic layers was measured at 470 nm, 663 nm, and 645 nm against 80% acetone using a Metertech spectrophotometer (model SP-830 Plus, Medson S.c., Paczkowo, Poland). Each sample was analyzed in duplicate. Total carotenoids, total chlorophyll, chlorophyll a, and chlorophyll b contents were calculated based on the formulas given by Majdoub et al. [24] and expressed as mg/100 g dry weight (DW) of microgreens.

2.4. Extraction of Phenolic Compounds

To extract the phenolic compounds the dry microgreens (1.0 g) were extracted with 100 mL of 60% ethanol aqueous solution (v/v) containing 0.1% (v/v) concentrated hydrochloric acid on a magnetic stirrer for 30 min at room temperature. After centrifugation at 5000 rpm for 10 min (Centrifuge MPW-351R, MPW MED. Instruments, Warszawa, Poland), the residue was extracted with 100 mL of 70% acetone aqueous solution (v/v) under the same conditions as previously described. The extraction was performed in duplicate. The combined ethanol and acetone extracts were evaporated at 40 °C under reduced pressure (Rotavapor R-3, Büchi, Flavil, Switzerland) to obtain 40 mL of aqueous solution. These crude extracts were analyzed to determine the qualitative and quantitative composition of phenolic compounds, as well as their antioxidant activity.

2.5. Determination of Composition of Phenolic Compounds

Total phenolics and total anthocyanins were determined using Folin–Ciocalteu reagent and the pH differential method, as described in our previous work [25]. In the Folin–Ciocalteu test, the extract (0.2–0.6 mL) was mixed with 25 mL of distilled water, 0.5 mL of Folin−Ciocalteu reagent, and with 5 mL of 20% (w/w) Na2CO3. Then the volume of the reaction mixture was made up with water to 50 mL. The absorbance was then measured at 760 nm against a reference sample without extract after incubation at ambient temperature for 20 min. To determine total anthocyanins, the red kale extracts were diluted 3–22 times in pH 1.0 and pH 4.5 solutions. The absorbance was measured at 538 and 700 nm against water after 30 min incubation at ambient temperature in the dark. The determination of total flavonoids was done using a colorimetric method [26]. Briefly, 1.5 mL of the extract diluted 2–15 times with water was mixed with water (1.25 mL) and 5% NaNO2 (0.075 mL). After 6 min, 10% AlCl3 (0.15 mL) was added, and after another 5 min 1 M NaOH (0.5 mL) was added. The absorbance was measured immediately at 510 nm against a reference sample without extract.
Absorbance measurement in all methods was performed using a Metertech spectrophotometer (model SP-830 Plus, Medson S.c., Paczkowo, Poland). Total phenolics was expressed as gallic acid equivalents (GAE), total anthocyanin as cyanidin 3-glucoside equivalents (CGE), and total flavonoids as (+)-catechin equivalents (CE). The results were expressed per g DW of microgreen. Each sample was analyzed in triplicate.
The composition of phenolic compounds was evaluated using an Acquity ultra-performance liquid chromatography (UPLC) system coupled with a quadruple time of flight mass spectrometry (Q-TOF-MS) instrument (Waters Corp., Milford, MA, USA) equipped with an electrospray ionization (ESI) source, as described in our previous study [27]. Briefly, samples were eluted with a gradient of solvent A (4.5% formic acid in ultrapure water) and B (acetonitrile) on an Acquity UPLC HSS T3 C18 column (150 × 2.1 mm, 1.8 µm; Waters) at 30 °C with flow rate equal to 0.45 mL/min. The mass spectrometer was operating in the negative or positive mode for a mass range of 150–1500 Da. Leucine enkephalin was used as a lock mass. Phenolic compounds were identified based on their MS, MS2 properties, and UV-Vis characteristics and comparison with our own experimental and literature data. Chlorogenic acid, gallic acid, kaempferol-3-glucoside, quercetin-3-glucoside, and cyanidin-3-glucoside were used to prepare standard curves.

2.6. Determination of Dietary Fiber Components

Total dietary fiber (DF) content was determined as the sum of insoluble fiber (IDF) and soluble fiber (SDF) [28]. The SDF content was calculated based on the content of uronic acids (UA) and neutral sugars (NS) determined spectrophotometrically (Metertech SP-830 Plus spectrophotometer, Medson S.c., Paczkowo, Poland) in the reaction with anthrone reagent and 3,5-dimethylphenol reagent, respectively. The IDF content, in addition to UA and NS, also included Klason lignins (KL), which were determined gravimetrically after subtracting the ash content. The NS and UA contents were expressed as glucose and galacturonic acid equivalents, respectively. Each sample was analyzed in triplicate. The content of total DF, SDF, and IDF fractions was expressed as g/100 g DW.

2.7. Determination of Antioxidant Activity

The antioxidant activity of kale microgreens was determined by using five different methods, including scavenging potential toward stable, synthetic ABTS•+ radical cation (ABTS assay) and DPPH radical (DPPH assay), toward peroxyl radical- ROO (ORAC assay—oxygen radical antioxidant capacity) and superoxide anion radical- O2•− (SARSA assay—superoxide anion radical scavenging activity), and as the potential to reduce ferric to ferrous ion (FRAP assay—ferric reducing antioxidant power) [29,30]. Briefly, in the ABTS method, 1 mL of methanol solution of ABTS•+ radical generated by oxidation of ABTS with potassium persulfate was added to 20 µL of extracts (diluted 2–5 times) or water (control) and after 6 min at 30 °C absorbance was measured at 734 nm. In the DPPH assay, 0.1 mL of extracts (diluted 2–10 times) or water (control) and 2.9 mL of 0.1 mM DPPH solution in 80% methanol were mixed. The absorbance at 517 nm of samples was determined after 30 min incubation at ambient temperature in the dark. In the FRAP test, extracts (diluted 3–10-fold with water) were mixed with 0.27 mL of water and then with 2.7 mL of freshly prepared FRAP reagent. Absorbance at 593 nm was recorded after 10 min of incubation of the samples at 30 °C. In the SARSA method, the reaction mixture consisted of 1 mL of 50 µM NBT, 1 mL of 78 µM NADH, 0.5 mL of extracts or tris-HCl buffer (16 mM, pH 8.0), and 0.5 mL of 10 µM PMS. All reagents were prepared in tris-HCl buffer. The absorbance at 560 nm was measured after 5 min incubation at ambient temperature. Absorbance measurement in all methods was performed using a Metertech spectrophotometer (model SP-830 Plus, Medson S.c., Paczkowo, Poland).
ORAC assay was carried out on a Synergy 2 microplate reader (BioTek, Winooski, VT, USA). The reaction mixture contained 25 µL of the extracts diluted with 75 mM phosphate buffer (pH 7.4) or water (control) and 150 µL of 3 mM fluorescein solution. After incubation at 37 °C for 15 min, 25 µL of 173 mM AAPH as peroxyl radical generator was added, and the fluorescence was measured every 2 min for 2 h at an excitation wavelength of 485 nm and an emission wavelength of 520 nm. The reaction was carried out at 37 °C. All reagents were prepared in phosphate buffer.
The antioxidant activity was expressed as Trolox equivalents (TE) per g DW of microgreens, except for superoxide anion radical-scavenging activity, which was expressed as (+)-catechin equivalents (CE). Each sample was analyzed in duplicate.

2.8. Statistical Analysis

The results are presented as mean ± standard deviation. Statistical analysis was performed using one-way ANOVA (Statistica 12.5 PL, StatSoft, Kraków, Poland), followed by Tukey’s post hoc test for comparisons between the light treatments. Statistically significant differences were set at p < 0.05.

3. Results

3.1. Chlorophyll (a, b, and Total) and Carotenoids

The effect of LED treatments on the content of photosynthetic pigments is shown in Table 1.
Overall, the greatest contents were measured in both kale varieties under white light, and significant differences (p < 0.05) were found between white and its combination with red or blue LEDs. Moreover, statistically significant differences were observed for the content of chlorophyll b in green kale microgreens as well as for total chlorophylls and both forms of chlorophyll in red kale microgreens grown under white + blue or white + red light. In all samples, chlorophyll b was found to be more dominant than chlorophyll a. The ratio of chlorophyll a to chlorophyll b was from 0.75 to 0.89.

3.2. Total Phenolics, Flavonoids, and Anthocyanins

The total phenolics and total flavonoids of kale microgreens exposed to white light were significantly lower than those of green and red kale under white with red or blue LEDs (Table 2). A comparison of the values for the most effective (white + blue) and the least effective (white) lighting indicates a 37% and 96% higher accumulation of phenolic compounds, as well as a 2.4-fold and 2-fold increase in the content of total flavonoids, in green and red kale microgreens, respectively. It is worth emphasizing the significant effect of white light supplementation with red or blue light on the biosynthesis of anthocyanin pigments in red kale microgreens. The addition of red light caused a 3.7-fold increase in total anthocyanins, while the addition of blue light caused a 4.6-fold increase. Green kale microgreens were characterized by a higher content of flavonoids than red kale in all lighting treatments, while in terms of total phenolics, only green kale microgreens grown under white light showed higher levels of these compounds.

3.3. Profiles of Phenolic Compounds

The properties of phenolic compounds, including their biological activity, are diverse due to their structure. Therefore, it is very important to determine the qualitative and quantitative composition of phenolic compounds in the analyzed plant material. The content of the individual phenolic compounds in green and red kale microgreens grown under three LED treatments analyzed with the use of LC/Q-TOF-MS in both negative and positive ion modes are summarized in Table 3 and Table 4, while their chromatograms are presented in Figures S1 and S2. The results revealed that light treatments influenced the composition of phenolic compounds in kale microgreens. A maximum of nineteen and twenty-four phenolic compounds were identified in green and red kale microgreens, respectively. The identified compounds included phenolic acids, flavonols, and additionally anthocyanins, only in the red kale microgreens. The combination of white light with red or blue light increased the total content of all analyzed phenolic compound subgroups in red kale microgreens (Table 4) and only the content of total flavonols in green kale microgreens (Table 3). On the other hand, the level of total phenolic acids in green kale microgreens decreased significantly when blue light was added.
Similarly to green kale microgreens, in red kale microgreens, phenolic acids also constituted the quantitatively dominant group of the phenolic compounds identified in the plant material (Table 4). They accounted for 70% (white LEDs), 71% (white + red), and 65% (white + blue) of the total phenolics. It is worth adding that a dihydroxybenzoic acid, glycoside, was identified in red kale microgreens. Caffeoylquinic acid, with a retention time equal to 6.34 min, was a dominant phenolic acid in red kale, while disinapoyl-diglucoside was identified in green kale microgreens. Various quercetin and kaempferol glucosides, as well as kaempferol derivatives acylated with sinapic, ferulic, hydroxyferulic, or caffeic acids, were flavonols identified in both kale microgreens. The most flavonols (14 compounds) were identified in microgreens grown under white + blue LEDs, with the highest concentration of kaempferol 3-triglucoside-7-diglucoside followed by kaempferol 3-diglucoside-7-diglucoside. Among the anthocyanin pigments, up to four acylated derivatives of cyanidin 3-diglucoside-5-glucoside were identified in red kale microgreens grown under white light with the addition of blue light. Regardless of the light conditions, red kale microgreens synthesized cyanidin 3-sinapoyl-feruloyldiglucoside-5-glucoside and cyanidin 3-sinapoyl-sinapoyldiglucoside-5-glucoside. The total content of these anthocyanins in microgreens grown under white LEDs was 3.8 and 2.2 times lower than that one identified in microgreens grown under white + blue and white + red LEDs, respectively.

3.4. Antioxidant Activity
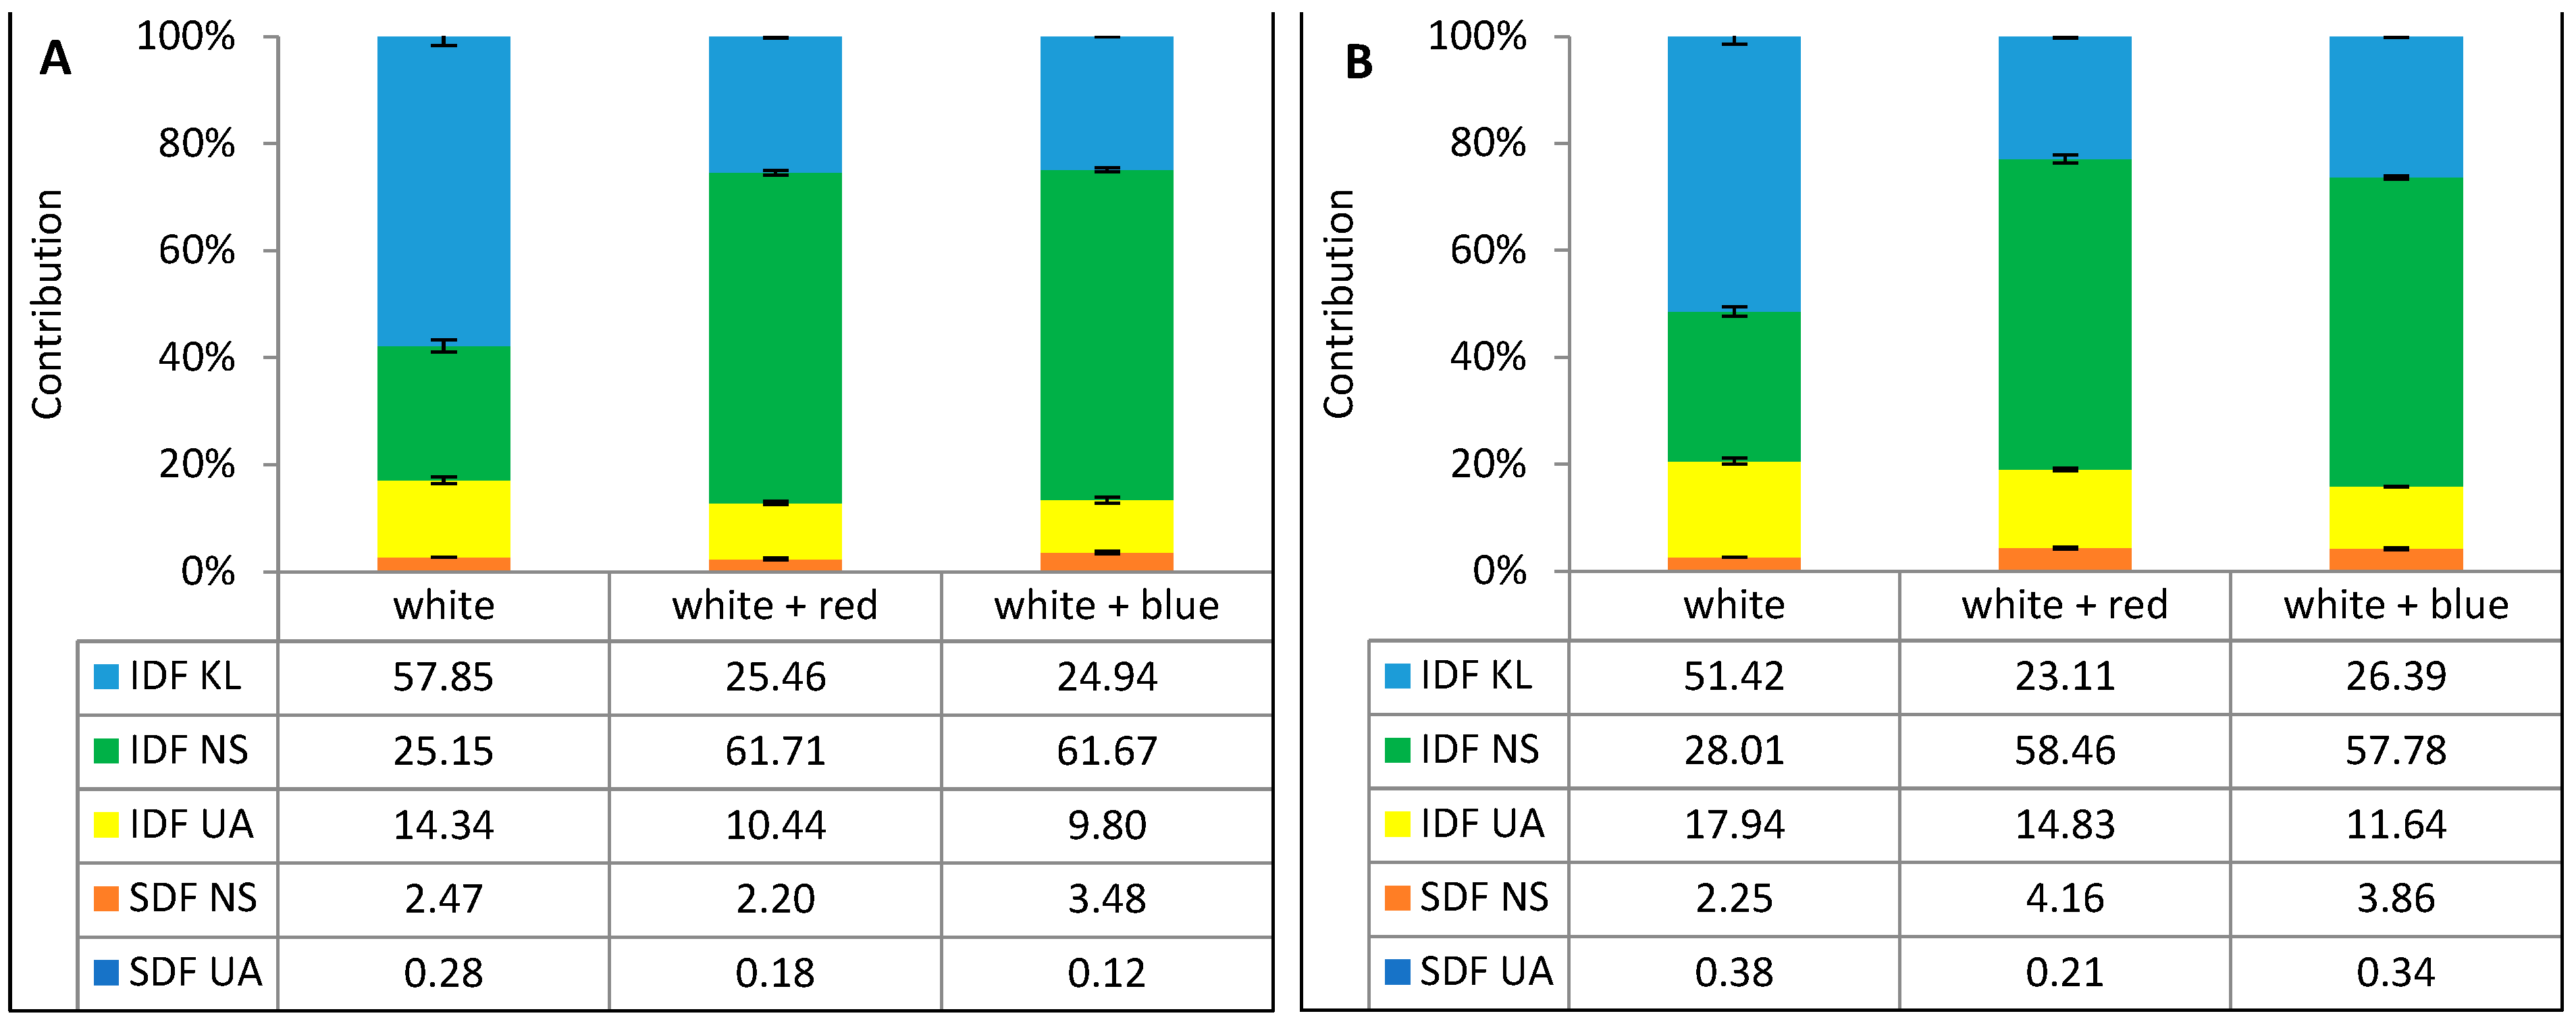
The antioxidant activity of green and red kale microgreens analyzed in the present work was estimated using five different methods, including the scavenging potential toward stable, synthetic ABTS•+ radical cation (ABTS assay) and DPPH radical (DPPH assay) and toward peroxyl radical-ROO (ORAC assay), superoxide anion radical-O2•− (SARSA assay), and the potential to reduce ferric to ferrous ion (FRAP assay). The results are presented in Table 5.
Significant differences (p < 0.05) were found in the antioxidant activity of red kale microgreens. In the case of green kale microgreens grown under white light with the addition of red and blue light, Trolox equivalent values in FRAP and ORAC methods did not differ significantly. Generally, the antioxidant activity of both kale varieties was the lowest for microgreens grown under white light, except for green kale microgreen antioxidant activity with the SARSA method, where the lowest value was obtained for white + blue light. Two methods (ABTS and DPPH) indicated the highest level of antioxidant activity for green kale treated with white + red light, while two other methods, FRAP and ORAC, showed similar antioxidant activity for both kale microgreens treated with white + red light and white + blue light. For the red kale variety, only the ABTS method showed significantly lower activity for microgreens treated with white + blue light than for microgreens treated with white + red light. The use of the methods indicated above (DPPH, FRAP, ORAC, and SARSA) showed the highest level of antioxidant activity, represented by microgreens grown under white + blue light. An analysis of these values (Table 5) indicates a higher effect of lighting on the antioxidant activity of red kale microgreens as compared to that of green kale microgreens. The differences between the extreme values determined for green kale microgreens ranged from 11% in the SARSA method to 117% in the DPPH method. For the comparison, the range of variation for red kale microgreens was from 2-fold (SARSA method) to almost 4-fold in the DPPH and ORAC methods.

3.5. Dietary Fiber

The total fiber content, as well as the contents of its insoluble and soluble fractions in red and green kale microgreens, significantly increased when red and blue LEDs were added to white LEDs (Table 6). The combination of white light with red and blue light resulted in about a 40% increase in the total fiber and its insoluble fraction content. The soluble fraction in red kale microgreens increased by 26 (white + red) or 85% (white + blue) and in green kale microgreens by about 130% in both variants. In contrast, the combination of white with red and blue light resulted in a 36–56% reduction in the Klason lignin content in green kale microgreens and a 57–65% decrease in the content of this fraction in red kale microgreens. It is evident in Figure 2 that regardless of the kale variety and lighting treatments, the insoluble fraction was dominant and constituted 95.9–97.6% of the total fiber.
In all examined microgreens grown under white with red or blue light, the decreasing rank of the insoluble fraction composition was as follows: neutral sugars > Klason lignin > uronic acids (Figure 2). Contrary, the use of white LEDs in the production of kale microgreens resulted in an increase in Klason lignin contribution and a decrease in neutral sugars in the insoluble fiber fraction. In all light treatments, the soluble fraction was dominated by neutral sugars.

4. Discussion

Light-emitting diodes (LEDs) are characterized by their non-thermal photon emission, narrow spectrum, reducing energy costs by 80% compared to halogen lamps, and higher longevity (>100,000 h) without the need for maintenance [14,36]. This allows LEDs to provide a controllable, alternative source of photons of selected or mixed wavelengths used in microgreens production. LED illumination has also been reported to improve kale quality and nutrient values. However, a comparison of the effects given by white light and its connection to red or blue light in terms of the level of different antioxidants, antioxidant activity, and health-beneficial dietary fiber composition in red and green kale microgreens is still lacking.
Under light treatment, microgreens undergo photomorphogenesis and inevitably synthesize chlorophylls and carotenoids [37]. In this study, a significant decrease in total chlorophylls, chlorophyll a, chlorophyll b, and total carotenoids was observed in both kale varieties when exposed to white light enhanced with red and blue light vs. the corresponding values observed for the kale microgreens treated with white light alone. Other authors observed higher levels of chlorophyll a and b and total carotenoids in red kale (cv. Scarlet) microgreens treated with white light compared to the use of red or blue lights separately [12]. Similarly, kale microgreens under white light showed higher levels of carotenoids, including lutein, 13-cis-β-carotene, α-carotene, β-carotene, and 9-cis-β-carotene, than those values obtained for microgreens treated with red or blue LEDs [10]. Kopsell et al. [38] showed that different wavelengths of blue light were less effective in stimulating chlorophyll and carotenoid pigments production in Toscano kale when compared to the effects caused by white LED treatment. However, in kale sprouts, carotenoid levels were the same under white, white and blue, or white and red LEDs [39]. Maru et al. [40] showed that lighting treatments provided by LEDs and growing substrates interact to affect the photosynthetic pigments in Ethiopian kale microgreens. In the present study, all kale microgreens were grown in a commercial peat substrate intended for vegetable seedling cultivation. For example, the highest chlorophyll content was observed under a combination of blue + red + white LEDs or blue light on the cocopeat–sand mix or cocopeat and sand, respectively. However, microgreens grown in the cocopeat–sand mix or cocopeat under blue + red + white LEDs were characterized by the highest amount of carotenoid pigments, while blue and red lights were the most effective on the sand substrate. Generally, the authors concluded that combined light spectra are superior to monochromatic light supply [40]. On the contrary, the present studies indicate a decrease in the efficiency of photosynthetic pigment synthesis in kale microgreens when red or blue light is added to white LEDs.
Generally, green kale microgreens demonstrated to have higher levels of photosynthetic pigments compared to the levels of these compounds in red kale microgreens. Similar associations were found for red and green kale microgreens grown on a vertical farm in Chile [41]. In the present studies, contents of chlorophyll b higher than those for chlorophyll a were found in both kale microgreens under all light treatments. On the contrary, in the study by Wojciechowska et al., the ratio of chlorophyll a to b in red kale microgreens ranged from 2.6 to 3.3 [12]. Similarly, in kale microgreens grown under LED lamps with a spectrum of 5% UV-A, 19% blue, 26% green, 44% red, and 6% far-red, the chlorophyll b content was, on average, 3.1-fold higher than that for chlorophyll b in green kale and, on average, 3.3-fold higher in the red variety [41]. Chlorophyll a is the main pigment involved in photosynthesis, while chlorophyll b enables plants to adsorb light at a wider range of wavelengths, and promotes plant adaptation to shade [42].
It is well known that light enhances cell metabolism and the synthesis of phenolic compounds that are responsible for many functions in plants [42]. First, they exhibit antioxidant activity and protect cell structures against reactive oxygen species. Many of them protect plants from harmful solar radiation, some act as defense elements against herbivores and pathogens. They also play structural roles by linking cell wall polysaccharides and incorporating lignin into the polysaccharide domain [43]. Contrary to the photosynthetic pigments, a significant increase in total phenolics, total flavonoids, and total anthocyanins was observed in microgreens after exposure to white light enhanced with red and blue light compared to white light treatment. Similarly, some authors have demonstrated that blue LEDs effectively increase the levels of phenolics and anthocyanin in kale plants [21]. Wojciechowska et al. [12] showed that the content of total phenolics, phenylopropanoids, flavonols, and anthocyanins in red kale microgreens grown under blue light was higher than that observed for microgreens grown under white, red, and purple (30% blue + 70% red) ones. Likewise, the total phenolics were significantly increased under blue LEDs compared to white and red LEDs in in kale microgreens [10]. Chinese kale microgreens grown under blue and white LEDs showed significant and comparable increases in phenolic compounds compared to red LEDs and sunlight [19]. Similarly, the greatest amount of flavonoids were observed in Ethiopian kale microgreens grown under blue LEDs on the sand or cocopeat substrates in comparison to red, white, and a combination of blue, red, and white LEDs. Contrary, microgreens grown on the cocopeat–sand mix produced the most flavonoids under red LEDs. An increase in the concentration of phenolic compounds in green kale microgreens was also obtained by combining blue with red and violet light, while the opposite effect was obtained by replacing violet light with green compared to the blue + red treatment. Combining blue light with red and violet light also increased the levels of phenolic compounds in green kale microgreens, while the opposite effect was obtained by replacing violet light with green compared to the blue + red treatment [11].
The results of LC/Q-TOF MS analysis revealed that light treatments also affect the profile of phenolic compounds. In the present study, the composition of phenolic compounds in red kale microgreens was determined for the first time. A maximum of nineteen and twenty-four phenolic compounds were identified in green and red kale microgreens, respectively. These compounds included phenolic acids, flavonols, and anthocyanins in the red variety. Liu et al. [33] identified in green kale microgreens thirty-four phenolic compounds, including fifteen phenolic acids, nine kaempferol derivatives, six quercetin derivatives, and four isorhamnetin derivatives. Therefore, isorhamnetin and ellagic acid derivatives were not determined in our work. In red kale microgreens, only four acylated cyanidin glucosides were identified. In contrast, Guo et al. [44] identified as many as twenty-nine cyanidin derivatives, four delphinidin derivatives, and pelargonidin hexoside in the leaves of ornamental kale. The presented results and literature data indicate a complex structure of kale flavonols and anthocyanins, also in microgreens, related to their high degree of acylation, mainly due to hydroxycinnamic acids [33,45,46].
Lee et al. [10] studied the effect of lighting (white, red, or blue LEDs) on the content of individual phenolic compounds in kale microgreens. Our study also showed that the phenolic profile depended on the applied lighting treatments. For example, green kale microgreens grown under white LEDs contained ten compounds, while those grown under white + blue light had as many as nineteen. For comparison, under the same lighting conditions, red kale microgreens contained nine and twenty-four compounds, respectively. Combinations of white LEDs with red or blue light increased the total flavonol content but decreased phenolic acid levels in green kale microgreens. In the red kale microgreens, a combination of white LEDs with blue and red LEDs positively influenced the phenolic compound profile.
The presence of phenolic compounds, as well as carotenoid and chlorophyll pigments in kale microgreens, determines their antioxidant properties. The antioxidant activity of green and red kale microgreens tested has been confirmed by five methods. Generally, the antioxidant capacity of both kale microgreens was arranged in the following descending order: white + blue > white + red > white. Only the scavenging efficiency of ABTS radical by the red variety and superoxide anion radical by green kale microgreens was the highest under white + red LEDs. Other authors also point to the differentiation of the antioxidant activity of microgreens depending on lighting conditions. Chinese kale microgreens grown under blue and white LEDs showed higher DPPH scavenging activity and ferric-reducing antioxidant power (FRAP), whereas ABTS radical cation fared better under blue LEDs [19]. The highest DPPH radical-scavenging activity was seen in green kale microgreens under a combination of blue and red LEDs, while ABTS•+-scavenging activity was the highest under blue + red + violet LEDs [11].
Concerning dietary fiber, the LED lighting treatments affected the total fiber content and the composition of its soluble and insoluble fractions. In the case of green kale microgreens, white + blue light favored the accumulation of the total and insoluble fiber, while white + red light increased the amount of the soluble fiber. On the contrary, white + red light treatments promoted the production of total fiber and insoluble fiber, while the combination of white and blue lights increased the concentration of soluble fiber in red kale microgreens. At the same time, the highest Klason lignin content in kale microgreens was achieved under white LEDs. In mature kale, the dominant fiber fraction was insoluble fiber [47,48]. Similarly, insoluble fiber components dominated 10 different culinary microgreens and accounted for 84 to 98% of total fiber [49]. In the analyzed kale microgreens, the contribution of the insoluble fraction was 96–98% of the total fiber. Moreover, the determined contents of total fiber (DF = 31.53–47.04 g/100 g DW) and its fractions (SDF = 0.83–1.96 and IDF = 30.70–45.92 g/100 g DW) determined in kale microgreens are like the values reported for other microgreens (DF = 24.65–43.42; SDF = 0.35–4.56 and IDF = 22.87–40.43 g/100 g DW). Dietary fiber has beneficial effects on human health and gut microbiota, including lowering blood cholesterol and blood glucose levels, increasing mineral absorption in the intestinal tract, reducing energy intake, and increasing bowel movement frequency [50]. According to our best knowledge, kale microgreens have not been investigated so far regarding their fiber composition and biosynthesis under different lighting conditions.

5. Conclusions

This is the first comprehensive study to quantify the individual phenolic compounds, total phenolics, total flavonoids, chlorophyll and carotenoid pigments, and dietary fiber, as well as antioxidant activity, in both green and red kale microgreens under different LED treatments. The results revealed that kale microgreens grown under white light had the highest photosynthetic pigment content, such as chlorophyll a, chlorophyll b, and carotenoids, as well as Klason lignin. Both the higher proportion of blue and red light in the spectrum had a positive effect on the levels of phenolic compounds and dietary fiber in the kale microgreens, and positively affected their antioxidant activity. However, as we demonstrated in previous work [17], blue light significantly inhibited the growth of green kale and stimulated the growth of red kale. Therefore, an enhancement in the spectrum with red light is recommended for green kale, while an enhancement in the spectrum with blue light is reasonable for red kale.

Supplementary Materials

The following supporting information can be downloaded at: https://www.mdpi.com/article/10.3390/agronomy14112454/s1, Figure S1: UPLC chromatograms of green kale microgreens under white, white with red, and white with blue LEDs. Refer to Table 3 for the identification of peaks. Figure S2: UPLC chromatograms of red kale microgreens under white, white with red, and white with blue LEDs. Refer to Table 4 for the identification of peaks.

Author Contributions

Conceptualization, A.P. and B.F.; methodology, A.P., D.S. and D.K.; formal analysis, D.S., A.P. and D.S.; investigation, A.P., B.F., D.S. and D.K.; data curation, A.P., B.F., D.S. and D.K.; writing—original draft preparation, A.P., B.F., D.K. and D.S.; writing—review and editing, A.P. and B.F.; visualization, D.S. and D.K.; supervision, A.P. All authors have read and agreed to the published version of the manuscript.

Funding

This research received no external funding.

Data Availability Statement

Data are contained within the article and Supplementary Materials.

Conflicts of Interest

The authors declare no conflicts of interest.

References

  1. Dereje, B.; Jacquier, J.C.; Elliott-Kingston, C.; Harty, M.; Harbourne, N. Brassicaceae microgreens: Phytochemical compositions, influences of growing practices, postharvest technology, health, and food applications. ACS Food Sci. Technol. 2023, 3, 981–998. [Google Scholar] [CrossRef]
  2. Singh, A.; Singh, J.; Kaur, S.; Gunjal, M.; Kaur, J.; Nanda, V.; Ullah, R.; Ercisli, S.; Rasane, P. Emergence of microgreens as a valuable food, current understanding of their market and consumer perception: A review. Food Chem. X 2024, 23, 101527. [Google Scholar]
  3. Amil, M.A.; Saad, H.M.; Tan, C.H.; Sim, K.S. A Review of microgreens in Southeast Asia: Sustainable agriculture, phytochemicals, and biological activities. Int. J. Biotechnol. Biomed. 2024, 1, 19–71. [Google Scholar] [CrossRef]
  4. Bhaswant, M.; Shanmugam, D.K.; Miyazawa, T.; Abe, C.; Miyazawa, T. Microgreens—A comprehensive review of bioactive molecules and health benefits. Molecules 2023, 28, 867. [Google Scholar] [CrossRef] [PubMed]
  5. Tallei, T.E.; Kepel, B.J.; Wungouw, H.I.S.; Nurkolis, F.; Adam, A.A.; Fatimawali. A comprehensive review on the antioxidant activities and health benefits of microgreens: Current insights and future perspectives. Int. J. Food Sci. Technol. 2024, 59, 58–71. [Google Scholar] [CrossRef]
  6. Ebert, A.W. Sprouts and microgreens—Novel food sources for healthy diets. Plants 2022, 11, 571. [Google Scholar] [CrossRef]
  7. Di Bella, M.C.; Toscano, S.; Arena, D.; Moreno, D.A.; Romano, D.; Branca, F. Effects of growing cycle and genotype on the morphometric properties and glucosinolates amount and profile of sprouts, microgreens and baby leaves of broccoli (Brassica oleracea L. var. italica Plenck) and Kale (B. oleracea L. var. acephala DC.). Agronomy 2021, 11, 1685. [Google Scholar] [CrossRef]
  8. Alloggia, F.P.; Bafumo, R.F.; Ramirez, D.A.; Maza, M.A.; Camargo, A.B. Brassicaceae microgreens: A novel and promissory source of sustainable bioactive compounds. Curr. Res. Food Sci. 2023, 6, 100480. [Google Scholar] [CrossRef]
  9. de la Fuente, B.; López-García, G.; Máñez, V.; Alegría, A.; Barberá, R.; Cilla, A. Antiproliferative effect of bioaccessible fractions of four Brassicaceae microgreens on human colon cancer cells linked to their phytochemical composition. Antioxidants 2020, 9, 368. [Google Scholar] [CrossRef]
  10. Lee, S.; Park, C.H.; Kim, J.K.; Ahn, K.; Kwon, H.; Kim, J.K.; Park, S.U.; Yeo, H.J. LED lights influenced phytochemical contents and biological activities in kale (Brassica oleracea L. var. acephala) microgreens. Antioxidants 2023, 12, 1686. [Google Scholar] [CrossRef]
  11. Vaštakaitė-Kairienė, V.; Jurkonienė, S.; Rasiukevičiūtė, N.; Karklelienė, R.; Samuolienė, G. The influence of pre-harvest leds on phytochemical constituents and antioxidant activity of microgreens during short-term storage. Agronomy 2023, 13, 2188. [Google Scholar] [CrossRef]
  12. Wojciechowska, R.; Dąbrowa, A.; Kołton, A. How monochromatic and composed light affect the kale ‘Scarlet’ in its initial growth stage. Acta Sci. Pol. Hortorum Cultus 2023, 22, 93–100. [Google Scholar] [CrossRef]
  13. Wojdyło, A.; Nowicka, P.; Tkacz, K.; Turkiewicz, I.P. Sprouts vs. microgreens as novel functional foods: Variation of nutritional and phytochemical profiles and their in vitro bioactive properties. Molecules 2020, 25, 4648. [Google Scholar] [CrossRef]
  14. Artés-Hernández, F.; Castillejo, N.; Martínez-Zamora, L. UV and Visible Spectrum LED lighting as abiotic elicitors of bioactive compounds in sprouts, microgreens, and baby leaves—A comprehensive review including their mode of action. Foods 2022, 11, 265. [Google Scholar] [CrossRef]
  15. Alrifai, O.; Hao, X.; Marcone, M.F.; Tsao, R. Current review of the modulatory effects of LED lights on photosynthesis of secondary metabolites and future perspectives of microgreen vegetables. J. Agric. Food Chem. 2019, 67, 6075–6090. [Google Scholar] [CrossRef]
  16. Zhang, X.; Bian, Z.; Yuan, X.; Chen, X.; Lu, C. A review on the effects of light-emitting diode (LED) light on the nutrients of sprouts and microgreens. Trends Food Sci. Technol. 2020, 99, 203–216. [Google Scholar] [CrossRef]
  17. Frąszczak, B.; Kula-Maximenko, M.; Podsędek, A.; Sosnowska, D.; Unegbu, K.C.; Spiżewski, T. Morphological and photosynthetic parameters of green and red kale microgreens cultivated under different light spectra. Plants 2023, 12, 3800. [Google Scholar] [CrossRef] [PubMed]
  18. Frąszczak, B.; Kula-Maximenko, M. The biometric parameters of microgreen crops grown under various light conditions. Agriculture 2022, 12, 576. [Google Scholar] [CrossRef]
  19. Tantharapornrerk, N.; Vichitsoonthonkul, T.; Techavuthiporn, C.; Photchanachai, S. Growth and antioxidant system of Chinese kale microgreens in response to different illumination of light sources. N. Z. J. Crop Hortic. Sci. 2023, 51, 108–122. [Google Scholar] [CrossRef]
  20. Hooks, T.; Sun, L.; Kong, Y.; Masabni, J.; Niu, G. Adding UVA and far-red light to white LED affects growth, morphology, and phytochemicals of indoor-grown microgreens. Sustainability 2022, 14, 8552. [Google Scholar] [CrossRef]
  21. Ying, Q.; Jones-Baumgardt, C.; Zheng, Y.; Bozzo, G. The proportion of blue light from light-emitting diodes (RB light environment) alters microgreen phytochemical profiles in a species-specific manner. HortScience 2021, 56, 13–20. [Google Scholar] [CrossRef]
  22. Kamal, K.Y.; Khodaeiaminjan, M.; El-Tantawy, A.A.; Moneim, D.A.; Salam, A.A.; Ash-Shormillesy, S.M.A.I.; Attia, A.; Ali, M.A.S.; Herranz, R.; El-Esawi, M.A.; et al. Evaluation of growth and nutritional value of Brassica microgreens grown under red, blue and green LEDs combinations. Physiol. Plant. 2020, 169, 625–638. [Google Scholar] [CrossRef] [PubMed]
  23. Kopsell, D.A.; Sams, C.E.; Morrow, R.C. Interaction of light quality and fertility on biomass, shoot pigmentation and xanthophyll cycle flux in Chinese kale. J. Sci. Food Agric. 2017, 97, 911–917. [Google Scholar] [CrossRef]
  24. Majdoub, N.; El-Guendouz, S.; Rezgui, M.; Carlier, J.; Costa, C.; Kaab, L.B.B.; Miguel, M.G. Growth, photosynthetic pigments, phenolic content and biological activities of Foeniculum vulgare Mill., Anethum graveolens L. and Pimpinella anisum L. (Apiaceae) in response to zinc. Ind. Crops Prod. 2017, 109, 627–636. [Google Scholar] [CrossRef]
  25. Sosnowska, D.; Kajszczak, D.; Podsędek, A. The effect of different growth stages of black chokeberry fruits on phytonutrients, anti-lipase activity, and antioxidant capacity. Molecules 2022, 27, 8031. [Google Scholar] [CrossRef] [PubMed]
  26. Sakanaka, S.; Tachibana, Y.; Okada, Y. Preparation and antioxidant properties of extracts of Japanese persimmon leaf tea (kakinoha-cha). Food Chem. 2005, 89, 569–575. [Google Scholar] [CrossRef]
  27. Podsędek, A.; Frąszczak, B.; Sosnowska, D.; Kajszczak, D.; Szymczak, K.; Bonikowski, R. LED light quality affected bioactive compounds, antioxidant potential, and nutritional value of red and white cabbage microgreens. Appl. Sci. 2023, 13, 5435. [Google Scholar] [CrossRef]
  28. Gouw, V.P.; Jung, J.; Zhao, Y. Functional properties, bioactive compounds, and in vitro gastrointestinal digestion study of dried fruit pomace powders as functional food ingredients. LWT—Food Sci. Technol. 2017, 80, 136–144. [Google Scholar] [CrossRef]
  29. Polka, D.; Podsędek, A.; Koziołkiewicz, M. Comparison of chemical composition and antioxidant capacity of fruit, flower and bark of Viburnum opulus. Plant Foods Hum. Nutr. 2019, 74, 436–442. [Google Scholar]
  30. Kim, D.O.; Lee, K.W.; Lee, H.J.; Lee, C.Y. Vitamin C equivalent antioxidant capacity (VCEAC) of phenolic phytochemicals. J. Agric. Food Chem. 2002, 50, 3713–3717. [Google Scholar] [CrossRef]
  31. Lin, L.Z.; Harnly, J.M. Identification of the phenolic components of collard greens, kale, and Chinese broccoli. J. Agric. Food Chem. 2009, 57, 7401–7408. [Google Scholar] [CrossRef]
  32. Olsen, H.; Aaby, K.; Borge, G.I.A. Characterization and quantification of flavonoids and hydroxycinnamic acids in curly kale (Brassica oleracea L. convar. acephala var. sabellica) by HPLC-DAD-ESI-MS. J. Agric. Food Chem. 2009, 57, 2816–2825. [Google Scholar] [CrossRef] [PubMed]
  33. Liu, Z.; Shi, J.; Wan, J.; Pham, Q.; Zhang, Z.; Sun, J.; Yu, L.; Wang, T.T.Y.; Chen, P. Profiling of polyphenols and glucosinolates in kale and broccoli microgreens grown under chamber and windowsill conditions by Ultrahigh-Performance Liquid Chromatography High-Resolution Mass Spectrometry. ACS Food Sci. Technol. 2022, 2, 101–113. [Google Scholar] [CrossRef]
  34. Bujor, O.C.; Le Bourvellec, C.; Volf, I.; Popa, V.I.; Dufour, C. Seasonal variations of the phenolic constituents in bilberry (Vaccinium myrtillus L.) leaves, stems and fruits, and their antioxidant activity. Food Chem. 2016, 213, 58–68. [Google Scholar] [PubMed]
  35. Zhu, P.; Tian, Z.; Pan, Z.; Feng, X. Identification and quantification of anthocyanins in different coloured cultivars of ornamental kale (Brassica oleracea L. var. acephala DC). J. Hortic. Sci. Biotechnol. 2018, 93, 466–473. [Google Scholar] [CrossRef]
  36. Hasan, M.M.; Bashir, T.; Ghosh, R.; Lee, S.K.; Bae, H. An overview of LEDs’ effects on the production of bioactive compounds and crop quality. Molecules 2017, 22, 1420. [Google Scholar] [CrossRef]
  37. Brazaityte, A.; Miliauskiene, J.; Vaštakaite-Kairiene, V.; Sutuliene, R.; Laužike, K.; Duchovskis, P.; Małek, S. Effect of different ratios of blue and red led light on Brassicaceae microgreens under a controlled environment. Plants 2021, 10, 801. [Google Scholar] [CrossRef]
  38. Kopsell, D.A.; Sams, C.E.; Metallo, R.M.; Waterland, N.L.; Kopsell, D.E. Biomass, carbohydrates, pigments, and mineral elements in kale (Brassica oleracea var acephala) microgreens respond to LED blue-light wavelength. Sci. Hortic. 2024, 328, 112929. [Google Scholar] [CrossRef]
  39. Frede, K.; Winkelmann, S.; Busse, L.; Baldermann, S. The effect of LED light quality on the carotenoid metabolism and related gene expression in the genus Brassica. BMC Plant Biol. 2023, 23, 328. [Google Scholar] [CrossRef]
  40. Maru, R.N.; Wesonga, J.; Okazawa, H.; Kavoo, A.; Neondo, J.O.; Mazibuko, D.M.; Maskey, S.; Orsini, F. Evaluation of growth, yield and bioactive compounds of Ethiopian kale (Brassica carinata A. Braun) microgreens under different LED light spectra and substrates. Horticulturae 2024, 10, 436. [Google Scholar] [CrossRef]
  41. Flores, M.; Hernández-Adasme, C.; Guevara, M.J.; Escalona, V.H. Effect of different light intensities on agronomic characteristics and antioxidant compounds of Brassicaceae microgreens in a vertical farm system. Front. Sustain. Food Syst. 2024, 8, 1349423. [Google Scholar] [CrossRef]
  42. Toscano, S.; Cavallaro, V.; Ferrante, A.; Romano, D.; Patané, C. Effects of different light spectra on final biomass production and nutritional quality of two microgreens. Plants 2021, 10, 1584. [Google Scholar] [CrossRef] [PubMed]
  43. Marchiosi, R.; dos Santos, W.D.; Constantin, R.P.; de Lima, R.B.; Soares, A.R.; Finger-Teixeira, A.; Mota, T.R.; de Oliveira, D.M.; de Paiva Foletto-Felipe, M.; Abrahao, J.; et al. Biosynthesis and metabolic actions of simple phenolic acids in plants. Phytochem. Rev. 2020, 19, 865–906. [Google Scholar]
  44. Guo, N.; Han, S.; Zong, M.; Wang, G.; Zheng, S.; Liu, F. Identification and differential expression analysis of anthocyanin biosynthetic genes in leaf color variants of ornamental kale. BMC Genom. 2019, 20, 564. [Google Scholar] [CrossRef] [PubMed]
  45. Chen, X.; Wang, H.; Huang, X.; Xia, S.; Chen, C.; Nie, Q.; Nie, S. Efficient enrichment of total flavonoids from kale (Brassica oleracea L. var. acephala L.) extracts by NKA-9 resin and antioxidant activities of flavonoids extract in vitro. Food Chem. 2022, 374, 131508. [Google Scholar] [CrossRef]
  46. Yang, I.; Jayaprakasha, G.K.; Patil, B. In vitro digestion with bile acids enhances the bioaccessibility of kale polyphenols. Food Funct. 2018, 9, 1235–1244. [Google Scholar] [CrossRef]
  47. Maciejak, A.; Kosmala, M. Kale (Brassica oleracea L. var. acephala) as a source of dietary fibre. Biotechnol. Food Sci. 2019, 83, 135–141. [Google Scholar]
  48. Kowalska, H.; Kowalska, J.; Ignaczak, A.; Masiarz, E.; Domian, E.; Galus, S.; Ciurzyńska, A.; Salamon, A.; Zając, A.; Marzec, A. Development of a high-fibre multigrain bar technology with the addition of curly kale. Molecules 2021, 26, 3939. [Google Scholar] [CrossRef]
  49. Ghoora, M.D.; Babu, D.R.; Srividya, N. Nutrient composition, oxalate content and nutritional ranking of ten culinary microgreens. J. Food Compost. Anal. 2020, 91, 103495. [Google Scholar] [CrossRef]
  50. Waddell, I.S.; Orfila, C. Dietary fiber in the prevention of obesity and obesity-related chronic diseases: From epidemiological evidence to potential molecular mechanisms. Crit. Rev. Food Sci. Nutr. 2023, 63, 8752–8767. [Google Scholar] [CrossRef]
Figure 1. Characteristic of light sources.
Agronomy 14 02454 g001
Figure 2. Contribution (%) of soluble (SDF) and insoluble (IDF) fiber fraction components (Klason lignin—KL, neutral sugars—NS, uronic acids—UA) of red (A) and green (B) kale microgreens under different light treatments.
Agronomy 14 02454 g002
Table 1. Content (mg/100 g of DW) of photosynthetic pigments of kale microgreens under white, white with red, and white with blue LEDs.
FactorGreen Kale MicrogreensRed Kale Microgreens
WhiteWhite + RedWhite + BlueWhiteWhite + RedWhite + Blue
Total carotenoids0.58 ± 0.03 b 0.32 ± 0.02 a0.29 ± 0.02 a0.55 ± 0.04 b 0.23 ± 0.06 a0.21 ± 0.03 a
Total chlorophylls 8.57 ± 0.36 b3.67 ± 0.08 a 3.42 ± 0.09 a 6.63 ± 0.09 c3.61 ± 0.08 a4.56 ± 0.13 b
Chlorophyll a2.78 ± 0.19 b1.13 ± 0.04 a1.17 ± 0.07 a2.14 ± 0.08 c1.10 ± 0.09 a 1.51 ± 0.06 b
Chlorophyll b 3.39 ± 0.05 c 1.49 ± 0.02 b 1.31 ± 0.01 a 2.63 ± 0.02 c 1.47 ± 0.04 a1.77 ± 0.03 b
All data are expressed as mean ± SD, n = 4; different letters in each row indicate significant differences at p < 0.05 between the light treatments for a given kale variety.
Table 2. Total phenolics, flavonoids, and anthocyanins (mg/g DW) of kale microgreens under different light treatments.
MicrogreensLight TreatmentsTotal PhenolicsTotal FlavonoidsTotal Anthocyanins
White8.07 ± 0.52 a2.34 ± 0.20 a 0
Green kaleWhite + red10.66 ± 0.47 b3.83 ± 0.21 b0
White + blue11.03 ± 0.72 b5.62 ± 0.34 c0
White6.45 ± 0.29 a1.95 ± 0.17 a0.86 ± 0.03 a
Red kaleWhite + red12.36 ± 0.74 b3.74 ± 0.23 b 3.17 ± 0.20 b
White + blue12.67 ± 0.64 b4.01 ± 0.12 c 3.94 ± 0.10 c
Data are expressed as mean ± SD (n = 6). Different letters in each column represent significant differences at p < 0.05 between the light treatments for a given kale variety.
Table 3. Chromatographic profile and quantification of phenolic compounds (mg/g of DW) identified in green kale microgreens.
tR (min)[MS-H] [MS+H]+ (m/z)MS/MS
(m/z)
Tentative IdentificationLight Treatments
WhiteWhite + redWhite + blue
3.60353134/191Chlorogenic acid0.14 ± 0.000.15 ± 0.010.16 ± 0.01
4.01337119/160/191p-Coumaroylquinic acid [31] 0.04 ± 0.010.04 ± 0.00-
4.19353134/191/128/103Caffeoylquinic acid [32]0.02 ± 0.01--
4.20367191/134Feruloylquinic acid [31]0.03 ± 0.00--
4.26355193/132/161Feruloyl-glucoside [33] 0.02 ± 0.00-
4.45385175/147/119/190Sinapoyl-glucoside [33]0.06 ± 0.000.10 ± 0.010.08 ± 0.01
7.48753223/205/190/164/149Disinapoyl-diglucoside [32]0.55 ± 0.010.45 ± 0.000.34 ± 0.03
7.71723179/160/193/134/149Sinapoyl- feruloyl-diglucoside [32]0.09 ± 0.000.31 ± 0.010.24 ± 0.02
8.85959205/223/190/164/247Trisinapoyl-diglucoside [32]0.46 ± 0.000.28 ± 0.00-
Total phenolic acids1.37 ± 0.01 b1.35 ± 0.04 b0.82 ± 0.06 a
3.66787299/271/463/624Quercetin 3-diglucoside-7-glucoside [32]-0.03 ± 0.000.04 ± 0.00
3.72447198/285/149/242/147Kaempferol 3-glucoside 0.05 ± 0.000.04 ± 0.000.02 ± 0.00
3.77771285/161/255/415Kaempferol 3-diglucoside-7-glucoside [32] -0.02 ± 0.00-
3.801111625/949/300/801/179Quercetin 3-triglucoside-7-diglucoside [32]--0.08 ± 0.01
3.82949301/625/979Quercetin 3-diglucoside-7-diglucoside [32]--0.03 ± 0.00
3.901125949/625/300/801Quercetin 3-feruloyl-diglucoside-7-diglucoside [32] 0.01 ± 0.000.02 ± 0.000.03 ± 0.00
3.941317947/771/815/753/300Quercetin 3-sinapoyl-diglucoside-7-diglucoside [33] --0.05 ± 0.00
3.99963609/284/191/176Kaempferol 3-hydroxyferuloyl-diglucoside
-7-glucoside [32]
--0.03 ± 0.00
4.001095609/771/161/284Kaempferol 3-triglucoside-7-diglucoside [31]-0.04 ± 0.00-
4.031155625/949/787/1111Quercetin 3-sinapoyl-diglucoside-7-diglucoside [32]-0.03 ± 0.000.06 ± 0.00
4.041125609/801/191/284/771Kaempferol 3-hydroxyferuloyl-diglucoside -7-diglucoside [32]-0.02 ± 0.000.04 ± 0.00
4.08993284/609/785/429Kaempferol 3-caffeoyl-diglucoside-7-glucoside [31] -0.06 ± 0.010.13 ± 0.01
4.141139815/609/591/284Kaempferol 3-sinapoyl-diglucoside-7-diglucoside [32]-0.04 ± 0.000.06 ± 0.01
4.181109609/770/822/463Kaempferol 3-feruloyl-diglucoside-7-diglucoside [32]-0.02 ± 0.000.02 ± 0.01
4.22977609/284/446/205Kaempferol 3-sinapoyl-diglucoside-7-glucoside [31] 0.02 ± 0.000.04 ± 0.01
5.18831300/271/255Quercetin 3-sinapoyl-diglucoside [32]--0.02 ± 0.00
6.231361993/1199/787/462/300Quercetin 3-disinapoyl-triglucoside-7-glucoside [33] --0.05 ± 0.00
Total flavonols0.06 ± 0.00 a0.34 ± 0.03 b0.70 ± 0.06 c
Sum of phenolic compounds1.43 ± 0.01 a1.69 ± 0.07 b1.52 ± 0.13 ab
Values are expressed as mean ± SD (n = 3); - not detected. Phenolic acids were expressed as chlorogenic acid, kaempferol derivatives as kaempferol 3-glucoside, and quercetin derivatives as quercetin 3-glucoside equivalents. Significant differences (p < 0.05) between results in selected rows are indicated by different letters. The numbers next to the names of the compounds correspond to the reference number.
Table 4. Chromatographic profile and content of phenolic compounds (mg/g of DW) identified in red kale microgreens.
tR (min)[MS-H] [MS+H]+ (m/z)MS/MS
(m/z)
Tentative IdentificationLight Treatments
WhiteWhite + redWhite + blue
3.60315108Dihydroxybenzoic acid-hexoside [34]0.01 ± 0.000.03 ± 0.000.16 ± 0.00
3.79353134/191Chlorogenic acid 0.01 ± 0.000.08 ± 0.000.20 ± 0.01
4.56367191/133/161Feruloylquinic acid [31]--0.02 ± 0.00
4.70385175/119/190Sinapoyl-glucoside [33]-0.01 ± 0.000.03 ± 0.01
4.79353128/144/119Caffeoylquinic acid [32]0.01 ± 0.000.03 ± 0.00-
6.34353130/191Caffeoylquinic acid [32]0.13 ± 0.01-0.22 ± 0.02
7.78753205/190/164/223Disinapoyl-diglucoside [32]-0,10 ± 0.010.19 ± 0.02
7.99723175/190/160/132Sinapoyl- feruloyl-diglucoside [32]-0.12 ± 0.000.20 ± 0.02
8.93959205/223/190/164Trisinapoyl-diglucoside [32]-0.08 ± 0.010.07 ± 0.01
8.95929175/205/223/160Disinapoyl-feruloyl-diglucoside [32]-0.03 ± 0.00-
Total phenolic acids0.16 ± 0.01 a0.48 ± 0.03 b1.09 ± 0.05 c
3.82447285/172/255Kaempferol 3-glucoside-0.01 ± 0.000.01 ± 0.00
3.971111625/949/300/787Quercetin 3-triglucoside-7-diglucoside [32]--0.04 ± 0.00
4.01949301/624/463Quercetin 3-diglucoside-7-diglucoside [32] --0.02 ± 0.00
4.071125609/801/284/191Kaempferol 3-hydroxyferuloyl-diglucoside-7-diglucoside [32]-0.01 ± 0.000.03 ± 0.00
4.111095625/607/949/300Kaempferol 3-triglucoside-7-diglucoside [31] -0.01 ±0.000.06 ± 0.00
4.141301933/771/1257/285Kaempferol 3-sinapoyltriglucoside-7-diglucoside [32]0.01 ± 0.000.01 ± 0.000.01 ± 0.00
4.16933284/446/609/339Kaempferol 3-diglucoside-7-diglucoside [32]--0.05 ± 0.00
4.221125755/609/285/591Kaempferol 3-hydroxyferuloyl-diglucoside-7-diglucoside [32]--0.04 ± 0.00
4.26993284/446/609/339Kaempferol 3-caffeoyldiglucoside-7-glucoside [31]--0.02 ± 0.00
4.341139609/815/771/285Kaempferol 3-sinapoyldiglucoside-7-diglucoside [32] 0.01 ± 0.000.01 ± 0.000.03 ± 0.00
4.411109609/447/284/815Kaempferol 3-feruloyldiglucoside-7-diglucoside [32] --0.03 ± 0.01
4.45977285/609/446/591Kaempferol 3-sinapoyldiglucoside-7-glucoside [31] --0.03 ± 0.01
5.92625301/151/255Quercetin 3-glucoside-7-glucoside [32] --0.01 ± 0.00
6.06463271/255/243/284Quercetin 3-glucoside 0.01 ± 0.000.01 ± 0.000.02 ± 0.00
Total flavonols0.03 ± 0.00 a0.06 ± 0.01 b0.40 ± 0.01 c
6.991125+287/449/177Cy 3-sinapoyl-p-coumaroyldiglucoside-5-glucoside [35]--0.01 ± 0.00
7.171155+287/449/207Cy 3-sinapoyl-feruloyldiglucoside-5-glucoside [35]0.01 ± 0.000.03 ± 0.000.07 ± 0.00
7.241185+287/449/207Cy 3-sinapoyl-sinapoyldiglucoside-5-glucoside [35]0.03 ± 0.000.06 ± 0.000.08 ± 0.01
7.341125+287/449/177Cy 3-sinapoyl-p-coumaroyldiglucoside-5-glucoside [35]-0.01 ± 0.000.03 ± 0.00
Total anthocyanins0.04 ± 0.00 a0.10 ± 0.00 b0.19 ± 0.01 c
Sum of phenolic compounds0.23 ± 0.01 a0.89 ± 0.04 b1.68 ± 0.08 c
Data are expressed as mean ± SD (n = 3); - not detected. Cy—cyanidin. Hydroxycinnamic acids were expressed as chlorogenic acid, kaempferol derivatives as kaempferol 3-glucoside, quercetin derivatives as quercetin 3-glucoside, and anthocyanins as cyanidin 3-glucoside equivalents. Values with different letters in selected rows represent significant differences at p < 0.05 between the light treatments. The numbers next to the names of the compounds correspond to the reference number.
Table 5. Antioxidant activity of kale microgreens grown under different light treatments.
MicrogreensAntioxidant Activity AssayLight Treatments
WhiteWhite + RedWhite + Blue
Green kaleABTS 30.16 ± 0.52 a39.29 ± 0.35 b50.35 ± 1.22 c
DPPH 24.03 ± 1.74 a41.52 ± 1.82 b52.17 ± 1.64 c
FRAP 49.07 ± 1.07 a64.85 ± 1.12 b66.58 ± 2.21 b
ORAC 179 ± 7 a275 ± 8 b285 ± 12 b
SARSA793 ± 26 b882 ± 11 c589 ± 7 a
Red kaleABTS 18.57 ± 0.37 a55.35 ± 2.55 c50.97 ± 1.98 b
DPPH 14.69 ± 0.48 a53.48 ± 0.82 b66.97 ± 2.12 c
FRAP 39.94 ± 1.32 a80.69 ± 1.34 b97.63 ± 0.84 c
ORAC 104 ± 8 a273 ± 10 b407 ± 11 c
SARSA279 ± 18 a457 ± 7 b556 ± 19 c
Values are expressed as mean ± SD (n = 4). ABTS, DPPH, FRAP, and ORAC are expressed in µmol Trolox equivalents. SARSA is expressed in µmol (+)-catechin equivalents. Different letters in the row denote a statistical difference at p < 0.05.
Table 6. Content (g/100 g DW) of dietary fiber of kale microgreens under different light treatments.
Green Kale MicrogreensRed Kale Microgreens
WhiteWhite + RedWhite + BlueWhiteWhite + RedWhite + Blue
Total fiber31.53 ± 0.89 a44.90 ± 0.65 b45.30 ± 2.03 b32.56 ± 0.25 a47.04 ± 1.28 b45.86 ± 0.19 b
SDF total 0.83 ± 0.00 a1.96 ± 0.08 b1.90 ± 0.03 b0.89 ± 0.04 a1.12 ± 0.06 b1.65 ± 0.10 c
IDF total30.70 ± 0.88 a43.27 ± 0.23 b43.40 ± 2.06 b31.67 ± 0.21 a45.92 ± 1.34 b44.21 ± 0.09 b
Values are expressed as mean ± SD (n = 3). SDF—soluble dietary fiber, IDF—insoluble dietary fiber. Different letters in each row represent significant differences (p < 0.05) between the light treatments for a given kale variety.
Disclaimer/Publisher’s Note: The statements, opinions and data contained in all publications are solely those of the individual author(s) and contributor(s) and not of MDPI and/or the editor(s). MDPI and/or the editor(s) disclaim responsibility for any injury to people or property resulting from any ideas, methods, instructions or products referred to in the content.

