Abstract
The coupling coordination of agricultural technology innovation with food security is of great significance for high-quality agricultural development. By identifying the coupling coordination relationship between the two systems and the influencing factors, this paper aims to promote the virtuous cycle of coordinated development between regional agriculture and technology, as well as accelerate the realisation of high-quality development of Chinese agriculture. Therefore, this paper explores the spatial and temporal coupling characteristics of the two using the entropy value method, coupling coordination degree model, and exploratory spatial data analysis, and it screens for important influencing factors using the grey correlation model. The main results show that ① the coupling coordination relationship between agricultural technology innovation and food security in China is at a dissonant stage, but the value of the coupling coordination degree increases from 0.2076 to 0.3437 during the period of study, and the level of coordination gradually improves. ② The degree of coupling coordination in the provincial space exhibits a distribution pattern of “high in the east and low in the west”. The areas of high value are primarily situated in the provinces of Shandong, Jiangsu, and other provinces along the southeastern coast of China, while the areas of low value are mainly located in the provinces of Qinghai, Ningxia, and other provinces in inland northwest China. ③ The Moran’s index of provincial coupling coordination is greater than 0, showing a certain positive correlation, and there is a significant pattern of spatial aggregation. ④ The correlation coefficients between the influencing factors and the degree of coupling coordination are all greater than 0.35, indicating a moderate or high correlation, but the significance of technological support capacity and food distribution security increased over time.
1. Introduction
Food security is a critical strategic concern that affects people’s livelihoods and the national economy, and it forms the foundation of national security [1,2,3]. It is often defined as a region or country’s ability to produce enough food for its own consumption [4], ensuring that every individual has access to sufficient, wholesome, and safe food at all times [5]. In recent years, China has experienced successive growth in grain production [6]. However, because of the rising demand for grain consumption, China’s external dependence on grain has continued to increase [7]. From 2008 to 2020, China’s food self-sufficiency rate decreased by over ten percentage points, and the issue of food security continues to face enormous pressure and challenges [8]. Scholars have studied the interaction between food security and other areas in China. Liu et al. [9] investigated the interaction model between food security and agro-ecological protection using the coupling coordination degree model. Cai et al. [10] investigated the spatial and temporal characteristics of coordinated development of grain production capacity and cropland utilisation intensity in the three major grain-producing regions of China. The above research took the main grain-producing areas as the research unit and carried out coupled and coordinated research on food security from the perspectives of agroecology and arable land utilisation, which provides a reference for studies on the relationship between agricultural technology innovation and food security in China. The Outline of the Fourteenth Five-Year Plan states that the fundamental solution to the food problem lies in technological innovation. However, China’s level of agricultural technology innovation is relatively low [11]. Furthermore, the structure of agricultural technology, and R&D output varies greatly among provinces [12,13]. According to the National Statistical Office, China’s agricultural science and technology progress contributed 60% in 2020. Nevertheless, this is still significantly lower than that of developed countries [14]. Therefore, research on the relationship between agricultural technology innovation and food security in China is of great theoretical and practical significance in promoting the coordinated development of technology and agriculture [15].
For research on the relationship between agricultural technological innovation and food security, scholars have mainly investigated the unidirectional effect of agricultural technological innovation on food security. On the one hand, agricultural technological innovation has the potential to solve problems in the food production process and foster sustainable agriculture [16]. Zhu and Begho [17], Begho and Zhu [18] argued that the development of alternative foods is an important part of the sustainable development of regional food security in China, reducing the negative impact of fertiliser use on the environment. Bigin et al. [19] and Abecassis et al. [20] proposed the use of biotechnology to improve disease resistance in cereals and increase grain yield and quality [21]. Lei et al. [22] suggested relying on technological innovation to overcome the difficulties in agricultural land and water scarcity. Furthermore, Wakweya [23] stated that the employment of climate-smart agricultural technologies could enhance climatic and environmental conditions in the sub-Saharan region and alleviate urban food insecurity. On the other hand, agricultural technology innovation have been used in all phases of food production [24], consumption, and distribution, making a significant contribution to the sustainable development of agriculture [25] and ensuring food security [26]. Gui et al. [27] and Tian et al. [28] asserted that technological innovation played a critical role in the food production chain to ensure food security. They further posited that the use of technological innovation, including genomics, accelerated the iterative upgrading of food varieties [29], and, ultimately, boosted food production [30]. Liu and Ren [31] argued that digital financial inclusion could help ensure food security and lead to higher crop yields [32]. Wolfert et al. [33] and Mantravadi and Srai [34] proposed the use of digital technology to improve the efficiency of the food consumption and distribution chain, pointing out the importance of developing the Internet of Things in the food industry chain [35,36,37,38]. In addition, Frota et al. [39], Alam et al. [38], and John et al. [40] proposed that the promotion of food value could be achieved through advances in food distribution channels [41]. As can be seen, the one-way relationship between technological innovation in agriculture and food security has been well documented in existing studies. However, ensuring food security would also promote advances in agricultural technology innovation. Unfortunately, this matter has not yet received adequate attention.
In summary, numerous scholars in agricultural technology innovation and food security have conducted extensive research. The research results primarily concentrated on the unidirectional role of agricultural technological innovation in food security. Considering that food security could also have a positive effect on agricultural technological innovation, this paper intended to study the coordination and influencing factors of agricultural technological innovation and food security in China, starting from the two-way interactive relationship. Innovations mainly include the following three aspects: Firstly, for evaluation indicators, existing studies have adopted single indicators to evaluate the level of technological innovation, such as Internet of Things technology and genomics technology, and single indicators to evaluate the level of food security, such as food production. In contrast, this study constructed a systematic comprehensive evaluation index system for the coupling of “agricultural technology innovation and food security”, which can reflect the current situation of agricultural technology innovation and food security in China more comprehensively and objectively and further enhance the scientific and accurate evaluation of the results. Secondly, from a research perspective, unlike the previous one-way role perspective, this study explored the two-way role relationship between agricultural technology innovation and food security in China based on the coupled coordination perspective. The study identified the degree of coordination between agricultural technology innovation and food security in China. In addition, the spatial and temporal characteristics of coupled provincial coordination were revealed. Thirdly, with regard to influencing factors, existing research has focused on the impact of agricultural technological innovation on the relationship between the two, with little attention paid to the role of food security. On the basis of the analysis of the coupling and coordination of agricultural technology innovation and food security in China, this study utilised a grey correlation degree model to classify the correlation levels of their respective indicators. It identified key factors influencing the development of coordination between agricultural technology innovation and food security in China.
The purpose of this study was to investigate the coupling coordination relationship between agricultural technology innovation and food security in China’s provincial areas and identify the influencing factors and provide decision-making references for promoting provincial agricultural technology innovation and accelerating the coordinated development of regional agriculture and science and technology. This paper proposes the following hypotheses based on previous research results: (1) The degree of coordination between agricultural technology innovation and food security in China undergoes regular changes over time. (2) Spatial differentiation characterises the level of coordination between agricultural technology innovation and food security in China. The spatial distribution of neighbouring provinces and districts’ coupling coordination can be aggregated or dispersed. (3) The level of innovation in agricultural technology in China and the level of food security significantly affect the degree of coordination between the two systems.
2. Research Methodology and Data Sources
2.1. Construction of the Indicator System
Drawing on the principles of systematicity, scientificity and measurability, and using the expertise of relevant scholars in constructing indicators systems for agricultural technology innovation and food security [42,43,44], a comprehensive evaluation system for the coupling and coordination of agricultural technology innovation and food security in China (Table 1). Ten indicators were selected to represent the level of innovation in agricultural technology in terms of support capacity and input capacity. Ten indicators were selected to represent the level of food security in terms of production security, consumption security and distribution security.

Table 1.
Coupled coordination indicator system for agricultural technology innovation and food security in China.
2.2. Data Sources
On the basis of the principles of the accessibility of research data and comparability of indicators, a total of 30 provinces were selected as basic research units for this study, using the provincial administrative divisions of China as the benchmark. The Tibet Autonomous Region, Hong Kong Special Administrative Region, Macao Special Administrative Region and Taiwan Province were excluded. The basic data on the effective irrigated farmland area, pesticide usage, total agricultural machinery power and R&D internal expenditure were obtained from the China Statistical Yearbook, China Rural Statistical Yearbook, and China Science and Technology Statistical Yearbook. Data for two indicators, the agricultural production price index and local financial expenditure on science and technology, were obtained from the official website of the National Bureau of Statistics of China (http://www.stats.gov.cn/, accessed on 2 July 2022). Data for two indicators, the proportion of children under five years of age experiencing moderate to severe malnutrition and the affected area, were extracted from the Zhejiang Statistical Yearbook and EPS data platform (https://www.epsnet.com.cn/index.html#/Home, accessed on 18 July 2022). Missing year data were supplemented with interpolation and smoothing calculations.
2.3. Research Methodology
2.3.1. Entropy Method
The entropy method assigns weights based on the characteristics of the data themselves and avoids the influence of subjective factors. Zhang et al. [45] used the entropy method to determine the weights of the indicators and conducted a study on the coupling and coordination of population, industry and building land. In this study, the entropy method was utilised to assess the indicators of innovation in agricultural technology, as well as food security [46]. To determine the degree of indicator dispersion, entropy was calculated by examining the entropy characteristics [47]. A greater degree of dispersion of the indicators has a substantial impact on the comprehensive evaluation. The steps for calculating entropy value are explained below [48]:
- (1)
- Indicator selection: The indicator value of the jth indicator in the λth year in the ith province is denoted as xλij. The study includes 13 years, 30 provinces, and 20 measurement indicators.
- (2)
- The indicators in the indicator system were dimensionless by the standard method of extreme deviation:(forward indicator), (reverse indicator), where j = 1, 2, 3......, n and i = 1, 2, 3......, m are the total number of evaluation indicators and evaluation objects, respectively. are the maximum and minimum values of the different indicators j for all evaluation objects. are the indicator values of the different indicators i after and before dimensionless quantification.
- (3)
- Normalisation of indicators: .
- (4)
- Calculation of the entropy value for each index: , where .
- (5)
- Calculation of the redundancy of the entropy value for each indicator: .
- (6)
- Calculation of the weight of each indicator: .
- (7)
- Calculation of the comprehensive evaluation index for each province per year: , and calculation of China’s annual comprehensive evaluation index: .
To ensure that the comprehensive evaluation index of China’s agricultural technology innovation and food security is between [0, 1], in this study, the total index, , for each year in China was treated as the product of the weights and normalised treatment values, and the index, , for each year in the provinces was treated as the product of weights and dimensionless treatment values.
2.3.2. Coupling Coordination Degree Model
The coupling coordination degree model is one of the most important methods of studying the two-way interaction between two systems. Using this method, Liu et al. [9] and Cai et al. [10] studied the coupled and coordinated relationship between food security and agro-ecological protection and cropland use intensity, and Chen et al. [49] studied the coupled and coordinated relationship between agricultural modernisation and regional economic development. Coupling C refers to the interactive influence between the two and can reflect the degree of interdependence between the systems [50]. The higher the C value, the greater the coupling; the lesser the C value, the lower the coupling. To compensate for the limitation that the C-value cannot determine whether the systems promote each other at a higher level or are closely linked at a lower level, the coupling coordination degree D-value needs to be further calculated. The coupling coordination degree D (i.e., the degree of benign coupling in the coupled interaction mechanism) can indicate the strength of the coordination situation. Its specific calculation steps are as follows [51]:
- (1)
- Calculation of the coupling degree using Excel 2016 64-Bit Edition software: ,where n is the number of system layers, n = 2; is the value of each system with a distribution interval of [0, 1], so .
- (2)
- Calculation of the coupled coordinated level of development index: ,,where is the normalised value in the ith system layer, and is the weight in the ith system layer. The weighting is based on most of the academic literature and assumes that the two strata of indicators are equally important, each with a weight of 0.5.
- (3)
- Calculate the degree of coupling coordination:
This study uses the delineation methods of scholars to classify the levels of the coupling coordination, D, into 10 categories [52]. The details are as follows: 0.000~0.099 (extreme disorder); 0.100~0.199 (severe disorder); 0.200~0.299 (moderate disorder); 0.300~0.399 (mild disorder); 0.400~0.499 (imminent disorder; 0.500~0.599 (barely coordinated); 0.600~0.699 (primary coordination); 0.700~0.799 (intermediate coordination); 0.800~0.899 (good coordination); and 0.900~1.000 (high-quality coordination).
2.3.3. Exploratory Spatial Data Analysis
Exploratory spatial data analysis is a collection of data analysis methods and visualisation techniques for performing spatial statistical analysis, typically using global autocorrelation analysis and local autocorrelation analysis to perform spatial correlation analyses of data within the study area. Hou et al. [53] used exploratory spatial data analysis methods to reveal the spatial differentiation characteristics of the coordinated relationship between urbanisation and food production in China. In this paper, global autocorrelation and local autocorrelation analyses of the degree of coupling coordination of the 30 provinces in this study were carried out using the exploratory spatial data analysis (ESDA) method with ArcGIS 10.8 and GeoDa 1.20 software.
- (1)
- Global autocorrelation analysis:
Global autocorrelation can determine the overall degree of association between Chinese agricultural technology innovation and food security in the study area, which is usually expressed by Moran’s I index [54]. Its specific calculation steps are as follows [55,56]:
where , and N is the number of study areas; is the observed data, and is the mean value of ; is the spatial weight matrix of region i and region j. The spatial adjacency is 1, and spatial disjacency is 0. The index I is between [−1, 1], with I > 0 indicating positive spatial autocorrelation of the coupling coordination (i.e., spatial agglomeration); I < 0 indicating negative spatial autocorrelation of the coupling coordination (i.e., spatial dispersion); and I = 0 indicating no correlation and spatial random distribution [57].
- (2)
- Local autocorrelation analysis:
To compensate for the limitations of global autocorrelation in studying spatial atypical characteristics, we also used the local autocorrelation analysis indicator LISA to analyse the local spatial correlation of each province in China regarding agricultural technology innovation and food security. This approach provides a more specific reflection of the degree of local spatial agglomeration in each region and clarifies the exact location of spatial agglomeration [58]. The specific calculation steps are as follows:
where and are normalised to the observed data in region and region , and represents the spatial weights. A positive value of indicates that region belongs to a neighbouring region with high values surrounded by high values or low values surrounded by low values. A negative value of indicates that region belongs to a neighbouring region with a low value surrounded by a high value or a high value surrounded by a low value.
2.3.4. Grey Correlation Model
The grey correlation model can better deal with the uncertainty and incompleteness in actual data, and it is an important methods for revealing the magnitude of the degree of influencing factors. Using this method, Li et al. [59], Geng et al. [60] and Hu et al. [61] investigated the important factors influencing the coordinated development of the two systems. Therefore, this study introduced the grey correlation model, which has few constraints and accurate calculation results, for the computational analysis. The calculation formula is presented below [62]:
where is the grey correlation coefficient; is the absolute difference between the standardised value of the jth indicator in China’s agricultural technology innovation or food security evaluation system and the agricultural technology innovation or food security index; and are the minimum and maximum of the absolute difference, respectively; is the resolution coefficient; and the grey correlation, , represents the correlation strength. The larger the value, the greater the intersystem correlation. It is usually divided into three levels according to the degree of strength [63]: high correlation (0.75, 1.00), medium correlation (0.35, 0.75), and low correlation [0, 0.35].
3. Results
By applying the above research methods, this paper conducted a study on the coupled and coordinated relationship between agricultural technology innovation and food security in China and the factors influencing it. The main findings are as follows:
3.1. Comprehensive Evaluation Index of Agricultural Technology Innovation and Food Security in China
The index demonstrates changes in China’s agricultural technology innovation system and food security system from 2008 to 2020, as shown in Figure 1 and Table 2. In terms of the process of change, the evolution of China’s agricultural technology innovation is divided into a steady growth phase I (2008–2014) and a rapid development phase II (2015–2020). In Phase I, the level of innovation in agricultural technology grew steadily. The comprehensive evaluation index grew from 0.0363 in 2008 to 0.0694 in 2014, with an average annual growth rate of 0.47%. In Phase II, the level of innovation in agricultural technology is rising rapidly. The composite evaluation index grew from 0.0807 in 2015 to 0.1364 in 2020, with an average annual growth rate of 0.93%. The level of development of China’s food security system is on a steady upward trend. The Composite Evaluation Index grew steadily from 0.0512 in 2008 to 0.1023 in 2020, with an average annual growth rate of 0.40%.
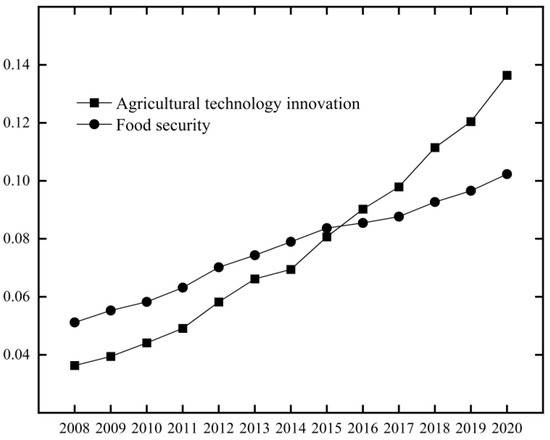
Figure 1.
Comprehensive evaluation index of China’s agricultural technology innovation and food security from 2008 to 2020.
Table 2.
The phased characteristics of technological innovation and the food security development level in China.
3.2. Evolution of Spatial and Temporal Patterns
3.2.1. Chronological Evolution
The change in the degree of the coupling coordination between China’s agricultural technology and innovation and food security from 2008 to 2020 is shown in Figure 2. It can be seen that the degree of coupling coordination between China’s agricultural technology innovation and food security in the research period shows a steady growth trend. Combined with the calculation results, the development the coupling degree of China’s agricultural technology with innovation and food security can be divided into two stages. From 2008 to 2016, the degree of coupling increased from 0.2076 to 0.2964, which is in the stage of moderate disorder, where the degree of agricultural technology innovation is low, the development of food security is slow, and the impact of agricultural technology innovation is not significant, resulting in the mutual support between the two. From 2017 to 2020, the degree of coupling coordination exceeded 0.3 and increased from 0.3044 to 0.3437, improving to the stage of mild disorder. This shows that the interaction between agricultural technology innovation and food security in China continues to strengthen, with a coordinated development trend.
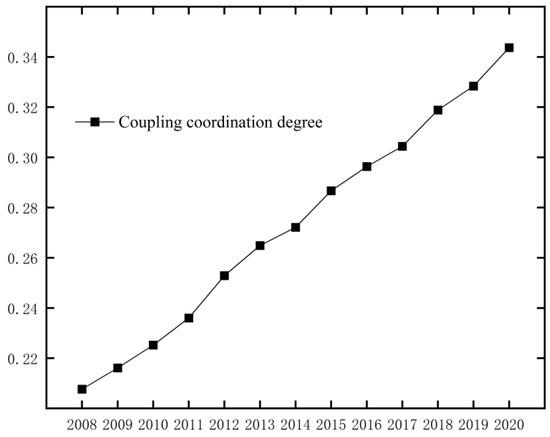
Figure 2.
Coupling and coordination between agricultural technology innovation and food security in China from 2008 to 2020.
3.2.2. Evolution of Provincial Spatial Pattern
The spatial distribution of the coupling degree of agricultural technology innovation and food security in Chinese provinces in 2008, 2012, 2016 and 2020 is shown in Figure 3. From a spatial dimension, the overall pattern of coupling degree distribution was “high in the east and low in the west”. The number of high-value areas was increasing and showed a tendency to spread to coastal provinces. The number of low-value areas was decreasing, and the value of the coupling coordination degree showed an increasing trend. Overall, the geographical differences in the spatial distribution of the coupling degree of agricultural technology innovation and food security in China’s provincial areas are more obvious, showing a certain trend of polarisation. From a temporal perspective, the mean values of the degree of coupling coordination increased in 2008, 2012, 2016 and 2020. The average value of the index was 0.349, 0.404, 0.454 and 0.499, respectively, with the highest increase of 15.76%. Overall, the degree of coordination between agricultural S&T innovation and food security in China’s provinces has basically changed from a “comprehensive dissonance pattern” to a “semi-coordinated and semi-dissonant pattern” during the study period.
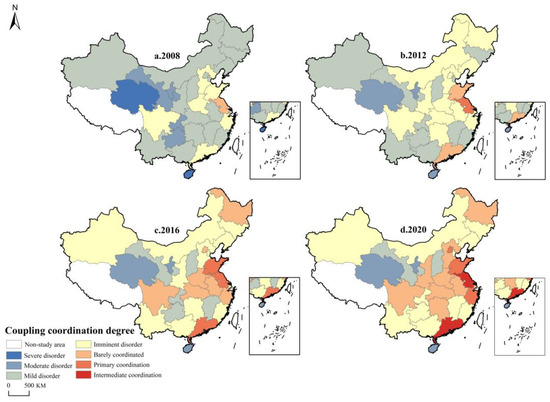
Figure 3.
Spatial and temporal situations of the coupling coordination of provincial agricultural technology innovation and food security in China.
Specifically, it can be seen that in 2008, only one province, Jiangsu Province, was in the barely coordinated stage of coupling coordination between agricultural technology innovation and food security. This indicates that in Jiangsu Province there is a more benign interaction of technological agricultural development, and it was the first to enter the initial stage of development compared to the other provinces. The number of provinces with mild disorder was highest at 56.70%. Provinces with imminent disorder are the next most numerous, accounting for 20% of the total. Moderately dysfunctional and severe disorder provinces accounted for 13.30% and 6.70%, respectively. In 2011, Jiangsu, Shandong and Guangdong provinces entered the phase of coupling coordination to varying degrees. Among them, the level of coupling coordination in Jiangsu Province increased to the primary coordination stage, ahead of other provinces in the country during the same period. The number of provinces with imminent disorder was the highest at 43.30%. Mild disorder provinces were the next largest, accounting for 36.70%. The only moderate disorder provinces were Qinghai, Ningxia and Hainan. In 2016, 10 provinces entered the coupling coordination phase. Among them, Jiangsu, Shandong and Guangdong reached the primary coordination stage, and neighbouring provinces such as Zhejiang, Anhui and Henan reached the barely coordinated stage. The number of provinces in the imminent disorder stage was the highest at 40%. The number of mild disorder provinces fell from 11 to 5. Moderate disorder provinces remained unchanged. By 2020, the numbers of provinces in the coordinated and dissonant stages were basically the same. Among them, Guangdong and Jiangsu provinces were the first to reach the intermediate coordination stage. Primary coordination and barely coordinated provinces accounted for 10% and 30%, respectively. The number of provinces with imminent disorder was the highest at 36.67%. Mild disorder and moderate disorder provinces accounted for 6.67% and 10% respectively. Overall, the provinces that were in the coupling coordination stage are mainly located in the eastern coastal and central regions of China, with the eastern coastal provinces being in the region with the highest values, and the provinces in the coupling dissonance stage are mainly located in the inland region of northwest China.
3.3. Spatial Autocorrelation
3.3.1. Global Spatial Autocorrelation
The global Moran’s I degree of the coupled coordination of agricultural technology innovation and food security in China is shown in Table 3. It is evident that the Moran’s I index was positive during the study period, and all Z-values exceeded the critical value of 1.96 at a confidence level of 0.05, indicating the significance of the test. This shows that from a spatial perspective, the degree of coupling and coordination between agricultural technology innovation and food security in China exhibits a certain positive correlation. There is a significant spatial agglomeration pattern of “high–high” and “low–low” agglomerations. That is, for provinces with a high degree of spatial coupling coordination, their neighbouring provinces also experience a high degree, and provinces with a low degree of coupling coordination also have neighbouring provinces with a low degree. Specifically, the global Moran’s I values were 0.192, 0.212, 0.229 and 0.214 in 2008, 2012, 2016 and 2020, respectively. This shows a general trend of growth, indicating that the degree of spatial coordination of the degree of coupling coordination was relatively stable, and provincial agricultural technology innovation and food security were in a process of continuous synergistic development.
Table 3.
China’s agricultural technology innovation and food security coupling coordination degree overall Moran’s I from 2008 to 2020.
3.3.2. Local Spatial Autocorrelation
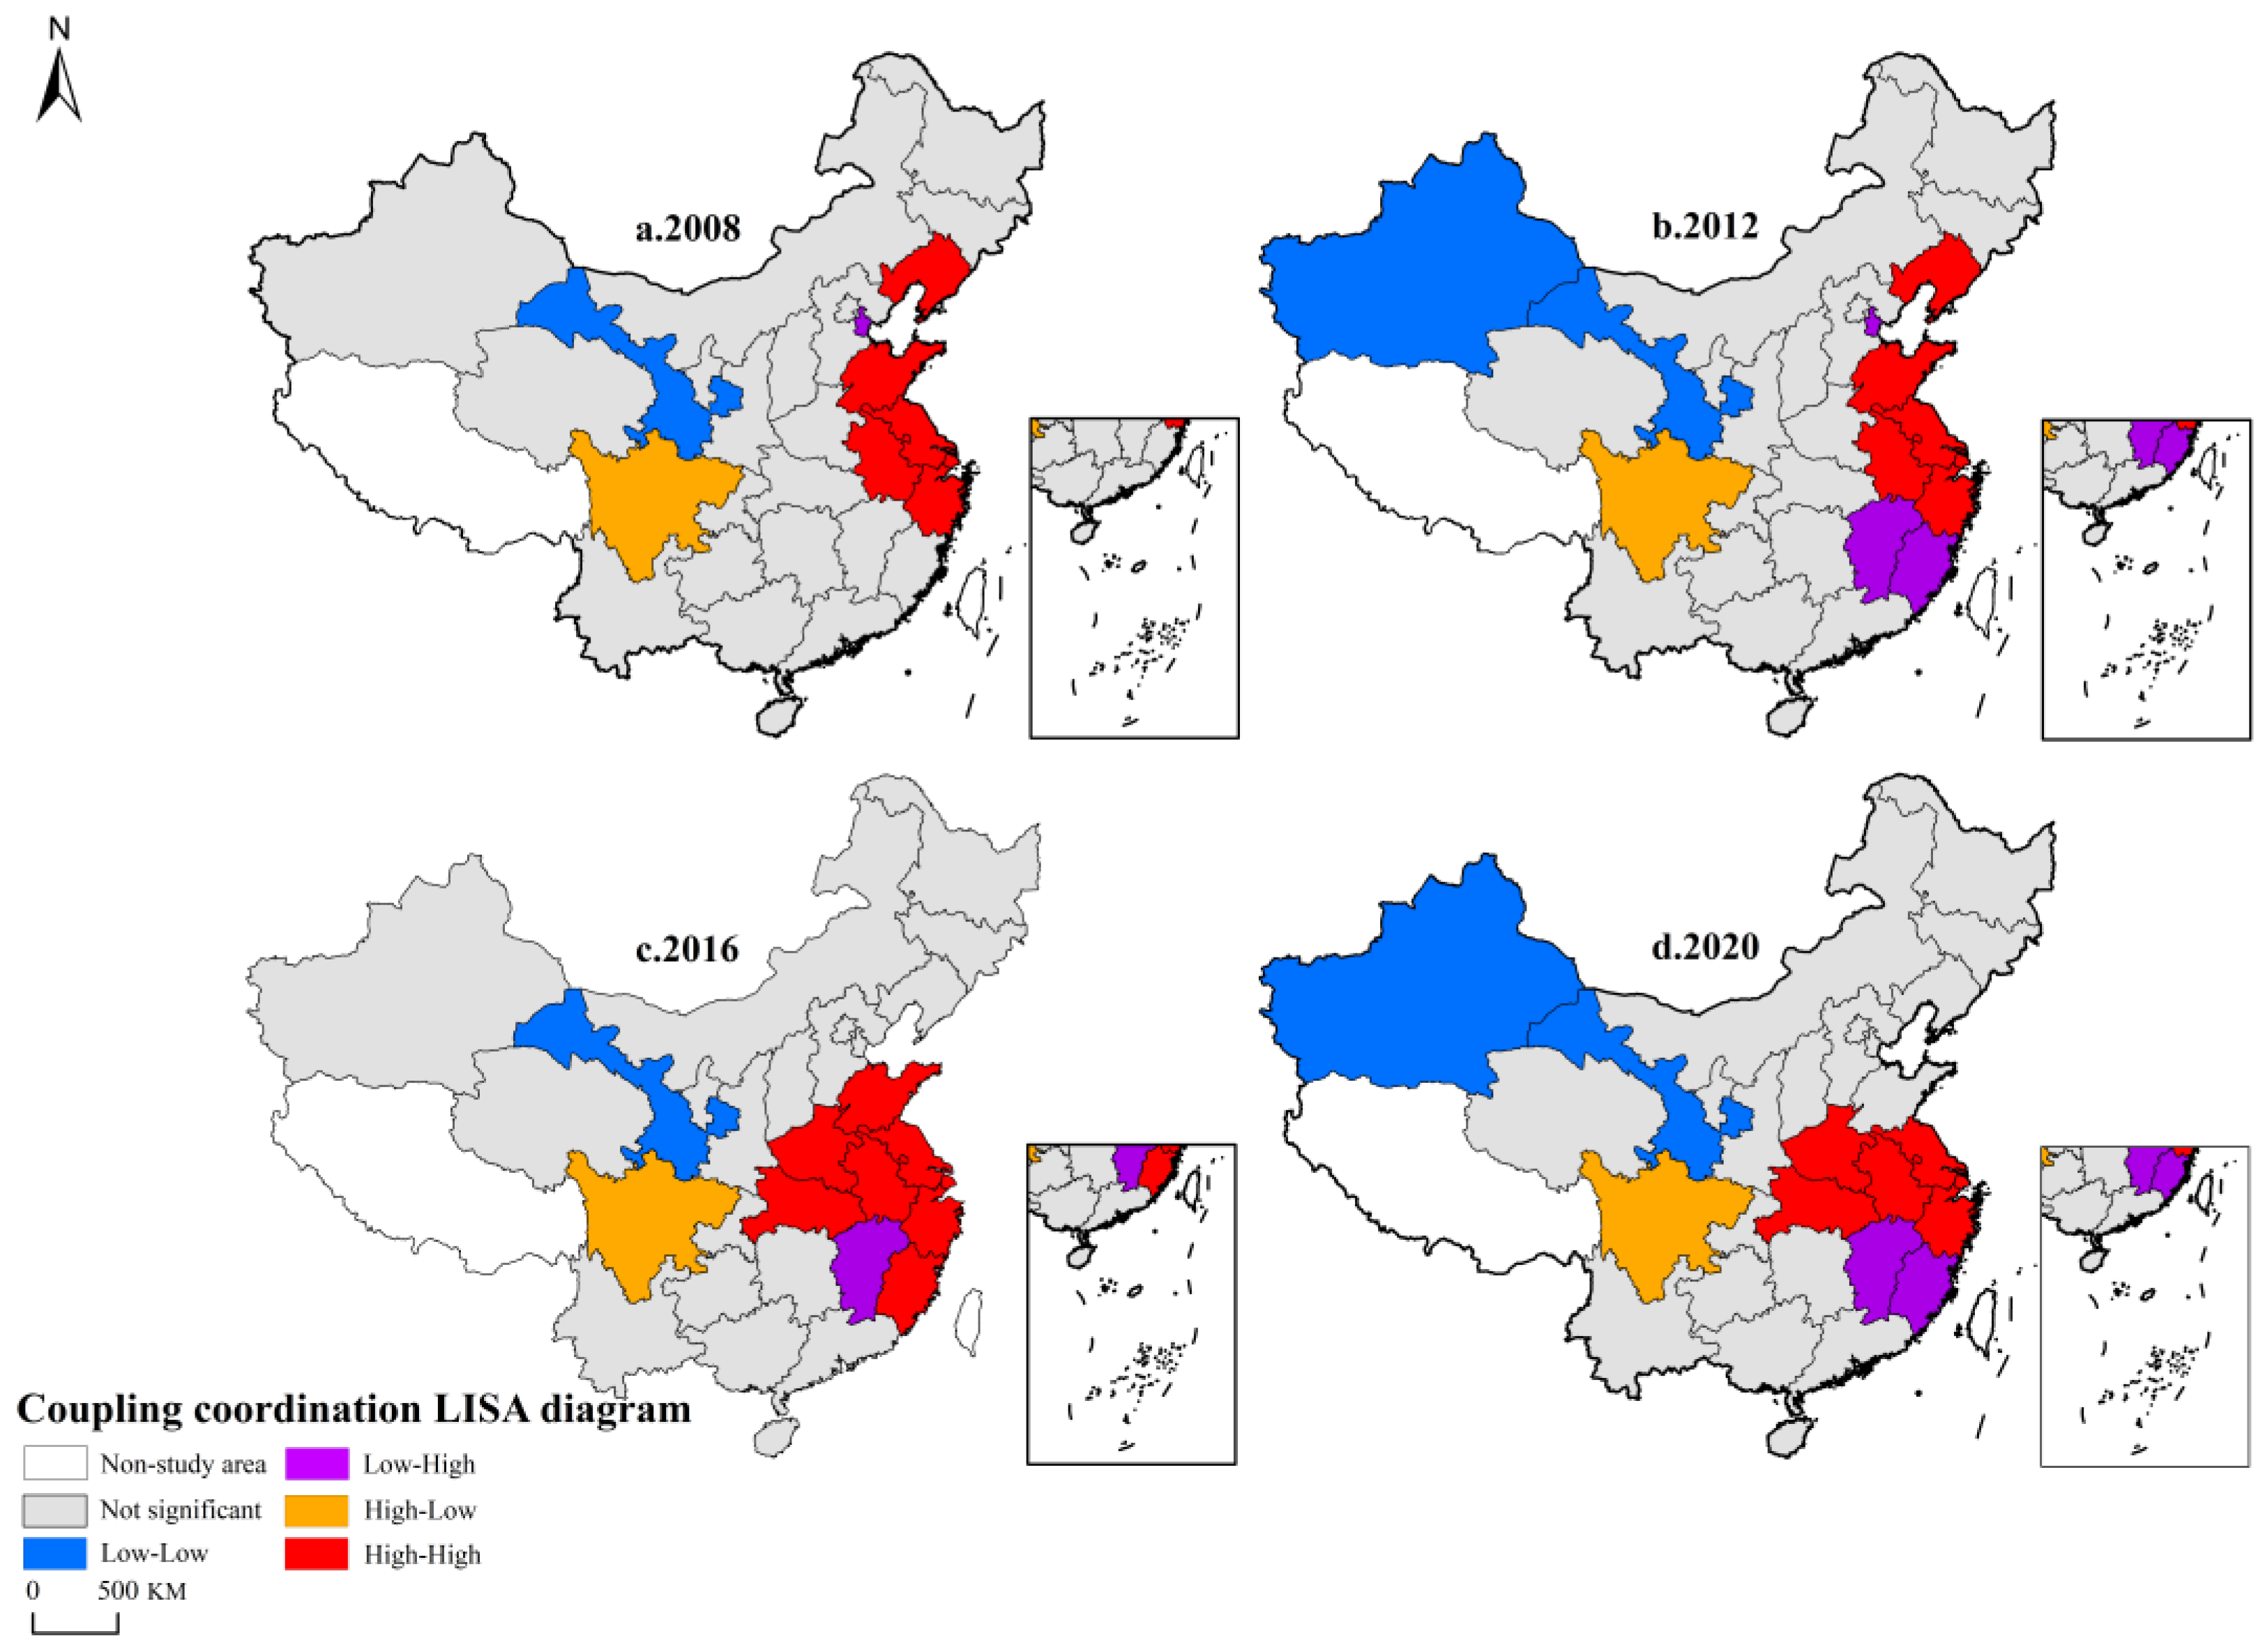
The study selected cross-sectional data for 2008, 2012, 2016 and 2020 to draw a LISA cluster map of the coupling coordination, and it classified spatial agglomeration types into five categories: nonsignificant, low–low, high–low, high–high and “low–high” agglomeration (Figure 4).

Figure 4.
LISA cluster map of China’s agricultural technology innovation and food security coupling coordination degree from 2008 to 2020.
Specifically, the scope of the “low–low” agglomeration area expanded, from Gansu in 2008 to Gansu and Xinjiang provinces in 2020. The spatial concentration was deeper in northwest China. The pole of the “high–low” agglomeration was Sichuan Province, and the changes in the types of agglomerations in the surrounding provinces were stable. The scope of the “high–high” agglomeration area fluctuated significantly. From Liaoning, Shandong, Anhui, Jiangsu, Shanghai and Zhejiang provinces in 2008, it developed into Shandong, Henan, Anhui, Jiangsu, Shanghai, Zhejiang, Fujian and Hubei provinces in 2016. By 2020, there were six provinces: Henan, Anhui, Jiangsu, Shanghai, Zhejiang and Hubei. The spatial distribution of the “low–high” agglomerations was scattered and unstable. The scope of this type of area goes through the process of enlarging, shrinking and expanding again. The spatial distribution eventually changed from Beijing in 2008 to Jiangxi and Fujian provinces in 2020. Overall, over time, the interaction between provinces increased, the degree of coupling and coordination increased, and the effect of spatial agglomeration was significantly enhanced.
3.4. Analysis of Influencing Factors
To advance the coordinated progression of China’s agricultural technology innovation and food security, it is vital to analyse and summarise the factors that affect various stages of coordinated development. Taking the various subsystems of China’s agricultural technology innovation and food security as influencing factors, a grey correlation analysis was carried out to analyse the factors influencing coupling coordination at different stages (Table 4).
Table 4.
Grey correlation analysis of the influencing factors and the coupling coordination degree at different stages of coordinated development.
Moderate disorder stage, 2008–2016: In the agricultural technology innovation system, the X13 indicator of the total power of agricultural machinery had the greatest influence on the coordinated development of China’s agricultural technology innovation and food security, with a correlation of 0.984, which is highly correlated. In addition, other indicators that were highly correlated with the coordinated development of the two are in the following order of influence: X15 > X12 > X21 > X22 > X14 > X11. The indicator with the smallest correlation with the coordinated development of the two is the indicator of the number of patents granted for inventions of X23, with a correlation of 0.637. This shows there was a moderate correlation and is consistent with the X25 and X24 indices. In the food security system, the Y32 urban road space per capita indicator had the greatest impact on the coordinated development of agricultural technology innovation and food security in China, with a correlation of 0.955, which indicates high correlation, as with the Y13, Y12 and Y23 indicators. The indicator with the smallest correlation with the coordinated development of the two was the Y22 proportion of children under five years of age experiencing moderate to severe malnutrition indicator, with a correlation of 0.601, which is a medium correlation. In addition, the other indicators moderately associated with coordinated development were Y21 > Y33 > Y11 > Y14 > Y31.
Mild disorder stage, 2017–2020: In the agricultural technology innovation system, the X13 indicator of the total power of agricultural machinery still had the greatest influence on the coordinated development of China’s agricultural technology innovation and food security, which was highly correlated. However, the relatedness fell to 0.939, a decrease of 4.57%. In addition, other indicators that were highly correlated with the coordinated development of the two were in the following order of influence: X21 > X24 > X12 > X23 > X22 > X15 > X14 > X11. Only the X25 technology market turnover indicator showed a moderate correlation, with the lowest correlation of 0.605 found in its association with the coordinated development of the two variables. The correlations of the indicators X23, X24, X14 and X11 showed increases of 41.60%, 36.43%, 6.11% and 3.51%, respectively, compared to the moderate disorder stage. In the food security system, the Y32 urban road space per capita indicator still had the greatest impact on the coordinated development of agricultural technology innovation and food security in China and was highly correlated. However, the relatedness fell to 0.938, a decrease of 1.78%. In addition, other indicators that are highly correlated with the coordinated development of the two were in the following order of influence: Y33 > Y11 > Y14 > Y13. The indicator with the smallest correlation with the coordinated development of the two was the indicator Y23 pesticide usage, with a correlation of 0.574, which is a medium correlation. In addition, the other indicators moderately associated with coordinated development were Y21 > Y22 > Y31 > Y12. The correlation of the indicators Y14, Y11, Y33, Y22, and Y31 showed increases of 34.70%, 32.10%, 27.71%, 9.98%, and 7.89%, respectively, compared with the moderate disorder stage.
Overall, within the agricultural technology innovation system, the indicators of the X1 input capacity layer had a significant impact on the coordinated development of both. However, over time, the correlation between the indicators of the X2 support capacity layer and the coordinated development of the two gradually increased. Within the food security system, indicators in the Y1 production security criterion layer had a significant impact on the coordinated development of the two. However, over time, there has been a gradual increase in the correlation between the indicator Y3 distribution security criterion layer and the coordinated development of the two.
4. Discussion
The empirical results indicate that China’s agricultural technological innovation and food security exhibited a positive trend from 2008 to 2020, both in terms of their respective levels of development and the degree of coupling and coordination between them. This confirms Huang et al.’s [64] conclusion about the changing trend of food security in China. Additionally, this can be attributed to China’s recent commitment to the policy of basic food self-sufficiency [65] and vigorous promotion of agricultural technology innovation. As a result, the modernisation of agricultural science and technology is beginning to bear fruit. However, we found that the level of coordination between agricultural technology innovation and food security in China remains dysfunctional, and there is significant room for improvement.
Concerning spatial evolution, coordinated innovation in agricultural technology and food security in China results in various agglomerations. We found that the changing characteristics of the “high–high” agglomeration area primarily result from the Yangtze River Delta region’s ability to drive the coordinated development of neighbouring provinces. This creates a growth pole with complementary advantages and a win–win situation, as Wu et al. [66] found in their analysis of the role of the Yangtze River Delta agglomeration. The change in the “low–low” agglomeration area results primarily from the geographical location of Gansu and Xinjiang provinces in Northwest China, where issues such as underdeveloped infrastructure, severe soil erosion, and an inflexible agricultural industry structure prevail. This also coincides with other scholars’ studies of the Northwest [67]. Furthermore, we found that the ongoing depletion of social capital and human resources resulted from an inadequate level of socioeconomic development. This is also a significant factor contributing to the change in the “low–low” agglomeration area.
In terms of influencing factors, during the moderate disorder stage, indicators at the input capacity level and the production security level have a significant influence on the coordinated development of the two. This suggests that promoting their coordinated development depends primarily on technological inputs and food production. On the one hand, the allocation and spending of funds enhance the construction of urban infrastructure, including roads and other components, mitigating economic and geographical shortcomings. This is corroborated by the studies of Melketo [68] and Zhuang et al. [69]. On the other hand, the economy drives progress in agricultural technological innovation, which bolsters the total agricultural machinery power, thereby boosting food production. As the level of coordination between the two further increases, the importance of technological support capacity and food distribution security becomes increasingly evident. During the mild disorder stage, infrastructure, such as per capita urban road area, improves further. Furthermore, there is a surge in patent applications and authorisations, along with the continual integration of novel products and technologies into every facet of food manufacturing and distribution. This contributes significantly to the virtuous circle between the two systems.
5. Conclusions and Policy Recommendations
On the basis of the analysis of the coupled coordination and influence factors of agricultural technology innovation and food security in China, this paper summarises the key conclusions and makes relevant recommendations to provide a reference for policy formulation of high-quality agricultural development in China.
5.1. Conclusions
This study developed a comprehensive evaluation index system for China’s agricultural technology innovation and food security. The coupling and coordination relationship between these systems was explained in depth using the implementing entropy value method, coupling coordination model, and exploratory spatial data analysis method. In addition, significant influencing factors were dissected with a grey correlation model. The main findings are as follows:
From 2008 to 2020, China’s agricultural technology innovation and food security development levels have generally increased. However, the development of technology innovation has outpaced that of food security. The degree of coupling coordination between the two systems is low and is generally in the dissonance stage. However, in the time dimension, the coupling coordination degree increased rapidly. It transitioned from a “comprehensive dissonance pattern” to a “semi-coordinated and semi-dissonant pattern”. In the spatial dimension, the overall coupling coordination degree showed a significant “east high, west low” distribution pattern. High-value areas were primarily found in the eastern coastal provinces of China. The areas with low values were mainly located in the inland northwest provinces of Qinghai, Ningxia and Hainan. These areas showcase significant regional variations in their spatial distribution. The degree of coupling coordination between agricultural technology innovation and food security in China showed a certain positive correlation, and there was a significant pattern of spatial aggregation. At various stages, indicators of agricultural technology and innovation and food security systems were moderately or highly linked to the coordinated development of the two systems. At the moderate disorder stage, the coordinated development of the two depends mainly on inputs from technology and food production. However, the growing importance of technological support capacity alongside food distribution security has become increasingly apparent over time.
5.2. Policy Recommendations
In light of the study’s findings, this research presents a set of recommendations for finance, human resources, and coordinated regional development to strengthen sustainable regional agriculture.
- (1)
- Governments should continue to intensify their efforts to coordinate regional financial resources. First, local authorities should improve their investment models. Financial investment should be used to entice market capital, with a focus on upgrading infrastructure, such as the amount of road space per person in urban areas. Second, for regions with low levels of agricultural technology development, build a diversified investment and financing system. Finally, the government should focus on supporting patented technologies, particularly in the seed sector, to accelerate the increase in the overall performance of agricultural machinery.
- (2)
- Governments should focus on strengthening the regional agricultural workforce. First of all, local governments should establish a sound talent introduction mechanism. Improve the construction of the talent recruitment platform and optimise the talent service guarantee system. Second, vigorously innovate the mode of training agricultural talents. Strengthen agricultural skills training for farmers and accelerate adaptation to the needs of modern agricultural development. Finally, scientific management of the agricultural talent team. Improve the evaluation system of agricultural talents and rationally innovate the talent selection mechanism.
- (3)
- The government should proactively establish a cohesive system for provincial agricultural development. First, local governments should target the development of regional synergistic development strategies among themselves. Second, efforts will be made to promote the flow of agricultural production factors across provinces. Take enterprises as the main body, open up interregional circulation channels for special agricultural products, and constantly explore new modes of grain circulation. Finally, under the impetus of “One Belt, One Road” [70], the regional gap between the eastern and western parts of agriculture should be balanced and the sharing of resources and the complementarity of advantages promoted.
While this study has produced results, there were limitations in the construction of the indicator system and the optimisation of the research methodology. The lack of sound statistical information in the field of agricultural technology has resulted in limited access to data. In the follow-up study, the agricultural technology innovation index system will be improved by supplementing the research data to enhance the scientificity and credibility of the research conclusions. In addition, the coupling coordination degree model reveals the interaction relationship between two systems but tends to ignore the complexity within the system. In this paper, we quantified the relationship between factors within the system by introducing a comprehensive evaluation index system, but the scientificity of the index system needs to be further improved. The grey correlation model is able to classify the correlation level of each indicator and has a strong explanatory power in terms of the degree of influence. However, the correlation values obtained are all positive, which cannot reflect whether there is a positive or negative correlation between things, and this part will be further explored in subsequent research.
Author Contributions
Conceptualisation, C.Z. and C.K.; methodology, C.Z. and R.G.; software, R.G. and T.C.; validation, C.K.; formal analysis, C.K. and T.C.; investigation, R.G. and J.L.; resources, J.L.; data curation, R.G. and T.C.; writing—original draft preparation, C.Z. and R.G.; writing—review and editing, C.K.; visualisation, T.C.; supervision, C.Z. and J.L.; project administration, C.K. and J.L.; funding acquisition, C.Z. and C.K. All authors have read and agreed to the published version of the manuscript.
Funding
This research was funded by the National Social Science Foundation Projects (22CJL004), Shandong Province Social Science Planning Research Project (22DJJJ11), Humanities and Social Sciences Subjects in Shandong Province (2022-YYJJ-16) and Shandong Province Education Science Fourteenth Five-Year Plan Project (2021QYB005).
Data Availability Statement
The data presented in this study are available upon request from the third author.
Acknowledgments
We sincerely thank the editor and the reviewers for their helpful comments and suggestions about our manuscript. This work also was assisted by the Office of Research Administration, Chiang Mai University.
Conflicts of Interest
The authors declare no conflicts of interest.
References
- March, A.; Failler, P. Small-scale fisheries development in Africa: Lessons learned and best practices for enhancing food security and livelihoods. Mar. Policy 2022, 136, 104925. [Google Scholar] [CrossRef]
- Saboori, B.; Alhattali, N.A.; Gibreel, T. Agricultural products diversification-food security nexus in the GCC countries; introducing a new index. J. Agric. Food Res. 2023, 12, 100592. [Google Scholar] [CrossRef]
- Moodi, M.; Salehiniya, H.; Mohtashaminia, S.; Amininasab, Z.; Arab-Zozani, M. Prevalence of household food insecurity in the marginal area of Birjand, Iran. Front. Sustain. Food Syst. 2023, 7, 951698. [Google Scholar] [CrossRef]
- Zhang, Z.; Shi, K.; Tang, L.; Su, K.; Zhu, Z.; Yang, Q. Exploring the spatiotemporal evolution and coordination of agricultural green efficiency and food security in China using ESTDA and CCD models. J. Clean. Prod. 2022, 374, 133967. [Google Scholar] [CrossRef]
- Liu, Y.; Zhou, Y. Reflections on China’s food security and land use policy under rapid urbanization. Land Use Policy 2021, 109, 105699. [Google Scholar] [CrossRef]
- Li, F.; Ma, S.; Liu, X. Changing multi-scale spatiotemporal patterns in food security risk in China. J. Clean. Prod. 2023, 384, 135618. [Google Scholar]
- Tian, Q.; Yu, Y.; Xu, Y.; Li, C.; Liu, N. Patterns and driving factors of agricultural virtual water imports in China. Agric. Water Manag. 2023, 281, 108262. [Google Scholar] [CrossRef]
- Lu, Z.; Zhang, P.; Li, H.; Guan, A.; Liu, C. Overview and prospect of pesticide creation in China. J. Pestic. Sci. 2019, 21, 551–579. [Google Scholar]
- Liu, L.; Wang, X.; Meng, X.; Cai, Y. The coupling and coordination between food production security and agricultural ecological protection in main food-producing areas of China. Ecol. Indic. 2023, 154, 110785. [Google Scholar] [CrossRef]
- Cai, J.; Ma, S.; Li, X.; Li, N. Study on the coupling and coordinated development of grain production capacity and cultivated land use intensity. Resour. Dev. Mark. 2023, 39, 400–407,416. (In Chinese) [Google Scholar]
- Yang, H.; Gou, X.; Xue, B.; Xu, J.; Ma, W. How to effectively improve the ecosystem provisioning services in traditional agricultural and pastoral areas in China? Ecol. Indic. 2023, 150, 110244. [Google Scholar] [CrossRef]
- Li, H.; Mao, S. The Influence of Human Resources on the Innovation Efficiency of Chinese Agricultural Research Institutes—An Essay on the Importance of the Choice of Science and Technology Innovation Models. Sci. Technol. Manag. Stud. 2020, 40, 96–103. (In Chinese) [Google Scholar]
- Yao, H.; Zhao, X.; Gao, Q. Analysis of Agricultural Science and Technology Knowledge Flows and Their Spatial Interaction among Provinces in China. Sci. Technol. Prog. Countermeas. 2021, 38, 34–42. (In Chinese) [Google Scholar]
- Wu, L.-R.; Chen, W. Technological achievements in regional economic development: An econometrics analysis based on DEA. Heliyon 2023, 9, e17023. [Google Scholar] [CrossRef] [PubMed]
- Gouvea, R.; Kapelianis, D.; Li, S.; Terra, B. Innovation, ICT & food security. Glob. Food Secur. 2022, 35, 100653. [Google Scholar]
- Gaffney, J.; Bing, J.; Byrne, P.F.; Cassman, K.G.; Ciampitti, I.; Delmer, D.; Habben, J.; Lafitte, H.R.; Lidstrom, U.E.; Porter, D.O.; et al. Science-based intensive agriculture: Sustainability, food security, and the role of technology. Glob. Food Secur. 2019, 23, 236–244. [Google Scholar] [CrossRef]
- Zhu, Y.; Begho, T. Towards responsible production, consumption and food security in China: A review of the role of novel alternatives to meat protein. Future Foods 2022, 6, 100186. [Google Scholar] [CrossRef]
- Begho, T.; Zhu, Y. Determinants of consumer acceptance of meat analogues: Exploring measures of risk preferences in predicting consumption. J. Agric. Food Res. 2023, 11, 100509. [Google Scholar] [CrossRef]
- Bigini, V.; Camerlengo, F.; Botticella, E.; Sestili, F.; Savatin, D.V. Biotechnological Resources to Increase Disease-Resistance by Improving Plant Immunity: A Sustainable Approach to Save Cereal Crop Production. Plants 2021, 10, 1146. [Google Scholar] [CrossRef]
- Abecassis, J.; Cuq, B.; Escudier, J.-L.; Garric, G.; Kondjoyan, A.; Planchot, V.; Salmon, J.-M.; de Vries, H. Food chains; the cradle for scientific ideas and the target for technological innovations. Innov. Food Sci. Emerg. Technol. 2018, 46, 7–17. [Google Scholar] [CrossRef]
- Zhu, K.; Tan, X.; Gu, B.; Lin, J. Evaluation of potential amounts of crop straw available for bioenergy production and bio-technology spatial distribution in China under ecological and cost constraints. J. Clean. Prod. 2021, 292, 125958. [Google Scholar] [CrossRef]
- Lei, S.; Yang, X.; Qin, J. Does agricultural factor misallocation hinder agricultural green production efficiency? Evidence from China. Sci. Total Environ. 2023, 891, 164466. [Google Scholar] [CrossRef] [PubMed]
- Wakweya, R.B. Challenges and prospects of adopting climate-smart agricultural practices and technologies: Implications for food security. J. Agric. Food Res. 2023, 14, 100698. [Google Scholar] [CrossRef]
- Li, F.; Liu, X.; Qin, Z. Grain production space reconstruction: Connotation, mechanism and enlightenment. Environ. Dev. 2023, 45, 100818. [Google Scholar]
- Adenle, A.A.; Wedig, K.; Azadi, H. Sustainable agriculture and food security in Africa: The role of innovative technologies and international organizations. Technol. Soc. 2019, 58, 101143. [Google Scholar] [CrossRef]
- Amorim, A.; Silva, V.L.; Sobral, P.J.d.A. Food Processing: An overview on links between safety, security, supply chains, and NOVA classification. Clean. Circ. Bioeconomy 2023, 5, 100047. [Google Scholar] [CrossRef]
- Gui, J.-F.; Zhou, L.; Li, X.-Y. Rethinking fish biology and biotechnologies in the challenge era for burgeoning genome resources and strengthening food security. Water Biol. Secur. 2022, 1, 100002. [Google Scholar] [CrossRef]
- Tian, J.; Bryksa, B.C.; Yada, R.Y. Feeding the world into the future—Food and nutrition security: The role of food science and technology†. Front. Life Sci. 2016, 9, 155–166. [Google Scholar] [CrossRef]
- Xu, Y.; Zhang, X.; Li, H.; Zheng, H.; Zhang, J.; Olsen, M.S.; Varshney, R.K.; Prasanna, B.M.; Qian, Q. Smart breeding driven by big data, artificial intelligence, and integrated genomic-enviromic prediction. Mol. Plant 2022, 15, 1664–1695. [Google Scholar] [CrossRef]
- Yan, W.; Liu, X.; Cao, S.; Yu, J.; Zhang, J.; Yao, G.; Yang, H.; Yang, D.; Wu, Y. Molecular basis of Pogostemon cablin responding to continuous cropping obstacles revealed by integrated transcriptomic, miRNA and metabolomic analyses. Ind. Crops Prod. 2023, 200, 116862. [Google Scholar] [CrossRef]
- Liu, J.; Ren, Y. Can digital inclusive finance ensure food security while achieving low-carbon transformation in agricultural development? Evidence from China. J. Clean. Prod. 2023, 418, 138016. [Google Scholar] [CrossRef]
- Alyahya, S.; Khan, W.U.; Ahmed, S.; Marwat, S.N.; Habib, S. Cyber Secure Framework for Smart Agriculture: Robust and Tamper-Resistant Authentication Scheme for IoT Devices. Electronics 2022, 11, 963. [Google Scholar] [CrossRef]
- Wolfert, S.; Verdouw, C.; van Wassenaer, L.; Dolfsma, W.; Klerkx, L. Digital innovation ecosystems in agri-food: Design principles and organizational framework. Agric. Syst. 2023, 204, 103558. [Google Scholar] [CrossRef]
- Mantravadi, S.; Srai, J.S. How Important are Digital Technologies for Urban Food Security? A Framework for Supply Chain Integration using IoT. Procedia Comput. Sci. 2023, 217, 1678–1687. [Google Scholar] [CrossRef]
- Wang, Q.; Mu, Z. Risk monitoring model of intelligent agriculture Internet of Things based on big data. Sustain. Energy Technol. Assess. 2022, 53, 102654. [Google Scholar] [CrossRef]
- Farooq, M.S.; Riaz, S.; Abid, A.; Abid, K.; Naeem, M.A. A Survey on the Role of IoT in Agriculture for the Implementation of Smart Farming. IEEE Access 2019, 7, 156237–156271. [Google Scholar] [CrossRef]
- Ferrández-Pastor, F.-J.; Mora-Pascual, J.; Díaz-Lajara, D. Agricultural traceability model based on IoT and Blockchain: Application in industrial hemp production. J. Ind. Inf. Integr. 2022, 29, 100381. [Google Scholar] [CrossRef]
- Alam, M.F.B.; Tushar, S.R.; Zaman, S.M.; Gonzalez, E.D.R.S.; Bari, A.B.M.M.; Karmaker, C.L. Analysis of the drivers of Agriculture 4.0 implementation in the emerging economies: Implications towards sustainability and food security. Green Technol. Sustain. 2023, 1, 100021. [Google Scholar] [CrossRef]
- Frota, M.M.; Mattos, A.L.A.; Miranda, K.W.E.; Cheng, H.N.; Biswas, A.; Bastos, M.D.S.R. Superhydrophobic systems in food science and technology: Concepts, trends, challenges, and technological innovations. Appl. Food Res. 2022, 2, 100213. [Google Scholar] [CrossRef]
- Dzikunoo, J.; Letsyo, E.; Adams, Z.; Asante-Donyinah, D.; Dzah, C.S. Ghana’s indigenous food technology: A review of the processing, safety, packaging techniques and advances in food science and technology. Food Control 2021, 127, 108116. [Google Scholar] [CrossRef]
- Chen, F.; Zhang, M.; Yang, C.-H. Application of ultrasound technology in processing of ready-to-eat fresh food: A review. Ultrason. Sonochem. 2020, 63, 104953. [Google Scholar] [CrossRef] [PubMed]
- Ju, K.; Wang, J.; Wei, X.; Li, H.; Xu, S. A comprehensive evaluation of the security of the water-energy-food systems in China. Sustain. Prod. Consum. 2023, 39, 145–161. [Google Scholar] [CrossRef]
- Singh, R.K.; Joshi, P.K.; Sinha, V.S.P.; Kumar, M. Indicator based assessment of food security in SAARC nations under the influence of climate change scenarios. Future Foods 2022, 5, 100122. [Google Scholar] [CrossRef]
- Wang, D.; Du, X.; Guo, X. Capability Evaluation and Analysis of Provincial Agricultural Science, Technology and Innovation. Sci. Technol. Manag. Res. 2021, 41, 1–8. (In Chinese) [Google Scholar]
- Zhang, Y.; Su, Z.; Li, G.; Zhuo, Y.; Xu, Z. Spatial-Temporal Evolution of Sustainable Urbanization Development: A Perspective of the Coupling Coordination Development Based on Population, Industry, and Built-Up Land Spatial Agglomeration. Sustainability 2018, 10, 1766. [Google Scholar] [CrossRef]
- Fu, X.-M.; Wu, W.-Y.; Lin, C.-Y.; Ku, H.-L.; Wang, L.-X.; Lin, X.-H.; Liu, Y. Green innovation ability and spatial spillover effect of marine fishery in China. Ocean Coast. Manag. 2022, 228, 106310. [Google Scholar] [CrossRef]
- Yang, H.; Zhao, Y.; Zhao, Y.; Chen, N. Drivers’ visual interaction performance of on-board computer under different heat conditions: Based on ELM and entropy weight. Sustain. Cities Soc. 2022, 81, 103835. [Google Scholar] [CrossRef]
- Cheng, J.; Zhang, X.; Gao, Q. Analysis of the spatio-temporal changes and driving factors of the marine economic–ecological–social coupling coordination: A case study of 11 coastal regions in China. Ecol. Indic. 2023, 153, 110392. [Google Scholar] [CrossRef]
- Chen, K.; Tian, G.; Tian, Z.; Ren, Y.; Liang, W. Evaluation of the Coupled and Coordinated Relationship between Agricultural Modernization and Regional Economic Development under the Rural Revitalization Strategy. Agronomy 2022, 12, 990. [Google Scholar] [CrossRef]
- Hu, Z.; Kumar, J.; Qin, Q.; Kannan, S. Assessing the coupling coordination degree between all-for-one tourism and ecological civilization; case of Guizhou, China. Environ. Sustain. Indic. 2023, 19, 100272. [Google Scholar] [CrossRef]
- Song, S.; Chen, X.; Liu, T.; Zan, C.; Hu, Z.; Huang, S.; De Maeyer, P.; Wang, M.; Sun, Y. Indicator-based assessments of the coupling coordination degree and correlations of water-energy-food-ecology nexus in Uzbekistan. J. Environ. Manag. 2023, 345, 118674. [Google Scholar] [CrossRef] [PubMed]
- Song, M.; Zhao, Y.; Liang, J.; Li, F. Spatial-temporal variability of carbon emission and sequestration and coupling coordination degree in Beijing district territory. Clean. Environ. Syst. 2023, 8, 100102. [Google Scholar] [CrossRef]
- Hou, M.; Deng, Y.; Yao, S. Coordinated relationship between urbanization and grain production in China: Degree measurement, spatial differentiation and its factors detection. J. Clean. Prod. 2022, 331, 129957. [Google Scholar] [CrossRef]
- Dong, Y.-H.; Peng, F.-L.; Li, H.; Men, Y.-Q. Spatial autocorrelation and spatial heterogeneity of underground parking space development in Chinese megacities based on multisource open data. Appl. Geogr. 2023, 153, 102897. [Google Scholar] [CrossRef]
- Ripley, B.D. Spatial Processes: Models and Applications. J. Am. Stat. Assoc. 1984, 79, 238. [Google Scholar] [CrossRef]
- Kumari, M.; Sarma, K.; Sharma, R. Using Moran’s I and GIS to study the spatial pattern of land surface temperature in relation to land use/cover around a thermal power plant in Singrauli district, Madhya Pradesh, India. Remote Sens. Appl. Soc. Environ. 2019, 15, 100239. [Google Scholar] [CrossRef]
- Xiao, Y.; Gong, P. Removing spatial autocorrelation in urban scaling analysis. Cities 2022, 124, 103600. [Google Scholar] [CrossRef]
- An, W.; Wang, B.; Duan, L.; Giovanni, C.; Yu, G. Emerging contaminants in the northwest area of the Tai Lake Basin, China: Spatial autocorrelation analysis for source apportionment and wastewater-based epidemiological analysis. Sci. Total Environ. 2023, 865, 161176. [Google Scholar] [CrossRef]
- Li, S.; Zhang, L.; Su, L.; Nie, Q. Exploring the coupling coordination relationship between eco-environment and renewable energy development in rural areas: A case of China. Sci. Total Environ. 2023, 880, 163229. [Google Scholar] [CrossRef]
- Geng, Y.; Chen, L.; Li, J.; Iqbal, K. Higher education and digital Economy: Analysis of their coupling coordination with the Yangtze River economic Belt in China as the example. Ecol. Indic. 2023, 154, 110510. [Google Scholar] [CrossRef]
- Hu, Z.; Yang, X.; Yang, J.; Yuan, J.; Zhang, Z. Linking landscape pattern, ecosystem service value, and human well-being in Xishuangbanna, southwest China: Insights from a coupling coordination model. Glob. Ecol. Conserv. 2021, 27, e01583. [Google Scholar] [CrossRef]
- Jiang, Q.; Liu, W.; Wu, S. Analysis on factors affecting moisture stability of steel slag asphalt concrete using grey correlation method. J. Clean. Prod. 2023, 397, 136490. [Google Scholar] [CrossRef]
- Song, Y.; Zhu, D.L.; Zhang, L.X.; Zhang, H. Spatio-temporal evolution and driving factors of land marketization in the Yellow River Basin since 2000. J. Nat. Resour. 2020, 35, 799–813. (In Chinese) [Google Scholar]
- Huang, J.-K.; Wei, W.; Cui, Q.; Xie, W. The prospects for China’s food security and imports: Will China starve the world via imports? J. Integr. Agric. 2017, 16, 2933–2944. [Google Scholar] [CrossRef]
- Liu, L.; Ross, H.; Ariyawardana, A. Building rural resilience through agri-food value chains and community interactions: A vegetable case study in wuhan, China. J. Rural Stud. 2023, 101, 103047. [Google Scholar] [CrossRef]
- Wu, F.; Yang, X.; Chen, Y. Research on innovative mechanisms of financial agglomeration enabling green coordinated development in the Yangtze River Delta of China. Heliyon 2023, 9, e14172. [Google Scholar] [CrossRef] [PubMed]
- Wu, Y.; Xu, R. Current status, future potentials and challenges of renewable energy development in Gansu province (Northwest China). Renew. Sustain. Energy Rev. 2013, 18, 73–86. [Google Scholar]
- Melketo, T.A. Disability-related factors affecting food security status: A case study from southern Ethiopia. J. Agric. Food Res. 2023, 13, 100647. [Google Scholar] [CrossRef]
- Zhuang, D.; Abbas, J.; Al-Sulaiti, K.; Fahlevi, M.; Aljuaid, M.; Saniuk, S. Land-use and food security in energy transition: Role of food supply. Front. Sustain. Food Syst. 2022, 6, 1053031. [Google Scholar] [CrossRef]
- Tian, J.; Liu, Y. A study on agricultural investment along the Belt and Road. Front. Sustain. Food Syst. 2022, 6, 1036958. [Google Scholar] [CrossRef]


Disclaimer/Publisher’s Note: The statements, opinions and data contained in all publications are solely those of the individual author(s) and contributor(s) and not of MDPI and/or the editor(s). MDPI and/or the editor(s) disclaim responsibility for any injury to people or property resulting from any ideas, methods, instructions or products referred to in the content. |
© 2024 by the authors. Licensee MDPI, Basel, Switzerland. This article is an open access article distributed under the terms and conditions of the Creative Commons Attribution (CC BY) license (https://creativecommons.org/licenses/by/4.0/).