Article

Woody Biochar Rate and Water Shortage Impact on Early Growth Stages of Chenopodium quinoa Willd.

by
Anna Rita Rivelli
1,
Muhammad Zubair Akram
1,2 and
Angela Libutti
3,*
1
School of Agricultural, Forest, Food and Environmental Sciences, University of Basilicata, Via dell’Ateneo Lucano, 10, 85100 Potenza, Italy
2
Ph.D. Program in Agricultural, Forest and Food Sciences, University of Basilicata, Via dell’Ateneo Lucano, 10, 85100 Potenza, Italy
3
Department of Science of Agriculture, Food, Natural Resources and Engineering, University of Foggia, Via Napoli, 25, 71122 Foggia, Italy
*
Author to whom correspondence should be addressed.
Agronomy 2024, 14(1), 53; https://doi.org/10.3390/agronomy14010053
Submission received: 30 October 2023 / Revised: 5 December 2023 / Accepted: 21 December 2023 / Published: 23 December 2023
(This article belongs to the Special Issue Sustainable Resource Management for Crop Production and Quality)

Abstract

:
The application of biochar to agricultural soils has been proven to have many advantages, including the improvement of soil water holding capacity and plant growth, particularly under limiting conditions of water supply. The response of quinoa (Chenopodium quinoa Willd.) to water shortage occurring during the vegetative growth stages is not well known. Therefore, the present study aimed to evaluate the combined effects of three wood chip biochar rates (0%, 2% and 4%) and two water regimes (100 and 50% evapotranspiration losses restitution) on the vegetative development and water status of quinoa (cultivar Titicaca). The results showed that the treatment with 2% wood chip biochar improved plant height, leaf and branch number and stem diameter during the vegetative growing cycle compared to the 0% (control) and 4% biochar treatments, which were not different from each other. At the end of the experiment, when the plants were at the flowering initiation stage, increases of 23% in leaf area, 22% in fresh biomass, 27% in main panicle length and 36% in sub-panicle number were observed. The application of woody biochar at a 4% rate, although improving the plant water status with increases of 10% in RWC and 18% in Ψ, did not enhance the vegetative development of the quinoa. The water shortage negatively affected both the growth performance and plant water status. The best growth response of quinoa was observed only when the plants were treated with a 2% biochar rate and were fully irrigated.

1. Introduction

It has been estimated that the persistence of anthropogenic CO2 emissions at the current rate may lead to a potential rise in global temperatures of 1.5 °C by 2052 [1]. The escalating threat of climate change has emerged as a significant abiotic stressor for crop development, particularly in arid and semi-arid areas, resulting in frequent drought periods and water shortage conditions. In addition, the overutilization of agricultural chemicals, including fertilizers, herbicides and pesticides, has led to a negative impact on soil health, causing a decline in fertility over time. Water shortage and suboptimal soil conditions exert a substantial influence on the physiological processes in plants and plant growth [2].
In this context, the up-to-date literature reports that the application of organic amendments to the soil can provide numerous benefits for agriculture and the environment. In particular, the use of biochar, a carbon-rich material derived from the thermochemical degradation of organic biomasses in an anaerobic or low-oxygen environment [3], is a widely agreed agronomic strategy to enhance soil fertility and mitigate the negative effects of drought [4,5]. Due to its highly porous structure and large surface area [6], biochar positively affects soil water and nutrient retention, soil water holding capacity and the water available to plants [4,7,8,9]. Biochar has also gained attention as a potential solution for sequestering carbon in soils [10], binding contaminants [11] and mitigating climate change [12]. The effects of biochar, when added to soil, can vary depending on the type and characteristics of the feedstock, the conditions of pyrolysis, the type of soil and the rate of application [13]. Although adding biochar to soil has been reported to be productive, before applying it on a large scale, any counterproductive effects should be comprehensively studied. An excessive biochar application rate may negatively affect [14,15] plant response due to several effects, including altering the soil pH and immobilizing nutrients [16,17]. According to recent studies, application doses of up to 30 t ha−1 enhanced rapeseed biomass, pods/plant and 1000-seed weight by 23%, 32% and 21%, respectively, and also increased yield, while higher doses adversely affected the growth and seed production of the rapeseed under drought [18]. Among the different types of biochar, woody biochar has garnered attention for enhancing soil properties and fostering plant growth due to its composition, primarily comprising lignin, cellulose and hemicellulose [19,20]. The specific ratios of lignin, cellulose and hemicellulose within woody biochar depend upon the wood feedstocks and are a factor that influences biochar’s characteristics post-pyrolysis [21]. Woody biochar stands out for its elevated porosity and augmented specific surface area, which are attributed to the robust thermal stability of lignin, which preserves the structural integrity of its pore architecture [22]. Moreover, woody biochar exhibits a relatively higher carbon content [23] compared to biochar derived from crop residues, thus affording it an amplified cation exchange capacity [24], accompanied by a diminished ash content [25]. Woody biochar application at low rates improved the root growth of maize hybrids, significantly reducing their sensitivity to drought while enhancing their water use efficiency [26]. Under drought conditions, the biomass of quinoa was increased up to 305% under the application of 2% co-composted wood chip biochar to the soil [27].
Currently, the cultivation of alternative crops suited to adverse environmental conditions, including quinoa, is of growing interest in many countries [28]. Quinoa, originating from the South American highlands, has received much attention all over the world, also due to its unique nutritional profile and value, which make it suitable for specific food sectors [29]. It is recognized as a climate-resilient and drought-tolerant species [30,31]. Its ability to adapt to different drought levels through physiological and morphological strategies depends on the genotype. Among the different genotypes, Titicaca has been shown to have a reduced stomatal conductance, plant height and seed yield while having an increased root length and density when subjected to water shortage [32]. The ability of Titicaca to reduce the leaf water potential (Ψ) contributes to its drought tolerance, as it can dynamically adjust its water status, exhibiting daily fluctuations in leaf Ψ with higher values at night and lower values during the day. This adaptation promotes groundwater extraction and survival under water shortage conditions [33]. According to Nanduri et al. [34], the Titicaca genotype showed a high yield stability under different climate conditions. In a study by Issa Ali et al. [35], the Danish variety Titicaca and the South American variety L119 exhibited varying physiological and morphological responses to water shortage; both were shown to be sensitive to drought in terms of leaf water potential, leaf relative water content, stomatal conductance and closure, while they differed in their drought resistance strategies depending on the period of the plant’s cycle in which the water stress occurred. Quinoa presents diverse drought tolerance mechanisms, although not all are present in every genotype, emphasizing the need to screen the germplasm based on specific study objectives [36]. A number of studies have addressed the impact of water shortage during quinoa’s reproductive growth stages [37,38,39], while those referring to the vegetative growth stages are relatively limited, despite the high vulnerability of quinoa in this developmental phase, as reported by Geerts et al. [40].
The present study follows our previous research [41] on quinoa Titicaca grown on soil treated with different types of organic amendments, i.e., two biochars, one deriving from wood chips and the other from vineyard pruning, and a vermicompost, each applied alone or in combination at a 2% rate, and subjected to periods of water stress during the early vegetative growth stages. Among the tested amendments, the wood chip biochar resulted in enhanced plant growth. Therefore, the current experiment specifically focused on wood chip biochar with the aim of deeply investigating its effect by comparing different application rates under different water regimes throughout the vegetative development of quinoa Titicaca.

2. Materials and Methods

2.1. Experimental Design and Setup

A pot experimental trial was carried out in Potenza (PZ, 40°38′ N–15°48′ E, 819 m a.s.l.), southern Italy, at the greenhouse of the University of Basilicata, on quinoa plants (Chenopodium quinoa, Willd., cultivar Titicaca) grown under conditions of natural light and with a controlled temperature, which was set at 26/18 °C day/night.
The design of the experiment consisted of two factors: the biochar rate (B) and water regime (W). The biochar rates (w/w) were: 0% (B0, untreated soil or control), 2% (B2) and 4% (B4) of the dry soil weight (dw); the water regimes consisted of 100% (W100) and 50% (W50) restitution of evapotranspiration losses. Evapotranspiration was measured on a daily basis by weighing the pots at the same hour, and the intervention limit for watering was set at 50% depletion of the soil available water content, which was checked on the W100 treatments for each biochar rate. To evaluate the effect of each rate of biochar, each water regime and their combinations, a full-factorial experiment was set up. The six combinations (B0-W100, B0-W50, B2-W100, B2-W50, B4-W100 and B4-W50) were arranged according to a completely randomized block design and were replicated three times for a total of 18 experimental units.
For the trial, the soil was collected from the upper 0.30 m layer in an agricultural farm located in the Potenza district. Before the trial started, a soil physico-chemical characterization was carried by following the analytical official methods reported in the Italian Official Gazette n. 248 [42]. Accordingly, the soil resulted in a sandy-loam texture (USDA classification) with 66.1% sand, 11.5% silt and 22.4% clay; it had a field capacity (−0.03 MPa) of 22.8% dw and a wilting point (−1.5 MPa) of 11.4% dw; it had a pH of 7.6, an electrical conductivity (EC) of 0.6 dS m−1, an organic carbon content of 5.9 g Kg−1 and a total nitrogen content of 1.5‰.
The biochar was acquired from the Nera Biochar Company located in Settimo Vittone (Turin district, Italy), whose quality was verified and attested by the University of Turin (Italy). The company is specialized in the production of biochar from wood chips that come from the cleaning of green areas and woods and from wood processing waste, and the biochar is produced in an industrial pyrolysis plant of its own design. According to the chemical characterization carried out before the application of the biochar to the soil, by following the procedures previously described [43], the wood chip biochar was characterized by a pH of 8.9, an EC of 52 mS m−1, C, H and N contents of 68.3%, 4% and 1% dw, respectively, a Corg of 66.3% dw, a C/N value of 67.2, a H/Corg value of 0.7, and an O/Corg value of 0.4. Moreover, according to the European Biochar Certificate (EBC) [44] and the International Biochar Initiative (IBI) [45] standards that refer to the contents of C (>50%) and Corg (>60%) and the molar ratio values of H/Corg (≤0.7) and O/Corg (≤0.4), the biochar resulted as a “Class 1 biochar”.
Plastic pots (25 cm height, 18 cm width and 18 cm length), with the bottom covered by a layer of expanded clay to facilitate the water drainage, were filled with 7 kg of air-dried soil, untreated or previously mixed with the wood chip biochar, according to the experimental treatments. The soil humidity was brought to field capacity on 6 May 2022, and ten seeds of Titicaca cultivar were sown in each pot.
Once the emergence was completed, the plantlets were thinned in order to have one plant per pot, and the two water regimes were applied until the experiment ended. The plants were cut at the beginning of flowering on 24 June 2022, 48 days after sowing (DAS).

2.2. Phenology, Water Relations and Plant Development Measurement

A daily visit to the experimental site was performed to monitor the seedling emergence, leaf development (two-, six-, eight-, ten- and twelve-leaf stage), budding and flowering initiation stages, based on the BBCH scale [46]. The criterion used to establish each stage was that more than 50% of the plants entered the given stage.
A set of growth-related parameters were measured approximately twice a week throughout the experiment. In particular, the plant height (PH, cm), number of leaves (NL, n°) and branches (NB, n°) and stem diameter (SD, mm) were recorded. Furthermore, each leaf was recorded for its length (L) and width (W), which were further used to calculate the leaf area per plant (LA, cm2) using Equation (1), as presented by Talebnejad and Sepaskhah [47] and verified by Akram et al. [41] for the Titicaca cultivar:
LA = 0.64   ( L × W )
The leaf greenness or SPAD index was also measured on the youngest fully expanded leaves of each plant by taking three SPAD readings with a hand-held SPAD-502 m device (Konica-Minolta corporation, Ltd., Osaka, Japan).
At the end of experiment, before plant cutting, a set of water-related parameters were measured. Specifically, the leaf relative water content (RWC, %) was determined by taking a small segment of the youngest fully expanded leaf per plant, immediately storing it in an ice bucket until taking its fresh weight (FW, g). After keeping the leaf segment in distilled water at 4 °C for 24 h, its turgid weight (TW, g) was determined, and, after drying it in a ventilated oven at 70 °C until reaching steady weight, the dry weight (DW, g) was measured. The RWC of the leaves was then calculated by Equation (2):
RWC = FW DW TW DW × 100
In addition, the turgid weight to dry weight ratio (TW:DW) was calculated. The total leaf water potential (Ψ, MPa) was measured at mid-day on the youngest fully expanded leaf per plant by using a Scholander pressure chamber (PMS model1000, Corvallis, OR, USA). After plant cutting, the fresh weights (g) of the stem (SFW), leaves (LFW), panicle (PFW) and sub-panicles (SPFW) were measured, in addition to the above-mentioned growth-related parameters and SPAD index. The yield-contributing traits, i.e., the main panicle length (cm) and the number of sub-panicles (n°) per plant, were also recorded. Finally, the water use efficiency (WUE, g L−1) was calculated by the ratio of the total plant fresh weight (TFW, g) to the total water consumption over the plant growing cycle (TWC, L).

2.3. Statistical Analysis

All the experimental data were first checked for normality and homogeneity of variance and then processed by two-way analysis of variance (ANOVA), following a factorial completely randomized design. When significant differences among the means were detected, the latter were compared by Tukey’s honest significant difference post hoc test at the 0.05% level of significance. All the statistical analyses were carried out by using the “Statistix 8.1” software.

3. Results

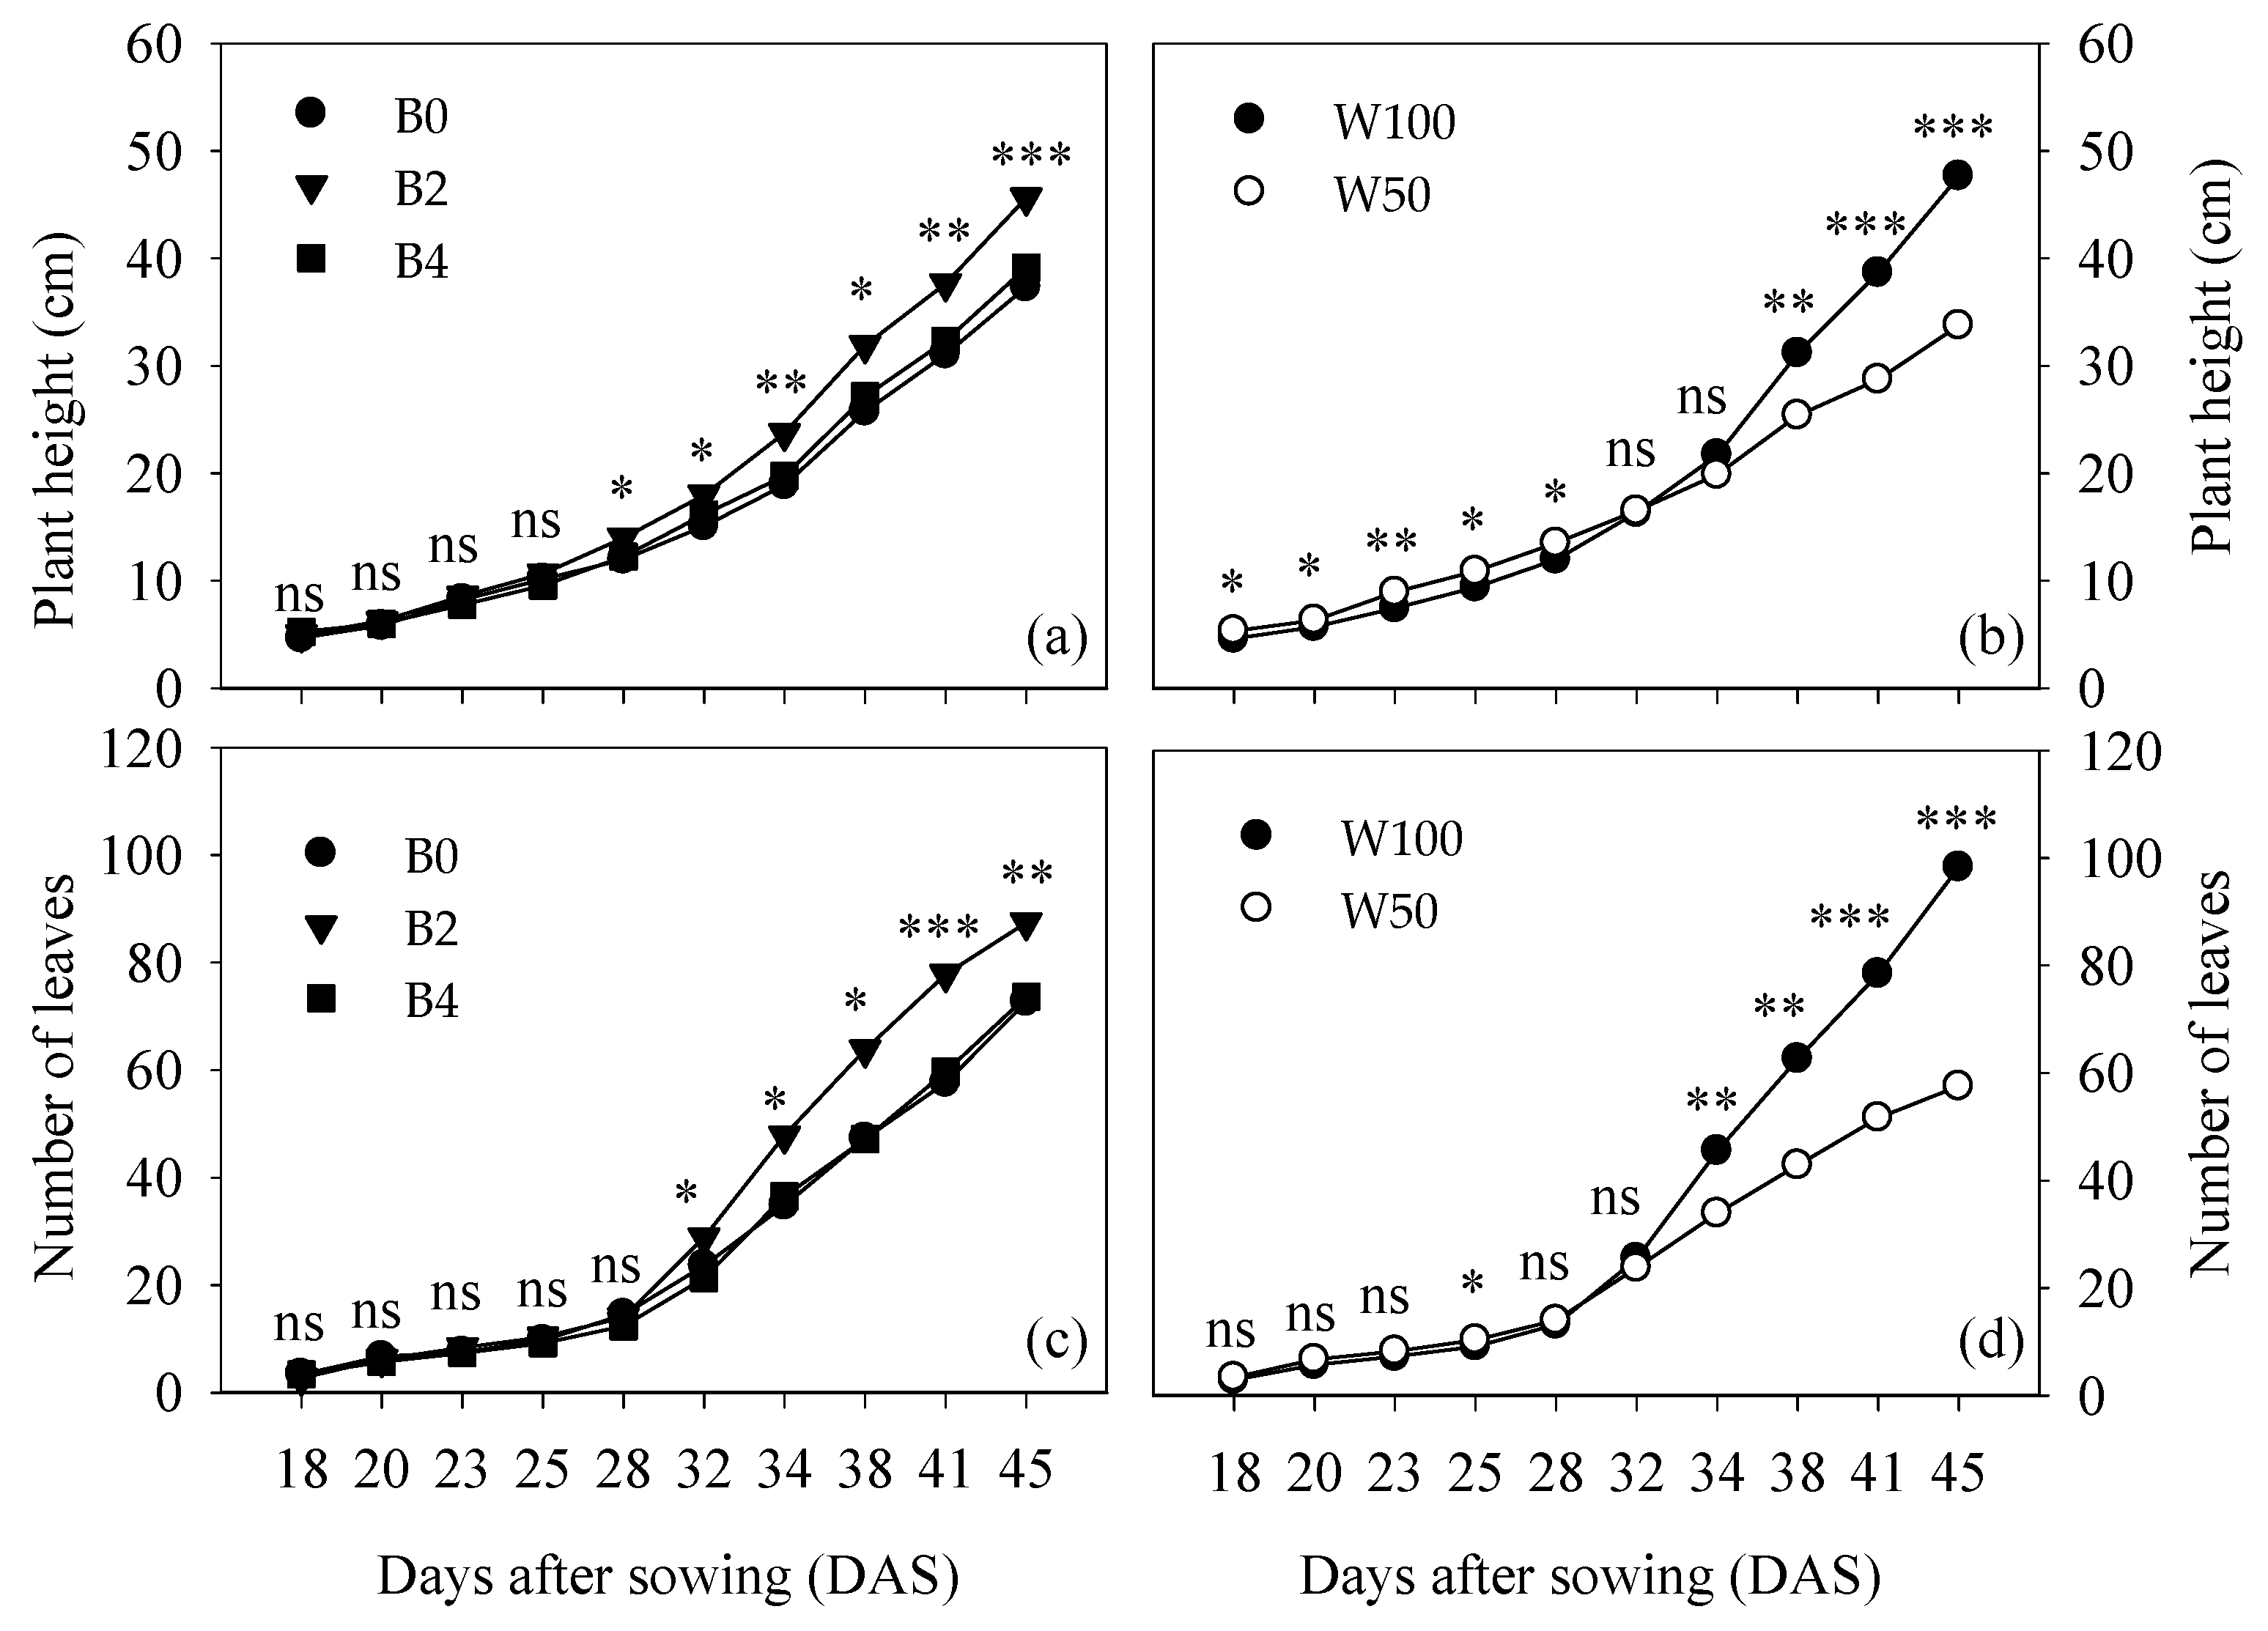
3.1. Plant Phenology and Development

Considering the phenological stages monitored during the experiment (data not reported), except for the seedling emergence and two-leaf development, the biochar rate (B) significantly affected the timing of the other stages. More specifically, in the plants treated with the lower biochar rate (B2), the leaf development (from the six- to twelve-leaf stages) and bud and flowering initiation occurred earlier in comparison to those with the higher rate (B4). The most evident differences concerned the flowering initiation that was reached 2.5 DAS ahead by the B2-treated plants in comparison to the B4-treated ones.
A significant effect was also displayed by the water regime (W). Particularly, in the case of 50% evapotranspiration losses restitution (W50), the leaf development stage (from the six- to ten-leaf stages) was reached earlier than in the case of 100% restitution (W100); on the contrary, the starting day of flowering initiation was delayed by 2 DAS in the W50-treated plants compared to the W100-treated plants.
Likewise, the biochar × water regime interaction (B × W) had a significant influence, with the B4-W100 treatment showing the highest number of days to reach the leaf development (from the six- to twelve-leaf stages) and bud initiation stages compared to the other treatments. In particular, the largest delay, equal to about 3 DAS, was registered on the twelve-leaf development stage. However, the B4-W100 treatment took a lower number of days, i.e., about 4 DAS fewer, to reach the flowering initiation stage than the B4-W50 treatment, without any difference compared to the other treatments. Considering the plant development throughout the experiment, in terms of the plant height and number of leaves, both B and W showed significant effects (Figure 1); on the contrary, their interaction never affected these two growth parameters.
Specifically, a significant effect of B on the plant height (PH) (Figure 1a) was observed starting from 28 until 45 DAS when the B2-treated plants were clearly differentiated from the B0- and B4-treated ones, where they always showed a higher PH value. Instead, W affected the PH earlier (Figure 1b). Indeed, from 18 to 28 DAS, the W50-treated plants always showed a higher PH value than W100-treated ones. In particular, a 20% PH increase was observed at 23 DAS. This PH response to the water regimes reversed in the final part of growing cycle, with 23, 35 and 41% higher PH values obtained for the W100-treated plants compared to the W50-treated plants at 38, 41 and 45 DAS, respectively.
As for the number of leaves (NL), a significant effect of B was observed in the second half of the growing cycle. From 32 DAS, the B2-treated plants started to show a higher NL value than the B0- and B4-treated ones, maintaining this growth advantage until the end of the experiment. Moreover, from 34 to 45 DAS, the NL was also significantly influenced by W (Figure 1d), always showing a higher value with the W100-treated plants than the W50-treated plants. In particular, at 45 DAS, the NL value observed for the W100-treated plants accounted for a 71% increase compared to the W50-treated ones.
As reported in Table 1, the leaf area (LA) was significantly affected by both the two factors, B and W, and their interaction. In particular, at 28 and 32 DAS, the B2-treated plants displayed the highest LA values. Successively, at 38 and 45 DAS, the B2-treated plants did not statistically differ from the B4-treated ones, both resulting in higher LA values than the B0-treated plants. Specifically, in terms of the average of the B2- and B4-treated plants, the higher LA values observed at 38 and 45 DAS accounted for 54 and 35% increases, respectively. On the other hand, by considering the two water regimes, the W100-treated plants always showed higher LA values than the W50-treated ones, accounting for the highest increase, equal to 113%, at 45 DAS. Relative to the effect of B × W, LA reached the highest value with the B2-W100 treatment at 28 DAS, a higher value with the B2-W100 treatment (not statistically different from B0-W100) compared to the B4-W100 treatment at 32 DAS and a value not statistically different between the B2-W100 and B4-W100 treatments at 38 DAS. Finally, at 45 DAS, any statistically significant differences among the considered treatments disappeared, and the LA values were similar in all treatments.
With regards to the SPAD index (Table 1), only starting from 32 DAS until 45 DAS, its values were significantly affected by both B and W, but not by their interaction. More specifically, the SPAD index always resulted in higher values with the B2-treated plants compared to the B4-treated plants, accounting for a 5% increase on average over the DAS, as well as with the W100-treated plants compared to the W50-treated ones, with the highest increase, equal to 12%, obtained at 45 DAS.
Concerning the stem diameter (SD) (Table 2), significant effects of both W and B × W interaction were observed at 32 DAS. The SD showed a 24% higher value with the W100-treated plants compared to the W50-treated plants, as well as with the B0-W100 treatment compared to the B0-W50 and B4-W50 treatments, accounting for 45 and 40% increases, respectively, without any statistically significant difference from the B2-W100, B2-W50 and B4-W100 treatments. Successively, at 38 DAS, the SD was significantly influenced by the two factors B and W, displaying 18 and 39% higher values with the B2-treated plants compared to the B4-treated plants and with the W100-treated plants compared to the W50-treated ones, respectively. Finally, at 45 DAS, not only B and W but also their interaction affected the SD. The B2-treated plants showed 5 and 12% higher values than the B0- and B4-treated ones, respectively, and the W100-treated plants accounted for a 33% higher SD than the W50-treated ones. The highest SD value was recorded with the B2-W100 treatment, while the lowest one was recorded with the B4-W50 treatment, which showed a 36% decrease by comparison.
The number of branches (NB) was influenced by only W at 32 DAS (Table 2), showing a higher value with the W100-treated compared to the W50-treated plants. Successively, at 38 and 45 DAS, a significant effect was displayed by both the two factors B and W but not by their interaction. The SD was higher with the B2-treated plants than with the B0- and B4-treated plants, as well as with the W100-treated plants compared to the W50-treated ones.

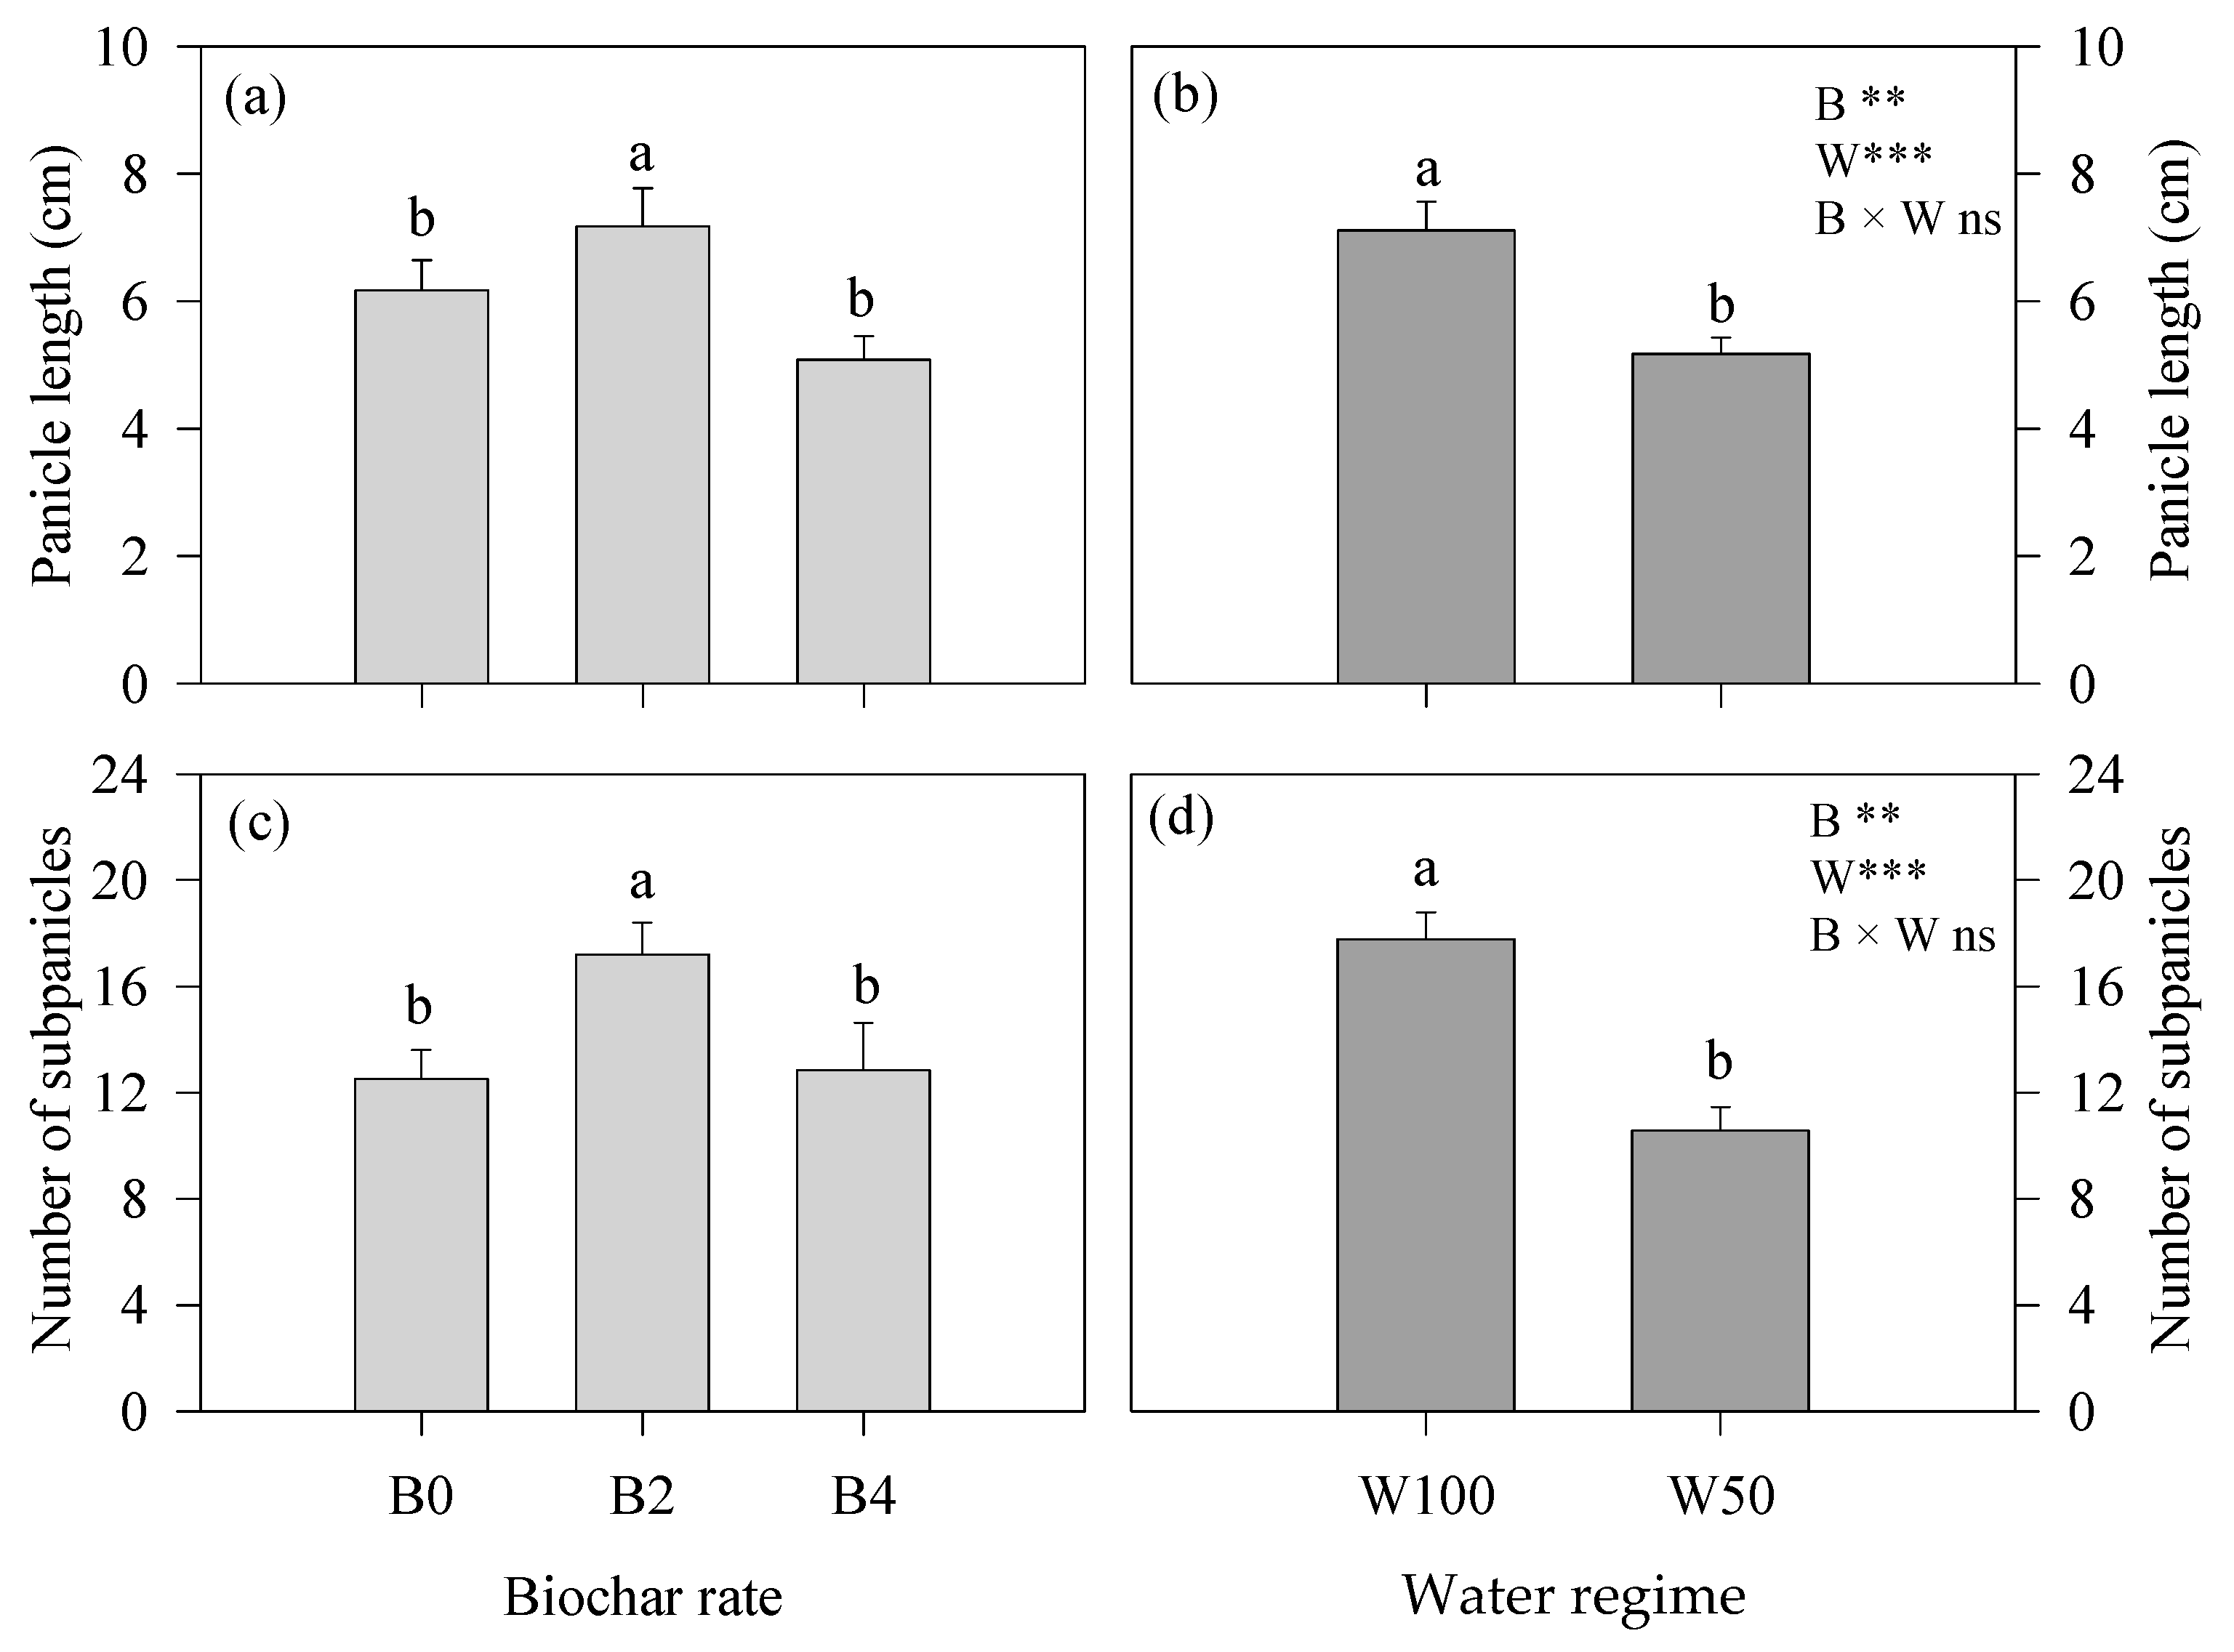
3.2. Water- and Growth-Related Parameters and Yield-Contributing Traits at the End of the Experiment

At the end of the experiment, the considered plant water-related parameters, i.e., the leaf relative water content (RWC), turgid-weight-to-dry-weight ratio (TW:DW) and total leaf water potential (Ψ), were significantly influenced by both the two factors B and W (Table 3). In addition, the RWC was also affected by the interaction B × W.
As for the RWC, about a 10% higher value was shown by the B4-treated plants compared to the B0- and B2-treated ones, which did not differ from each other. Similarly, the W100-treated plants accounted for a 14% higher RWC than the W50-treated ones. Moreover, higher values were observed with all the W100 treatments (B0-W100, B2-W100 and B4-W100) compared to the corresponding W50 ones (B0-W50, B2-W50 and B4-W50).
A different response to the considered experimental factors was displayed by TW:DW, which accounted for a significant 9% lower value with the B2-treated plants compared to the B0-treated plants (both not statistically different from the B4-treated plants) and a 15% lower value with the W50-treated plants compared to the W100-treated ones.
Finally, regarding the Ψ value, the B4-treated plants showed a 18% less negative value in comparison to the B0- and B2-treated plants, which were not statistically different from each other. A less negative Ψ value of about 25% was similarly observed with the W100-treated plants than W50-treated ones.
Also, the growth-related parameters and SPAD index measured at the end of the growing cycle (Table 4) were affected by the two factors B and W. Only SD and LA were also influenced by the interaction B × W.
Specifically, higher PH, SD, NB, NL, LA and SPAD index values were always registered with the B2-treated plants compared to the B0- and B4-treated plants and with the W100-treated plants compared to the W50-treated ones. Moreover, the SD was higher with all the W100 treatments (B0-W100, B2-W100 and B4-W100; on average, 7.3 mm) than with the corresponding W50 ones (B0-W50, B2-W50 and B4-W50; on average 5.6 mm), accounting for a 30% increase. Similarly, the LA reached higher values with the W100 treatment than with the W50 treatment, with the highest value (1102 cm2 plant−1) showed by B2-W100, which accounted for a 25% increase compared to B0-W100 and B4-W100.
A significant effect of both the two experimental factors B and W was also observed when considering the fresh weights of the individual plant parts, such as stem, leaves, panicle and subpanicles, as well as the total plant weight (Table 5). More specifically, the B2-treated plants as well as the W100-treated ones always showed the highest fresh weights. With the B2-treated plants, the panicle FW showed the maximum increase, which was equal to 30% compared to the B0- and B4-treated plants. With the W100-treated plants, the maximum increase was observed with the stem FW, which was 172% higher than the W50-treated ones, followed by the panicle FW that accounted for an increase of 168%. In addition, both the leaf and the total FW were also affected by the interaction B × W, showing the highest value with the B2-W100 treatment (27.3 and 46.8 g plant−1, respectively) and the lowest with the B0-W50 treatment (8.7 and 14.6 g plant−1, respectively). Also, the WUE was affected by the two factors B and W, as well as by their interaction, by showing 23 and 59% higher values with the B2-treated plants compared to the B4-treated plants and with the W100-treated plants compared to the W50-treated ones, respectively. Moreover, all the W100 treatments (B0-W100, B2-W100 and B4-W100) always showed higher WUE values than the corresponding W50 ones (B0-W50, B2-W50 and B4-W50). In particular, with the B0-W100 and B2-W100 treatments (not differing from each other), a 24% increase in WUE compared to the B4 W100 treatment was observed.
Finally, by considering the yield-contributing traits (Figure 2) detected on the plants at the end of the vegetative growing cycle, both the two factors B and W displayed a significant influence, while their interaction was not significant. Indeed, higher values of both the panicle length and number of subpanicles (Figure 2a and 2c, respectively), were observed with the B2-treated plants compared to the B0- and B4-treated plants (not different from each other), accounting for 27 and 36% increases, respectively. Similarly, 38 and 68% higher panicle length and number of subpanicles, respectively, were displayed by the W100-treated plants compared to the W50-treated plants (Figure 2b and 2d, respectively).

4. Discussion

The impact of soil amended with biochar on plant growth and productive performance under water shortage is well documented for several crops [26,48]. The current study builds upon the valuable insights from our previous research [41] that prompted us to further explore the effects of soil amended with different wood chip biochar rates on the vegetative development of quinoa (cultivar Titicaca) grown under water-limiting conditions throughout the vegetative growing cycle. Previous results have consistently demonstrated that, among different organic amendments applied at a 2% rate, wood chip biochar alone and mixed with vermicompost showed a significant effect on quinoa plant growth during the water stress period that plants faced at the early growing stages, which also allowed a quicker recovery once the drought conditions ended. The leaf area was enhanced by up to 20% and biomass production was enhanced by 19% compared to untreated controls. This led us to state that the use of an organic amendment could play a pivotal role in enabling Chenopodium quinoa (cv Titicaca) to better deal with the negative consequences of an early period of severe water stress on plant development.
In the current experiment, Titicaca plants were grown on soil either not amended or amended with 2 or 4% treatments of wood chip biochar and were either well watered or subjected to water shortage by 100% or 50% restitution of evapotranspiration losses, respectively. Referring to the plant phenology, all the considered stages, except for the emergence and the two-leaf stages, were significantly influenced by both the biochar rate and water regime. In particular, the flowering initiation was delayed, although by a few days, in the plants grown with 4% biochar and 50% evapotranspiration restitution. This might be due to the high phenological plasticity already reported for different genotypes of quinoa [49]. Maestro-Gaitán et al. [50] highlighted the genotype effect associated with water limitations in this crop. The delayed flowering used as a drought-adaptive mechanism, as already observed in the F15 [50] and Santa Maria [51] genotypes that showed an increased time to anthesis and physiological maturity under severe water deficiency [51], might also occur in Titicaca. The delayed flowering phenomena was also reported in maize [52] and rice [53] when water limitations were applied during the vegetative growing cycle.
Overall, our study highlighted that the application of 2% wood chip biochar, compared to the untreated control and 4% rate, was shown to be a better option in order to enhance quinoa growth in terms of plant height, leaf and branch numbers, stem diameter, leaf area and total biomass. These findings were consistent with previous studies indicating increased biomass production with similar biochar applications in quinoa [27,41]. It is important to note that biochar’s impact can vary, with some cases showing non-significant or negative outcomes [54,55,56,57]. Therefore, careful consideration of biochar application rates is crucial for achieving the desired impact [58]. Similarly, Gale and Thomas [59] reported that the growth and ecophysiological responses of plants to biochar are highly dose-dependent and are mainly driven by nutrient availability, particularly N. In the present study, the 4% rate did not show any positive impact on plant growth, which was in agreement with other studies that have reported detrimental effects at higher biochar doses up to 4% due to reduced nutrient availability [54,60,61], increased negative charges leading to intensified electrostatic interactions with cations [62] on the soil surface and altered soil pH [63,64]. A reduction in N availability likely occurred in the present experiment, as shown by the lower SPAD value under the 4% biochar rate, while an increased SPAD value was found under the 2% rate, as also reported by Hafez et al. [65] in barley. This increase could be attributed to the large specific surface area of biochar, facilitating enhanced adhesion and cohesion with water, increased soil acidity, improved nutrient availability in the root development zone and a subsequent heightened production of photosynthetic pigments [65]. Rees et al. [64] reported a sharp decrease in nutrient availability at a high rate of woody biochar, which hindered plant growth. Moreover, the biochar liming effect may be beneficial at low rates, while at high rates, over-liming could reduce the availability of nutrients such as P, Mg and Fe [59]. Woody biochar at a low dose can retain and gradually release ions, specifically Ca2+, Mg2+ and K+, while at high doses, it may “lock-up” ions, making them unavailable [17].
Considering the water regimes, a drastic reduction in growth-related parameters was observed under the 50% evapotranspiration losses restitution treatment throughout the vegetative growing cycle, in agreement with previous findings [66,67,68]. Moreover, under the water deficit conditions, a lowering of the leaf water potential (Ψ) and relative water content (RWC) were observed, as already reported by Jensen et al. [30] and Issa Ali et al. [35] on several quinoa genotypes, including Titicaca, under water stress.
The impact of the biochar rate and water regime on the response of quinoa Titicaca is further exemplified by the significant differences in the yield-contributing traits, such as the panicle length and sub-panicle number that, again, were higher following the 2% biochar rate application, outperforming both the non-treated soil and the 4% rate. These results were consistent with earlier research that demonstrated substantial biomass increases and enhanced grain yields with 2% co-composted woody biochar application [27]. Using biochar boosted the soil nutrient availability, increasing the panicle length and grain yield in rapeseed [18]; however, a large biochar application significantly increased the soil pH and electrical conductivity, inhibiting the nutrient uptake [17] and crop growth [69]. Under deficit irrigation, a notable yield decrease has been observed by several authors [32,50] for quinoa Titicaca. Telahigue et al. [70] showed that re-establishing evapotranspiration by 60% and 30% significantly reduced the quinoa yield up to 27% and 74%, respectively. The inability to reach the full potential yield was attributed to sink limitations [71].
Contrary to the growth response, the plant water status of Titicaca was enhanced by the 4% biochar rate, as shown by the higher Ψ and RWC values, although a lower TW:DW value observed with the 2% treatment, suggesting a better adaptation to water shortage conditions. Considering the growth habits defined by Rojas and Pinto for quinoa [72], Titicaca falls within habit 4, which presents more leaves and a larger leaf area, leading to a higher susceptibility to water losses due to the higher total leaf surface and higher sensitivity to water-limiting conditions. Therefore, the reduction in Ψ and RWC of the 2%-treated plants could be attributed to Titicaca’s rapid growth and high leaf expansion rate [73], as also reported by Maestro-Gaitán et al. [50]. Regardless of the biochar rate, under the 50% restitution of evapotranspiration losses, the Ψ value decreased, reaching a value of −3.2 MPa compared to the 100% restitution conditions (−2.6 MPa), as previously reported by other authors for Titicaca [32,35].
In addition, the water use efficiency always exhibited higher values when the plants were fully irrigated, with the B2-treated plants displaying the highest WUE (8.7 g L−1) and the B4-treated plants displaying the lowest one (6.9 g L−1). Under the water shortage conditions, the rate of biochar did not have any effect on the WUE, with no differences being observed among the treatments. Similar results were found by Kammann et al. [27], who reported an increase in water use efficiency only with a low biochar rate. Biochar characterized by a higher carbon content or derived from carbon-rich materials, such as wood, may have limited potential in enhancing the WUE when applied in excess, and in some instances, it may even yield negative effects [74,75].

5. Conclusions

The present study investigated the effect of soil amendment with wood chip biochar at different rates on the vegetative development of quinoa cultivar Titicaca subjected to different water regimes. Within the context of the adopted experimental conditions, the findings, on the one hand, showed that the soil application with 2% wood chip biochar was the optimal choice for promoting the healthy growth of quinoa Titicaca; on the other hand, it evidenced the sensitivity of the tested cultivar to water limitation.
These outcomes suggest that further research could involve different quinoa cultivars in order to investigate the genotype-specific response to both the biochar type and rate under drought stress conditions. Such in-depth studies will help to advance our understanding about the relationship between biochar, water availability and the growth of quinoa with the perspective of the sustainable cultivation of the species.

Author Contributions

Conceptualization, A.R.R., M.Z.A. and A.L.; methodology, A.R.R., M.Z.A. and A.L.; software, A.R.R., M.Z.A. and A.L.; validation, A.R.R. and A.L.; formal analysis, A.R.R. and M.Z.A.; investigation, A.R.R., M.Z.A. and A.L.; resources, A.R.R. and A.L.; data curation, A.R.R., M.Z.A. and A.L.; writing—original draft preparation, A.R.R., M.Z.A. and A.L.; writing—review and editing, A.R.R. and A.L.; visualization, A.R.R. and A.L.; supervision, A.R.R. and A.L.; project administration, A.R.R. and A.L.; funding acquisition, A.R.R. and A.L. All authors have read and agreed to the published version of the manuscript.

Funding

This research received no external funding.

Data Availability Statement

The data presented in this study are available upon request from the corresponding authors.

Acknowledgments

We would like to thank Simone Orlandini and Leonardo Verdi for providing seeds of quinoa for the current experiment. The authors are grateful to Giuseppe Mercurio for his technical assistance in the greenhouse experiment and the laboratory analyses.

Conflicts of Interest

The authors declare no conflict of interest.

References

  1. Masson-Delmotte, V. Global Warming of 1.5 °C: An IPCC Special Report on Impacts of Global Warming of 1.5 °C above Pre-industrial Levels and Related Global Greenhouse Gas Emission Pathways, in the Contex of Strengthening the Global Response to the Thereat of Blimate Change, Sustainable Development, and Efforts to Eradicate Poverty. 2018. Available online: https://www.ipcc.ch/sr15/ (accessed on 1 October 2023).
  2. Heydari, M.; Hajinia, S.; Jafarian, N.; Karamian, M.; Mosa, Z.; Asgharzadeh, S.; Rezaei, N.; Guidi, L.; Valkó, O.; Prévosto, B. Synergistic use of biochar and the plant growth-promoting rhizobacteria in mitigating drought stress on oak (Quercus Brantii Lindl.) seedlings. For. Ecol. Manag. 2023, 531, 120793. [Google Scholar] [CrossRef]
  3. Hamidzadeh, Z.; Ghorbannezhad, P.; Ketabchi, M.R.; Yeganeh, B. Biomass-derived biochar and its application in agriculture. Fuel 2023, 341, 127701. [Google Scholar] [CrossRef]
  4. Ajayi, A.; Holthusen, D.; Horn, R. Changes in microstructural behaviour and hydraulic functions of biochar amended soils. Soil Tillage Res. 2016, 155, 166–175. [Google Scholar] [CrossRef]
  5. Kapoor, A.; Sharma, R.; Kumar, A.; Sepehya, S. Biochar as a means to improve soil fertility and crop productivity: A review. J. Plant Nutr. 2022, 45, 2380–2388. [Google Scholar] [CrossRef]
  6. Verheijen, F.G.; Montanarella, L.; Bastos, A.C. Sustainability, certification, and regulation of biochar. Pesqui. Agropecuária Bras. 2012, 47, 649–653. [Google Scholar] [CrossRef]
  7. Laird, D.A.; Fleming, P.; Davis, D.D.; Horton, R.; Wang, B.; Karlen, D.L. Impact of biochar amendments on the quality of a typical Midwestern agricultural soil. Geoderma 2010, 158, 443–449. [Google Scholar] [CrossRef]
  8. Libutti, A.; Cammerino, A.R.B.; Francavilla, M.; Monteleone, M. Soil amendment with biochar affects water drainage and nutrient losses by leaching: Experimental evidence under field-grown conditions. Agronomy 2019, 9, 758. [Google Scholar] [CrossRef]
  9. Libutti, A.; Francavilla, M.; Monteleone, M. Hydrological properties of a clay loam soil as affected by biochar application in a pot experiment. Agronomy 2021, 11, 489. [Google Scholar] [CrossRef]
  10. Ding, X.; Li, G.; Zhao, X.; Lin, Q.; Wang, X. Biochar application significantly increases soil organic carbon under conservation tillage: An 11-year field experiment. Biochar 2023, 5, 28. [Google Scholar] [CrossRef]
  11. Aborisade, M.A.; Geng, H.; Oba, B.T.; Kumar, A.; Ndudi, E.A.; Battamo, A.Y.; Liu, J.; Chen, D.; Okimiji, O.P.; Ojekunle, O.Z.; et al. Remediation of soil polluted with Pb and Cd and alleviation of oxidative stress in Brassica rapa plant using nanoscale zerovalent iron supported with coconut-husk biochar. J. Plant Physiol. 2023, 287, 154023. [Google Scholar] [CrossRef]
  12. Anand, A.; Kumar, V.; Kaushal, P. Biochar and its twin benefits: Crop residue management and climate change mitigation in India. Renew. Sustain. Energy Rev. 2022, 156, 111959. [Google Scholar] [CrossRef]
  13. Manikandan, S.; Vickram, S.; Subbaiya, R.; Karmegam, N.; Chang, S.W.; Ravindran, B.; Awasthi, M.K. Comprehensive review on recent production trends and applications of biochar for greener environment. Bioresour. Technol. 2023, 388, 129725. [Google Scholar] [CrossRef] [PubMed]
  14. EL Moussaoui, H.; Ainlhout, L.F.Z.; Bouqbis, L. Effect of biochar, biocompost and manure on the growth and productivity of alfalfa (Medicago sativa L.): Field and pots study. Int. J. Recycl. Org. Waste Agric. 2023, 12, 425–440. [Google Scholar] [CrossRef]
  15. Lebrun, M.; Miard, F.; Drouet, S.; Tungmunnithum, D.; Morabito, D.; Hano, C.; Bourgerie, S. Physiological and molecular responses of flax (Linum usitatissimum L.) cultivars under a multicontaminated technosol amended with biochar. Environ. Sci. Pollut. Res. 2021, 28, 53728–53745. [Google Scholar] [CrossRef] [PubMed]
  16. Xiang, L.; Liu, S.; Ye, S.; Yang, H.; Song, B.; Qin, F.; Shen, M.; Tan, C.; Zeng, G.; Tan, X. Potential hazards of biochar: The negative environmental impacts of biochar applications. J. Hazard. Mater. 2021, 420, 126611. [Google Scholar] [CrossRef] [PubMed]
  17. Gale, N.V.; Halim, M.A.; Horsburgh, M.; Thomas, S.C. Comparative responses of early-successional plants to charcoal soil amendments. Ecosphere 2017, 8, e01933. [Google Scholar] [CrossRef]
  18. Khan, Z.; Khan, M.N.; Zhang, K.; Luo, T.; Zhu, K.; Hu, L. The application of biochar alleviated the adverse effects of drought on the growth, physiology, yield and quality of rapeseed through regulation of soil status and nutrients availability. Ind. Crops Prod. 2021, 171, 113878. [Google Scholar] [CrossRef]
  19. Lai, W.Y.; Lai, C.M.; Ke, G.R.; Chung, R.S.; Chen, C.T.; Cheng, C.H.; Pai, C.W.; Chen, S.Y.; Chen, C.C. The effects of woodchip biochar application on crop yield, carbon sequestration and greenhouse gas emissions from soils planted with rice or leaf beet. J. Taiwan Inst. Chem. Eng. 2013, 44, 1039–1044. [Google Scholar] [CrossRef]
  20. Laird, D.; Novak, J.; Collins, H.; Ippolito, J.; Karlen, D.; Lentz, R.; Sistani, K.; Spokas, K.; Van Pelt, R. Multi-year and multi-location soil quality and crop biomass yield responses to hardwood fast pyrolysis biochar. Geoderma 2017, 289, 46–53. [Google Scholar] [CrossRef]
  21. Gholizadeh, M.; Hu, X.; Liu, Q. A mini review of the specialties of the bio-oils produced from pyrolysis of 20 different biomasses. Renew. Sustain. Energy Rev. 2019, 114, 109313. [Google Scholar] [CrossRef]
  22. Leng, L.; Xiong, Q.; Yang, L.; Li, H.; Zhou, Y.; Zhang, W.; Jiang, S.; Li, H.; Huang, H. An overview on engineering the surface area and porosity of biochar. Sci. Total Environ. 2021, 763, 144204. [Google Scholar] [CrossRef] [PubMed]
  23. Li, Q.; Zhang, X.; Mao, M.; Wang, X.; Shang, J. Carbon content determines the aggregation of biochar colloids from various feedstocks. Sci. Total Environ. 2023, 880, 163313. [Google Scholar] [CrossRef] [PubMed]
  24. Greco, G.; González, B.; Manyà, J.J. Operating conditions affecting char yield and its potential stability during slow pyrolysis of biomass: A review. Adv. Carbon Mater. Biomass Overv. Zenodo 2019, 9–19. [Google Scholar] [CrossRef]
  25. Mao, J.; Zhang, K.; Chen, B. Linking hydrophobicity of biochar to the water repellency and water holding capacity of biochar-amended soil. Environ. Pollut. 2019, 253, 779–789. [Google Scholar] [CrossRef] [PubMed]
  26. Romdhane, L.; Awad, Y.M.; Radhouane, L.; Dal Cortivo, C.; Barion, G.; Panozzo, A.; Vamerali, T. Wood biochar produces different rates of root growth and transpiration in two maize hybrids (Zea mays L.) under drought stress. Arch. Agron. Soil Sci. 2019, 65, 846–866. [Google Scholar] [CrossRef]
  27. Kammann, C.I.; Schmidt, H.-P.; Messerschmidt, N.; Linsel, S.; Steffens, D.; Müller, C.; Koyro, H.-W.; Conte, P.; Joseph, S. Plant growth improvement mediated by nitrate capture in co-composted biochar. Sci. Rep. 2015, 5, 11080. [Google Scholar] [CrossRef] [PubMed]
  28. Akram, Z.; Maqsood Ahmed Basra, S.; Bilal Hafeez, M.; Khan, S.; Nazeer, S.; Iqbal, S.; Sohail Saddiq, M.; Zahra, N. Adaptability and yield potential of new quinoa lines under agro-ecological conditions of Faisalabad-Pakistan. Asian J. Agric. Biol. 2021, 2, 1–8. [Google Scholar] [CrossRef]
  29. Angeli, V.; Miguel Silva, P.; Crispim Massuela, D.; Khan, M.W.; Hamar, A.; Khajehei, F.; Graeff-Hönninger, S.; Piatti, C. Quinoa (Chenopodium quinoa Willd.): An overview of the potentials of the “golden grain” and socio-economic and environmental aspects of its cultivation and marketization. Foods 2020, 9, 216. [Google Scholar] [CrossRef]
  30. Jensen, C.; Jacobsen, S.-E.; Andersen, M.; Nunez, N.; Andersen, S.; Rasmussen, L.; Mogensen, V. Leaf gas exchange and water relation characteristics of field quinoa (Chenopodium quinoa Willd.) during soil drying. Eur. J. Agron. 2000, 13, 11–25. [Google Scholar] [CrossRef]
  31. Kumari, M.; Zinta, G.; Chauhan, R.; Kumar, A.; Singh, S.; Singh, S. Genetic resources and breeding approaches for improvement of amaranth (Amaranthus spp.) and quinoa (Chenopodium quinoa). Front. Nutr. 2023, 10, 1129723. [Google Scholar]
  32. Razzaghi, F.; Bahadori-Ghasroldashti, M.R.; Henriksen, S.; Sepaskhah, A.R.; Jacobsen, S.E. Physiological characteristics and irrigation water productivity of quinoa (Chenopodium quinoa Willd.) in response to deficit irrigation imposed at different growing stages—A field study from Southern Iran. J. Agron. Crop Sci. 2020, 206, 390–404. [Google Scholar] [CrossRef]
  33. Fghire, R.; Anaya, F.; Issa, O.A.; Wahbi, S. Physiological and growth response traits to water deficit as indicators of tolerance criteria between quinoa genotypes. J. Mater. Environ. Sci. 2017, 8, 2084–2093. [Google Scholar]
  34. Nanduri, K.R.; Hirich, A.; Salehi, M.; Saadat, S.; Jacobsen, S.E. Quinoa: A new crop for harsh environments. Sabkha Ecosyst. Vol. VI Asia/Pac. 2019, 49, 301–333. [Google Scholar]
  35. Issa Ali, O.; Fghire, R.; Anaya, F.; Benlhabib, O.; Wahbi, S. Physiological and Morphological Responses of two Quinoa Cultivars (Chenopodium quinoa Willd.) to Drought Stress. Gesunde Pflanz. 2019, 71, 123–133. [Google Scholar] [CrossRef]
  36. Hafeez, M.B.; Iqbal, S.; Li, Y.; Saddiq, M.S.; Basra, S.M.; Zhang, H.; Zahra, N.; Akram, M.Z.; Bertero, D.; Curti, R.N. Assessment of phenotypic diversity in the USDA collection of quinoa links genotypic adaptation to germplasm origin. Plants 2022, 11, 738. [Google Scholar] [CrossRef]
  37. Kammann, C.I.; Linsel, S.; Gößling, J.W.; Koyro, H.-W. Influence of biochar on drought tolerance of Chenopodium quinoa Willd and on soil–plant relations. Plant Soil 2011, 345, 195–210. [Google Scholar] [CrossRef]
  38. Ramzani, P.M.A.; Shan, L.; Anjum, S.; Ronggui, H.; Iqbal, M.; Virk, Z.A.; Kausar, S. Improved quinoa growth, physiological response, and seed nutritional quality in three soils having different stresses by the application of acidified biochar and compost. Plant Physiol. Biochem. 2017, 116, 127–138. [Google Scholar] [CrossRef]
  39. Walters, H.; Carpenter-Boggs, L.; Desta, K.; Yan, L.; Matanguihan, J.; Murphy, K. Effect of irrigation, intercrop, and cultivar on agronomic and nutritional characteristics of quinoa. Agroecol. Sustain. Food Syst. 2016, 40, 783–803. [Google Scholar] [CrossRef]
  40. Geerts, S.; Mamani, R.S.; Garcia, M.; Raes, D. Response of quinoa (Chenopodium quinoa Willd.) to differential drought stress in the Bolivian Altiplano: Towards a deficit irrigation strategy within a water scarce region. In Proceedings of the 1st International Symposium on Land and Water Management for Sustainable Irrigated Agriculture, Adana, Turkey, 4–8 April 2006; pp. 4–8. [Google Scholar]
  41. Akram, M.Z.; Libutti, A.; Rivelli, A.R. Evaluation of Vegetative Development of Quinoa under Water Stress by Applying Different Organic Amendments. Agronomy 2023, 13, 1412. [Google Scholar] [CrossRef]
  42. Italian Official Gazette. Ministerial Decree 248 (1999): Approval of “Official Methods of Chemical Soil Analysis”. Ordinary Supplement 185 to the Official Journal of the Italian Republic 248, 21 October 1999, Italy. Available online: www.gazzettaufficiale.it/eli/gu/1999/10/21/248/so/185/sg/pdf (accessed on 29 September 2023).
  43. Rivelli, A.R.; Libutti, A. Effect of biochar and inorganic or organic fertilizer co-application on soil properties, plant growth and nutrient content in Swiss chard. Agronomy 2022, 12, 2089. [Google Scholar] [CrossRef]
  44. European Biochar Certificat. Comparison of European Biochar Certificate Version 4. 8 and IBI Biochar Standards Version 2.0 European Biochar Certificate First Publication March 2012b. IBI Biochar Stand First Publ May. 2012. Available online: www.european-biochar.org/en/home (accessed on 15 September 2023).
  45. International Biochar Initiative. Standardized Product Definition and Product Testing Guidelines for Biochar That Is Used in Soil, Version 2.1; IBI Biochar Standards; International Biochar Initiative: Victor, NY, USA, 2012. [Google Scholar]
  46. Sosa-Zuniga, V.; Brito, V.; Fuentes, F.; Steinfort, U. Phenological growth stages of quinoa (Chenopodium quinoa) based on the BBCH scale. Ann. Appl. Biol. 2017, 171, 117–124. [Google Scholar] [CrossRef]
  47. Talebnejad, R.; Sepaskhah, A. Effect of different saline groundwater depths and irrigation water salinities on yield and water use of quinoa in lysimeter. Agric. Water Manag. 2015, 148, 177–188. [Google Scholar] [CrossRef]
  48. Paneque, M.; José, M.; Franco-Navarro, J.D.; Colmenero-Flores, J.M.; Knicker, H. Effect of biochar amendment on morphology, productivity and water relations of sunflower plants under non-irrigation conditions. Catena 2016, 147, 280–287. [Google Scholar] [CrossRef]
  49. Stanschewski, C.S.; Rey, E.; Fiene, G.; Craine, E.B.; Wellman, G.; Melino, V.J.; SR Patiranage, D.; Johansen, K.; Schmöckel, S.M.; Bertero, D. Quinoa phenotyping methodologies: An international consensus. Plants 2021, 10, 1759. [Google Scholar] [CrossRef] [PubMed]
  50. Maestro-Gaitán, I.; Granado-Rodríguez, S.; Orús, M.; Matías, J.; Cruz, V.; Bolaños, L.; Reguera, M. Genotype-dependent responses to long-term water stress in Chenopodium quinoa Willd. bioRxiv 2022. [Google Scholar] [CrossRef]
  51. Geerts, S.; Raes, D.; Garcia, M.; Mendoza, J.; Huanca, R. Crop water use indicators to quantify the flexible phenology of quinoa (Chenopodium quinoa Willd.) in response to drought stress. Field Crops Res. 2008, 108, 150–156. [Google Scholar] [CrossRef]
  52. Abrecht, D.; Carberry, P. The influence of water deficit prior to tassel initiation on maize growth, development and yield. Field Crops Res. 1993, 31, 55–69. [Google Scholar] [CrossRef]
  53. Fukai, S. Phenology in rainfed lowland rice. Field Crops Res. 1999, 64, 51–60. [Google Scholar] [CrossRef]
  54. Haider, G.; Koyro, H.-W.; Azam, F.; Steffens, D.; Müller, C.; Kammann, C. Biochar but not humic acid product amendment affected maize yields via improving plant-soil moisture relations. Plant Soil 2015, 395, 141–157. [Google Scholar] [CrossRef]
  55. Gavili, E.; Moosavi, A.A.; Haghighi, A.A.K. Does biochar mitigate the adverse effects of drought on the agronomic traits and yield components of soybean? Ind. Crops Prod. 2019, 128, 445–454. [Google Scholar] [CrossRef]
  56. Ramlow, M.; Foster, E.; Del Grosso, S.; Cotrufo, M. Broadcast woody biochar provides limited benefits to deficit irrigation maize in Colorado. Agric. Ecosyst. Environ. 2019, 269, 71–81. [Google Scholar] [CrossRef]
  57. Macdonald, L.M.; Farrell, M.; Zwieten, L.V.; Krull, E.S. Plant growth responses to biochar addition: An Australian soils perspective. Biol. Fertil. Soils 2014, 50, 1035–1045. [Google Scholar] [CrossRef]
  58. Sandhu, S.S.; Kumar, S. Impact of three types of biochar on the hydrological properties of eroded and depositional landscape positions. Soil Sci. Soc. Am. J. 2017, 81, 878–888. [Google Scholar] [CrossRef]
  59. Gale, N.V.; Thomas, S.C. Dose-dependence of growth and ecophysiological responses of plants to biochar. Sci. Total Environ. 2019, 658, 1344–1354. [Google Scholar] [CrossRef] [PubMed]
  60. Rajkovich, S.; Enders, A.; Hanley, K.; Hyland, C.; Zimmerman, A.R.; Lehmann, J. Corn growth and nitrogen nutrition after additions of biochars with varying properties to a temperate soil. Biol. Fertil. Soils 2012, 48, 271–284. [Google Scholar] [CrossRef]
  61. Lehmann, J.; Joseph, S. Biochar for environmental management: An introduction. In Biochar for Environmental Management: Science and Technology; Routledge: London, UK, 2012; pp. 1–12. [Google Scholar]
  62. Rees, F.; Simonnot, M.-O.; Morel, J.-L. Short-term effects of biochar on soil heavy metal mobility are controlled by intra-particle diffusion and soil pH increase. Eur. J. Soil Sci. 2014, 65, 149–161. [Google Scholar] [CrossRef]
  63. Jeffery, S.; Verheijen, F.G.; van der Velde, M.; Bastos, A.C. A quantitative review of the effects of biochar application to soils on crop productivity using meta-analysis. Agric. Ecosyst. Environ. 2011, 144, 175–187. [Google Scholar] [CrossRef]
  64. Rees, F.; Germain, C.; Sterckeman, T.; Morel, J.-L. Plant growth and metal uptake by a non-hyperaccumulating species (Lolium perenne) and a Cd-Zn hyperaccumulator (Noccaea caerulescens) in contaminated soils amended with biochar. Plant Soil 2015, 395, 57–73. [Google Scholar] [CrossRef]
  65. Hafez, Y.; Attia, K.; Alamery, S.; Ghazy, A.; Al-Doss, A.; Ibrahim, E.; Rashwan, E.; El-Maghraby, L.; Awad, A.; Abdelaal, K. Beneficial effects of biochar and chitosan on antioxidative capacity, osmolytes accumulation, and anatomical characters of water-stressed barley plants. Agronomy 2020, 10, 630. [Google Scholar] [CrossRef]
  66. Saddiq, M.S.; Wang, X.; Iqbal, S.; Hafeez, M.B.; Khan, S.; Raza, A.; Iqbal, J.; Maqbool, M.M.; Fiaz, S.; Qazi, M.A. Effect of water stress on grain yield and physiological characters of quinoa genotypes. Agronomy 2021, 11, 1934. [Google Scholar] [CrossRef]
  67. Benaffari, W.; Boutasknit, A.; Anli, M.; Ait-El-Mokhtar, M.; Ait-Rahou, Y.; Ben-Laouane, R.; Ben Ahmed, H.; Mitsui, T.; Baslam, M.; Meddich, A. The native arbuscular mycorrhizal fungi and vermicompost-based organic amendments enhance soil fertility, growth performance, and the drought stress tolerance of quinoa. Plants 2022, 11, 393. [Google Scholar] [CrossRef] [PubMed]
  68. Gholami, S.; Dehaghi, M.A.; Rezazadeh, A.; Naji, A.M. Seed germination and physiological responses of quinoa to selenium priming under drought stress. Bragantia 2022, 81, e0722. [Google Scholar] [CrossRef]
  69. Yuan, J.H.; Xu, R.K. The amelioration effects of low temperature biochar generated from nine crop residues on an acidic Ultisol. Soil Use Manag. 2011, 27, 110–115. [Google Scholar] [CrossRef]
  70. Telahigue, D.C.; Yahia, L.B.; Aljane, F.; Belhouchett, K.; Toumi, L. Grain yield, biomass productivity and water use efficiency in quinoa (Chenopodium quinoa Willd.) under drought stress. J. Sci. Agric. 2017, 1, 222–232. [Google Scholar] [CrossRef]
  71. Bertero, H.D. Quinoa. In Crop Physiology Case Histories for Major Crops; Elsevier: Amsterdam, The Netherlands, 2021; pp. 250–281. [Google Scholar]
  72. Rojas, W.; Pinto, M. La diversidad genética de quinua de Bolivia. In Proceedings of the Congreso Científico de la Quinua (Memorias), 14–15 June 2013; Instituto Interamericano de Cooperación para la Agricultura (IICA): La Paz, Bolivia, 2013; pp. 77–92. [Google Scholar]
  73. Sun, Y.; Liu, F.; Bendevis, M.; Shabala, S.; Jacobsen, S.E. Sensitivity of two quinoa (Chenopodium quinoa Willd.) varieties to progressive drought stress. J. Agron. Crop Sci. 2014, 200, 12–23. [Google Scholar] [CrossRef]
  74. El Moussaoui, H.; Idardare, Z.; Bouqbis, L. Assessing Alfalfa Productivity and Physiological Parameters: Biochar and Biocompost Versus Conventional Fertilizers with Manure and Chemical Fertilizers. Water Air Soil Pollut. 2023, 234, 1–18. [Google Scholar] [CrossRef]
  75. Gao, Y.; Shao, G.; Lu, J.; Zhang, K.; Wu, S.; Wang, Z. Effects of biochar application on crop water use efficiency depend on experimental conditions: A meta-analysis. Field Crops Res. 2020, 249, 107763. [Google Scholar] [CrossRef]
Figure 1. Plant height and number of leaves of quinoa as affected by biochar rate (a,c) and water regime (b,d) during the vegetative growing cycle. Values are means (n = 3). The asterisks above the symbols indicate significant differences among treatments (p ≤ 0.05; Tukey’s test). *, **, *** indicate F test significant at p ≤ 0.05, 0.01, 0.001, respectively; ns, not significant; B0, B2 and B4 indicate 0%, 2% and 4% treatments of wood chip biochar, respectively; W100 and W50 indicate 100% and 50% treatments of evapotranspiration losses restitution, respectively.
Agronomy 14 00053 g001
Figure 2. Yield-contributing traits, including panicle length and number of subpanicles of quinoa, as affected by biochar rate (a,c) and water regime (b,d) at the end of the experiment. Values are means (n = 3 ± se). In graph, different letters above the bars indicate significant differences among treatments (p ≤ 0.05; Tukey’s test). ** and *** indicate F test significant at p ≤ 0.01 and 0.001; ns, not significant; B0, B2 and B4 indicate 0%, 2% and 4% treatments of wood chip biochar, respectively; W100 and W50 indicate 100% and 50% treatments of evapotranspiration losses restitution, respectively.
Agronomy 14 00053 g002
Table 1. Leaf area (LA, cm2 plant−1) and SPAD index (-) of quinoa grown under three biochar rates and two water regimes during the experiment.
Experimenatal
Factor
28 DAS32 DAS38 DAS45 DAS
LASPAD
Index
LASPAD
Index
LASPAD
Index
LASPAD
Index
Biochar (B)
B0 106 b44.3201 b45.8 ab269 b43.3 ab446 b44.6 b
B2 121 a46.2271 a47.0 a419 a44.5 a585 a46.4 a
B4 76 c46.7177 b44.6 b409 a42.3 b618 a44.3 b
Water regime (W)
W100 106 a45.4250 a46.9 a468 a44.3 a748 a47.7 a
W50 96 b46.0182 b44.7 b263 b42.4 b351 b42.5 b
Biochar × water regime
B0W100114 b44.0260 ab47.3350 b44.561347.4
W5099 bc44.5142 d44.4189 c42.027941.7
B2W100135 a46.5285 a47.6517 a44.876648.7
W50106 b45.9255 ab46.5320 b44.240444.1
B4W10070 d45.8205 bc45.9538 a43.586547.0
W5083 cd47.5148 cd43.3281 b41.137241.7
Significance
B ***ns*************
W **ns**************
B × W***ns*ns*nsnsns
Values are means (n = 3). In each column, means followed by different letters are significantly different (p ≤ 0.05; Tukey’s test). *, **, *** indicate F test significant at p ≤ 0.05, 0.01, 0.001, respectively; ns, not significant; B0, B2 and B4 indicate 0%, 2% and 4% treatment of wood chip biochar, respectively; W100 and W50 indicate 100% and 50% treatment of evapotranspiration losses restitution, respectively; DAS, days after sowing.
Table 2. Stem diameter (SD, mm) and number of branches (NB) of quinoa grown under three biochar rates and two water regimes during the experiment.
Experimental Factor32 DAS38 DAS45 DAS
SDNBSDNBSDNB
Biochar (B)
B0 3.58.35.5 ab13.2 b5.9 b18.3 b
B2 3.89.56.1 a15.3 a6.3 a20.3 a
B4 3.48.35.2 b14.0 ab5.6 c18.5 b
Water regime (W)
W100 4.0 a9.2 a6.5 a16.0 a6.8 a20.9 a
W50 3.2 b8.2 b4.7 b12.3 b5.1 b17.2 b
Biochar × water regime
B0W1004.2 a9.06.515.06.6 b20.0
W502.9 c7.74.411.35.3 c16.7
B2W1003.9 ab9.76.817.37.1 a22.3
W503.8 ab9.35.513.35.4 c18.3
B4W1003.8 ab9.06.215.76.6 b20.3
W503.0 bc7.74.212.34.6 d16.7
Significance
B nsns*******
W ***************
B × W *nsnsns**ns
Values are means (n = 3). In each column, means followed by different letters are significantly different (p ≤ 0.05; Tukey’s test). *, **, *** indicate F test significant at p ≤ 0.05, 0.01, 0.001, respectively; ns, not significant; B0, B2 and B4 indicate 0%, 2% and 4% treatments of wood chip biochar, respectively; W100 and W50 indicate 100% and 50% treatments of evapotranspiration losses restitution, respectively; DAS, days after sowing.
Table 3. Relative water content (RWC, %), turgid-to-dry weight ratio (TW:DW) and total leaf water potential (Ψ, MPa) of quinoa grown under three biochar rates and two water regimes at the end of the experiment.
Experimental FactorRWCTW:DWΨ
Biochar (B)
B055.9 b10.1 a−3.0 b
B255.6 b9.1 b−3.1 b
B461.0 a9.5 ab−2.6 a
Water regime (W)
W10061.4 a 8.9 b−2.6 a
W5053.6 b10.2 a−3.2 b
Biochar × water regime
B0W10058.5 ab9.6−2.8
W5053.3 bc10.5−3.2
B2W10062.2 a8.2−2.7
W5049.1 c10.1−3.6
B4W10063.5 a8.9−2.3
W5058.5 ab10.2−2.9
Significance
B******
W*********
B × W*nsns
Values are means (n = 3). In each column, means followed by different letters are significantly different (p ≤ 0.05; Tukey’s test). *, **, *** indicate F test significant at p ≤ 0.05, 0.01, 0.001, respectively; ns, not significant; B0, B2 and B4 indicate 0%, 2% and 4% treatments of wood chip biochar, respectively; W100 and W50 indicate 100% and 50% treatments of evapotranspiration losses restitution, respectively.
Table 4. Plant height (PH, cm), stem diameter (SD, mm), number of branches (NB, n.) and leaves (NL, n.), leaf area (LA, cm2 plant−1) and SPAD index (-) of quinoa grown under three biochar rates and two water regimes at the end of the experiment.
Experimental
Factor
PHSDNBNLLASPAD
Index
Biochar (B)
B047.7 b6.5 b20.3 b79.0 b621.1 b41.5 b
B254.8 a6.8 a24.3 a105.0 a791.6 a44.6 a
B450.0 b6.2 c21.2 b83.0 b674.6 b41.3 b
Water regime (W)
W10060.1 a7.3 a23.8 a110.0 a955.4 a44.5 a
W5041.6 b5.7 b20.1 b68.0 b436.2 b40.4 b
Biochar × water regime
B0W10057.07.1 a21.796.7862.5 b44.2
W5038.35.8 b19.061.3379.7 c38.9
B2W10065.37.5 a26.7128.71101.8 a46.4
W5044.36.0 b22.081.3481.4 c42.8
B4W10058.07.2 a23.0104.7901.8 b42.9
W5042.05.1 c19.361.3447.5 c39.6
Significance
B****************
W******************
B × W ns**nsns*ns
Values are means (n = 3). In each column, means followed by different letters are significantly different (p ≤ 0.05; Tukey’s test). *, **, *** indicate F test significant at p ≤ 0.05, 0.01, 0.001, respectively; ns, not significant; B0, B2 and B4 indicate 0%, 2% and 4% treatments of wood chip biochar, respectively; W100 and W50 indicate 100% and 50% treatments of evapotranspiration losses restitution, respectively.
Table 5. Stem, leaf, panicle, subpanicle and total fresh weight (FW, g plant−1) and water use efficiency (WUE, g L−1) of quinoa grown under three biochar rates and two water regimes at the end of experiment.
Experimental
Factor
FWWUE
Stem Leaves PanicleSubpaniclesTotal
Biochar (B)
B09.8 b16.2 b0.95 b0.71 b27.6 b6.5 ab
B211.4 a19.5 a1.38 a0.85 a33.2 a7.2 a
B49.0 b16.1 b0.99 b0.72 b26.8 b5.8 b
Water regime (W)
W10014.8 a24.2 a1.47 a1.10 a41.5 a7.9 a
W50 5.4 b10.3 b0.74 b0.41 b16.9 b5.0 b
Biochar × water regime
B0W10014.723.6 b1.351.0140.7 b8.3 a
W504.9 8.7 c0.550.4014.6 c4.6 c
B2W10016.527.3 a1.811.2246.8 a8.7 a
W506.411.8 c0.960.4819.7 c5.7 bc
B4W10013.121.6 b1.271.0637.1 b6.9 b
W504.910.5 c0.710.3716.5 c4.8 c
Significance
B****************
W******************
B × W ns*nsns**
Values are means (n = 3). In each column, means followed by different letters are significantly different (p ≤ 0.05; Tukey’s test). *, **, *** indicate F test significant at p ≤ 0.05, 0.01, 0.001, respectively; ns, not significant; B0, B2 and B4 indicate 0%, 2% and 4% treatments of wood chip biochar, respectively; W100 and W50 indicate 100% and 50% treatments of evapotranspiration losses restitution, respectively.
Disclaimer/Publisher’s Note: The statements, opinions and data contained in all publications are solely those of the individual author(s) and contributor(s) and not of MDPI and/or the editor(s). MDPI and/or the editor(s) disclaim responsibility for any injury to people or property resulting from any ideas, methods, instructions or products referred to in the content.

