Abstract
Callus cultures initiated from red beet tubers were acclimated to 75 or 100 mM NaCl salinity by exposing them to gradually increasing NaCl concentrations. The acclimated callus lines displayed growth rates comparable to the control culture cultivated on the NaCl-free medium. Several antioxidant system components were analyzed to assess the role of the antioxidant defense in the acclimated callus’s ability to proliferate on salt-supplemented media. It was found that proline and ascorbate concentrations were increased in salt-acclimated callus lines with respect to the control line. On the other hand, glutathione concentration was unchanged in all tested callus lines. Total activities of the antioxidant enzymes, namely superoxide dismutase (SOD, EC 1.15.1.1), catalase (CAT, EC 1.11.1.6), ascorbate peroxidase (APX, EC 1.11.1.11), and class III peroxidase (POX, EC 1.11.1.7) were increased in salt-acclimated cultures. The enzymatic components of the antioxidant systems were upregulated in a coordinated manner during the initial phases of the culture cycle when the increase in callus fresh mass occurs.
1. Introduction
Currently, it is estimated that about 20% of the world’s agricultural land and 33% of all irrigated land is exposed to excessive salinization. Moreover, the soil areas threatened with excessive salinity are increasing at an alarming rate of 10% per year. According to estimates, by 2050, over 50% of arable land will be considered saline [1]. From year to year, largely as a result of human activity, the problem of soil salt contamination is becoming more and more important [2,3]. The salinity, due to changes in the osmotic pressure between the cell and its environment, and the toxic effects of ions, mainly Na+ and Cl−, triggers both the osmotic and the ionic stress. This is manifested by water deficit, oxidative stress, disorganization of cell membranes, disturbances in the mineral nutrient homeostasis, reduced cell division rate and photosynthetic rates, genotoxicity, and sometimes cell death [2,4,5].
In response to the reductions in the osmotic potential of the salt-contaminated soil solution, plants developed a mechanism of osmotic adjustment. It consists of the synthesis of osmoprotective compounds and their accumulation in the cell sap. Several organic compounds of different chemical properties, such as proline, mannitol, sorbitol, betaine, or spermine, belong to this category. These molecules allow for maintaining an appropriate osmotic balance between the vacuole, the cytoplasm, and the external environment of the cell. In addition, many of them act as antioxidants [6].
Exposure to various biotic and abiotic agents, including salinity, is followed by increased rates of reactive oxygen species (ROS) formation in plant cells [7]. Due to their high and nonspecific reactivity, ROS may provoke oxidative damage to the cell structures and macromolecules, such as lipids, proteins, and nucleic acids. In order to prevent oxidative damage, the antioxidant systems are activated in plant cells. Their action consists of restoring the oxidative balance by scavenging excess ROS molecules. The antioxidant systems include compounds with enzymatic activity and non-enzymatic antioxidants. Many studies have confirmed that the activation of antioxidant enzymes such as superoxide dismutase (SOD), glutathione and ascorbate peroxidase (GPX and APX), catalase (CAT), or glutathione reductase (GR) and the accumulation of non-enzymatic antioxidants such as ascorbate (ASC), glutathione (GSH), tocopherol, flavonoids, and carotenoids contributes to the formation of salt stress tolerance in plants [8,9].
Several studies demonstrated that callus cultures may serve as a model system for studies on the cellular dimension of salt stress tolerance mechanism [10]. The callus consists, in its major part, of rapidly dividing cells. Therefore, it may be particularly advantageous to use callus for studies on salt stress effects on proliferating plant cell populations. Due to the relatively large scale of the culture, high growth rates and susceptibility to phytohormonal stimuli, and ability to induce different developmental pathways, the callus offers an easily accessible alternative or useful complement to studies performed using intact plant meristems [11,12,13]. Furthermore, tissue culture techniques, including callus cultures, were frequently proposed, either as a tool to identify markers of salt tolerance [14] or for breeding salt-tolerating crops. The latter may be accomplished by regenerating plants from the salt-tolerant somaclonal callus variants selected for salt tolerance [10,15].
Furthermore, callus culture may be exploited as a source of useful metabolites. Red beet callus is particularly promising in this regard due to its capacity to synthesize betalains, a class of nitrogen-containing plant pigments present in a vacuole of most plant families classified in the order Caryophyllales [16]. Betalains are subdivided into red-violet betacyanins (betains) and yellow-orange betaxanthins. Red beet tubers, which contain two main pigments, betanin (red betacyanin) and vulgaxanthin I (yellow betaxanthin), are the most common source of betalains [17]. Due to their strong antioxidant properties, these pigments are considered a desirable component of the everyday diet. Possible health benefits of betalains and betalain-containing red beet juice were frequently reported. The effectiveness of betanins in the long-term inhibition of the development of skin and liver tumors has been demonstrated in mice [18]. It has also been found that betanins and betanidines, acting at very low concentrations, have the ability to inhibit the process of lipid oxidation and heme breakdown in vitro [19]. The ability of betalains to prevent the oxidation of endothelial cells has also been observed [20]. It has also been proven that betalains have the ability to increase the activity of quinone reductase, the enzyme involved in detoxification processes associated with cancer chemoprevention [21]. Red beet juice ingestion has been suggested to have beneficial effects on endothelial functions due to its high nitrate content. After ingestion, the nitrate from the beet juice is first reduced to nitrite and then easily converted to nitric oxide. The latter promotes artery vasodilation and thus may contribute to cardiovascular disease prevention. Therefore, red beet ingestion was particularly recommended during the recent COVID pandemic for periods of home confinement, when changes in lifestyle behavior, such as unhealthy diet, emotional disorders, and reduced physical activity, may increase the risk of cardiovascular disease. It was also speculated that the boost of NO production following red beet juice ingestion may prevent the release of a large amount of pro-inflammatory cytokines (called the “cytokine storm”), which is involved in the development of respiratory distress and multiple organ failure under severe COVID-19 [22]. Red beet juice is the most common source of beneficial beet metabolites, but plant tissue cultures offer several advantages over raw plant material, such as the possibility of manipulating the betalain composition and synthesis rate [23,24].
Here, we show that the callus cultures derived from red beet tubers and acclimated to either 100 or 75 mM NaCl display growth increments comparable to the control culture grown on the NaCl-free medium. Then, we analyzed several enzymatic and non-enzymatic components of the antioxidant defense system to assess their role in sustaining callus growth on salt-supplemented media.
2. Material and Methods
2.1. Red Beet Tuber Callus and Its Acclimation to Salinity
The plant material used for the study was a callus culture derived from red beet (Beta vulgaris) hypocotylar tuber explants. Red beet tubers were purchased at a local market, rinsed in distilled water, surface sterilized with 70% ethanol for 5 min, and then, for 20 min, in a 50% solution of commercial bleach (about 2% Cl2). Next, the tubers were washed several times for 5 min in sterile distilled water. Afterward, cuboid fragments of storage parenchyma were excised under aseptic conditions and placed on a solid medium containing mineral salts and vitamins according to Murashige and Skoog’s medium [25] and 3% sucrose, 0.75% agar, 1 mg/L 6-benzylaminopurine (BAP), and 0.1 mg/L 2,4-dichlorophenoxyacetic acid (2,4-D). The pH of the medium was adjusted to 5.7 before autoclaving the medium. Phytohormones were added to the medium from filter-sterilized stock solutions after autoclaving. Callus culture was carried out in a culture room under continuous irradiation and at 25 °C.
The callus was subcultured at 4-week intervals into the fresh medium. During subsequent subcultures, three callus lines were established. The control callus line was grown on the medium of the composition mentioned above. Simultaneously, in order to produce salt-acclimated callus lines, distinct callus cultures were subjected to gradual acclimation to salinity by transferring tissue onto the NaCl-supplemented media. For this purpose, the NaCl content in the media was increased by 5–10 mM NaCl with each subsequent subculture until final concentrations of 75 or 100 mM NaCl in the medium were achieved. The callus lines generated in this way were referred to as 75 mM NaCl-acclimated callus or 100 mM NaCl-acclimated callus. Then, the acclimated lines were cultivated for two years on media containing target NaCl concentrations. Subcultures were initiated using a callus inoculum of 1 g. The samples of callus tissue were collected in weekly intervals for fresh mass and biochemical parameter analysis.
2.2. Total Ascorbate Content
The assay was based on the reduction of Fe3+ to Fe2+ by ASC after reducing dehydroascorbic acid to ascorbic acid and the spectrophotometric detection of Fe2+ complexed with 2.2′-dipyridyl. In order to isolate ascorbate, samples consisting of 250 mg of callus were homogenized with 5 volumes of 5% TCA at 4 °C in a porcelain mortar. The homogenate was centrifuged at 10,000× g for 10 min at 4 °C. The supernatant was collected for analysis of ascorbate. In order to reduce dehydroascorbic acid to ascorbic acid, 135 μL of supernatant was mixed with 16.87 µL of 10 mM dithiothreitol (DTT) and 16.87 µL of 80 mM K2HPO4 and incubated 5 min at room temperature. Afterwards, the following reagents were added in sequence: 80 μL of 85% H3PO4, 1.37 mL of 0.5% 2,2′-dipiridyl, and 280 μL of 1% ferric chloride. The samples were allowed to stay for 30 min at room temperature for the color to develop. Then, the absorbance at 525 nm (A525) was measured. The values of absorbance were compared with a standard curve based on ASC in the range of 0–50 μg mL−1.
2.3. Total Glutathione Content
The measurement principle was based on the measurement of the rate of reduction of 5,5′-dithiobis(2-nitrobenzoic acid) (DTNB) to 2-nitro-5-thiobenzoic acid (TNB) by glutathione, which was oxidized to GSSG. The resulting GSSG was converted back to GSH by glutathione reductase at the expense of NADPH oxidation. To extract glutathione, 0.2 g of callus tissue was frozen in liquid nitrogen and ground to a powder using a porcelain mortar. After that, the powder was extracted with 2 mL of 5% sulfosalicylic acid. The resulting homogenate was centrifuged for 10 min at 10,000× g at 4 °C. The glutathione content was assayed with a Glutathione Assay Kit (Sigma-Aldrich, Burlington, VT, USA) according to the producer’s protocol.
2.4. Proline Content
Proline was measured following the methods of Abrahám et al. [26]. The proline was extracted with 3% sulfosalicylic acid (5 μL/mg fresh weight). Next, 100 µL of the extract was mixed with 100 μL of 3% sulfosalicylic acid, 200 μL glacial acetic acid, and 200 μL acidic ninhydrin. The mixture was incubated at 96 °C for 60 min, cooled on ice, and extracted with 1 mL toluene. The absorbance of the chromophore phase was measured at 520 nm against toluene as a reference.
2.5. Enzyme Extraction, Assays, and Isoenzyme Profiling
The protein extract for superoxide dismutase, catalase, and peroxidase activity assay was prepared by homogenizing 0.5 g callus tissue at 4 °C in 1.5 mL of the homogenization buffer composed of 100 mM phosphate buffer, pH 7.8, 1 mM EDTA, 8 mM MgCl2, 4 mM DTT, and 0.1% Triton X-100. The extraction of ascorbate peroxidase was performed in the 100 mM phosphate buffer, pH 7.5, supplemented with 1 mM EDTA and 5 mM ascorbic acid. Ascorbate oxidase was extracted with 100 mM phosphate buffer (pH 6.1) supplemented with 0.5 mM EDTA. The homogenates were centrifuged at 4 °C for 10 min at 10,000× g, and supernatants containing the extracted enzymes were used for the activity assays and isoenzyme analysis. Total protein was assayed according to Bradford [27] with BSA as a standard.
The activity of superoxide dismutase (SOD, EC 1.15.1.1) was assayed by its ability to inhibit photochemical reduction in NBT at 560 nm [28]. The assays were carried out in the 1.6 mL of the reaction mixture composed of 50 mM sodium phosphate buffer (pH 7.8), 33 mM NBT, 10 mM L-methionine, 0.66 mM EDTA, 0.0033 mM riboflavin, and 50 µL of enzyme extract. The concentrations of the reagents are their final concentrations in the reaction mixture. Simultaneously, control samples were prepared, where enzyme extract was replaced by homogenization buffer. Riboflavin was added last to the reaction mixtures. Thereafter, the test and control tubes were irradiated under constant white light for 10 min. Following irradiation, the A560 was measured against the nonirradiated reaction mixture. One unit of SOD was defined as the amount of enzyme that inhibits 50% NBT photoreduction. Cyanide-resistant SOD activity was assayed in the presence of 10 mM KCN. Peroxide-resistant SOD activity was assayed in the presence of 5 mM H2O2.
The activity of the SOD isoforms was determined after the electrophoretic separation of protein extract in the polyacrylamide gel. Samples containing 200 μg of total protein were subjected to discontinuous PAGE under nondenaturating, nonreducing conditions as described by Laemmli [29] using a stacking gel containing 4% (w/v) acrylamide and a separating gel containing 12% (w/v) acrylamide. After the completion of electrophoresis, the gels were stained for the activities of SOD. To visualize the SOD activity, the method of Rao et al. [30] was applied. Firstly, the gels were incubated for 25 min with 100 mM phosphate buffer, pH 7.8, containing 2.5 mM NBT. Next, the gels were transferred to the solution containing 28 mM tetramethyl ethylene diamine and 28 μM riboflavin in 100 mM phosphate buffer, pH 7.8, and kept for 25 min. in the darkness with gentle agitation. After that, the gels were placed in distilled water and exposed to white light for 10–15 min. until the bands were visible. SOD isoenzymes appeared as colorless bands on a deep-blue background. The identification of SOD isoforms was based on the inhibitory effect of KCN and H2O2 on the activity of SOD isoenzymes. After the accomplishment of the electrophoresis, the gels were incubated in the NBT-containing buffer, prepared as described above but supplemented with either 5 mM KCN or 5 mM H2O2. Following the 25-min-long incubation, the procedure of the visualization of the SOD activity was performed. Different sensitivity of given isoforms to inhibitors—KCN and H2O2—was used. Namely, the activity of FeSOD is inhibited by hydrogen peroxide, while KCN remains insensitive. The manganese isoform is not inhibited by KCN or inactivated by H2O2. On the other hand, CuZnSOD is sensitive to both KCN and H2O2 [31,32,33].
The activity of catalase (CAT, EC 1.11.1.6) was assayed according to Rao et al. [30]. The measurement of CAT activity was based on the following decrease in absorbance at 240 nm in 1 mL of the reaction mixture composed of 100 mM phosphate buffer, pH 7.0, 30 μL enzymatic extract, and 1.5 μL of 30% (v/v) H2O2. The decrease in A240 was followed at 25 °C against a plant extract-free blank. The activity of CAT was expressed as the number of μmol of H2O2 decomposed during 1 min by 1 mg of total protein [30].
The assay for ascorbate peroxidase (APX, EC 1.11.1.11) activity was performed according to Rao et al. [30]. The APX activity was determined by following the decrease in A290 for 3 min in 1 mL of reaction mixture composed of 100 mM K+-phosphate buffer, pH 7.5, 0.5 mM ASC, and 0.2 mM H2O2 [30,34]. The concentrations of the reagents are their final concentrations in the reaction mixture. A slight decrease in absorbance observed in the absence of enzyme extract was subtracted. No decrease in absorbance occurred unless H2O2 was present in the reaction mixture. The activity of APX was expressed as a number of μmol ASC oxidized by 1 mg of total protein in 1 min [30,34].
Gels for APX staining were run in carrier buffer containing 2 mM ascorbate. These gels were prerun for 30 min to allow ascorbate present in the buffer to enter the gel prior to the application of samples [30,35]. Staining the gels for APX activity was performed according to Rao et al. [30]. Firstly, the gels were equilibrated with 50 mM K+-phosphate buffer, pH 7.0, containing 2 mM ASC for 30 min. Then, the gels were incubated for 20 min in a reaction mixture composed of 4 mM ASC and 2 mM H2O2 in 50 mM K+-phosphate buffer, pH 7.0. Then, the gels were briefly washed with buffer and stained in the solution of 28 mM tetramethyl ethylene diamine and 2.45 mM nitroblue tetrazolium in 50 mM K+-phosphate buffer, pH 7.8. The APX bounds remained colorless on the deep blue background [30].
The activity of soluble class III peroxidases (POX, EC 1.11.1.7) was determined by recording changes in absorbance in a 1 mL reaction mixture containing 100 mM phosphate buffer, pH 6.0, 60 mM pyrogallol, 0.66 mM H2O2, and 5 µL of protein extract. The concentrations of the reagents are their final concentrations in the reaction mixture. The reaction was started by adding H2O2 to the mixture. Absorbance measurement at λ = 420 nm was recorded for 60 s against phosphate buffer using a U-1800 spectrophotometer (Hitachi, Tokyo, Japan). In parallel, absorbance changes in enzyme-free reaction mixtures were determined to correct for non-enzymatic oxidation of pyrogallol.
In order to separate peroxidase isoenzymes, 50 μg of total protein was subjected to native electrophoresis on polyacrylamide gel. The separating gel containing 7.5% (w/v) acrylamide and a stacking gel containing 4% (w/v) acrylamide were used. After the electrophoresis, the gels were immersed in the solution containing 0.63 mM o-dianisidine and 30 mM H2O2 in 50 mM phosphate buffer, pH 6.0, for 15 min. Peroxidase isoenzymes stained red.
2.6. Statistics
Statistical significance of differences between mean values of biochemical parameters were determined with two-way ANOVA to evaluate the effect of two factors (callus line and sampling point) and their interaction. The significance of differences between experimental variants was assessed in the course of a multiple comparison analysis employing Tukey’s HSD. Differences at the level of p < 0.05 were considered significant. All statistical tests were performed in SigmaPlot 11.0 (Systat Software, San Jose, CA, USA). Callus growth and the biochemical parameter analysis were repeated three times during three independent culture periods. At each sampling point, five independent cultures, representing 75 mM NaCl-acclimated callus, 100 mM NaCl-acclimated callus, or control callus, were analyzed. The mean and standard deviation were calculated for each of the three callus lines separately. Error bars shown in all figures represent the standard deviation calculated from all repetitions representing a given callus line in each experiment.
3. Results
3.1. Callus Morphology and Its Fresh Mass (FM)
The callus cultures, derived from red beet tubers, were characterized by intensive red pigmentation. The control line was quite uniformly red-pigmented (Figure 1A). The salt-acclimated calli were also predominantly composed of red-pigmented tissue, but the bright-red, yellowish, and greenish clumps of the callus were discernible (Figure 1B,C).
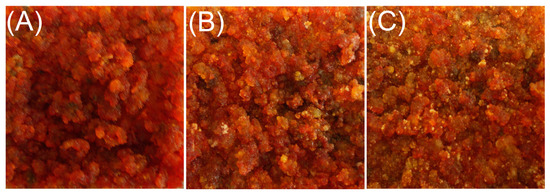
Figure 1.
Photographs of the representative cultures of the red beet tuber−derived callus, representing the control callus line, grown on the NaCl−free medium (A), 75 mM NaCl−acclimated, (B) and 100 mM NaCl−acclimated callus line (C). The photographs were taken 28 days after subculture.
Callus FM gradually increased in all lines over the culture period. The results of the two-way ANOVA indicated a significant difference in FM between the sampling points (F = 64.025, p < 0.001). However, the largest FM increments occurred during the first 14 days of the culture period, resulting in significant differences in the FM between the values determined at the two first sampling points. Measurements performed 21 and 28 days after subculture show that growth increments, occurring during the second half of the culture period, were smaller, with negligible differences between the sampling points. The tissues acclimated to salinity were characterized by comparable FM to one of the control line when analyzed during subsequent sampling points. No significant differences in the FM were detected between the tested lines at all sampling points. At the first sampling point, i.e., 7 days after subculture, the acclimated lines displayed smaller FM than the control one, but as mentioned above, the difference did not pass the significance test (Figure 2). Comparing the difference in the FW between the 7th and 14th day of culture shows a higher increase in the FW in the salt-acclimated lines (115% and 136%, for 75 mM NaCl- and 100 mM NaCl-acclimated callus, respectively), as compared to the control line (49%). However, no statistically significant differences were detected between the tested lines (F = 3.217, p = 0.052), and no interaction between the callus line and sampling points was detected (F = 1.302, p = 0.281). These data show that the 75 mM or 100 mM NaCl-acclimated lines are not deficient in their growth rate with respect to the control line grown on the salt-free medium.
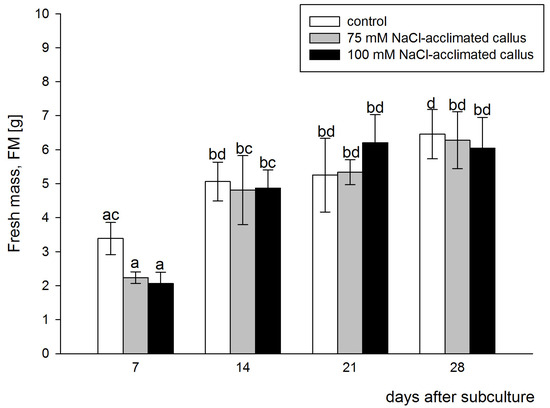
Figure 2.
Time course of the fresh mass increments in the red beet tuber−derived callus acclimated to 75 (grey bars) or 100 mM NaCl (black bars) or cultured on basal medium (control, white bars). Fresh mass was assessed after 7, 14, 21, and 28 days of the four−week−long culture period. Different letters denote significant differences at p < 0.05.
3.2. Ascorbate, Glutathione, Proline
The outcome of the two-way ANOVA analysis indicated the significant effect of the callus line (F = 60,170, p < 0.001) and the length of culture (F = 26.1, p < 0.001) on the ascorbate level, and there was an interaction between the two factors (F = 8.985, p < 0.001). After the first week of the growth cycle, the ascorbate content was similar in the control line and the salt-acclimated lines. The ascorbate level increased by the end of the second week of the culture period in all callus lines. However, in the control line, the antioxidant content decreased over the second half of the culture, whereas it remained relatively stable in the salt-acclimated lines. Consequently, the majority of the culture period was marked by a significantly increased ascorbate content in the lines acclimated to either 75 mM or 100 mM NaCl when compared to the control line. The highest ascorbate levels were detected in the 100 mM NaCl-acclimated line. In this line, the ascorbate level was 53% and 77% higher than in the control line after 21 and 28 days of culture, respectively. (Figure 3A). In contrast to ascorbate, the glutathione content was stable across the growth cycle (F = 2.267, p = 0.097), and it did not differ significantly between the salt-acclimated and the control callus line (F = 1.338, p = 0.275, Figure 3B). The proline content in callus differed significantly in function of both the callus line (F = 77.140, p < 0.001) and the sampling time (F = 40.299, p < 0.001). Furthermore, there was a statistically significant interaction between the two factors (F = 3.886, p = 0.008). The concentration of proline in the control line and the line adapted to the salinity of 75 mM NaCl was similar over the entire culture period. On the other hand, the line acclimated 100 mM NaCl accumulated significantly higher proline levels. Irrespective of the callus line, the proline levels slightly decreased in all lines over the first three weeks of the growth cycle. However, during this period, proline concentrations in the 100 mM NaCl-acclimated line were significantly higher when compared to other callus lines. When compared to the control line, the proline levels in the 100 mM NaCl-acclimated callus were 46%, 56%, and 80% higher after 7, 14, and 21 days of culture, respectively. After 28 days of the growth cycle, the proline content was similar in the tested callus lines (Figure 3C).
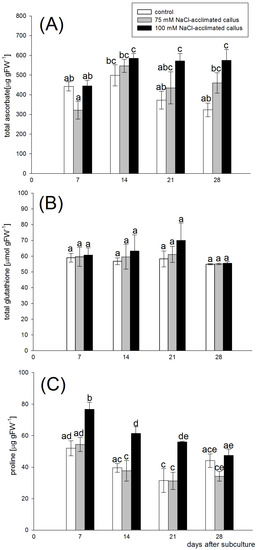
Figure 3.
Ascorbate (A), glutathione (B), and proline (C) content in the red beet tuber−derived callus acclimated to 75 (grey bars) or 100 mM NaCl (black bars) or cultured on basal medium (control, white bars). The metabolites were assessed after 7, 14, 21, and 28 days of the four−week−long culture period. Different letters denote significant differences at p < 0.05.
3.3. Superoxide Dismutase (SOD) and Catalase (CAT)
Irrespective of the callus line, the highest SOD activity was observed 7 days after subculture. After that, the SOD activity gradually decreased until the lowest levels were attained after 28 days of culture. Over the entire culture period, a clear correlation of dismutase activity with the presence of NaCl in the culture medium was observed. A significantly higher level of SOD activity was noted in tissues acclimated to salinity, compared to the callus cultured on medium without the addition of NaCl. After 7 days of culture, the lowest SOD activity was detected in the control tissue, intermediate one in the tissue adapted to 100 mM NaCl (47% higher than control), and the highest activity was found in the tissue adapted to 75 mM NaCl (62% higher than control). When analyzed after 14, 21, or 28 days of culture, a dose–response relationship was observed between the salt concentration and the SOD activity, with the highest SOD activities revealed in a 100 mM NaCl-acclimated line (Figure 4A). Compared to the control line, SOD activity increased by 31%, 36%, and 16% in the 75 mM NaCl-acclimated line and 48%, 53%, and 50% in the 100 mM NaCl-acclimated line on the 14th, 21st, and 28th day, respectively. The results of the two-way ANOVA show that the SOD activity was strongly dependent on the type of the callus line (F = 533.902, p < 0.001) and on the stage of the culture period (F = 1116, p < 0.001). There was also a significant interaction between the two factors (43.194, p < 0.001).
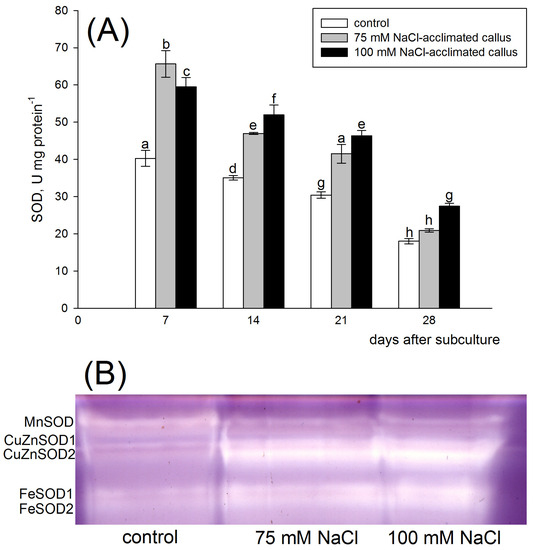
Figure 4.
Total superoxide dismutase (SOD) activity (A) and zymogram analysis of SOD isoenzymes (B) in the red beet tuber−derived callus acclimated to 75 (grey bars) or 100 mM NaCl (black bars) or cultured on basal medium (control, white bars). SOD activity was assessed after 7, 14, 21, and 28 days of the four−week−long culture period. Different letters denote significant differences at p < 0.05. SOD isoenzyme analysis was performed 14 days after subculture.
Superoxide dismutase isoenzyme pattern analysis in the red beet callus revealed the presence of one MnSOD, two CuZnSOD, and two FeSOD isoenzymes. Total protein preparations were analyzed for SOD isoenzyme patterns 14 days after subculture. The bands representing CuZnSOD and FeSOD displayed visibly higher intensity in salt-acclimated tissues than in the control line. Contrastingly, the MnSOD activity was higher in the control line (Figure 4B).
All lines displayed the highest CAT activities in the first week of the growth cycle. A dose–response dependence of the CAT activity on the salt concentration in the medium was observed at this sampling point. In the 75 mM NaCl-acclimated callus, CAT activity was higher than in the control line, but the difference was not statistically significant. Significantly higher enzyme activity, as compared to the control, was detected in the tissues acclimated to 100 mM NaCl (80% increase). In the following weeks, CAT activity strongly decreased in all callus lines, and there were also no significant differences between them, except the 100 mM NaCl-acclimated callus, determined 21 days after subculture. At this sampling point, the CAT activity was significantly lower than in the control and the one acclimated to 75 mM NaCl (Figure 5). The two-way ANOVA analysis did not indicate the significant effect of the type of the callus line on CAT activity (F = 0.128, p < 0.880).
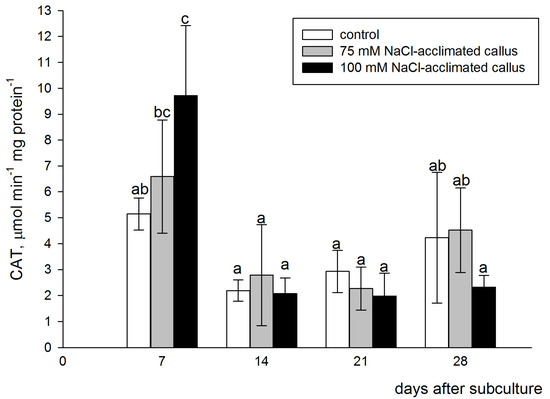
Figure 5.
Catalase (CAT) activity in the red beet tuber−derived callus acclimated to 75 (grey bars) or 100 mM NaCl (black bars) or cultured on basal medium (control, white bars). CAT activity was assessed after 7, 14, 21, and 28 days of the four−week−long culture period. Different letters denote significant differences at p < 0.05.
3.4. Ascorbate Peroxidase
APX activity was relatively stable over the entire culture period in all callus lines, except the 28 days after subculture when the activity in the salt-acclimated lines significantly decreased when compared to the previous part of the culture period. However, during the first three weeks of the culture, APX activity in the salt-acclimated lines was maintained at significantly higher levels than in the control line. Compared to the control line, APX activity increased by 26%, 73%, and 62% in the 75 mM NaCl-acclimated line and 45%, 90%, and 64% in the 100 mM NaCl-acclimated line on the 7th, 14th and 21st day, respectively. Contrastingly, after 4 weeks of the culture, APX activities in the salt-acclimated lines dropped below the level detected in the control line, with a 25% and 34% decrease, in the 75 mM NaCl- and 100 mM NaCl-acclimated line, respectively (Figure 6A). The results of the two-way ANOVA show that both factors, i.e., the type of callus line and the sampling point, during the culture period (F = 147.107, p < 0.001 and F = 335.955, p < 0.001, respectively) affected APX activity and a statistically significant interaction between the APX activity and the stage of the culture period (F = 49.342, p < 0.001) occurred.
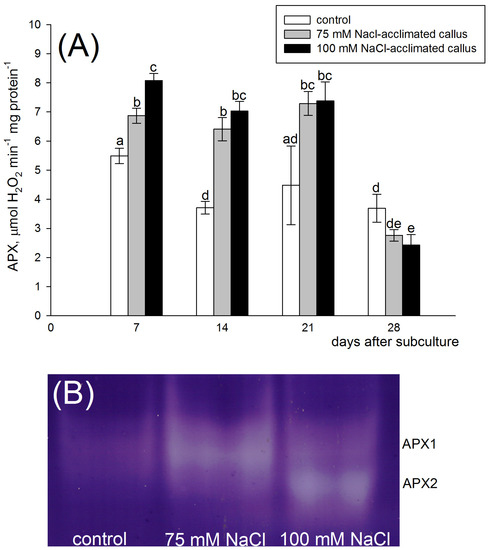
Figure 6.
Ascorbate peroxidase (APX) activity (A) and zymogram analysis of APX isoenzymes (B) in the red beet tuber−derived callus acclimated to 75 (grey bars) or 100 mM NaCl (black bars) or cultured on basal medium (control, white bars). APX activity was assessed after 7, 14, 21, and 28 days of the four−week−long culture period. Different letters denote significant differences at p < 0.05. APX isoenzyme analysis was performed 14 days after subculture.
Analysis of the APX isoenzyme pattern performed 14 days after subculture revealed the presence of one APX isoenzyme, which was common for callus lines (APX1). The band was most intensely stained in the 75 mM NaCl-acclimated line. In contrast to the control line and the 75 mM NaCl-acclimated line, the 100 mM NaCl-acclimated callus was distinguished by the second APX isoenzyme (APX2). The band representing this isoenzyme was characterized by strong intensity in the 100 mM NaCl-acclimated but was absent in other lines (Figure 6B).
3.5. Class III Peroxidases
POX activity was dependent on the type of the callus culture (F = 142.870, p < 0.001) and the sampling time (F = 117.949, p < 0.001). There was also a significant interaction between these factors (F = 36.632, p < 0.001). During the first three weeks of the culture period, the POX activity was significantly increased in the salt-acclimated lines in a dose–response manner. Compared to the control line, POX activity increased by 46%, 49%, and 146% in the 75 mM NaCl-acclimated line and 155%, 153%, and 175% in the 100 mM NaCl-acclimated line on the 7th, 14th, and 21st day, respectively. The control line displayed a relatively stable level of POX activity over the first three weeks of the culture period. However, the enzyme’s activity increased in the fourth week. The 75 mM NaCl-acclimated line was marked by a gradual increase in the POX activity till the third week after subculture. On the other hand, the POX activity in 100 mM NaCl-acclimated callus reached its maximal level when determined 14 days after subculture. Then, a gradual decrease in its activity occurred (Figure 7A).
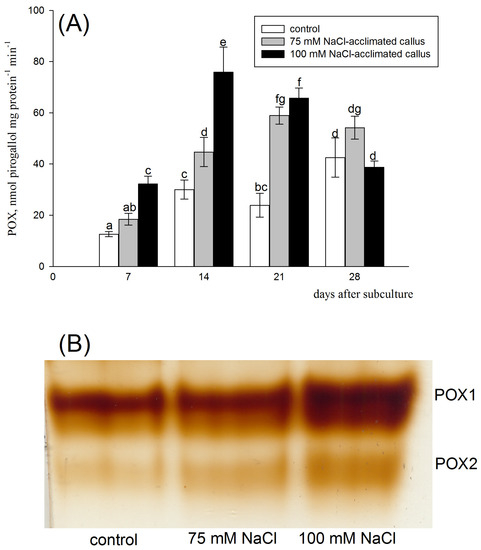
Figure 7.
Class III peroxidase (POX) activity (A) and zymogram analysis of POX isoenzymes (B) in the red beet tuber−derived callus acclimated to 75 (grey bars) or 100 mM NaCl (black bars) or cultured on basal medium (control, white bars). POX activity was assessed after 7, 14, 21, and 28 days of the four−week−long culture period. Different letters denote significant differences at p < 0.05. POX isoenzyme analysis was performed 14 days after subculture.
Soluble peroxidase isoenzyme analysis revealed the presence of two peroxidase isoenzymes in the control line (POX1 and 2). The same soluble peroxidase isoenzymes were present in the salt-acclimated lines, but they were more intensive in these lines, suggesting higher peroxidase activity (Figure 7B).
4. Discussion
Beets are highly salt-tolerant crops. In spite of the recent progress in the field of elucidating the salt-tolerance traits in beets at the morphological, physiological, and molecular levels [36], the complete view of the mechanisms underlying the outstanding salt tolerance in this crop is still far from being accomplished. New experimental systems are required to provide a deeper understanding of the salt tolerance at different levels of the plant’s body. Callus is an unorganized or loosely organized structure [11]. Therefore, we assume that studies on salt-acclimated calli may contribute to deciphering the salt-tolerance mechanism acting solely at the cellular level in the absence of correlative interactions occurring in the highly structured organs and tissues of the intact plant body. Thereafter, the analyses of the salt-acclimated calli may complement the salt tolerance studies performed using entire plants.
Here, we selected salt-tolerant red beet callus lines by gradually increasing salt concentration in the culture medium over subsequent subcultures until 75 or 100 mM NaCl was reached. Then, the culture media supplemented with final salt concentrations was used for a long-term culture. Red pigmentation of cultures proves that they retained the red beet tuber tissue’s capacity for betalain synthesis. However, some differences in pigmentation between the lines suggest that salt treatment may, to some extent, affect pigment composition in the callus (Figure 1). Clarifying the mechanism behind this finding needs further research. Callus growth rate, analyzed over the four-week-long culture period, shows that the growth of salt-acclimated calli was slightly retarded, with respect to the control line, at the beginning of the culture period. However, in subsequent phases of the culture period, the growth increments of the salt-acclimated lines were comparable to the control line (Figure 2). Therefore, we conclude that the NaCl-treated lines achieved tolerance to the salt stress. Several studies were conducted with different plant tissue cultures in order to obtain salinity-resistant cell lines [37]. Similar to our results, the NaCl-tolerant callus, derived from sunflower cotyledons, showed no reductions in growth when grown in the presence of 175 mM NaCl [38]. Previous salt acclimation seems to be mandatory for callus growth on salt-supplemented media. For example, the mung bean callus culture, not adapted to growth on a medium supplemented with 150 mM sodium chloride, showed no signs of growth and died within two weeks. In contrast, the salt-adapted cell lines, transferred to media containing 150 mM NaCl concentration, showed a marked growth of the tissue. However, in this case, the tissue mass was lower compared to the callus cultured in a salt-free medium [39]. Similar results were obtained by comparing the growth of the potato calli, either exposed directly to 50–200 mM NaCl or gradually acclimated to increased NaCl concentrations. Both treatments were effective in selecting tissues acclimated to salinity, but better results were obtained when concentrations of NaCl were gradually added to the medium. Only in the case of callus culture carried on a medium with 200 mM NaCl did the cells not show a clear growth and many of them died after two weeks of the experiment, irrespective of the mode of treatment [40].
Since oxidative stress is a common consequence of salinity, the antioxidant metabolites, ascorbate and glutathione, were investigated in the salt-acclimated and control calli. Data shown in Figure 3A show that negligible differences in ascorbate content between the salt-acclimated and control lines were present in the first half of the cycle period. However, in the second half of the cycle period, the ascorbate content was maintained at elevated levels (especially in the 100 mM NaCl-acclimated callus), whereas the antioxidant content decreased in the control line. This finding suggests that increased ascorbate contents may contribute to salt tolerance in the acclimated lines. Furthermore, ascorbate levels may affect betalain levels in the callus since ascorbic acid is a cofactor of DOPA-dioxygenase, a key enzyme involved in betalain synthesis [41]. It was also suggested that the degradation of betalains during storage is suppressed in the presence of ascorbate [42]. On the other hand, the control line and salt-acclimated lines did not differ in the glutathione content throughout the culture period (Figure 3B). The results of previous studies show that GSH and/or ASC usually increase in plant callus tissues subjected to salinity stress. Studies on calli derived from potato tissues showed a 30% increase in ascorbate concentration in calli adapted to 50 mM NaCl medium compared to the control line, whereas a twofold increase in ASC content was observed in tissues cultured in the presence of 100 mM NaCl [14,40]. Cotton callus accumulated higher concentrations of ascorbate compared to the control line when cultured in a medium with 150 mM NaCl. An increase in glutathione levels relative to the control line was also observed [43]. On the other hand, the salt-tolerant line of sunflower callus contained much less GSH as compared to the callus cultured in the absence of salinity [38].
Proline is a versatile molecule being involved in mitigating salt stress due to its osmoprotectant, antioxidant, and redox-buffering properties [44]. Based on the results of the proline measurement, which show that solely the 100 mM NaCl-acclimated callus accumulates its increased levels (Figure 3C), it can be concluded that the ability to increase proline content under salinity conditions is dependent primarily on the stress intensity, and not on the presence of salt itself. Noteworthy, the proline content attained its highest levels at the beginning of the culture period. Then, its content gradually declines to the minimal values attained at the final phase of the culture cycle (Figure 3C). Possibly, the osmoprotective effect of proline is important at the initial phase of the growth cycle to ensure efficient water and nutrient uptake for intensively growing tissue. The decline of proline concentration in the later phase may be beneficial for callus growth and viability since the high proline may impart toxic effects if over-accumulated or applied exogenously at excessive concentrations [45]. Proline accumulation is a common phenomenon in salt-adapted calli. Salt-adapted and salt-stressed calli of potato accumulated about 10 times more proline than the control [14]. Under salt stress, callus developed from rice seeds accumulated higher levels of proline as compared to the unstressed control conditions [46]. Proline content was strongly enhanced in the soybean callus line selected for salt tolerance [47]. Proline was also accumulated in salt-stressed calli of Salicornia sp. and Guizotia abyssinica [48,49].
The activities of intracellular antioxidant enzymes, namely CAT, SOD, and APX, were markedly enhanced in the salt-acclimated lines, especially in the initial and middle phases of the culture period (Figure 4, Figure 5 and Figure 6). This finding is particularly striking for CAT. The activity of this enzyme, as well as the ones of SOD and APX, was increased, in the salt-acclimated lines, solely in the first week of the culture period. Since CAT has a relatively low affinity for H2O2, the enzyme is an efficient H2O2 scavenger only at high oxidant concentrations [50,51]. High oxidant levels may be present in cells at the beginning of the cycle period, during the first days following subculture onto salt-supplemented medium, when the rapid growth increments occur, whereas CAT activity quickly declines, elevated SOD and APX activities are maintained until the third week of the culture period (Figure 4, Figure 5 and Figure 6). The activities of these enzymes decline in the final phase of the culture period (Figure 4, Figure 5 and Figure 6), when no significant increment in the callus growth occurs (Figure 2).
The rapid growth is promoted by a high metabolic rate. Its side effect is increased ROS production, which is further accelerated if callus cells are grown on salt-containing media [52]. Therefore, the increased activities of the antioxidant enzymes may promote growth on salt-supplemented media by safeguarding normal cell function under salinity, and thus, they contribute to the salt-acclimation mechanism in the red beet callus. In line with our results, increased SOD and APX activities were noticed in mung bean callus tissue, tolerant to 150 mM NaCl. Contrastingly, the activities of these enzymes were decreased and highly inhibited by salt in the callus nonselected for salt tolerance [30]. NaCl-tolerant lines of the eggplant callus showed significantly higher SOD and CAT activities compared to control [15]. In contrast to our results, SOD and APX activities were lower in salt-adapted calli of potato in relation to the control, cultured on salt-free medium [14].
Zymogram analysis of SOD activity revealed the presence of five superoxide dismutase isoforms in red beet calli. Namely, the one representing MnSOD, FeSOD, and two CuZnSOD isoenzymes were distinguished. MnSOD activity was reduced, but FeSOD and CuZnSOD activities were markedly enhanced in the salt-acclimated lines (Figure 4B). Therefore, the increased total SOD activity in the salt-acclimated lines may be attributed to the increase in the activity of FeSOD and CuZnSOD isoenzymes (Figure 4B). The acclimation to salinity enhanced the activity of isoenzymes which were present in the control line, i.e., the salt-acclimation did not change the SOD isoenzyme pattern. A similar situation was observed in the potato callus, where the same SOD isoenzymes were present in the salt-tolerant and the control calli. However, they differed in staining intensity between the adapted and control calli [14]. In contrast to SOD, the APX zymogram pattern analysis revealed a separate isoenzyme (APX2), which was expressed solely in the 100 mM NaCl-acclimated callus. On the other hand, the 75 mM NaCl-acclimated line showed an increased activity of the isoenzyme, represented by the band of the same mobility as in the control line (APX1) (Figure 6B). Therefore, the APX isoenzyme pattern in the red beet salt-acclimated callus is regulated by salt in a salt dose manner. Contrastingly, the native PAGE of the soluble fraction from both control and salt-adapted potato calli showed two bands with the same mobility [14].
Soluble POX activity strongly increased over three weeks following callus subculture in the cell lines acclimated to the saline medium. On the other hand, the POX activity in the control was relatively stable during the culture period. Significant differences in peroxidase activity were found both between the control line and both salinity acclimated lines, as well as between tissues cultured in the presence of 75 and 100 mM NaCl. Enzymatic activity in 100 mM NaCl-acclimated callus was the highest. Analysis of the peroxidase activity of proteins separated by native PAGE was in line with total activity measurements. Two bands corresponding to soluble peroxidase isoenzymes were present in all callus lines, and both appeared with higher staining intensity if extracted from salt-acclimated lines (Figure 7B). High and maintained over the major part of the culture period, peroxidase activity may largely contribute to antioxidant safeguard against salt toxicity in the salt-acclimated calli. The mechanism underlying the role of POX in mitigating oxidative stress in the salt-acclimated red beet callus requires further studies. Possibly, the betalains might be involved in the POX-dependent H2O2 detoxification. Previous research indicates that betalains can act as electron donors for POX to detoxify H2O2 [42,53]. Being abundant in the red beet callus (Figure 1), the betalains may provide the reducing force for the POX-catalyzed H2O2 scavenging parallel to one of the ascorbic acids in the APX-catalyzed reaction. Similar to other antioxidant enzymes, a decrease in POX activity, especially in the 100 mM NaCl-acclimated line, coincided with the transition of the culture to the stationary phase (Figure 7A). Stimulatory effects of salinity on POX activity in plant tissue cultures were usually reported, but POX activity frequently differed, depending on the culture technique and plant species. Salt-adapted tomato suspension culture was characterized by elevated POX activity, but in contrast to our results, maximal enzyme activities were reached during the last days of the growth cycle [54]. The salt-tolerant line of sunflower callus displayed increased POX activity during a 28-day-long culture period [38]. The glutathione peroxidase activity was increased under NaCl treatments in the alcaligrass (Puccinellia tenuifora) callus. However, in this study, the nonsalinity acclimated tissue was used [55]. In the calli derived from halophytic species, such as Salicornia sp., the salt treatments may either increase or decrease POX activities, depending on the plant species [48].
5. Conclusions
We developed two lines of the salt-acclimated red beet callus and determined its growth and several antioxidative parameters after a long-term culture on salt-supplemented media. The study revealed that SOD, CAT, APX, and POX activities were characterized by higher activity values in salinity-acclimated tissues when compared to the control callus cultured on salt-free media. From among the low molecular substances determined in the tested lines, the ascorbate and proline concentrations were increased in the acclimated lines, whereas the glutathione content was at the control level. The enzymatic components of the antioxidant systems and proline content were more pronounced during the initial phases of the culture cycle when the increase in callus fresh mass occurs. An increased level of antioxidant protection contributes to sustaining cell division and cell expansion underlying the red beet callus growth increments under continuous exposition to salinity.
Author Contributions
Conceptualization, J.T.; Methodology, J.T.; Software, N.M.; Validation, N.M.; Formal analysis, N.M.; Investigation, J.T.; Writing—original draft, J.T.; Writing—review & editing, N.M.; Visualization, N.M. All authors have read and agreed to the published version of the manuscript.
Funding
This research received no external funding. The APC was funded by Cells as EXperimental platforms and bioFACTories (CExFact) program running in the Nicolaus Copernicus University in Torun.
Data Availability Statement
Not applicable.
Conflicts of Interest
The authors declare no conflict of interest.
References
- Shrivastava, P.; Kumar, R. Soil salinity: A serious environmental issue and plant growth promoting bacteria as one of the tools for its alleviation. Saudi J. Biol. Sci. 2015, 22, 123–131. [Google Scholar] [CrossRef]
- Dajic, Z. Salt stress. In Physiology and Molecular Biology of Stress Tolerance in Plants; Madhava, R.K., Raghavebdra, A., Reddy, J., Eds.; Springer: Berlin/Heidelberg, Germany, 2006; pp. 41–99. [Google Scholar]
- Munns, R.; Tester, M. Mechanisms of salinity tolerance. Plant Biol. 2008, 59, 651–681. [Google Scholar] [CrossRef] [PubMed]
- Munns, R. Comparative physiology of salt and water stress. Plant Cell Environ. 2002, 25, 239–250. [Google Scholar] [CrossRef] [PubMed]
- Zhu, J. Plant Salt Stress; Wiley: Hoboken, NJ, USA, 2007; pp. 1–3. [Google Scholar]
- Xiong, L.; Schumaker, K.; Zhu, J. Cell signaling during cold, drought, and salt stress. Plant Cell 2002, 14, S165–S183. [Google Scholar] [CrossRef] [PubMed]
- Hasanuzzaman, M.; Nahar, K.; Fujita, M. Plant response to salt stress and role of exogenous protectants to mitigate salt-induced damages. In Ecophysiology and Responses of Plants under Salt Stress; Ahmad, P., Azooz, M.M., Prasad, M.N.V., Eds.; Springer Science & Business Media: Berlin/Heidelberg, Germany, 2013. [Google Scholar]
- Hasegawa, P.M.; Bressan, R.A.; Zhu, J.K.; Bohnert, H.J. Plant cellular and molecular responses to high salinity. Ann. Rev. Plant Physiol. Plant Mol. Biol. 2000, 51, 463–499. [Google Scholar] [CrossRef]
- Gupta, B.; Huang, B. Mechanism of Salinity Tolerance in Plants: Physiological, Biochemical, and Molecular Characterization. Int. J. Genom. 2014, 2014, 701596. [Google Scholar] [CrossRef]
- Rai, M.; Kalia, R.; Singh, R.; Gangola, M.P.; Dhawan, A. Developing stress tolerant plants through in vitro selection—An overview of the recent progress. Environ. Exp. Bot. 2011, 71, 89–98. [Google Scholar] [CrossRef]
- Ikeuchi, M.; Sugimoto, K.; Iwase, A. Plant Callus: Mechanisms of Induction and Repression. Plant Cell 2013, 25, 3159–3173. [Google Scholar] [CrossRef]
- Efferth, T. Biotechnology Applications of Plant Callus Cultures. Engineering 2019, 5, 50–59. [Google Scholar] [CrossRef]
- Fehér, A. Callus, Dedifferentiation, Totipotency, Somatic Embryogenesis: What These Terms Mean in the Era of Molecular Plant Biology? Front. Plant Sci. 2019, 10, 536. [Google Scholar] [CrossRef]
- Queirós, F.; Rodrigues, J.A.; Almeida, J.M.; Almeida, D.P.F.; Fidalgo, F. Differential responses of the antioxidant defense system and ultrastructure in a salt-adapted potato cell line. Plant Physiol. Biochem. 2011, 49, 1410–1419. [Google Scholar] [CrossRef]
- Hannachi, S.; Werbrouck, S.; Bahrini, I.; Abdelgadir, A.; Siddiqui, H.A.; Van Labeke, M.C. Obtaining Salt Stress-Tolerant Eggplant Somaclonal Variants from In Vitro Selection. Plants 2021, 10, 2539. [Google Scholar] [CrossRef] [PubMed]
- Mabry, T.J. Selected topics from forty years of natural products research: Betalains to flavonoids, antiviral proteins, and neurotoxic nonprotein amino acids. J. Nat. Prod. 2001, 64, 1596–1604. [Google Scholar] [CrossRef] [PubMed]
- Fu, Y.; Shi, J.; Xie, S.Y.; Zhang, T.Y.; Soladoye, O.P.; Aluko, R.E. Red Beetroot Betalains: Perspectives on Extraction, Processing, and Potential Health Benefits. J. Agric. Food Chem. 2020, 68, 11595–11611. [Google Scholar] [CrossRef] [PubMed]
- Kapadia, G.J.; Tokuda, H.; Konoshima, T.; Nishino, H. Chemoprevention of lung and skin cancer by Beta vulgaris (beet) root extract. Cancer Lett. 1996, 100, 211–214. [Google Scholar] [CrossRef]
- Kanner, J.; Harel, S.; Granit, R. Betalains—A new class of dietary cationized antioxidants. J. Agric. Food Chem. 2001, 49, 5178–5185. [Google Scholar] [CrossRef]
- Gentile, C.; Tesoriere, L.; Allegra, M.; Livrea, M.A.; D’Alessio, P. Antioxidant betalains from cactus pear (Opuntia ficus-indica) inhibit endothelial ICAM-1 expression. Ann. N. Y. Acad. Sci. 2004, 1028, 481–486. [Google Scholar] [CrossRef] [PubMed]
- Lee, C.H.; Wettasinghe, M.; Bolling, B.W.; Ji, L.L.; Parkin, K.L. Betalains, phase-II enzyme-inducing components from red beetroot (Beta vulgaris L.) extracts. Nutr. Cancer 2005, 53, 91–103. [Google Scholar] [CrossRef]
- Volino-Souza, M.; de Oliveira, G.V.; Conte-Junior, C.A.; Alvares, T.S. COVID-19 Quarantine: Impact of Lifestyle Behaviors Changes on Endothelial Function and Possible Protective Effect of Beetroot Juice. Front. Nutr. 2020, 7, 582210. [Google Scholar] [CrossRef]
- Girod, P.A.; Zryd, J.P. Clonal variability and light induction of betalain synthesis in red beet cell cultures. Plant Cell Rep. 1987, 6, 27–30. [Google Scholar] [CrossRef]
- Girod, P.A.; Zryd, J.P. Secondary metabolism in cultured red beet (Beta vulgaris L.) cells: Differential regulation of betaxanthin and betacyanin biosynthesis. Plant Cell Tissue Organ Cult. 1991, 25, 1–12. [Google Scholar] [CrossRef]
- Murashige, T.; Skoog, F. A Revised Medium for Rapid Growth and BioAssays with Tobacco Tissue Cultures. Physiol. Plant. 1962, 15, 473–497. [Google Scholar] [CrossRef]
- Abraham, E.; Hourton-Cabassa, C.; Erdei, L.; Szabados, L. Methods for Determination of Proline in Plants. Methods Mol Biol. 2010, 20, 317–331. [Google Scholar]
- Bradford, M.M. A rapid and sensitive method for the quantitation of microgram quantities of protein utilizing the principle of protein-dye binding. Anal Biochem. 1976, 7, 248–254. [Google Scholar] [CrossRef]
- Beauchamp, C.; Fridovich, I. Superoxide dismutase: Improved assays and an assay applicable to acrylamide gel. Anal. Biochem. 1971, 44, 276–287. [Google Scholar] [CrossRef]
- Laemmli, U.K. Cleavage of structural proteins during the assembly of the head of bacteriophage T4. Nature 1970, 227, 680–685. [Google Scholar] [CrossRef]
- Rao, M.V.; Paliyath, G.; Ormrod, D.P. Ultraviolet-B- and ozone-induced biochemical changes in antioxidant enzymes of Arabidopsis thaliana. Plant Physiol. 1996, 110, 125–136. [Google Scholar] [CrossRef]
- Guzik, T.J.; Olszanecki, R.; Sadowski, J.; Kapelak, B.; Rudziński, P.; Jopek, A.; Kawczynska, A.; Ryszawa, N.; Loster, J.; Jawien, J.; et al. Superoxide dismutase activity and expression in human venous and arterial bypass graft vessels. J. Physiol. Pharmacol. 2005, 56, 313–323. [Google Scholar]
- Veljovic-Jovanovic, S.; Kukavica, B.; Stevanovic, B.; Navari-Izzo, F. Senescence- and drought-related changes in peroxidase and superoxide dismutase isoforms in leaves of Ramonda serbica. J. Exp. Bot. 2006, 57, 1759–1768. [Google Scholar] [CrossRef]
- Miszalski, Z.; Ślesak, I.; Niewiadomska, E.; Baczek-Kwinta, R.; Lüttge, U.; Ratajczak, R. Subcellular localization and stress responses of superoxide dismutase isoforms from leaves in the C3-CAM intermediate halophyte Mesembryanthemum crystallinum L. Plant Cell Environ. 1998, 21, 169–179. [Google Scholar] [CrossRef]
- Chen, G.-X.; Asada, K. Ascorbate Peroxidase in Tea Leaves: Occurrence of Two Isozymes and the Differences in Their Enzymatic and Molecular Properties. Plant Cell Physiol. 1989, 30, 987–998. [Google Scholar]
- Mittler, R.; Zilinskas, B.A. Detection of ascorbate peroxidase activity in native gels by inhibition of the ascorbate-dependent reduction of nitroblue tetrazolium. Anal. Biochem. 1993, 212, 540–546. [Google Scholar] [CrossRef] [PubMed]
- Yolcu, S.; Alavilli, H.; Ganesh, P.; Panigrahy, M.; Song, K. Salt and Drought Stress Responses in Cultivated Beets (Beta vulgaris L.) and Wild Beet (Beta maritima L.). Plants 2021, 10, 1843. [Google Scholar] [CrossRef] [PubMed]
- Gandonou, C.B.; Errabii, T.; Abrini, J. Selection of callus cultures of sugarcane (Saccharum sp.) tolerant to NaCl and their response to salt stress. Plant Cell Tissue Organ Cult. 2006, 87, 9–16. [Google Scholar] [CrossRef]
- Davenport, S.B.; Gallego, S.M.; Benavides, M.P. Behaviour of antioxidant defense system in the adaptive response to salt stress in Helianthus annuus L. cells. Plant Growth Regul. 2003, 40, 81–88. [Google Scholar] [CrossRef]
- Rao, S.; Patil, P. In Vitro Selection of Salt Tolerant Calli Lines and Regeneration of Salt Tolerant Plantlets in Mung Bean (Vigna radiata L. Wilczek). In Biotechnology—Molecular Studies and Novel Applications for Improved Quality of Human Life; Sammour, R., Ed.; IntechOpen: London, UK, 2012. [Google Scholar]
- Queirós, F.; Fidalgo, F.; Santos, I. In vitro selection of salt tolerant cell lines in Solanum tuberosum L. Biol. Plant. 2007, 51, 728–734. [Google Scholar] [CrossRef]
- Sasaki, N.; Abe, Y.; Goda, Y.; Adachi, T.; Kasahara, K.; Ozeki, Y. Detection of DOPA 4,5-Dioxygenase (DOD) Activity Using Recombinant Protein Prepared from Escherichia coli Cells Harboring cDNA Encoding DOD from Mirabilis jalapa. Plant Cell Physiol. 2009, 50, 1012–1016. [Google Scholar] [CrossRef]
- Sakihama, Y.; Yamasaki, H. Phytochemical Antioxidants: Past, Present and Future. IntechOpen 2021. [Google Scholar] [CrossRef]
- Gossett, D.R.; Millhollon, E.P.; Lucas, M.C.; Banks, S.W.; Marney, M.M. The effects of NaCl on antioxidant enzyme activities in callus tissue of salt-tolerant and salt-sensitive cotton cultivars (Gossypium hirsutum L.). Plant Cell Rep. 1994, 13, 498–503. [Google Scholar] [CrossRef]
- Szabados, L.; Savoure, A. Proline: A Multifunctional Amino Acid. Trends Plant Sci. 2009, 15, 89–97. [Google Scholar] [CrossRef]
- Hayat, S.; Hayat, Q.; Alyemeni, M.N.; Wani, A.S.; Pichtel, J.; Ahmad, A. Role of proline under changing environments: A review. Plant Signal. Behav. 2012, 11, 1456–1466. [Google Scholar] [CrossRef] [PubMed]
- Summart, J.; Thanonkeo, P.; Panichajakul, S.; Prathepha, P. Effect of salt stress on growth, inorganic ion and proline accumulation in Thai aromatic rice, Khao Dawk Mali 105, callus culture. Afr. J. Biotechnol. 2010, 9, 145–152. [Google Scholar]
- Liu, T.; van Staden, J. Selection and characterization of sodium chloride-tolerant callus of Glycine max (L.) Merr cv. Acme. Plant Growth Regul. 2000, 31, 195–207. [Google Scholar] [CrossRef]
- Torabi, S.; Niknam, V. Effects of Iso-osmotic Concentrations of NaCl and Mannitol on some Metabolic Activity in Calluses of Two Salicornia species. In Vitro Cell. Dev. Biol.-Plant 2011, 47, 734–742. [Google Scholar] [CrossRef]
- Ghane, S.G.; Lokhande, V.; Nikam, T. Growth, physiological, and biochemical responses in relation to salinity tolerance for In Vitro selection in oil seed crop Guizotia abyssinica Cass. J. Crop Sci. Biotech. 2014, 17, 11–20. [Google Scholar] [CrossRef]
- Mittler, R.; Zilinskas, B.A. Purification and characterization of pea cytosolic ascorbate peroxidase. Plant Physiol. 1991, 97, 962–968. [Google Scholar] [CrossRef]
- König, J.; Baier, M.; Horling, F.; Kahmann, U.; Harris, G.; Schürmann, P.; Dietz, K.J. The plant-specific function of 2-Cys peroxiredoxin-mediated detoxification of peroxides in the redox-hierarchy of photosynthetic electron flux. Proc. Natl. Acad. Sci. USA 2002, 99, 5738–5743. [Google Scholar] [CrossRef]
- Niknam, V.; Meratan, A.A.; Ghaffari, S.M. The effect of salt stress on lipid peroxidation and antioxidative enzymes in callus of two Acanthophyllum species. In Vitro Cell. Dev. Biol.-Plant 2011, 47, 297–308. [Google Scholar] [CrossRef]
- Allegra, M.; Tesoriere, L.; Livrea, M.A. Betanin inhibits the myeloperoxidase/nitrite-induced oxidation of human low-density lipoproteins. Free Rad. Res. 2007, 41, 335–341. [Google Scholar] [CrossRef]
- Sancho, M.A.; de Forchetti, S.M.; Pliego, F.; Valpuesta, V.; Quesada, M.A. Peroxidase activity and isoenzymes in the culture medium of NaCl adapted tomato suspension cells. Plant Cell Tissue Organ Cult. 1996, 44, 161–167. [Google Scholar] [CrossRef]
- Zhang, Y.; Zhang, Y.; Yu, J.; Zheng, H.; Wang, L.; Wang, S.; Guo, S.; Miao, Y.; Chen, S.; Li, Y.; et al. NaCl-responsive ROS scavenging and energy supply in alkaligrass callus revealed from proteomic analysis. BMC Genom. 2019, 20, 990. [Google Scholar] [CrossRef] [PubMed]
Disclaimer/Publisher’s Note: The statements, opinions and data contained in all publications are solely those of the individual author(s) and contributor(s) and not of MDPI and/or the editor(s). MDPI and/or the editor(s) disclaim responsibility for any injury to people or property resulting from any ideas, methods, instructions or products referred to in the content. |
© 2023 by the authors. Licensee MDPI, Basel, Switzerland. This article is an open access article distributed under the terms and conditions of the Creative Commons Attribution (CC BY) license (https://creativecommons.org/licenses/by/4.0/).