Article

Analyzing the Impact of Intensive Agriculture on Soil Quality: A Systematic Review and Global Meta-Analysis of Quality Indexes

by
Héctor Iván Bedolla-Rivera
1,
María de la Luz Xochilt Negrete-Rodríguez
1,2,
Francisco Paúl Gámez-Vázquez
3,
Dioselina Álvarez-Bernal
4 and
Eloy Conde-Barajas
1,2,*
1
Departamento de Posgrado de Ingeniería Bioquímica, TNM/IT de Celaya, Ave. Tecnológico y A. García Cubas No. 600, Celaya 38010, Guanajuato, Mexico
2
Departamento de Ingeniería Bioquímica y Ambiental, TNM/IT de Celaya, Ave. Tecnológico y A. García Cubas No. 600, Celaya 38010, Guanajuato, Mexico
3
Campo Experimental Bajío, INIFAP, Carretera Celaya San Miguel de Allende Kilómetro 6.5, Celaya 38010, Guanajuato, Mexico
4
Instituto Politécnico Nacional, Centro Interdisciplinario de Investigación Para el Desarrollo Integral Regional, Unidad Michoacán, Justo Sierra No. 28, Centro, Jiquilpan 59510, Michoacán, Mexico
*
Author to whom correspondence should be addressed.
Agronomy 2023, 13(8), 2166; https://doi.org/10.3390/agronomy13082166
Submission received: 13 July 2023 / Revised: 9 August 2023 / Accepted: 15 August 2023 / Published: 18 August 2023

Abstract

:
As the global population grows, the demand for food increases and puts a strain on food production systems and agricultural productivity, causing soil degradation. Soil quality indexes (SQIs) have been developed to maintain and improve soil quality. However, due to the variety of soils and SQIs, analyzing and comparing results has historically been difficult. Therefore, in this study, we carried out a systematic review with meta-analysis focused on soil quality studies of agricultural soils under intensive agriculture using the unified weighted additive SQI methodology (SQIU). Sixty-five observations of agricultural soil quality were analyzed. Chemical indicators were the most prevalent in the SQIUs, followed by physical and biological indicators. Conventional soil management had negative effects on soil quality (–7.55%). From the factors analyzed, the minimum database had a significant effect on the soil quality results, but not the number of indicators that made up the SQIU. The SQIU made up of chemical–biological indicators (CB) presented negatively overestimated measurements of soil quality (–32.53%), exaggerating the degradation of the analyzed soils. The indicators that correlated most strongly with the size of the effect on agricultural soil quality were the cation exchange capacity (CEC) and microbial biomass carbon (MBC). The SQIU is a feasible tool to interpret the quality of agricultural soils around the world, as it makes it possible to obtain a simple and generalized view of soil conditions.

1. Introduction

The growing population and a shift towards high-consumption markets have increased pressure on the food production chain, resulting in a need for larger areas of cultivation to meet the population’s nutritional needs [1]. This change in land use is a concern for government authorities who implement measures to improve and maintain agricultural productivity through the technification of conventional agricultural work in intensive agriculture. However, these measures have resulted in the emergence or escalation of soil-degrading processes [2,3]. Some intensive agricultural activities implement inadequate soil management practices, such as the cultivation of monocultures and the excessive and inadequate use of chemical fertilizers and pesticides, reducing soil biodiversity and provoking leaching processes, the eutrophication of aquifers due to runoff phenomena, and salinization/acidification [4]. In addition, excessive or deep plowing of the soil—which leads to the loss of soil structure and organic matter (OM)—increases the vulnerability of the soil to water and wind erosion [5].
Soil degradation has a significant impact on the physical, chemical, and biological properties of the soil. Physical degradation manifests itself through negative changes in soil structure, such as increased compaction and drainage problems. Chemical degradation is associated with acidification or alkalinization processes, which are caused by changes in the concentration of salts, as well as an increase in heavy metals and hydrocarbons. Lastly, biological degradation is related to the loss of natural cover, resulting in a decrease in OM and increased susceptibility to erosion [6]. In order to measure the degree of degradation of a soil, the concept of soil quality arises, which varies depending on the use of the soil. Focusing on agricultural soils and their productivity, the concept of soil quality refers to the ability of a specific soil type to function within the limits of natural or managed ecosystems, to maintain plant and animal productivity, to maintain or improve water and air quality, and to support health and habitation [7].
Decision-makers and soil science experts are aware of the inadequate conventional agricultural activities mentioned above. Consequently, monitoring systems have been developed and implemented in various geographic areas. These systems range from the analysis of individual properties or indicators to the implementation of integrated monitoring systems using soil quality indexes (SQIs) [8,9]. Three categories of indicators, physical, chemical, and biological, are used to evaluate soil quality. Physical indicators consider particle and pore structure, such as texture, bulk density (BD), porosity, aggregates, crusts, compaction, and depth. Chemical indicators analyze nutrient dynamics, carbon (C), and nitrogen (N) cycling, and chemical reactions, including soil hydrogen potential (pH), salinity, aeration, OM, cation exchange capacity (CEC), nutrients, toxic elements, and buffering capacity. Biological indicators, which are highly sensitive to change, include microorganisms, meso and macroorganisms, respiration, organic C and N, microbial biomass, and soil enzyme activity [7].
An SQI is a tool consisting of a set of properties or indicators closely related to the phenomena to be monitored. This tool allows for synthesizing valuable information for decision-making [10]. There are different types of methodologies for the establishment of SQIs, such as the following: expert opinion indexes (SQIEO), which use the empirical knowledge of trained personnel for the selection and degree of importance of the indicators to be included [11,12]; additive indexes (SQIA), which analyze the indicators, considering them to have linear behavior [11,12]; weighted additive indexes (SQIW), which use weights previously established by experts in the indicators to be included [11,12]; Nemoro indexes (SQIN), used in soil quality studies around the world [11,12]; and unified weighted additive indexes (SQIU), which establish the weights of the indicators based on statistical techniques. SQIW and SQIU are the most used in agricultural soils, and their application depends largely on those responsible for monitoring [11,12]. However, the SQIW methodology can result in the selection of indicators that do not correlate with the problem or phenomenon to be studied, since it is based on indicators previously established. In contrast, the SQIU methodology is not influenced by human subjectivity, and thus allows for the mathematical selection of those indicators that are most closely linked to the problem or phenomenon of interest. This guarantees a more precise selection of relevant indicators. For this reason, it was decided that the SQIU methodology would be used in this study.
To date, the only study focused on analyzing the methodologies and characteristics of the different SQIs developed on a global scale is a systematic review carried out by Sarmiento et al. (2018) [12]. They analyzed 70 research works published from 2001 to 2017, and identified 32 SQIs developed using various methodologies and study areas. Their analysis concluded that reliable indexes should include the following indicators: microbial biomass carbon (MBC), nitrogen (N) mineralization potential, soil pH, electrical conductivity (EC), CEC, porosity, BD, and hydraulic conductivity (HC).
As previously stated, due to various factors involved in soil formation—e.g., parent material, topography, climate, and agricultural practices in the region—there is no consensus on a generalized SQI, or the number and type of indicators it should include. This heterogeneity makes it challenging to compare SQIs developed globally and establish standardized measurements or observations of soil quality. To address this issue, a systematic review with meta-analysis was conducted on a global scale, specifically focusing on studies that used the SQIU methodology for soil quality monitoring. The objectives of this study were to (i) determine the global impact of intensive agricultural practices on the quality of soils, and to (ii) investigate any potential effects on soil quality observations depending on factors such as the database used, and the number and type of indicators included in the SQIU. It was hypothesized that intensive agricultural practices have a negative impact on soil quality, and that there is a significant effect on quality observations based on the type of database used and the number and type of indicators included in the different SQIUs developed.

2. Material and Methods

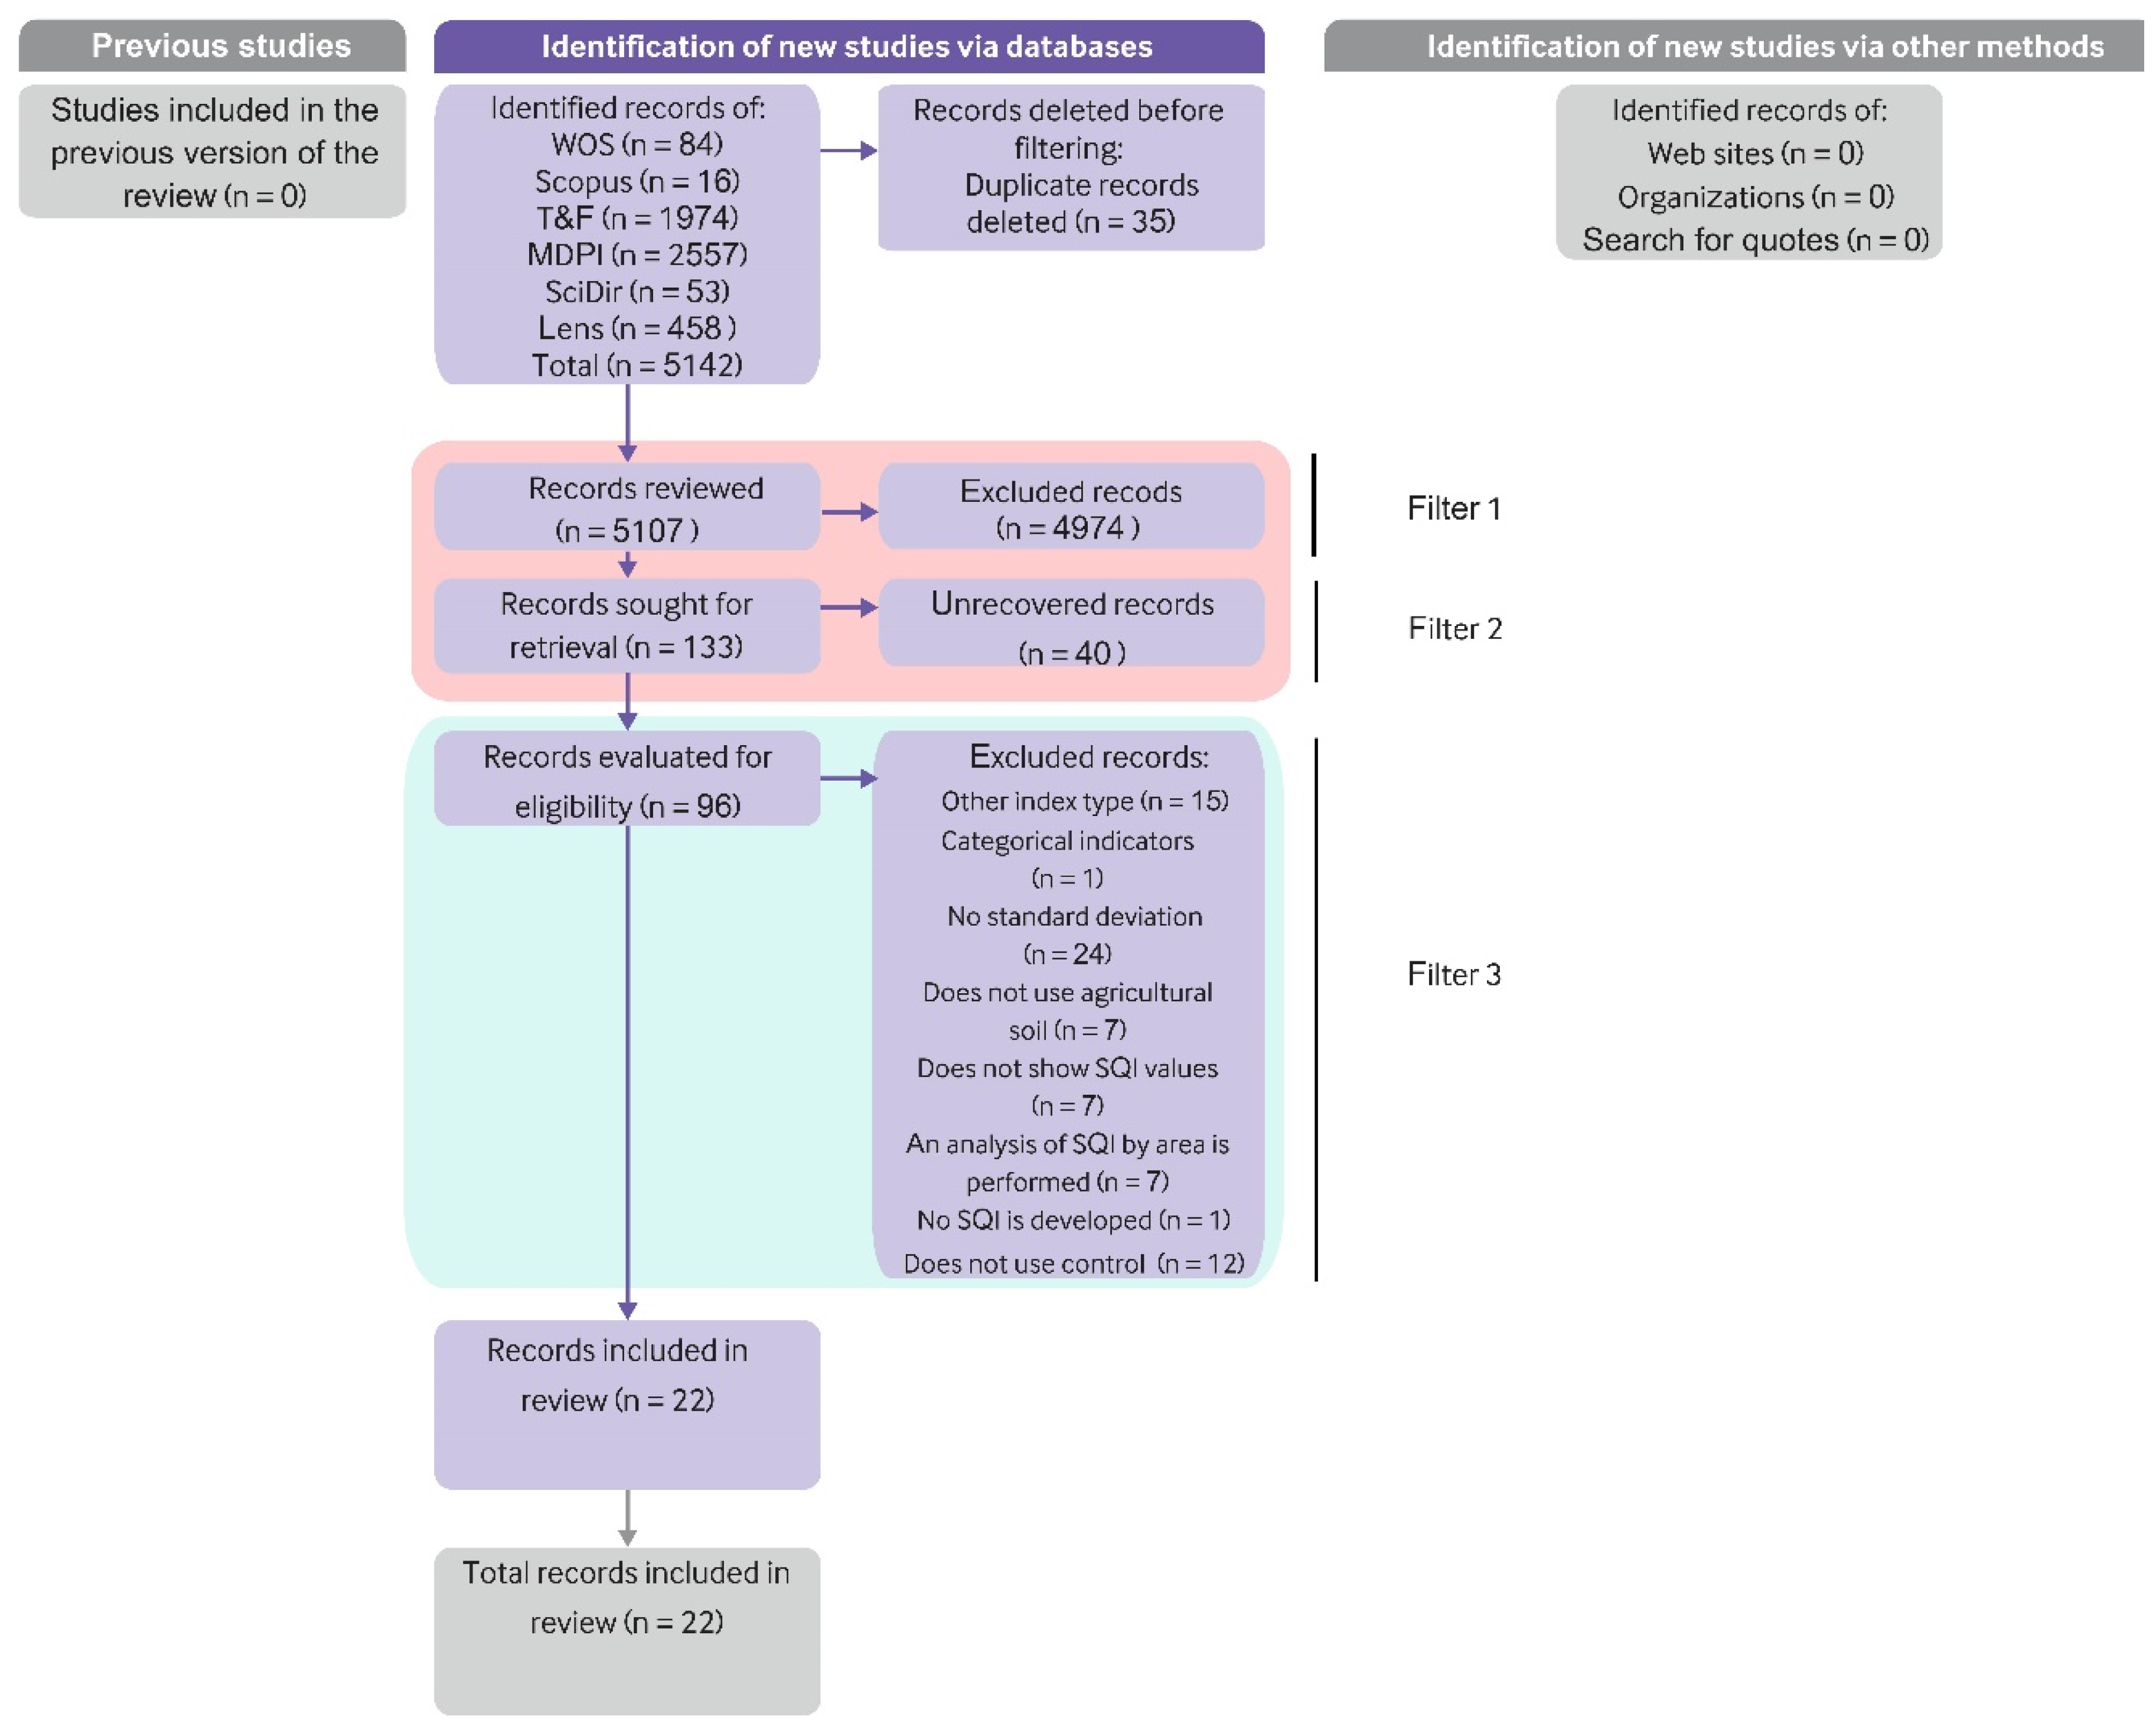
2.1. Systematic Review

A literature search was conducted to find experimental studies that developed SQIs in intensive agricultural soils employing the SQIU methodology. The databases used are presented in Table 1.
Google Analytics tools were used to identify the most frequently used keywords related to the topic of soil quality in agricultural soils, finally selecting “soil quality index”, “agricultural soil”, “principal component analysis”, and “unified weighted additive index”. With the keywords and synonyms, the search equation to be used in the databases from Table 1 was established as follows: (soil quality index OR SQI) AND (agricultural soil) AND (PCA OR principal components analysis OR unified weighted additive index). Boolean operators were also used to obtain more accurate results in the search process.
The articles were selected through a three-step filtering process, which was independently carried out by three members of the research team. For the first filter, every article had to meet several criteria, including containing at least one of the selected keywords in the title or abstract, being a research article (not a review), and having a DOI. The second filter required the articles to be published in English between 2011 and 2021. After applying the second filter, the articles were downloaded. If an article could not be downloaded, the corresponding author was contacted for assistance. Finally, for the third filter, articles had to meet specific requirements, such as including quantitative (numerical) soil indicators (physical, chemical, or biological), providing statistical information (including the standard deviation and mean), using experimental controls during the research, and presenting sufficient data to calculate these parameters, using Equation (1). By applying these three filters, we were able to select the most relevant and appropriate articles for our study [13].
S D j = x ¯ i i k S D i i k x i ¯
where x i ¯ is the mean of the control group or treatments used, and S D is the standard deviation of the control group or treatments.
Articles that did not meet the criteria during the filtering process were excluded. At the end of the filtering process, the members of the research team who participated in the selection compared their databases, and those articles that were present in the three databases were selected, thereby forming a single database.

2.2. Data Collection

In this study, the target variables (the variables on which the meta-analysis focused) were the soil quality observations obtained through the SQIU developed in each study. Additionally, all the studied indicators related to the condition of the soil (physical, chemical, and biological indicators) were selected as secondary variables. To gather data, mean and standard deviation information for both the target and secondary variables was collected from the tables of results and figures, or calculated from the articles. The information extracted from the figures was obtained using the software Engauge Digitizer 12.2.1 (https://markummitchell.github.io/engauge-digitizer/) (accessed on 15 August 2023) [14]. Data collection and database building were carried out independently by three members of the research team. When creating the databases, the research team only considered scientific articles that focused on “agricultural” land uses. In the case of articles that involved soil samples taken at different depths, only those from “0 to 30 cm depth” were considered. Similarly, if the articles compared different methods for generating SQIs, only observations that utilized the “SQIU” methodology were considered. In addition, the team converted the units of quantitative variables to the most used units in publications related to the topic of analysis. At the end of the process, these databases were compared to create a final database.

2.3. Statistical Analysis

Analyses were performed using R statistical software version 4.0.5 [15]. First, we performed a descriptive analysis of the selected studies to determine the year of publication, geographic location, and frequency of indicators in the various SQIUs developed. For the systematic review, a publication bias test was performed with an Egger’s symmetry test featuring a significance level of p 0.05 . At the same time, the fail-safe number (Nfs) technique was applied, with a significance level of p 0.05 [16]. The Nfs measures the robustness of meta-analysis results by determining the number of omitted observations required to refute the conclusions of the analysis. A meta-analysis was then performed using the statistical packages Metafor [17], Metaviz [18], Puniform [19], and Robumeta [20]. The natural logarithm of the response ratio ( l n R R ) —defined as the “effect size”—was used to measure the effect caused by intensive agricultural activity on soil quality, obtained through the various SQIUs developed. We also analyzed the factors of the type of database used (total database and minimum database), the number of indicators that made up the SQIUs (less than or equal to five and more than five), as well as the type of indicators (chemical, physical, and biological). The l n R R of each observation was calculated using Equation (2) [16,21].
l n R R = l n x t x c
where l n R R is the natural logarithm of the response ratio or effect size, and x t and x c are the mean values of the treatments and control group, respectively.
The variance of the effect size ( ν ) was calculated using Equation (3) [16,22].
v = s t 2 n t x t 2 + s c 2 n c x c 2
where n t and n c represent the sample size of the treatment and control groups, respectively; s t and s c represent the standard deviations ( S D = S E n ) of the treatment and control groups, respectively; and S E represents the standard error.
The inverse of ν was used to obtain the weight factor ( w ) using Equation (4) [21].
w = 1 v
The w was used to calculate the average effect size l n R R ¯ for all observations according to Equations (5) and (6) [22]:
l n R R = w × l n R R
l n R R ¯ = l n R R w
Using Equation (7), we obtained the percentage values of the l n R R ¯ , which were used to express the effects of the different observations [21].
P e r c e n t a g e   % = e x p l n R R ¯ 1 × 100
In addition, a “random effects” model was used to determine whether the values of the l n R R ¯ were significant. To determine the 95% confidence intervals (CI), a bootstrapping test was performed with 999 iterations. If the CI of the values of the l n R R ¯ did not cross the zero-effect line, the effects were considered significant ( p 0.05 ) .

2.3.1. Metaregression

The relationship between the various indicators that made up the developed SQIUs was analyzed, selecting those indicators whose frequency of integration was five or more. A minimum number of at least six observations per indicator in the various studies was taken into consideration [13].

2.3.2. Metamodeling

To select models that best explain the variability of the values of the l n R R ¯ of the various observations, we used combinations of two indicators closely correlated with the l n R R ¯ , without considering interactions between them. To determine which of the developed models was the best to predict the l n R R ¯ , the corrected Akaike information criterion (AICc) and the Bayesian information criterion (BIC), as well as the marginal coefficient of determination ( R 2 ) , were used at a significance level of p ≤ 0.05 as a metric of the a measure of a model’s relative quality compared to other models [13].

3. Results and Discussion

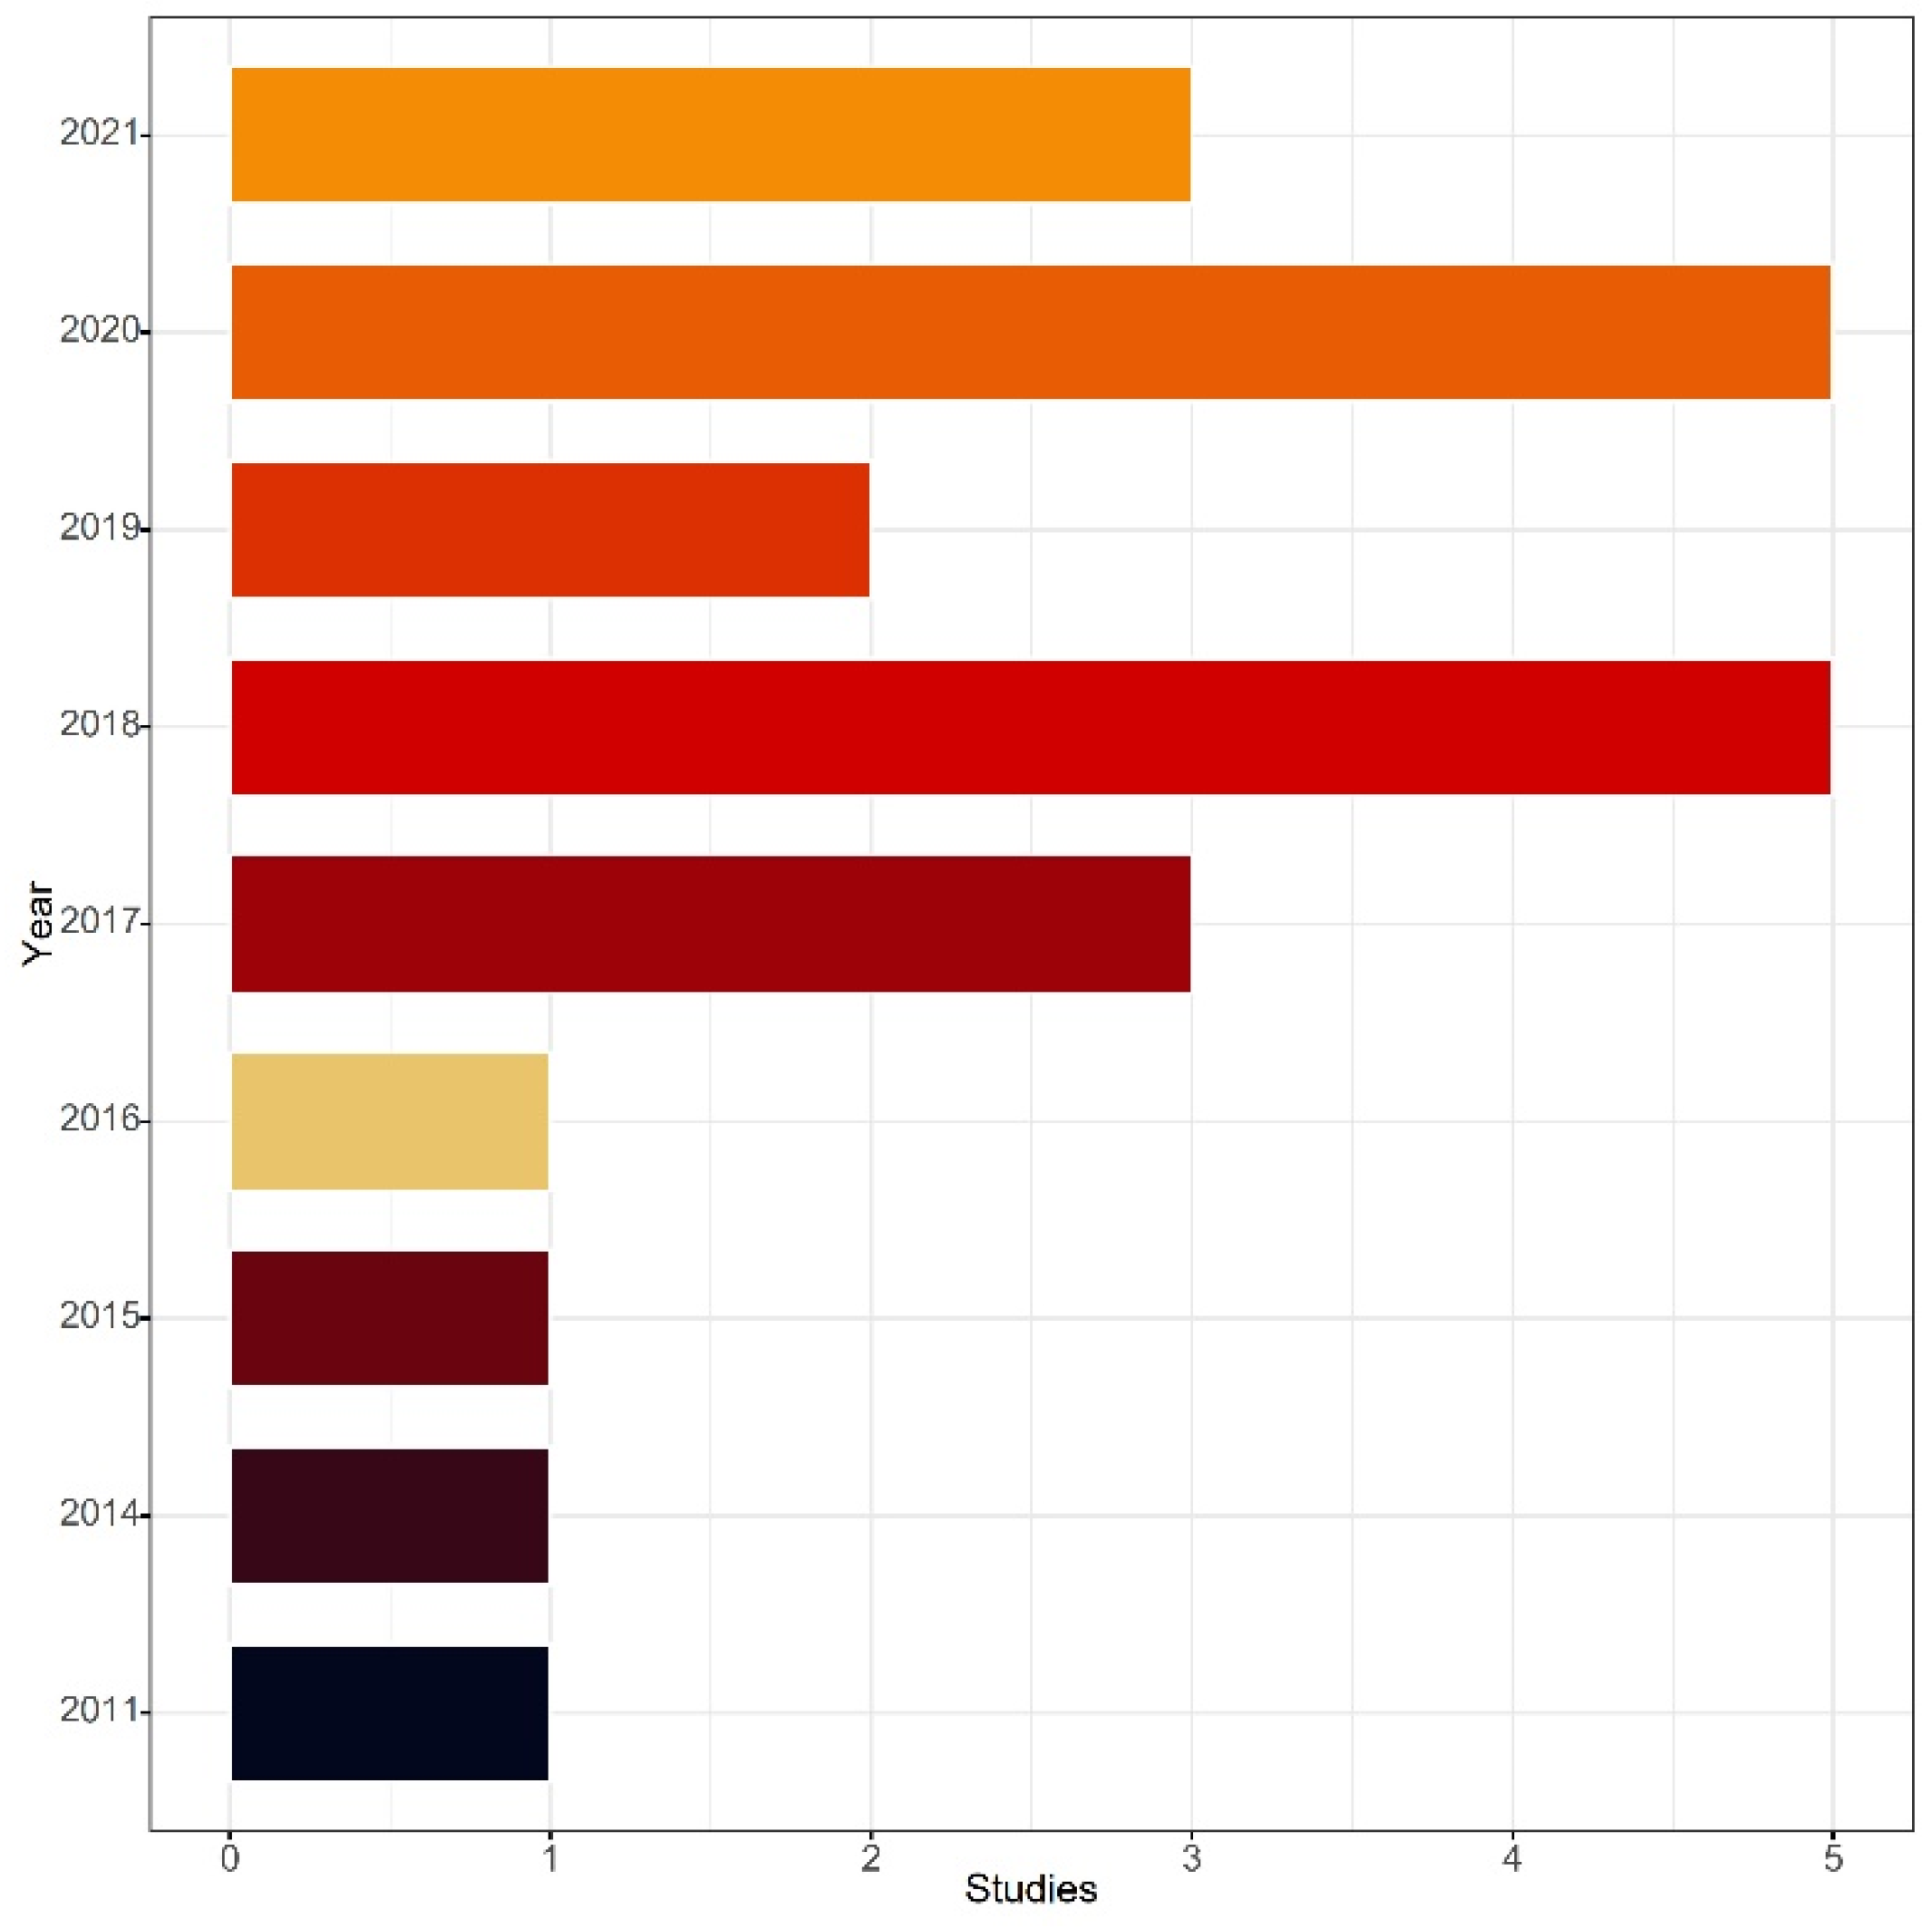
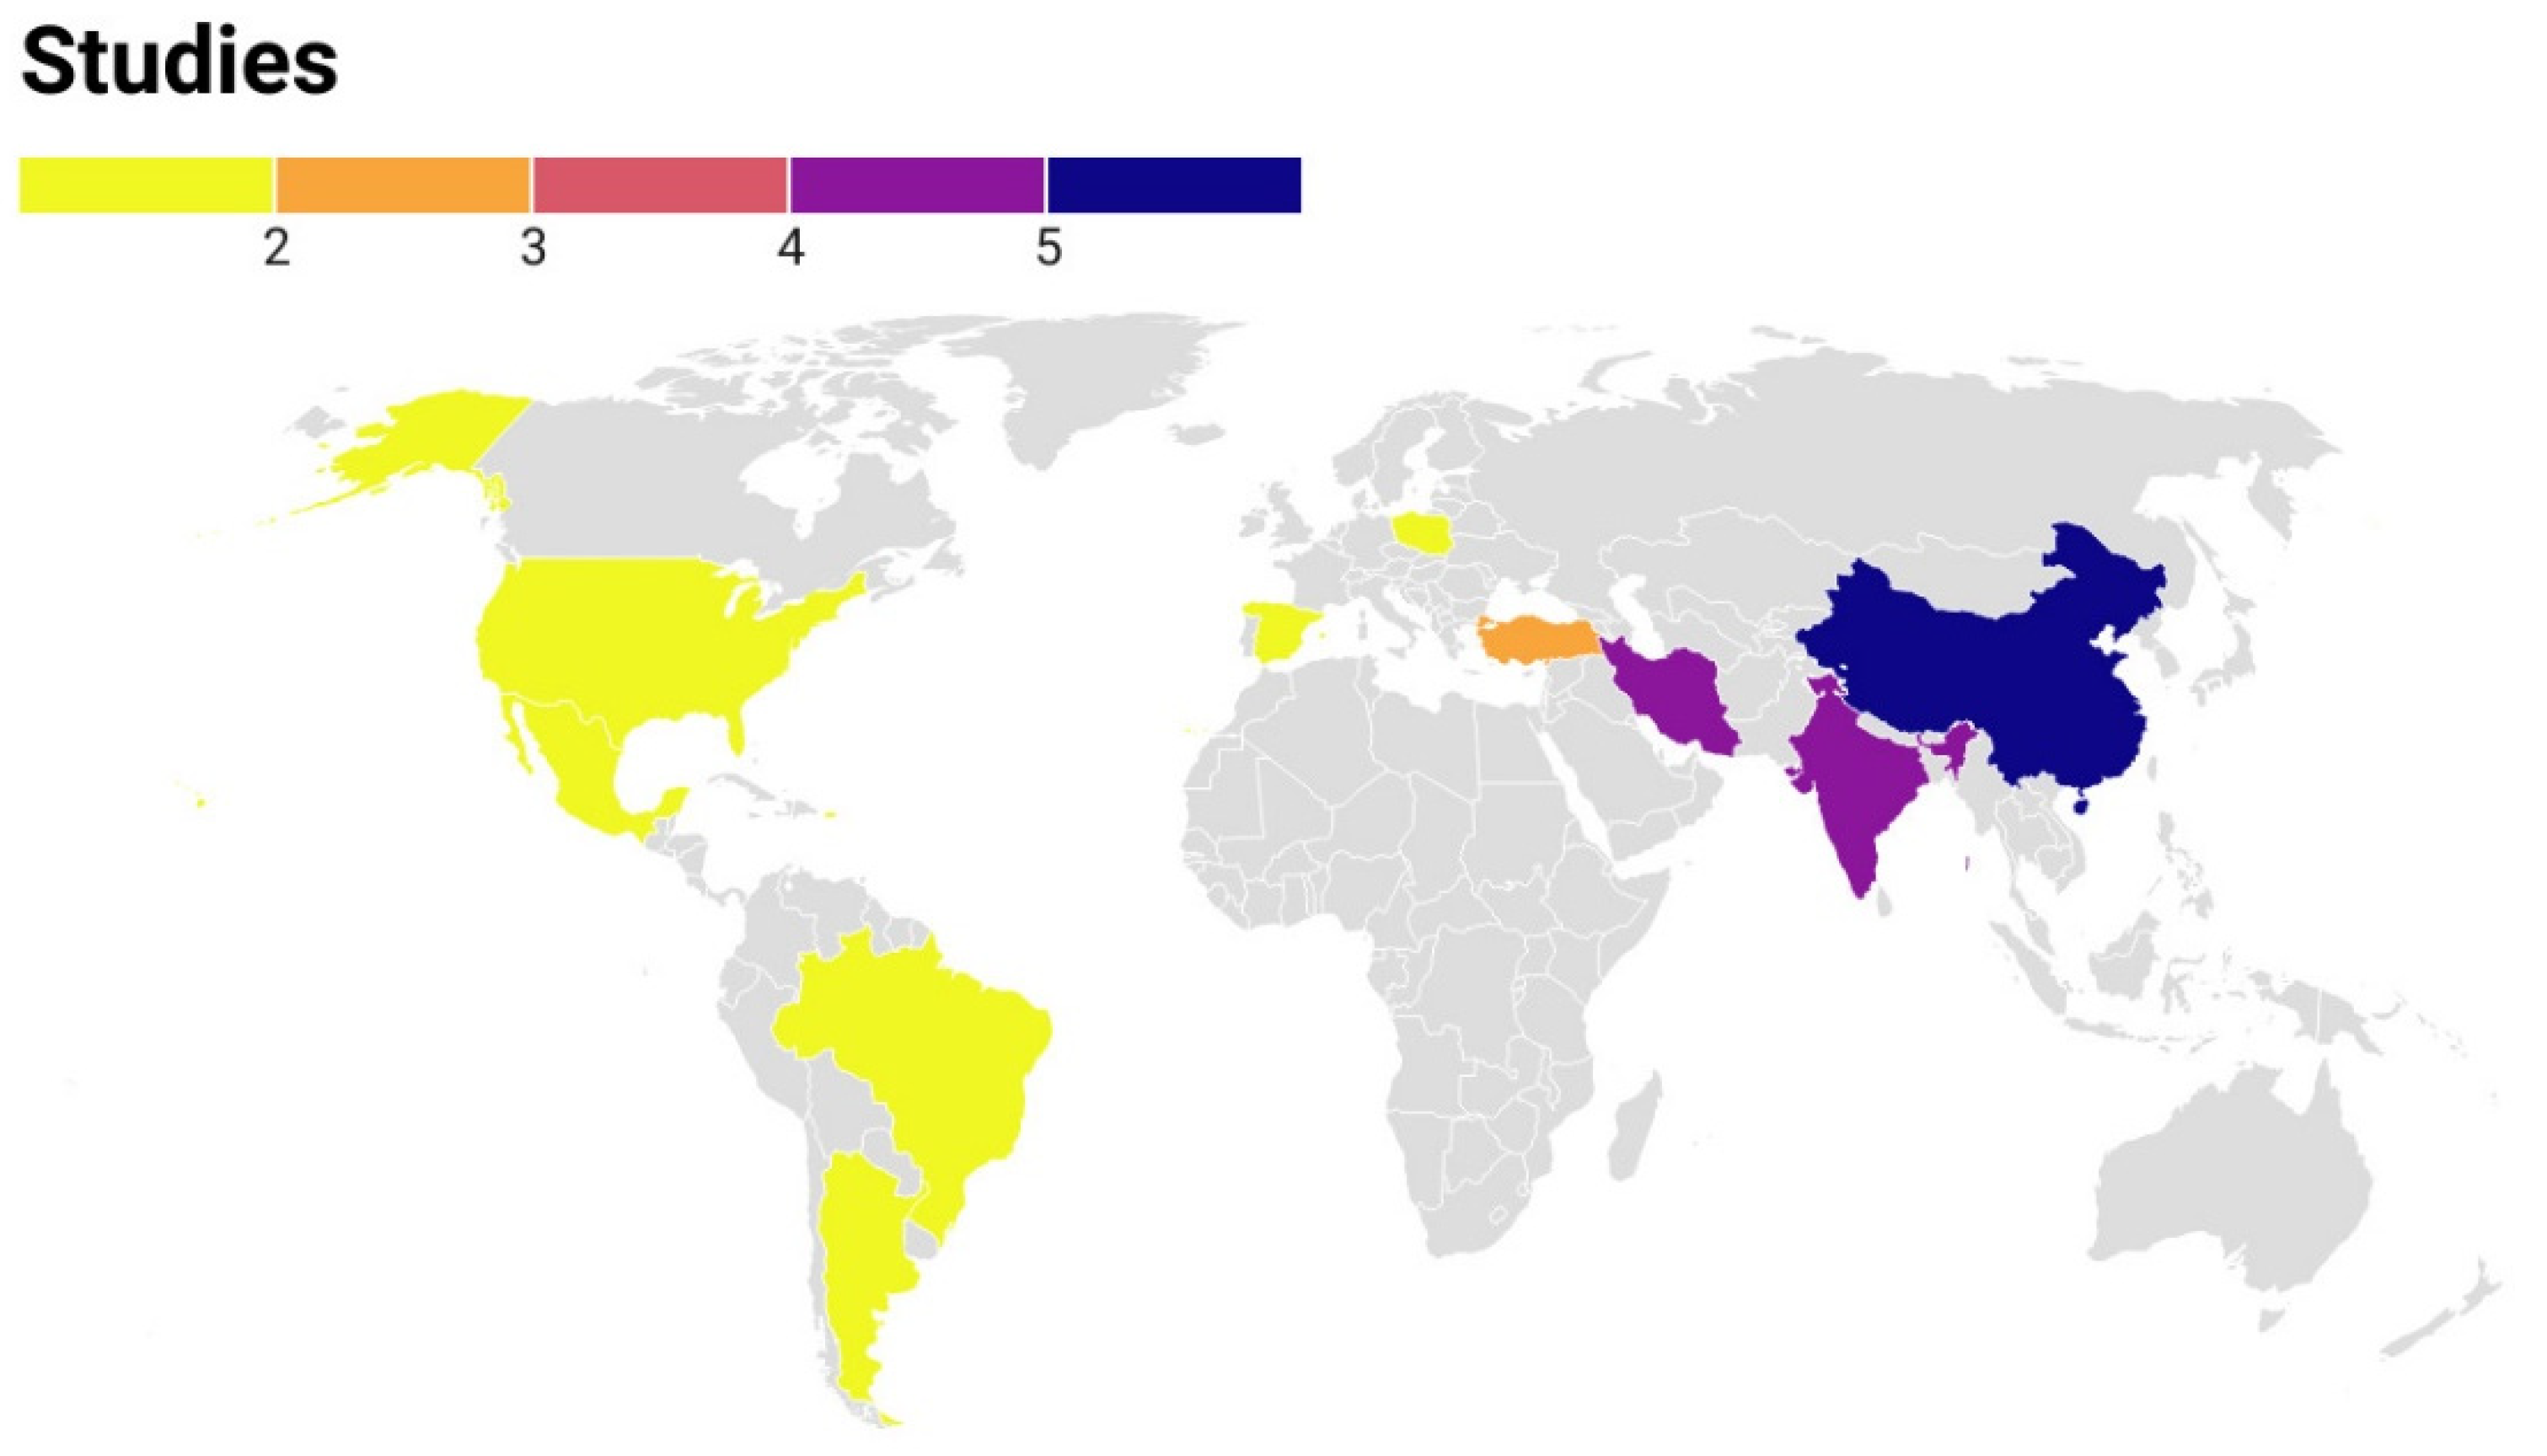
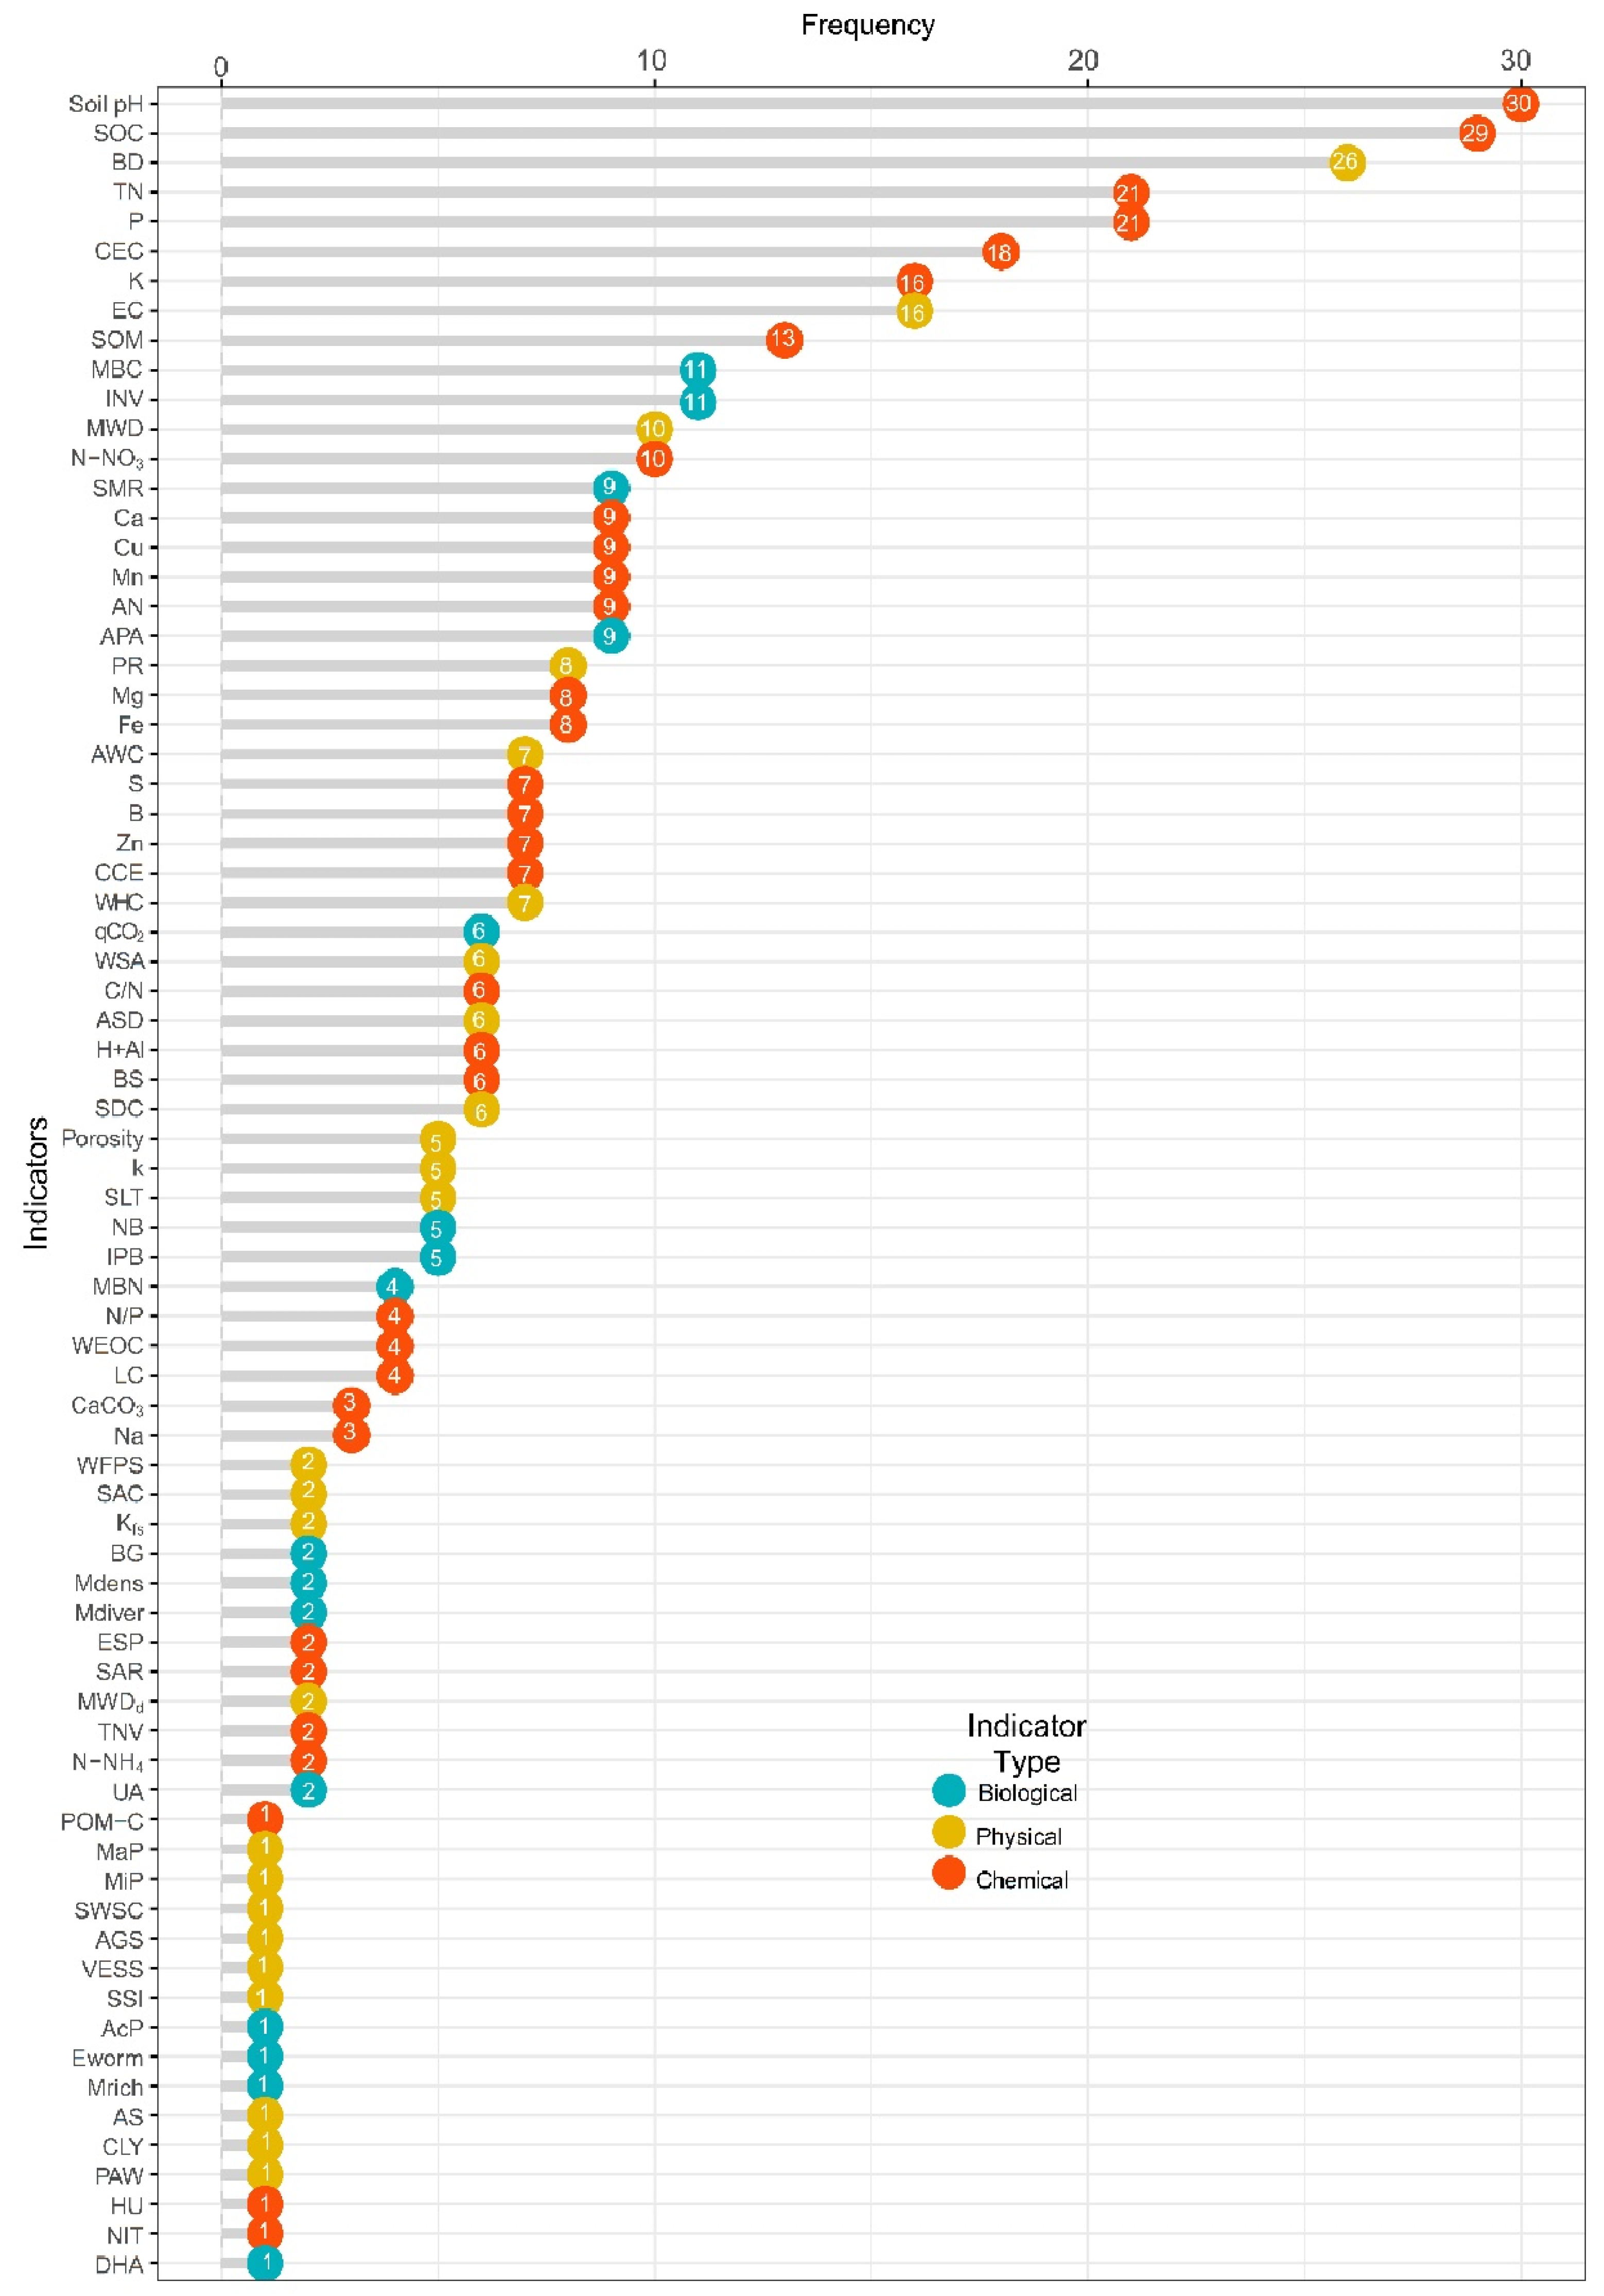
3.1. A Systematic Review and Descriptive Analysis

Of the 5142 articles analyzed, 22 were selected and added to the final database (Table S1). Figure 1 illustrates the articles compiled from several searches performed in different databases (Table 1) and the filtering process. The database included 65 quality observations on agricultural soil quality obtained from the SQIUs developed in the 22 selected articles. Most of the selected articles were published after 2017, with 2018 and 2020 being the years with the highest number of scientific article publications (Figure 2). Most of the published articles were from the Asian continent, with China being the country with the highest scientific output in the development of SQIUs (Figure 3). This fact could be attributed to China’s policies on food security for its growing population, which present a need for scientific knowledge to maintain and improve the quality of agricultural soils in certain areas and traditional crops [23]. The present study found that in Latin America—specifically in Mexico, Argentina, and Brazil—there was only one research study focused on the development of SQIUs [24,25,26], which suggests that there is a lack of technical knowledge and expertise in this field in these countries. During the selection process of articles for the final database, it was found that most articles were not included due to the absence of important statistical information—such as S D or S E —and the lack of controls for the treatments. This highlights the importance of using appropriate experimental designs and open science practices—e.g., creating open databases—to ensure the proper presentation and accessibility of research results.
Of the indicators that made up the various SQIUs developed in the selected studies, chemical indicators were the most used, followed by physical indicators, and finally biological indicators (Figure 4). This finding is consistent with Sarmiento et al. (2018) [12] who through a systematic review reached the same conclusions on the use of the types of indicators in the SQIs developed worldwide. The indicators that most frequently composed the SQIUs were soil pH and soil organic C (SOC), both belonging to the type of chemical indicators.
Researchers have often used chemical and physical indicators to assess soil conditions, as some of the physical indicators are simple to use and do not require extensive training or sophisticated equipment. These indicators can be easily applied in the field [24,27]. Physical indicators provide information on the structure and functioning of the soil, but with less variability over time and, consequently, less sensitivity to changes in soil condition, as changes become apparent after a long period of time. As for chemical indicators, the interpretation provided by their analysis is complex, since their application and interpretation require preparation and knowledge of technical and laboratory procedures, making their implementation in the field more difficult. On the other hand, chemical indicators are more sensitive, providing more detailed information on nutritional conditions and biogeochemical cycles of the soil, and showing possible soil-buffering conditions of a lesser magnitude than physical indicators [7]. Regarding biological indicators, these have historically been the least utilized, despite being the most sensitive indicators, as they are able to detect small changes in soil conditions. This low use could be attributed to the lack of recognition of the role of microbial processes in soil organic matter cycling, difficulties with measurement, and uncertainties associated with linking laboratory-scale measurements to field processes. Among the biological indicators, the MBC is the most widely used [12,28], probably because the implementation of other biological indicators requires solid knowledge of biology, chemistry, and the development of microorganisms, together with the requirement of a longer period to carry out their analysis and interpretation. However, the use of biological indicators has become more common in the last decade, presenting itself as an option for analysis with greater accuracy in the detection of specific or smaller-scale cases, and being promoted by more researchers in the field of soil science [7,9,12].

3.2. Meta-Analysis

One of the key tests used to verify the results of a meta-analysis is the publication bias test. This test ensures that no observations from relevant studies have been omitted, which could affect the outcome of the meta-analysis. The results of the publication bias test are presented in Figure 5, using Egger’s symmetry test, where the symmetry of the points in the graph is measured [16]. The test showed a significant result ( p 0.05 ) , indicating that no observations were omitted during the systematic review process. In addition, the Nfs calculation was performed, which resulted in a value of 47.04 × 10 6 quality observations, with a significance level of p 0.0001 . This confirms that the conclusions obtained from the meta-analysis are significant ( p 0.05 ) , and suggests that more than 47 million quality observations must have been omitted to obtain inconclusive results.

3.2.1. Effect on the Quality of Intensive Agricultural Land

The l n R R ¯ for the quality of intensive agricultural soils measured by the SQIU methodology is shown in Figure 6. The l n R R ¯ obtained was significant [MD of −7.55%, 95% CI (−14.79 to 0.30%), p ≤ 0.05, with a number of observations k = 65], implying an overall loss of soil quality of 7.55 % (Figure 6). The negative effect of intensive agricultural activity has been observed and reported by many studies. Soil quality deterioration can be caused by physical factors such as degradation, water and wind erosion, compaction, and reduced water availability, as well as chemical factors such as loss of fertility, salinization, eutrophication, and pollution. These factors are often the result of intensive agriculture and poor soil management practices [6,8]. The excessive use of chemical fertilizers in intensive agriculture has caused soil acidification and salinization, which results in an increased leaching of N compounds into nearby aquifers. This continuous deterioration of the soil has reached a point where the soil is abandoned [29,30]. Inappropriate land use refers to both the “non-rotation” or “non-cyclicality” of crops and the application of inappropriate or excessive regimes of pesticides and chemical fertilizers, overgrazing, deforestation, and land use change [31]. In order to address soil deterioration, techniques such as zero or conservation tillage have been developed, alongside the use of organic amendments such as manure, biosolids, and composts. These techniques aim to increase soil OM and improve soil physicochemical and biological conditions [11,13,32,33], which allows for the recovery of the soil structure and its proper functioning, in order to carry out basic ecological functions such as nutrient cycling, water supply, C-CO2 fixation, and OM mineralization [34]. To understand the impact of soil management techniques, it is important to have methods that accurately assess the initial conditions of the soil. The information obtained can then be used by soil managers and authorities to make informed decisions. The implementation of SQIs through research studies is crucial in developing these methods and obtaining reliable data [9,35].
Another methodological factor considered in the various studies analyzed for the development of SQIUs was the implementation of two types of databases: total database (TDB) and minimum database (MDB). It was observed that the use of the TDB did not present a significant l n R R ¯ [MD of −0.90%, 95% CI (−14.44 to 11.70%), p > 0.05, with a number of observations k = 14], while the use of the MDB presented a significant l n R R ¯ [MD of −9.19%, 95% CI (−18.17 to 0.17%), p ≤0.05, with a number of observations k = 51] (Figure 7), which was very close to that obtained by the overall meta-analysis model.
The use of the TDB approach has a disadvantage in terms of operation, as it requires a large amount of resources and time to sweep through multiple indicators [56]. To minimize this, it is recommended to employ personnel with knowledge of the study area to establish indicators that are specific to the area and the problems to be addressed [27]. The use of the MDB approach showed quality values similar to the general meta-analysis model; moreover, the use of an MDB with only a few indicators reduces the amount of resources and time and can be used for the implementation of processes to improve or maintain soil quality.
Subsequently, the methodological factor of the number of indicators that made up the SQIU developed in various studies was analyzed, as well as the possible existence of a minimum or maximum number of indicators, to obtain accurate observations on soil quality. This was based on the inherent complexity of the interpretation of the results obtained and the suggestions made by the “Soil Management Evaluation Framework”, which suggests using a minimum of five indicators to analyze soil quality [57]. As the number of indicators that make up the SQIU increases, the interpretation of its results becomes more complex. For this reason, an analysis was conducted with the creation of two subgroups of observations: “equal to or less than five indicators ( S Q I 5 ) and “more than five indicators ( S Q I > 5 ) . The analysis showed that there was no significant difference (p > 0.05) l n R R ¯ , with the following results observed for the subgroups: S Q I 5 [MD of −6.81%, 95% CI (−17.54 to 3.92%), p > 0.05, with a number of observations k = 40] and S Q I > 5 [MD of −8.63%, 95% CI (−18.75 to 1.50%), p > 0.05, with a number of observations k = 25] (Figure 8). It is important to note that using SQIUs with a smaller number of indicators can be more practical for field implementation because it reduces costs and the use of resources, and makes interpretation easier [12]. In contrast, SQIUs with a larger number of indicators can complicate implementation, increase costs, and make interpretation more difficult. The number of indicators used in an SQIU depends on the type of database used and, since there is no standardized database, it can be challenging to interpret the quality results of the l n R R ¯ . If an SQIU has a significant number of indicators, it is recommended to use the MDB.
Finally, the last methodological factor analyzed was the type of indicators that made up the SQIUs. For this purpose, five subgroups of observations were established: indexes composed of chemical and biological indicators (CB), indexes composed of chemical indicators (C), indexes composed of physicochemical and biological indicators (PCB), indexes composed of physicochemical indicators (PC), and indexes composed of biological indicators (B); the indicators that made up the various SQIs can be seen in Figure 4. The analysis carried out showed that the only subgroup that presented a significant l n R R ¯ was the CB subgroup [MD of −32.53%, 95% CI (−44.63 to −18.42%), p ≤ 0.05, with a number of observations k = 15] (Figure 9). The above result was found to be much lower than the one obtained in the general meta-analysis model. This suggests that using only chemical and biological indicators in an SQIU could potentially overestimate the negative impact of intensive agricultural practices on the soil, which can lead to incorrect actions being taken in terms of soil recovery, wherein priority is given to areas that are not severely damaged, while areas that require urgent action may not receive enough resources. Sarmiento et al. (2018) [12] concluded that the robustness of an SQI depends in part on the integration of the three types of indicators—chemical, physical, and biological—into the SQI. Regarding the other subgroups, they did not present a significant (p > 0.05) l n R R ¯ . This may be because the subgroups had a small number of observations, averaging at 13, and more studies would be needed to get a more precise observation of the effect of the different subgroups on the l n R R ¯ [21]. Therefore, it is necessary to implement a greater number of studies around the world focused on the establishment of SQIs to obtain a generalized view of soil quality.

3.2.2. Metaregression

As there is no consensus on which indicators are most relevant to soil quality, a metaregression was conducted to analyze the correlation between the most commonly used indicators in the different SQIUs and the l n R R ¯ . The indicators most closely related to the l n R R ¯ are shown in Figure 10.
The CEC indicator is related to the soil’s ability to retain nutrients and make them available to crops. Soils with high CEC values typically have a good structure and high nutrient-holding capacity [58,59]. The C/N indicator provides information on the quality of OM present in the soils. High values of this indicator show a greater presence of C compounds, fibers, and cellulosic compounds, which could hinder the metabolization and mineralization of OM by the microorganisms present in the soil [60]. The Ca indicator plays an important role in soil structure, as it helps to stabilize aggregates and prevent degradation due to water and wind erosion, thus reducing the loss of OM [61]. However, high concentrations of Ca can have negative effects on microorganisms and crops, causing osmotic stress [62]. On the other hand, moderate levels of Ca are essential for plant growth and development, as it contributes to cellular processes such as enzymatic activation and photosynthesis [59,63]. The MBC indicator has been reported as an indicator that is very sensitive to the type of soil management and is related to the capacity of the microorganisms to metabolize, mineralize, and fix the OM added to the soil, thereby preventing its loss through leaching or erosion phenomena [24]. High values of MBC indicate a high concentration of OM in the soil that microorganisms can metabolize and retain, which helps improve nutrient cycling and create favorable conditions for the growth and development of microbial communities in the soil. Consequently, having a diverse and functional microbial community makes the soil more resistant to disturbances caused by human activities or natural phenomena, and maintains the biological function of the soil. The SND and CLY indicators are related to soil structure. High SND values may indicate nutrient leaching and lower OM concentration, which can lead to increased erosion risk [64,65]. On the other hand, high CLY values may indicate higher soil fertility due to the presence of OM and nutrients, but could also be a sign of poor drainage and water infiltration issues [66].
As shown in the results of the metaregression process, there are indicators belonging to the physical, chemical, and biological types, which highlights the use of all of them for the establishment of soil quality through the implementation of an SQIU.

3.2.3. Metamodeling

With the emergence of six indicators related to the l n R R ¯ that belong to three different categories—physical, chemical, and biological—it was decided to model them in order to observe which of them represented to a greater extent the variability of the soil quality l n R R ¯ resulting from the intensive use of agricultural soils. Table 2 shows the models that presented significant correlations.
The metamodeling resulted in the combination of the CEC and MBC indicators representing 97 % certainty of the variability of the l n R R ¯ for the quality of the analyzed soils (Table 2). It is worth noting that the model that presented the highest correlation with the l n R R ¯ —with lower BIC and RSME parameters—was made up of chemical and biological indicators. However, it is necessary to include physical indicators in the database to be implemented in the development of the SQIU to avoid overestimating the quality observations obtained to negative values. The developed model itself would not be a generalized SQIU to be implemented; it simply provides an idea of the set of indicators to be analyzed for the configuration of the database used in the development of the SQIU.

4. Conclusions

Soil quality has been negatively impacted by intensive agricultural practices. The use of a minimum database for analyzing soil quality has advantages such as accuracy, ease of use, and ease of interpretation. However, experts in the region to be analyzed should be consulted to select indicators that focus on the specific problems being monitored. The number of indicators did not significantly affect the results obtained from the SQIUs. Therefore, it is suggested that the use of an SQIU should involve a smaller number of indicators, which would have operational advantages, such as lower costs and easier interpretation. The most important indicators for soil quality in intensive agricultural practices were CEC and MBC. These should be included in the database along with other indicators selected by local experts when developing regional SQIUs. The SQIU is a useful and easily interpretable tool for understanding soil quality worldwide, providing a simple and generalized overview of soil quality conditions.

Supplementary Materials

The following supporting information can be downloaded at: https://www.mdpi.com/article/10.3390/agronomy13082166/s1, Table S1: Studies that integrated the database.

Author Contributions

Conceptualization, H.I.B.-R., E.C.-B.; Data curation, H.I.B.-R., E.C.-B. and M.d.l.L.X.N.-R.; Formal analysis, H.I.B.-R. and E.C.-B.; Funding acquisition, E.C.-B.; Investigation, F.P.G.-V., D.Á.-B. and M.d.l.L.X.N.-R.; Methodology, H.I.B.-R. and E.C.-B.; Project administration, E.C.-B.; Resources, H.I.B.-R., E.C.-B., F.P.G.-V., D.Á.-B. and M.d.l.L.X.N.-R.; Software, H.I.B.-R.; Supervision, H.I.B.-R., E.C.-B. and M.d.l.L.X.N.-R.; Validation, H.I.B.-R. and E.C.-B.; Visualization, H.I.B.-R. and E.C.-B.; Writing—original draft, H.I.B.-R. and E.C.-B.; Writing—review and editing, H.I.B.-R., E.C.-B. and M.d.l.L.X.N.-R. All authors have read and agreed to the published version of the manuscript.

Funding

This research was funded by Consejo Nacional de Ciencia y Tecnología (CONACYT)-Secretaría de Educación Pública (SEP). SEP-CONACYT Project, grant No. 491864.

Institutional Review Board Statement

Not applicable.

Informed Consent Statement

Not applicable.

Data Availability Statement

Not applicable.

Acknowledgments

The authors thank SEP-CONACYT for the postgraduate scholarship No. 491864.

Conflicts of Interest

The authors declare no conflict of interest.

References

  1. Huang, Z.; Sun, L.; Liu, Y.; Liu, Y.-F.; López-Vicente, M.; Wei, X.-H.; Wu, G.-L. Alfalfa Planting Significantly Improved Alpine Soil Water Infiltrability in the Qinghai-Tibetan Plateau. Agric. Ecosyst. Environ. 2019, 285, 106606. [Google Scholar] [CrossRef]
  2. Karlen, D.L.; Mausbach, M.J.; Doran, J.W.; Cline, R.G.; Harris, R.F.; Schuman, G.E. Soil Quality: A Concept, Definition, and Framework for Evaluation (A Guest Editorial). Soil Sci. Soc. Am. J. 1997, 61, 4–10. [Google Scholar] [CrossRef]
  3. Ouyang, Y.; Norton, J.M. Short-Term Nitrogen Fertilization Affects Microbial Community Composition and Nitrogen Mineralization Functions in an Agricultural Soil. Appl. Environ. Microbiol. 2019, 86, e02278-19. [Google Scholar] [CrossRef] [PubMed]
  4. Wang, Y.; Ji, H.; Wang, R.; Guo, S. Responses of Nitrification and Denitrification to Nitrogen and Phosphorus Fertilization: Does the Intrinsic Soil Fertility Matter? Plant Soil 2019, 440, 443–456. [Google Scholar] [CrossRef]
  5. Vergara Cid, C.; Ferreyroa, G.V.; Pignata, M.L.; Rodriguez, J.H. Biosolid Compost Amendment Increases Soil Fertility and Soybean Growth. J. Plant Nutr. 2021, 44, 1131–1140. [Google Scholar] [CrossRef]
  6. Kacprzak, M.; Kupich, I.; Jasinska, A.; Fijalkowski, K. Bio-Based Waste’ Substrates for Degraded Soil Improvement—Advantages and Challenges in European Context. Energies 2022, 15, 385. [Google Scholar] [CrossRef]
  7. Zornoza, R.; Acosta, J.A.; Bastida, F.; Domínguez, S.G.; Toledo, D.M.; Faz, A. Identification of Sensitive Indicators to Assess the Interrelationship between Soil Quality, Management Practices and Human Health. Soil 2015, 1, 173–185. [Google Scholar] [CrossRef]
  8. Estrada-Herrera, I.R.; Hidalgo-Moreno, C.; Guzmán-Plazola, R.; Almaraz Suárez, J.J.; Navarro-Garza, H.; Etchevers-Barra, J.D. Soil Quality Indicators to Evaluate Soil Fertility. Agrociencia 2017, 51, 813–831. [Google Scholar]
  9. Stone, D.; Ritz, K.; Griffiths, B.G.; Orgiazzi, A.; Creamer, R.E. Selection of Biological Indicators Appropriate for European Soil Monitoring. Appl. Soil Ecol. 2016, 97, 12–22. [Google Scholar] [CrossRef]
  10. Estrada-Herrera, I.R.; Hidalgo-Moreno, C.; Guzmán-Plazola, R.; Almaraz Suárez, J.J.; Navarro-Garza, H.; Etchevers-Barra, J.D. Indicadores de Calidad de Suelo Para Evaluar Su Fertilidad. Agrociencia 2017, 51, 813–831. [Google Scholar]
  11. Bedolla-Rivera, H.I.; Negrete-Rodríguez, M.d.l.L.X.; Gámez-Vázquez, F.P.; Álvarez-Bernal, D.; Conde-Barajas, E. Comparison of Methodolgies of Soil Quality Indices (SQI) for Sodic Soil. Rev. Int. Contam. Ambient. 2022, 38, 317–334. [Google Scholar] [CrossRef]
  12. Sarmiento, E.; Fandiño, S.; Gómez, L. Índices de Calidad Del Suelo. Una Revisión Sistemática. Rev. Ecosistemas 2018, 27, 130–139. [Google Scholar] [CrossRef]
  13. Ploughe, L.W.; Akin-Fajiye, M.; Gagnon, A.; Gardner, W.C.; Fraser, L.H. Revegetation of Degraded Ecosystems into Grasslands Using Biosolids as an Organic Amendment: A Meta—Analysis. Appl. Veg. Sci. 2021, 24, 1–15. [Google Scholar] [CrossRef]
  14. Duan, Z.; Tan, X.; Paerl, H.W.; Van de Waal, D.B. Ecological Stoichiometry of Functional Traits in a Colonial Harmful Cyanobacterium. Limnol. Oceanogr. 2021, 66, 2051–2062. [Google Scholar] [CrossRef]
  15. R Core Team, R. Language and Environment for Statistical Computing; R Core Team: Vienna, Austria, 2021. [Google Scholar]
  16. Luo, G.; Li, L.; Friman, V.-P.; Guo, J.; Guo, S.; Shen, Q.; Ling, N. Organic Amendments Increase Crop Yields by Improving Microbe-Mediated Soil Functioning of Agroecosystems: A Meta-Analysis. Soil Biol. Biochem. 2018, 124, 105–115. [Google Scholar] [CrossRef]
  17. Viachtbauer, W. Conducting Meta-Analyses in R with the metafor package. J. Stat. Softw. 2010, 36, 1–48. [Google Scholar] [CrossRef]
  18. Kossmeier, M.; Tran, U.S.; Voracek, M. Metaviz: Forest Plots, Funnel Plots, and Visual Funnel Plot Interference for Meta-Analysis (0.3.1.) [R Packge Versión]. 2020. Available online: https://CRAN.R-project.org/package=metaviz (accessed on 15 August 2023).
  19. van Aert, R.C.M. Puniform: Meta-Analysis Methods Correcting for Publication Bias (0.2.4) [R Package Versión]. 2021. Available online: https://CRAN.R-project.org/package=puniform (accessed on 15 August 2023).
  20. Fisher, Z.; Tipton, E.; Zhipeng, H. Robumeta: Robust Variance Meta-Regression (2.0) [R package versión]. 2017. Available online: https://CRAN.R-project.org/package=robumeta (accessed on 15 August 2023).
  21. Xiao, W.; Chen, X.; Jing, X.; Zhu, B. A Meta-Analysis of Soil Extracellular Enzyme Activities in Response to Global Change. Soil Biol. Biochem. 2018, 123, 21–32. [Google Scholar] [CrossRef]
  22. Zheng, X.; Liu, Q.; Ji, X.; Cao, M.; Zhang, Y.; Jiang, J. How Do Natural Soil NH4+, NO3, and N2O Interact in Response to Nitrogen Input in Different Climatic Zones? A Global Meta-Analysis. Eur. J. Soil Sci. 2021, 72, 2231–2245. [Google Scholar] [CrossRef]
  23. Tao, R.; Li, J.; Hu, B.; Shah, J.A.; Chu, G. A 2—Year Study of the Impact of Reduced Nitrogen Application Combined with Double Inhibitors on Soil Nitrogen Transformation and Wheat Productivity under Drip Irrigation. J. Sci. Food Agric. 2021, 101, 1772–1781. [Google Scholar] [CrossRef]
  24. Bedolla-Rivera, H.I.; Xochilt Negrete-Rodríguez, M.d.l.L.; Medina-Herrera, M.d.R.; Gámez-Vázquez, F.P.; Álvarez-Bernal, D.; Samaniego-Hernández, M.; Gámez-Vázquez, A.J.; Conde-Barajas, E. Development of a Soil Quality Index for Soils under Different Agricultural Management Conditions in the Central Lowlands of Mexico: Physicochemical, Biological and Ecophysiological Indicators. Sustainability 2020, 12, 9754. [Google Scholar] [CrossRef]
  25. Romaniuk, R.; Giuffré, L.; Costantini, A.; Bartoloni, N.; Nannipieri, P. A Comparison of Indexing Methods to Evaluate Quality of Soils: The Role of Soil Microbiological Properties. Soil Res. 2011, 49, 733. [Google Scholar] [CrossRef]
  26. Cherubin, M.R.; Tormena, C.A.; Karlen, D.L. Soil Quality Evaluation Using the Soil Management Assessment Framework (SMAF) in Brazilian Oxisols with Contrasting Texture. Rev. Bras. Ciênc. Solo 2017, 41, e0160148. [Google Scholar] [CrossRef]
  27. Vasu, D.; Singh, S.K.; Ray, S.K.; Duraisami, V.P.; Tiwary, P.; Chandran, P.; Nimkar, A.M.; Anantwar, S.G. Soil Quality Index (SQI) as a Tool to Evaluate Crop Productivity in Semi-Arid Deccan Plateau, India. Geoderma 2016, 282, 70–79. [Google Scholar] [CrossRef]
  28. Muñoz-Rojas, M.; Erickson, T.E.; Dixon, K.W.; Merritt, D.J. Soil Quality Indicators to Assess Functionality of Restored Soils in Degraded Semiarid Ecosystems. Restor. Ecol. 2016, 24, S43–S52. [Google Scholar] [CrossRef]
  29. McBride, M.B. Long-Term Biosolids Application on Land: Beneficial Recycling of Nutrients or Eutrophication of Agroecosystems? Soil Syst. 2022, 6, 9. [Google Scholar] [CrossRef]
  30. Wendeborn, S. The Chemistry, Biology, and Modulation of Ammonium Nitrification in Soil. Angew. Chem. Int. Ed. 2020, 59, 2182–2202. [Google Scholar] [CrossRef]
  31. NOM-021-RECNAT-2002; Diario Oficial de la Federación. Secretaría de Medio Ambiente y Recursos Naturales [SEMARNAT]: San Quintín, Mexico, 2002.
  32. Ferreyroa, G.V.; Vergara Cid, C.; Verdenelli, R.A.; Dominchin, M.F.; Meriles, J.M.; Pignata, M.L.; Rodriguez, J.H. Availability of Lead in Agricultural Soils Amended with Compost of Biosolid with Wood Shavings and Yard Trimmings. Environ. Sci. Pollut. Res. 2019, 26, 30324–30332. [Google Scholar] [CrossRef]
  33. del Rocío Medina-Herrera, M.; de la Luz Xochilt Negrete-Rodríguez, M.; Álvarez-Trejo, J.L.; Samaniego-Hernández, M.; González-Cruz, L.; Bernardino-Nicanor, A.; Conde-Barajas, E. Evaluation of Non-Conventional Biological and Molecular Parameters as Potential Indicators of Quality and Functionality of Urban Biosolids Used as Organic Amendments of Agricultural Soils. Appl. Sci. 2020, 10, 517. [Google Scholar] [CrossRef]
  34. Brevik, E.C.; Pereg, L.; Steffan, J.J.; Burgess, L.C. Soil Ecosystem Services and Human Health. Curr. Opin. Environ. Sci. Health 2018, 5, 87–92. [Google Scholar] [CrossRef]
  35. Rangel-Peraza, J.G.; Padilla-Gasca, E.; López-Corrales, R.; Medina, J.R.; Bustos-Terrones, Y.; Amabilis-Sosa, L.E.; Rodríguez-Mata, A.E.; Osuna-Enciso, T. Robust Soil Quality Index for Tropical Soils Influenced by Agricultural Activities. J. Agric. Chem. Environ. 2017, 06, 199–221. [Google Scholar] [CrossRef]
  36. Mukherjee, A.; Lal, R. Comparison of Soil Quality Index Using Three Methods. PLoS ONE 2014, 9, e105981. [Google Scholar] [CrossRef] [PubMed]
  37. Askari, M.S.; Holden, N.M. Quantitative Soil Quality Indexing of Temperate Arable Management Systems. Soil Tillage Res. 2015, 150, 57–67. [Google Scholar] [CrossRef]
  38. Cherubin, M.R.; Karlen, D.L.; Cerri, C.E.P.; Franco, A.L.C.; Tormena, C.A.; Davies, C.A.; Cerri, C.C. Soil Quality Indexing Strategies for Evaluating Sugarcane Expansion in Brazil. PLOS ONE 2016, 11, e0150860. [Google Scholar] [CrossRef] [PubMed]
  39. Nabiollahi, K.; Taghizadeh-Mehrjardi, R.; Kerry, R.; Moradian, S. Assessment of Soil Quality Indices for Salt-Affected Agricultural Land in Kurdistan Province, Iran. Ecol. Indic. 2017, 83, 482–494. [Google Scholar] [CrossRef]
  40. Apesteguía, M.; Virto, I.; Orcaray, L.; Bescansa, P.; Enrique, A.; Imaz, M.; Karlen, D. Tillage Effects on Soil Quality after Three Years of Irrigation in Northern Spain. Sustainability 2017, 9, 1476. [Google Scholar] [CrossRef]
  41. Mishra, G.; Marzaioli, R.; Giri, K.; Borah, R.; Dutta, A.; Jayaraj, R.S.C. Soil Quality Assessment under Shifting Cultivation and Forests in Northeastern Himalaya of India. Arch. Agron. Soil Sci. 2017, 63, 1355–1368. [Google Scholar] [CrossRef]
  42. Nabiollahi, K.; Golmohamadi, F.; Taghizadeh-Mehrjardi, R.; Kerry, R.; Davari, M. Assessing the Effects of Slope Gradient and Land Use Change on Soil Quality Degradation through Digital Mapping of Soil Quality Indices and Soil Loss Rate. Geoderma 2018, 318, 16–28. [Google Scholar] [CrossRef]
  43. Nabiollahi, K.; Taghizadeh-Mehrjardi, R.; Eskandari, S. Assessing and Monitoring the Soil Quality of Forested and Agricultural Areas Using Soil-Quality Indices and Digital Soil-Mapping in a Semi-Arid Environment. Arch. Agron. Soil Sci. 2018, 64, 696–707. [Google Scholar] [CrossRef]
  44. Yu, P.; Liu, S.; Zhang, L.; Li, Q.; Zhou, D. Selecting the Minimum Data Set and Quantitative Soil Quality Indexing of Alkaline Soils Under Different Land Uses in Northeastern China. Sci. Total Environ. 2018, 616–617, 564–571. [Google Scholar] [CrossRef]
  45. Budak, M.; Gunal, H.; Celik, İ.; Yildiz, H.; Acir, N.; Acar, M. Soil Quality Assement of Upper Tigris Basin. Carpathian J. Earth Environ. Sci. 2018, 13, 301–316. [Google Scholar] [CrossRef]
  46. Chandel, S.; Hadda, M.S.; Mahal, A.K. Soil Quality Assessment Through Minimum Data Set Under Different Land Uses of Submontane Punjab. Commun. Soil Sci. Plant Anal. 2018, 49, 658–674. [Google Scholar] [CrossRef]
  47. Mei, N.; Yang, B.; Tian, P.; Jiang, Y.; Sui, P.; Sun, D.; Zhang, Z.; Qi, H. Using a Modified Soil Quality Index to Evaluate Densely Tilled Soils with Different Yields in Northeast China. Environ. Sci. Pollut. Res. 2019, 26, 13867–13877. [Google Scholar] [CrossRef] [PubMed]
  48. Klimkowicz-Pawlas, A.; Ukalska-Jaruga, A.; Smreczak, B. Soil Quality Index for Agricultural Areas under Different Levels of Anthropopressure. Int. Agrophysics 2019, 33, 455–462. [Google Scholar] [CrossRef]
  49. Mahajan, G.; Das, B.; Morajkar, S.; Desai, A.; Murgaokar, D.; Kulkarni, R.; Sale, R.; Patel, K. Soil Quality Assessment of Coastal Salt-Affected Acid Soils of India. Environ. Sci. Pollut. Res. 2020, 27, 26221–26238. [Google Scholar] [CrossRef] [PubMed]
  50. Zeraatpisheh, M.; Bakhshandeh, E.; Hosseini, M.; Alavi, S.M. Assessing the Effects of Deforestation and Intensive Agriculture on the Soil Quality through Digital Soil Mapping. Geoderma 2020, 363, 114139. [Google Scholar] [CrossRef]
  51. Acïr, N.; Günal, H. Soil Quality of a Cropland and Adjacent Natural Grassland in an Arid Region. Carpathian J. Earth Environ. Sci. 2020, 15, 275–288. [Google Scholar] [CrossRef]
  52. Zhou, M.; Xiao, Y.; Li, Y.; Zhang, X.; Wang, G.; Jin, J.; Ding, G.; Liu, X. Soil Quality Index Evaluation Model in Responses to Six-Year Fertilization Practices in Mollisols. Arch. Agron. Soil Sci. 2020, 68, 180–194. [Google Scholar] [CrossRef]
  53. Zhao, L.; Fan, M.; Song, J.; Peng, S.; He, Y.; Wei, Y.; Dai, Y.; Liu, G. A Preliminary Study on the Determination of the Fertilization Tolerance of an Entisol in the Yuanmou Dry-Hot River Valley Based on Soil Qualities in Plot Scale. Sustainability 2021, 13, 3626. [Google Scholar] [CrossRef]
  54. Huang, W.; Zong, M.; Fan, Z.; Feng, Y.; Li, S.; Duan, C.; Li, H. Determining the Impacts of Deforestation and Corn Cultivation on Soil Quality in Tropical Acidic Red Soils Using a Soil Quality Index. Ecol. Indic. 2021, 125, 107580. [Google Scholar] [CrossRef]
  55. Mahajan, G.R.; Manjunath, B.L.; Morajkar, S.; Desai, A.; Das, B.; Paramesh, V. Long-Term Effect of Various Organic and Inorganic Nutrient Sources on Rice Yield and Soil Quality in West Coast India Using Suitable Indexing Techniques. Commun. Soil Sci. Plant Anal. 2021, 52, 1819–1833. [Google Scholar] [CrossRef]
  56. Bai, Z.; Caspari, T.; Gonzalez, M.R.; Batjes, N.H.; Mäder, P.; Bünemann, E.K.; de Goede, R.; Brussaard, L.; Xu, M.; Ferreira, C.S.S.; et al. Effects of Agricultural Management Practices on Soil Quality: A Review of Long-Term Experiments for Europe and China. Agric. Ecosyst. Environ. 2018, 265, 1–7. [Google Scholar] [CrossRef]
  57. Valani, G.P.; Vezzani, F.M.; Cavalieri-Polizeli, K.M.V. Soil Quality: Evaluation of On-Farm Assessments in Relation to Analytical Index. Soil Tillage Res. 2020, 198, 104565. [Google Scholar] [CrossRef]
  58. Moradi, S.; Rasouli-Sadaghiani, M.H.; Sepehr, E.; Khodaverdiloo, H.; Barin, M. Soil Nutrients Status Affected by Simple and Enriched Biochar Application under Salinity Conditions. Environ. Monit. Assess. 2019, 191, 191–257. [Google Scholar] [CrossRef]
  59. Zungu, N.S.; Egbewale, S.O.; Olaniran, A.O.; Pérez-fernández, M.; Magadlela, A. Soil Nutrition, Microbial Composition and Associated Soil Enzyme Activities in KwaZulu-Natal Grasslands and Savannah Ecosystems Soils. Appl. Soil Ecol. 2020, 155, 103663. [Google Scholar] [CrossRef]
  60. Legay, N.; Clément, J.C.; Grassein, F.; Lavorel, S.; Lemauviel-Lavenant, S.; Personeni, E.; Poly, F.; Pommier, T.; Robson, T.M.; Mouhamadou, B.; et al. Plant Growth Drives Soil Nitrogen Cycling and N-Related Microbial Activity Through Changing Root Traits. Fungal Ecol. 2020, 44, 100910. [Google Scholar] [CrossRef]
  61. Leogrande, R.; Vitti, C. Use of Organic Amendments to Reclaim Saline and Sodic Soils: A Review. Arid Land Res. Manag. 2019, 33, 1–21. [Google Scholar] [CrossRef]
  62. González, N.T.; Méndez, J.P.; García, F.P.; Sandoval, O.A.A.; Santillán, Y.M. Remediation Technologies for Saline Soils: A Case Study of Mexico. World Res. J. Agric. Sci. 2016, 3, 60–68. [Google Scholar]
  63. Nadeem, F.; Hanif, M.A.; Majeed, M.I.; Mushtaq, Z. Role of Macronutrients and Micronutrients in the Growth and Development of Plants and Prevention of Deleterious Plant Diseases–A Comprehensive Review. IJCBS 2018, 14, 1–22. [Google Scholar]
  64. Muñoz, B.; Pastor, J.; Rivas, W.; Gonzalez, O.; González, L. Evaluación de La Calidad Del Suelo Bajo Diferentes Sistemas Agrícolas En La Península de Paraguaná Mediante El Uso de Indicadores de Sustentabilidad. Koinonia 2017, 2, 123–139. [Google Scholar]
  65. Zheng, Q.; Hu, Y.; Zhang, S.; Noll, L.; Böckle, T.; Richter, A.; Wanek, W. Growth Explains Microbial Carbon Sse Efficiency Across Soils Differing in Land Use and Geology. Soil Biol. Biochem. 2019, 128, 45–55. [Google Scholar] [CrossRef] [PubMed]
  66. Castelán Vega, R.D.C. Susceptibilidad Ambiental a La Desertificación En La Microcuenca Del Río Azumiatla, Puebla, México. Ecosistemas Recur. Agropecu. 2019, 6, 91–101. [Google Scholar] [CrossRef]
Figure 1. PRISMA diagram of the systematic review process.
Agronomy 13 02166 g001
Figure 2. Studies published by year.
Agronomy 13 02166 g002
Figure 3. Studies published by country. The color scale represents the number of studies focused on SQIU development.
Agronomy 13 02166 g003
Figure 4. Frequency of indicators that made up the various SQIUs developed: soil pH, potential of hydrogen; SOC, soil organic C; BD, bulk density; TN, total N; P, phosphorus; CEC, cation exchange capacity; K, potassium; EC, electrical conductivity; SOM, soil organic matter; MBC, microbial biomass C; INV, invertase; MWD, mean weight aggregate diameter; N-NO3, nitrate; SMR, soil microbial respiration; Ca, calcium; Cu, copper; Mn, manganese; AN, available N; APA, phosphatase activity; PR, penetration resistance; Mg, magnesium; Fe, iron; AWC, available water content; S, sulfur; B, boron; Zn, zinc; CCE, calcium carbonate equivalent; WHC, water-holding capacity; qCO2, microbial respiration coefficient; WSA, water-stable aggregates; C/N, C and N ratio; ASD, aggregate size distribution; H + Al, potential acidity; BS, base saturation; SDC, soil degree of compactness; porosity; k, erodibility factor; SLT, silt; NB, nitrifying bacteria; IPB, inorganic P bacteria; MBN, microbial biomass N; N/P, N and P ratio; WEOC, water extractable organic C; LC, labile C; CaCO3, calcium carbonate; Na, sodium; WFPS, water-filled pore space; SAC, soil aeration capacity; Kfs, field-saturated hydraulic conductivity; BG, β-glucosidase activity; Mdens, macrofauna density; Mdiver, macrofauna diversity; ESP, exchangeable sodium percentage; SAR, sodium adsorption ratio; MWDd, mean weight diameter in dry; TNV, total neutralization value; N-NO4+, ammonium; UA, urease activity; POM-C, particulate organic C fraction; MaP, macroporosity; MiP, microporosity; SWSC, soil water storage capacity; AGS, macroaggregation stability; VESS, visual evaluation of soil structure; SSI, structural stability index; AcP, acid phosphatase activity; Eworm, number of earthworms; Mrich, macrofauna richness; AS, aggregate stability; CLY, clay; PAW, plant available water; HU, humins; NIT, potential of nitrification; and DHA, dehydrogenase activity.
Agronomy 13 02166 g004
Figure 5. Publication bias test with subsequent Egger’s test for symmetry. t , Student’s value; d f , degrees of freedom; p , probability value; l n R R ¯ , average effect size.
Agronomy 13 02166 g005
Figure 6. Tree plot of meta-analysis of the l n R R ¯ of soil quality for agricultural soils. MD, mean effect per observation; CI–95%, confidence interval at 95 % ; df, degrees of freedom; p, probability value; I 2 , coefficient of heterogeneity; τ 2 , variance; black diamond, l n R R ¯ and overall model interval; black dotted line, no effect line; red dotted line, mean model effect line; black squares, mean value of effect plus variability per observation; l n R R ¯ , average effect size. References in order of appearance; [24,25,36,37,38,39,40,41,42,43,44,45,46,47,48,49,50,51,52,53,54,55].
Agronomy 13 02166 g006
Figure 7. Tree plot of meta-analysis of the l n R R ¯ of soil quality for agricultural soils as a function of the database. TDB, total database; MDB, minimum database; MD, mean effect per observation; CI–95%, confidence interval at 95 % ; df, degrees of freedom; p, probability value; I 2 , coefficient of heterogeneity; τ 2 , variance; black diamond, l n R R ¯ and overall model interval; black dotted line, no effect line; red dotted line, mean model effect line; black squares, mean value of effect plus variability per observation; l n R R ¯ , average effect size. For references, please refer to Figure 6.
Agronomy 13 02166 g007
Figure 8. Tree plot of meta-analysis of the l n R R ¯ of soil quality for agricultural soils as a function of the number of indicators. S Q I 5 , SQIU subgroup with less than or equal to five indicators; S Q I > 5 , SQIU subgroup with more than five indicators; MD, mean effect per observation; CI–95%, confidence interval at 95 % ; df, degrees of freedom; p, probability value; I 2 , coefficient of heterogeneity; τ 2 , variance; black diamond, l n R R ¯ and overall model interval; black dotted line, no effect line; red dotted line, mean model effect line; black squares, mean value of effect plus variability per observation; l n R R ¯ , average effect size. For references, please refer to Figure 6.
Agronomy 13 02166 g008
Figure 9. Tree plot of meta-analysis of the l n R R ¯ of soil quality for agricultural soils according to the type of indicators. CB, indexes made up of chemical and biological indicators; C, indexes made up of chemical indicators; PCB, indexes made up of physicochemical and biological indicators; PC, indexes made up of physicochemical indicators; B, indexes made up of biological indicators; MD, mean effect per observation; CI–95%, confidence interval at 95 % ; df, degrees of freedom; p, probability value; I 2 , coefficient of heterogeneity; τ 2 , variance; black diamond, l n R R ¯ and overall model interval; black dotted line, no effect line; red dotted line, mean model effect line; black squares, mean value of effect plus variability per observation; l n R R ¯ , average effect size. For references, please refer to Figure 6.
Agronomy 13 02166 g009
Figure 10. Metaregression of indicators used in the development of SQIUs. (A) CEC, cation exchange capacity (meq 100 g−1 dry soil); (B) C/N, C and N ratio; (C) Ca, calcium (mg kg−1 dry soil); (D) MBC, microbial biomass C (mg Cmic kg−1 soil); (E) SND, sand (%), (F) CLY, clay (%); t , Student’s value; p , significance level; l n R R ¯ , average effect size (%); gray area, 95 % confidence interval; gray solid line, no effect line; black solid line, model trend; gray circles, indicator values used per observation; diameter, weight of indicator per observation in meta-analysis.
Agronomy 13 02166 g010
Table 1. Databases.
Table 1. Databases.
NameAbbreviationLinkDate of Search
Web Of ScienceWOShttps://www-webofscience-com.access.biblioteca.cinvestav.mx/wos/woscc/basic-search19 July 2021
ScopusScopushttps://www-scopus-com.access.biblioteca.cinvestav.mx/search/form.uri?display=basic#basic19 July 2021
Taylor & FrancisT&Fhttps://www.tandfonline.com/search/advanced19 July 2021
Multidisciplinary Digital Publishing InstituteMDPIhttps://www.mdpi.com/about/journals19 July 2021
Science DirectSciDirhttps://www-sciencedirect-com.access.biblioteca.cinvestav.mx/19 July 2021
LensLenshttps://www.lens.org/28 July 2021
Table 2. Average effect size metamodels of agricultural soil quality.
ModelAICcBICR2RMSEp
L n R R ¯ = 23.14 + 0.672 × C L Y + 0.035 × M B C 71.9851.770.965.60<0.0001
L n R R ´ ¯ = 27.02 0.743 × S N D + 0.035 × M B C 75.6055.380.937.25<0.0001
L n R R ´ ¯ = 10.20 + 0.003 × C a + 0.038 × M B C 81.4540.620.973.93<0.0001
L n R R ´ ¯ = 15.23 + 0.612 × C E C + 0.036 × M B C 81.6040.770.973.98<0.0001
L n R R ´ ¯ = 37.25 + 1.247 × C / N + 0.049 × M B C 100.7495.670.8512.11<0.0001
l n R R ¯ , average effect size (%); C E C , cation exchange capacity (meq 100 g−1 dry soil); C / N , C and N ratio; C a , calcium (meq 100 g−1 dry soil); M B C , microbial biomass C (mg Cmic kg−1 soil); S N D , sand (%); C L Y , clay (%); AICc, corrected akaike information criterion; BIC, Bayesian information criterion; R2, linear correlation of heterogeneity; p , probability value for residual heterogeneity.
Disclaimer/Publisher’s Note: The statements, opinions and data contained in all publications are solely those of the individual author(s) and contributor(s) and not of MDPI and/or the editor(s). MDPI and/or the editor(s) disclaim responsibility for any injury to people or property resulting from any ideas, methods, instructions or products referred to in the content.

