Article

The Electrical Conductivity and Drying Method Changed the Secondary Metabolite Content and Photoprotective Effects of Hydroponically Cultivated Agastache rugosa Kuntze

1
Department of Food and Nutrition, College of Biotechnology and Natural Resources, Chung-Ang University, Anseong 17546, Republic of Korea
2
Smart Farm Research Center, KIST Gangneung Institute of Natural Products, Gangneung 25451, Republic of Korea
*
Author to whom correspondence should be addressed.
These authors contributed equally to this work.
Agronomy 2023, 13(8), 2165; https://doi.org/10.3390/agronomy13082165
Submission received: 31 July 2023 / Revised: 14 August 2023 / Accepted: 16 August 2023 / Published: 18 August 2023
(This article belongs to the Special Issue Secondary Metabolites in Plants and Their Products)

Abstract

:
Many studies have examined how various cultivation methods and elicitors elevate target crop values. Post-harvest treatments, such as the drying method, may alter the final product’s characteristics. We investigated the effect of nutrient solution concentration during the hydroponic cultivation and drying method (cold air drying and freeze drying) after harvesting Agastache rugosa Kuntze, an herb used for folk medicine and as a deodorant, spice, and tea in East Asia. To explore the properties of A. rugosa, we determined its growth parameters, secondary metabolites, and photoprotective effects. We observed the highest growth and yields in A. rugosa grown under 4.0 dS·m−1 electrical conductivity (EC) conditions. However, the EC 2.0 group showed higher antioxidative properties than those grown in EC 1.5 and 4.0 conditions. Drying conditions varied the content and ratios of major active compounds (rosmarinic acid, tilianin, and acacetin) in A. rugosa. Cold air drying caused rosmarinic acid transmutation to tilianin and acacetin, and tilianin showed a stronger positive correlation with antioxidative and photoprotective activities than rosmarinic acid. The increased tilianin content in cold-air-dried A. rugosa accompanied the improved photoprotective effects in dermal cell lines. This study reveals the effects of cultivation and drying methods in A. rugosa production, and proposes alternate industrial production techniques.

1. Introduction

Agastache rugosa Kuntze is a perennial and edible herb that belongs to the Labiatae family that is widely distributed in China, Korea, and Japan [1]. A. rugosa leaves and flowers have a unique aroma, and so it has been used as a deodorant, spice, and tea throughout East Asia [2,3]. A. rugosa is a unique food ingredient and a folk medicinal herb with multiple potencies [4]. Previous studies revealed that A. rugosa has antiatherogenic, antimicrobial, antitumor, and anti-inflammation effects and may mitigate human immunodeficiency virus (HIV), hyperlipidemia, and postmenopausal osteoporosis symptoms [5,6,7,8,9,10,11]. The antioxidative activity of A. rugosa via upregulating heme oxygenase-1 (HO-1), glutathione (GSH), and superoxide dismutase (SOD) are also well verified [9].
Recently, A. rugosa has received attention in the cosmetic market because of its complex potencies for dermal cells [12]. Ultraviolet (UV) light attacks skin cells and promotes the production of reactive oxygen species (ROS). A. rugosa treatment enhances the protective efficacy against UV damage due to its ROS scavenging activities [4,13,14]. Moreover, A. rugosa downregulates matrix metalloproteinase (MMP)-related genes and promotes antiphotoaging, antiwrinkle, and skin-healing potentials via procollagen production [13,15]. Rosmarinic acid (RA) and tilianin are the major phenylpropanoids found in A. rugosa plants, and other phenolic compounds and monoterpenes may contribute to the functional properties of A. rugosa as well [16]. The acacetin, 5,7-dihydroxy-4′-methoxy flavone, is a flavonoid found in A. rugosa. It alleviates UV damage to skin cells by scavenging ROS induced by UV radiation and mediating mitogen-activated kinase (MAPK)-related signaling to mitigate photoaging [17,18].
Owing to the usage of A. rugosa, varied strategies have testified to enhance the bioactive compound content of A. rugosa. Yeast extract or silver nitrate treatment during A. rugosa cultivation changed the amount of RA and other phenylpropanoid compounds [19]. Also, various illumination conditions, L-phenylalanine (the precursor of phenylpropanoid), or casein hydrolysate supplementation, changed the RA content in A. rugosa cultures [16,20]. Some in vitro cultivation systems were also introduced to generate A. rugosa that altered its metabolites and characteristics, especially in volatile compounds [21,22]. Multivariable environmental factors could alter plant characteristics during growth, and different cultivation methods may incur metabolic changes accompanying primary and secondary metabolite changes [23].
Electrical conductivity (EC) is a material’s ability to develop electrical current, and EC is a fundamental hydroponic environmental factor for vertical farming because EC value connotes the concentrations of nutrients in the nutrient solution. Compared to conventional farming that does not use nutrient solutions, hydroponics improves nutrition uptake efficiency for plants and helps resist nutrient depletion. It helps control the plants’ nutrient state and introduces aberrant experimental conditions not easily enticed in conventional farming systems. The modulation of nutrient solutions manages extensive plant characteristics, including growth rate, yield, chemical profiling, and sensory properties in diverse plant species [24]. Thus, we hypothesized that the EC condition could alter A. rugosa characteristics and qualities, but a hydroponic culture system has rarely been tested on A. rugosa.
This study aimed to test how various EC conditions during hydroponic cultivation in a vertical farm changed the growth parameters and functional properties of A. rugosa. As well as the EC conditions, we introduced two different drying methods to examine how they affect A. rugosa characteristics during industrial product preparation. We also verified the photoprotective effects of A. rugosa samples in dermal cell lines to investigate its use as a functional agent.

2. Materials and Methods

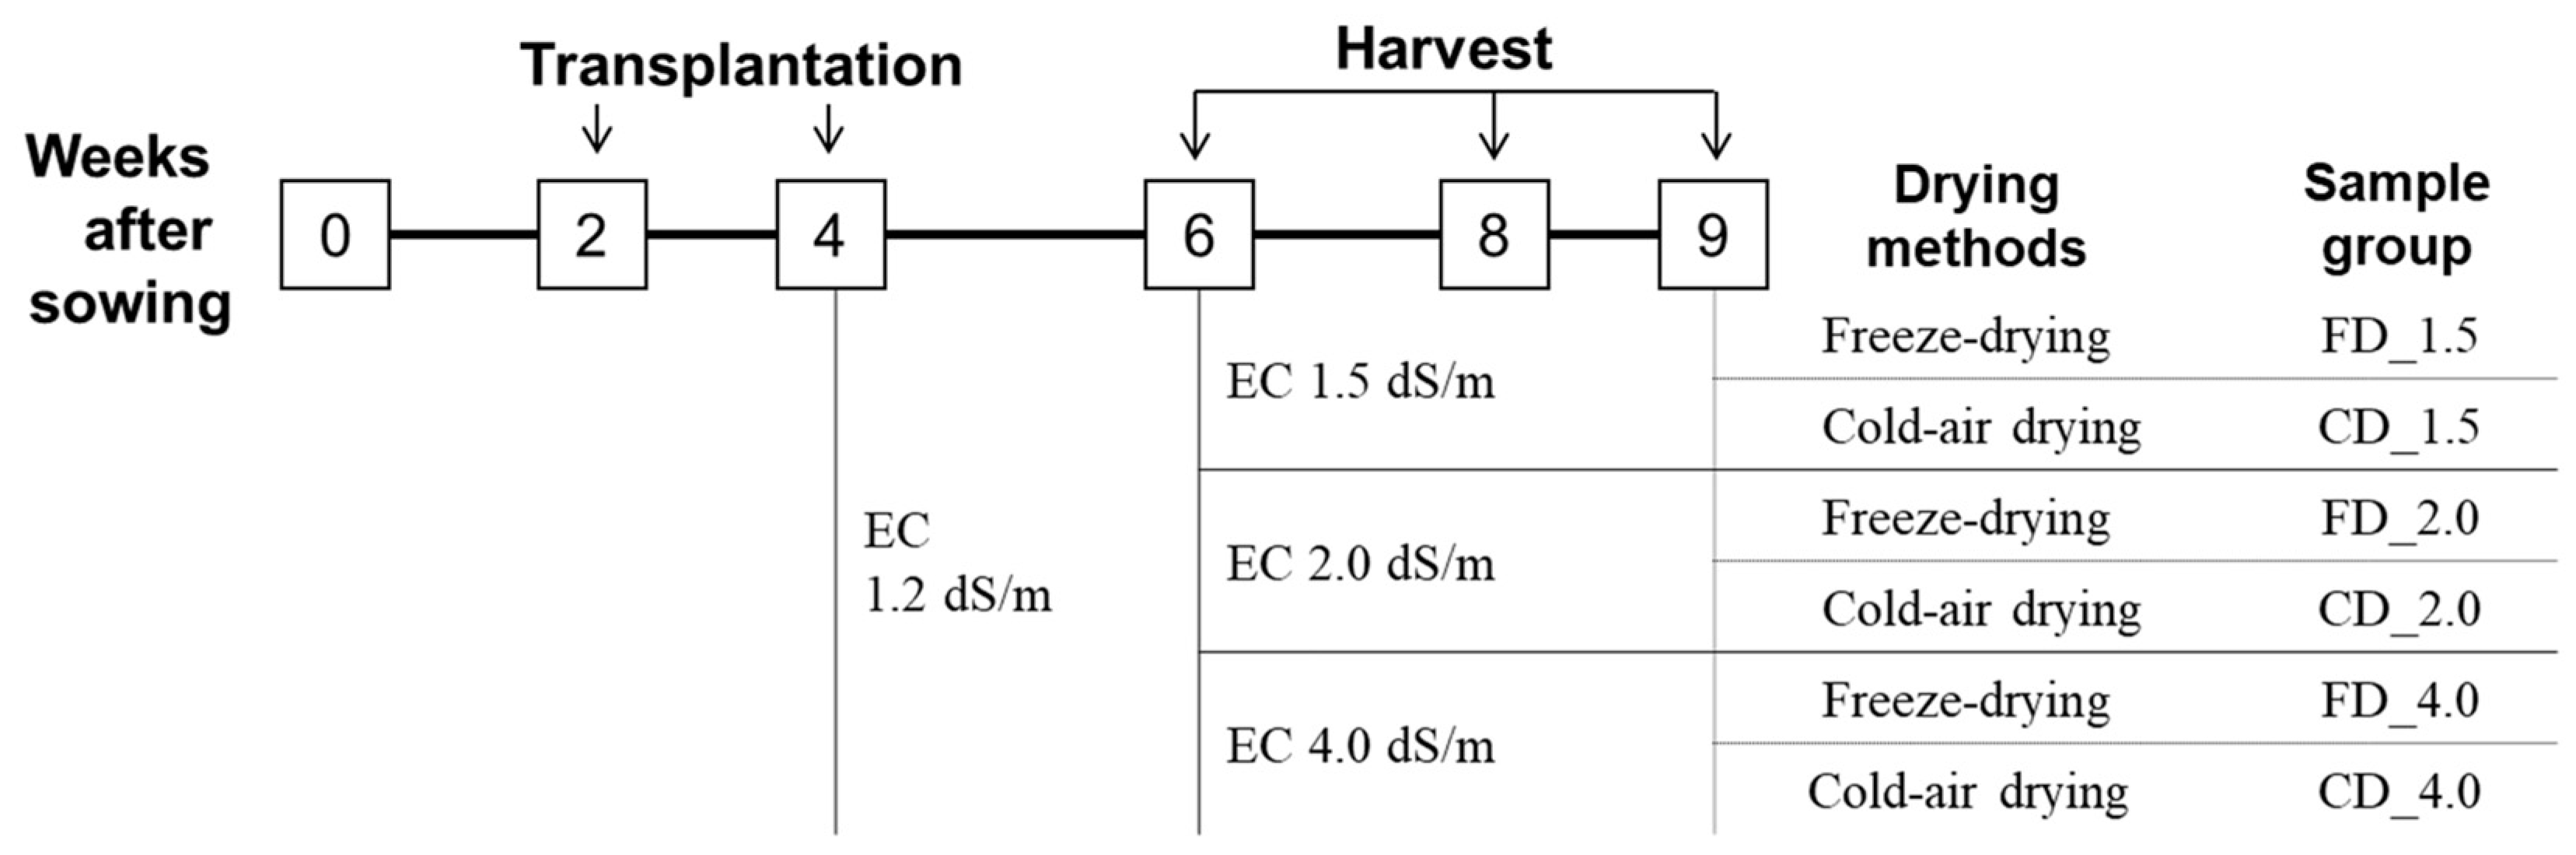
2.1. Plant Materials

We purchased A. rugosa seeds from Danong Seed Co. Ltd. (Seoul, Republic of Korea) and cultivated A. rugosa using a vertical farming system installed in the Smart U-FARM facility of Korea Institute of Science and Technology (KIST; Gangneung, Republic of Korea). We sowed A. rugosa seeds in moist rock-wool cubes (25 × 25 × 40 mm, W × L × H, respectively, Grodan Co., Roermond, The Netherlands) and grew them for two weeks. We used fluorescent lamps (TL5 14 W/865, Philips, Amsterdam, The Netherlands) installed in upper plants for 25 cm were used for illumination, and controlled the light intensity to 200 ± 11 μmol·m−2·s−1. We utilized a 14:10 h light/dark cycle and maintained room temperatures and relative humidity at 18–26 °C and 50–80%, respectively.
Two weeks after sowing, we transplanted A. rugosa to a deep-flow technique (DFT) hydroponic system (103.7 plants/m2). Four weeks after sowing, we transplanted 504 plants (31.1 plants/m2) to a nutrient film technique (NFT) hydroponic system at four weeks. We used the modified Otsuka House’s nutrient solution containing 808, 648, 492, 161, and 172 ppm of KNO3, Ca(NO3)2, MgSO4, NH4H2PO4, and KH2PO4, respectively as macronutrients (Yara Korea, Gyeonggi, Republic of Korea) and 2.80, 0.32, 0.77, 0.04, 0.02, and 0.02 ppm of Fe, B, Mn, Cu, Zn, and Mo, respectively, as micronutrients (DOFagro, Gyeonggi, Republic of Korea) with 1.5 dS·m−1 of EC. We refreshed the nutrient solution weekly to maintain mineral balance and pH (5.5–6.5) of nutrient solution. We cultivated the plants under 200 ± 15 μmol·m−2·s−1 light intensity using fluorescent lamps (FL20EX-D 18W, Shin Kwang, Mungyeong, Republic of Korea) installed 30 cm above the plants. We adjusted the light/dark cycle to 14:10 h, and maintained the CO2 concentration at 800 ± 35 ppm during the daytime. We maintained the temperature and relative humidity at 18–26 °C and 50–80%, respectively.
At week six, we divided the A. rugosa plants into three groups, each of which received different nutrient solutions (1.5, 2.0, and 4.0 for EC). The ratio of each nutrient in solutions was same as that of modified Otsuka House’s nutrient solution described above, but the concentration of the total nutrients was adjusted to 1.5, 2.0, and 4.0 dS·m−1, respectively. We grew the plants for three additional weeks by refreshing each nutrient solution once a week, and we harvested their shoots and roots separately at weeks six, eight, and nine (Figure 1).

2.2. Growth Parameters and Yield

We measured the height of the epigeal portion of the plant with a ruler and manually counted the number of leaves. We measured the sample weights with an electronic scale (W-200, CAS Corp., Yangju, Republic of Korea). We determined the dry weight of the A. rugosa samples after drying the plants at 29 ± 1 °C in a cold air dehumidifier (CT-24, COOLTOP, Cheonan, Republic of Korea) for 10 days.

2.3. Preparation of Dried Samples and Their Extracts

We randomly divided the aerial parts of the A. rugosa plants harvested nine weeks after sowing (WAS) into two groups and dried them using two different methods. We dried the first group using a freeze-dryer (PVTFD 300R, IlshinBioBase, Dongducheon, Republic of Korea) for four days and the second group using a cold air dryer (CT-24, COOLTOP, Republic of Korea) at 29 ± 1 °C for 10 days. We prepared six A. rugosa sample groups with different EC conditions and drying methods (Figure 1). We pulverized the dried A. rugosa plants and mixed one gram of A. rugosa with 20 mL of ethanol and extracted the solution three times at 20 °C for 6 h. We then evaporated the mixture with a rotary evaporator.

2.4. Antioxidative Properties

We examined the total phenolic acid contents (TPC) in the A. rugosa extract using the Folin–Ciocalteu method [25], and determined the total flavonoid content (TFC) by referring to Meda, et al. [26]. We measured the DPPH and ABTS radical scavenging activity of A. rugosa extract following the method of Son, et al. [27] and determined the ferric-reducing antioxidant power (FRAP) using the methods of Benzie and Strain [28]. We used Trolox as a standard for the DPPH, ABTS, and FRAP assays, and compared it to the antioxidative effects of A. rugosa extracts.

2.5. High-Performance Liquid Chromatography (HPLC) Analysis

We determined the major phenolic compounds in A. rugosa extract using an Agilent 1200 HPLC system (Agilent Technologies, Santa Clara, CA, USA) and the Shiseido Capcell Pak C18 MGII (250 × 4.6 mm, 5 μm) column for separation. We used water containing 0.1% formic acid (A) and acetonitrile with 0.1% formic acid (B) for the mobile phase, and their gradient condition was as follows: 0–5 min, 20:80; 10 min, 50:50; 20–22 min, 0:100; 25 min, 20:80 (A:B). The flow rate was 1 mL·min−1, and we detected the chromatogram at 330 nm. We quantified the RA, tilianin, and acacetin content using their respective calibration curves. We obtained the standard compounds from Sigma-Aldrich (St. Louis, MO, USA).

2.6. Cell Culture

We obtained Hs68 human dermal fibroblast cells and HaCaT human keratinocytes from the American Type Culture Collection (Manassas, VA, USA). We used Dulbecco’s modified eagle medium (DMEM; Hyclone, Logan, UT, USA) containing 10% fetal bovine serum (FBS; Thermo Fisher Scientific, Waltham, MA, USA) and 1% penicillin-streptomycin solution (Hyclone, Logan, UT, USA) for cell culture. The cells were incubated under 5% CO2 at 37 °C in a humidified incubator and subcultured for every two to three days.

2.7. Cell Viability

We seeded Hs68 or HaCaT cells in a 96-well plate for 5 × 10³ cells/well and incubated them for 24 h. We eliminated the media and washed the cells with phosphate-buffered saline (PBS). Then, we placed serum-free DMEM containing different concentrations of A. rugosa extract (5, 20, and 40 μg/mL) into wells and incubated them for 1 h. After removing the media, we washed the cells with PBS again, and put 100 μL of PBS solution into wells. We divided cells into two groups based on UV-B irradiation. We exposed the UV-B irradiated group to 20 mJ·cm−1 of UV-B (VL-6 LM; Vilber Lourmat, Marne-la-Vallée, France).
After removing PBS, we put cell culture media with various concentrations of A. rugosa extract into wells, and incubated the cells for 24 h. We determined the cell viability by MTT assay using 3-(4,5-dimethylthiazol-2-yl)-2,5-diphenyltetrazolium bromide (Sigma-Aldrich, St. Louis, MO, USA). We added 0.5 mg·mL−1 MTT solution to wells and eliminated the media after 4 h. We dissolved the reactants with dimethyl sulfoxide and determined the absorbance at 550 nm (Bio-Tek Instruments, Winooski, VT, USA).

2.8. ROS Reduction in UV-B Irradiated Cells

We seeded Hs68 or HaCaT cells in a 96-well plate (5 × 10³ cells/well) and incubated them for 24 h. After removing the media, we rinsed the cells with PBS once and treated serum-free media containing different concentrations of A. rugosa extract (5, 20, and 40 μg/mL) for 1 h. We washed cells with PBS again after removing the media, and put 100 μL of PBS into each well. We irradiated the UV-B for 20 mJ·cm−1 (VL-6 LM; Vilber Lourmat, France) and eliminated the PBS solution. Then, we placed 20 μM of 2′, 7′-dichlorofluorescein diacetate (DCFDA) in serum-free DMEM into the respective wells. We determined the cells’ fluorescence intensity after 30 min at 495 nm for excitation and 530 nm for emission (Bio-Tek Instruments, Winooski, VT, USA).

2.9. Statistical Analysis

We analyzed statistical differences with one-way analysis of variance (ANOVA) using SPSS Ver. 25 (IBM Corp; Armonk, NY, USA). We calculated the means ± standard deviations (SD). When the F-ratio was significant, we conducted Duncan’s multiple range test for post hoc analysis. Differences were considered significant at p < 0.05. We analyzed Pearson’s correlations within variables and visualization with OriginPro 2023 (OriginLab; Northampton, MA, USA). We conducted principal component analysis (PCA) and visualization using SPSS Ver. 25 (IBM Corp; Armonk, NY, USA) and GraphPad Prizm 9 (GraphPad Software; San Diego, CA, USA).

3. Results

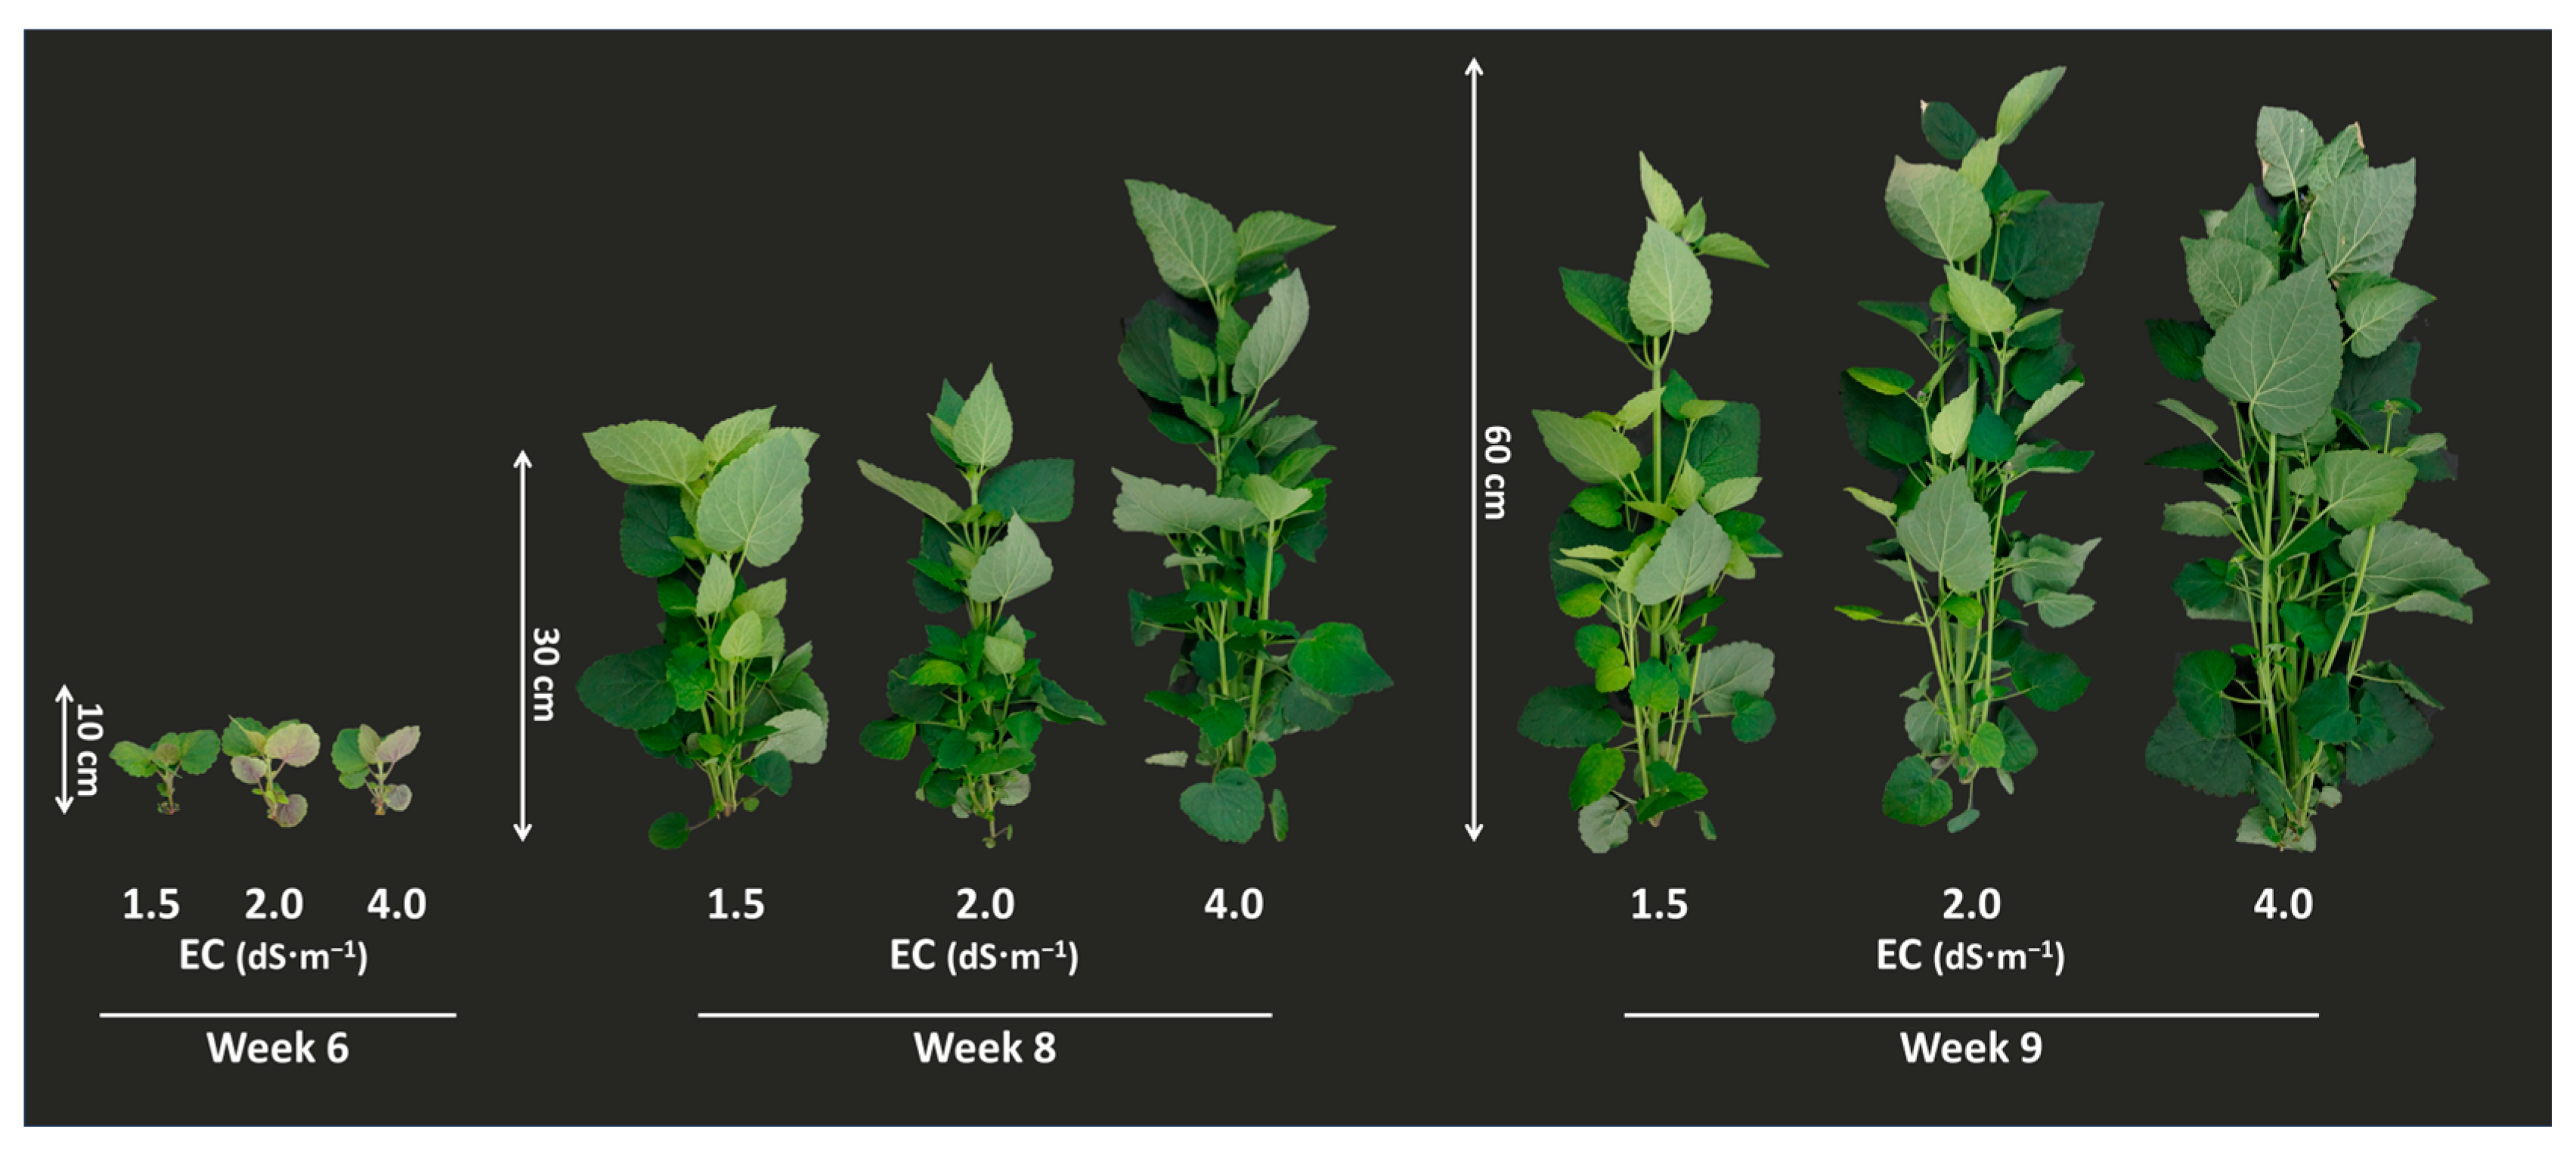
3.1. Effect of EC Condition on Growth Parameters and A. rugosa Yield

Figure 2 presents photographs of harvested A. rugosa samples. We measured six growth parameters (plant height, number of leaves, and fresh and dry weights of the aerial and root parts) to estimate the effects of EC on the yield and growth rate of A. rugosa (Figure 3). There were no significant differences in yield and growth rate at week six within the groups. At weeks eight and nine, different ECs caused changes in all of the growth parameters and A. rugosa plant yields. At week nine, plants grown under EC 4.0 had a significantly higher weight (49.20 ± 1.92 cm) in the aerial (52.25 ± 9.16 g/plant and 6.70 ± 1.27 g/plant of fresh and dry weight; 105.40 ± 18.66 leaves/plant) and root parts (19.95 ± 4.65 g/plant and 1.60 ± 0.49 g/plant of fresh and dry weight) than the other groups (p < 0.05). On the contrary, plant height (45.80 ± 1.79 cm), number of leaves (84.40 ± 5.73 leaves/plant), and fresh and dry weight of aerial (27.35 ± 4.06 g/plant and 4.57 ± 0.74 g/plant) and root (8.28 ± 1.21 g/plant and 0.93 ± 0.10 g/plant) parts for plants grown under the EC 1.5 conditions were significantly low compared with other conditions at week nine (p < 0.05). These results indicated that EC 1.5 nutrient solution may not have provided adequate nutrients to A. rugosa during weeks six to nine in vertical farming, while EC 4.0 nutrient solution promoted A. rugosa growth.

3.2. EC Conditions Varied the A. rugosa Samples’ Antioxidative Properties

In company with an implication of EC conditions to A. rugosa during cultivation, we additionally tested the effects of drying methods after harvest. We used two types of drying methods (cold- and freeze-drying) on A. rugosa samples harvested at week nine. First, we analyzed TPC and TFC in each sample group owing to their strong influence on antioxidative activities (Figure 4A,B). A. rugosa cultivated under EC 2.0 showed significantly higher TPC and TFC than other sample groups (p < 0.05). Likewise, the A. rugosa grown under EC 2.0 nutrient solution showed the highest DPPH, ABTS, and FRAP activities regardless of the drying method (Figure 4C–E; p < 0.05). Among the freeze-dried samples, A. rugosa cultivated with EC 4.0 nutrient solution had the lowest ABTS, FRAP, TPC, and TFC compared with those grown in EC 1.5 and EC 2.0 conditions. Compared to the EC conditions, the drying methods did not dramatically change the TPC, TFC, and antioxidative activities.

3.3. The Drying Method Changed RA, Tilianin, and Acacetin Content in Dried A. rugosa

We also verified three kinds of typical active phenolic compounds (RA, tilianin, and acacetin) in A. rugosa with HPLC to verify the differences in the secondary metabolite profiles of the samples (Table 1). The drying method considerably influenced the ratios of the major secondary metabolites. The tilianin and acacetin content were higher in the cold-air-dried samples, while the RA content was higher in the freeze-dried samples when the EC conditions were the same (p < 0.05). The FD_1.5 group showed the highest RA content (4.50 ± 0.61 mg/g dry basis) and CD_4.0 showed the lowest RA content (0.09 ± 0.01 mg/g dry basis). The tilianin content was elevated in cold-air-dried samples compared to the freeze-dried samples with identical EC conditions. The tilianin content of CD_2.0 (9.10 ± 1.22 mg/g dry basis) was 1.9 times higher than FD_2.0 (p < 0.05). Acacetin content was significantly higher in cold-air-dried conditions. CD_2.0 and CD_4.0 had 3.4 and 7.3 times higher acacetin content than FD_2.0 and FD_4.0, respectively (p < 0.05). These results indicated that the drying method may cause changes in each chemical compound’s content.

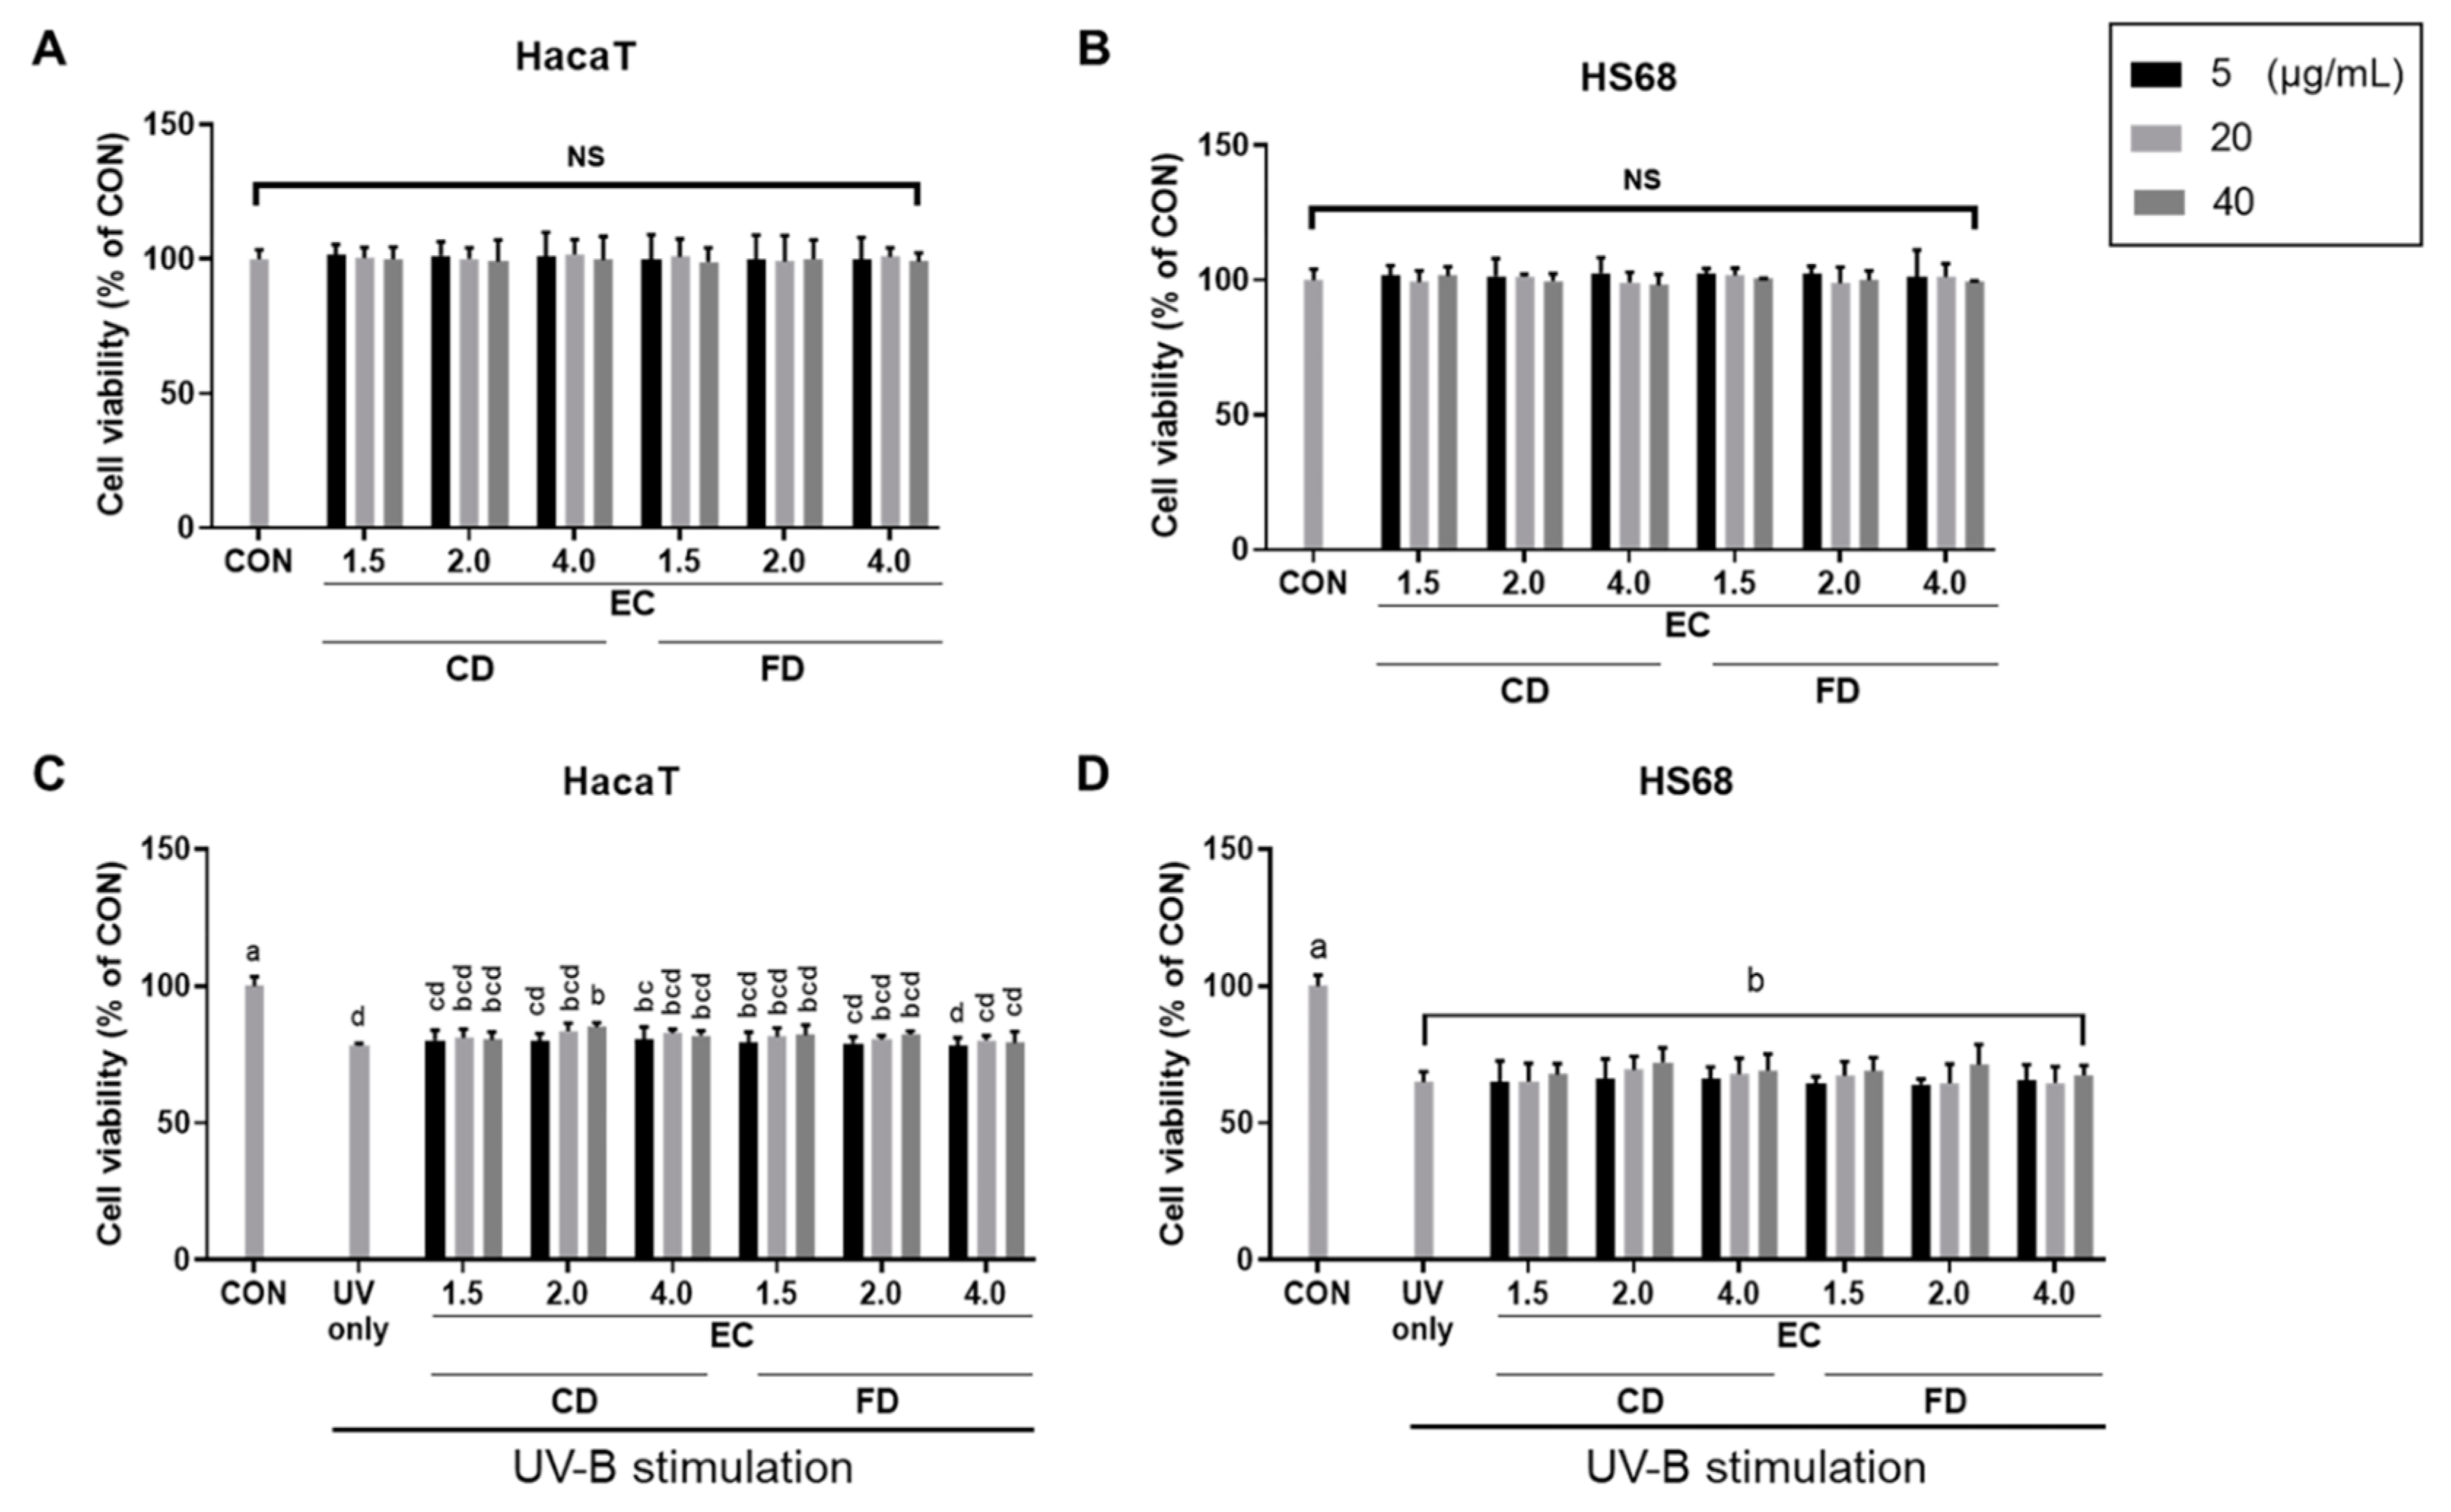
3.4. EC Conditions and Drying Methods Affect A. rugosa’s Photoprotective Effects

We tested A. rugosa’s photoprotective effects in two cell lines (Hs68 and HaCaT). First, we confirmed that none of the samples demonstrated toxic effects in the ranges of 5–40 μg/mL in either cell line (Figure 5A,B). UV-B irradiation in both cell lines decreased cell viability (by about 20–30%), and some treatment groups (such as 40 μg/mL for CD_2.0) showed a slight increase in cell viability in the HaCaT cell line against UV-B (Figure 5C). However, treatment of A. rugosa extracts did not change cell viability in the UV-B irradiated Hs68 cells (Figure 5D).
We also examined if the A. rugosa extracts could reduce ROS due to UV-B because the importance of ROS in the skin cells’ photodamage mechanism (Table 2 and Table 3). We found that the ROS contents multiplied 34 and 30 times after UV-B irradiation in the HaCaT and Hs68 cell lines, respectively. However, A. rugosa extracts effectively removed ROS in both cell lines. The CD_2.0 extract demonstrated the strongest potency for scavenging ROS in both two cell lines, and FD_2.0 showed the second-highest ROS scavenging activities among the sample groups. CD_4.0 and FD_4.0 showed the weakest photoprotective effects.

3.5. Correlations between A. rugosa Characteristics and PCA Plots

The modulations of EC conditions and drying methods resulted in changes in A. rugosa traits. We employed additional statistical analysis to elucidate the relationship between variables. We used antioxidative properties (TPC, TFC, DPPH, ABTS, and FRAP), major metabolites (RA, tilianin, and acacetin), and the in vitro photoprotective effects as variables. We excluded the growth parameters, as they did not embrace the drying processes. First, we conducted Pearson’s correlation analysis (Figure 6). The five variables (TPC, TFC, DPPH, ABTS, and FRAP) related to antioxidative activities showed highly positive correlations and were negatively related to ROS amount in the HaCaT and Hs68 cell lines, which indicates elevated in vitro photoprotective activities. Among the major A. rugosa metabolites, we found that RA amounts were not correlated with antioxidative properties and in vitro photoprotective effects. Instead, tilianin showed the highest negative correlation with ROS content in the HaCaT (r = −0.81) and Hs68 (r = −0.86) cell lines. Tilianin was positively correlated with the antioxidative variables. Acacetin was positively correlated with antioxidative properties, but its correlation values were lower than tilianin. It signified that tilianin is the major active compound of A. rugosa against oxidative stress and photodamage. RA content was negatively correlated with tilianin or acacetin contents in A. rugosa. The content of each major metabolite was shifted by drying methods, which explains the high antioxidative and photoprotective effects of cold-air-dried A. rugosa samples.
The same tendencies were observed in the scoring PCA plot within the variables (Figure 7A). Tilianin and acacetin had a negative relationship with RA content, and tilianin had a strong relationship with factors related to antioxidative activities. Moreover, high antioxidative properties accompanied decreased ROS in UV-B irradiated cell lines. In a loading plot (Figure 7B), the EC 2.0 condition had a stronger relationship with antioxidative and photoprotective activities than other EC conditions, and cold-air-dried samples contained higher levels of tilianin but lower RA compared to the lyophilized groups.

4. Discussion

The relationship between EC and plant characteristics has been verified in many types of crops. For example, in tomatoes, EC converted the growth parameters during the vegetative growth stage, and high EC promoted leaf formation [29]. Tomatoes’ sugar and acid content and sensory properties were also affected by the nutrient solutions’ EC values [30]. In addition, the EC condition and its application timing changed the amounts of lycopene, a typical secondary metabolite of tomatoes [31]. EC 2.0 and 4.0 treatment promoted all of A. rugosa growth parameters compared with those of EC 1.5 in the present study. Although a nutrient solution rich in minerals provides nutrients to plants, sometimes excessive EC can accumulate Na+, change the osmotic potential, and may cause ion toxicities [32]. Salt stress impedes crop growth and makes plants produce compatible metabolites with dissipating energies, leading to a severe yield reduction [33]. Lam, et al. [34] also showed a reduced growth rate and yield for A. rugosa when the EC condition exceeds 4.0, which may be causative of salt stress. Therefore, we concluded that EC 2.0 to 4.0 do not cause osmotic stress and they would be the optimal conditions to obtain lavish A. rugosa.
Although A. rugosa growth was promoted with an EC 4.0 nutrient solution, it did not increase the contents of active compounds in A. rugosa. The TPC and TFC of A. rugosa cultivated with EC 4.0 were low compared to those of the EC 2.0 group. In addition, low TPC and TFC may lead to low DPPH, ABTS, and FRAP activities of the EC 4.0 group. We also found that typical active compounds (RA, tilianin, and acacetin) of A. rugosa were lowered in the EC 4.0 condition. Phenolic compounds are secondary metabolites derived from central or primary metabolic processes in plants, and the metabolite profile of the plant is closely related to its nutritional characteristics [35]. Plants thrive under plentiful nutrients and optimum environments, but secondary metabolites are produced against stressful factors as a defensive reaction to harsh environments [36]. That is, biotic stresses by herbivores, bacteria, fungi, and viruses and abiotic stresses such as temperature, salinity, drought, flooding, excessive radiation, and nutrient deficiency trigger the synthesis of secondary metabolites in flora [37]. Likewise, a high EC nutrient solution increases the growth parameters and yield in green perilla; however, it decreases perillaldehyde and RA content [38]. Yuhang, et al. [39] also found that fertilizers assist Prunella vulgaris L. growth, but reduce the secondary metabolites (RA, ursolic acid, and oleanolic acid). Well-nourished environments increase the growth and yield of crops but may lower the accumulation of secondary metabolites. Nutrient deficiency may accelerate secondary metabolite production, and nitrogen deprivation stimulates flavonol accumulation in the vegetative tissues of Arabidopsis thaliana and tomatoes [40].
RA, tilianin, and acacetin biosynthesis are conducted through a phenylpropanoid pathway starting from L-phenylalanin, and various genes, such as phenylalanine ammonia-lyase (PAL), cinnamate 4-hydroxylase (C4H), and 4-coumarate coenzyme A ligase (4CL), are involved [41]. Previous studies reported that environmental factors modulate the expression of these genes in A. rugosa. That is, the treatment of specific wavelength light and methyl jasmonate changed the accumulation rates of each phenylpropanoid [3,16]. Besides the phenylpropanoid pathway, the shikimic acid pathway is a central mechanism providing aromatic compounds as versatile precursors for many secondary metabolites involving phenylpropanoids in plants [42]. The nutrition state of plants manipulates the expression levels of genes associated with the shikimic acid pathway, and deprivation of nutrients increases the signaling [43]. We surmise that the relatively low flavonoid content of the EC 4.0 group compared to EC 2.0 is due to the superior nutrition condition of A. rugosa therefore.
In addition to cultivation manners, the post-harvest process also critically switches the properties of crops. Drying is a basic process that eliminates moisture from foods and other industrial raw materials to enhance shelf life and reduce storage and transportation costs [44]. Moreover, dehydration is indispensable to gaining higher yields when extracting materials. We tested two popular drying methods (freeze drying and cold air drying) to confirm if they alter the active compound composition in A. rugosa. Although TPC, TFC, and DPPH and ABTS radical scavenging activities were not different between the freeze-dried and cold-air-dried samples, the RA, tilianin, and acacetin content were altered by the drying method. In comparison with lyophilized A. rugosa, cold-air-dried samples showed lowered RA content but increased tilianin and acacetin after dehydration. The diminution of active compounds in plant samples after dehydration is a common phenomenon due to the destruction and oxidation of chemical compounds during drying. The freeze-drying method requires high energy costs and drying times, but it highly impedes changes in the material quality and characteristics and active compound content compared with conventional air drying [45]. Therefore, the freeze-drying process is preferred in pharmaceutical industries to retain the high potency of medicinal herbs. However, tilianin and acacetin were increased in A. rugosa by cold air drying, and Park, et al. [46] also reported that oven drying at 25 °C reduced RA but increased tilianin content in dried A. rugosa. It implied that RA was degraded but tilianin was generated during cold air drying, and we took note of the biosynthetic pathway of phenylpropanoid in plants. Naringenin chalcone is a precursor of tilianin that converts to acacetin by chalcone isomerase, flavone synthase, and apigenin 4′-O-methyltransferase; and further, acacetin is transformed into tilianin by glucosyltransferase [41]. The general temperature condition of cold air drying cannot restrict enzymatic reactions. This therefore contributes to the mounting up of specific compounds. For example, oven-dried wheatgrass showed higher TPC and TFC compared to lyophilized samples in a study by Das, et al. [47], and Najjaa, et al. [48] observed that the changes in chemical compound profiling of Allium sativum by oven-drying may be due to allinase. Hence, we surmise that cold air drying may encourage increasing acacetin and tilianin followed by the actions of related enzymes, yet it demands further investigation.
In turn, altering the content of active compounds affected the photoprotective activity of A. rugosa in UV-B-stimulated skin cell lines. A. rugosa extract has potent antioxidation, antiphotoaging, and skin-whitening effects via multiple mechanisms [49,50], and here, we verified the antioxidation and photoprotective activities of A. rugosa samples. We observed that TPC and TFC levels are closely related to the photoprotective effects of A. rugosa samples, and it connotes that proper cultivation and post-harvest processing can improve A. rugosa potency. Meanwhile, when the TPC and TFC are similar within the A. rugosa sample groups, the amounts of tilianin and acacetin highly affected the photoprotective effects of A. rugosa. Among the major compounds in A. rugosa extract, acacetin has versatile and powerful antioxidant and melanogenesis inhibition properties [51]. In UV-B-induced HaCaT cells, acacetin attenuated MMP-1 gene expression and phosphorylation of MAPK signaling [17] and mitigated photo-aging by mediating sirtuin-3 (SIRT3)/ROS/MAPKs pathway against UV-A [18]. Tilianin is also known for its powerful antioxidative and anti-inflammatory activities [52]. Therefore, the increased amounts of tilianin and acacetin may have enforced the photoprotective effects of the A. rugosa extracts in the present study. Not only do acacetin and tilianin enhance photoprotective effects, but acacetin downregulates monoamine oxidase (MAO) A and B expression, which are the therapeutic targets of depression and anxiety (MAO-A) and Alzheimer’s and Parkinson’s diseases (MAO-B) [53]; and tilianin improves mitochondrial energy metabolism and alleviates oxidative stress in myocardial ischemia/reperfusion injury (MIRI) rat [54]. Hence, the stimulating acacetin and tilianin synthesis by adjusting EC and drying methods could produce superior A. rugosa for industrial use.

5. Conclusions

In the present study, we verified the growth rates and functional properties of A. rugosa under different EC conditions and with two drying methods (freeze drying and cold air drying). When A. rugosa was grown with EC 1.5, 2.0, or 4.0 nutrient solutions, all growth parameters and yields were significantly increased with the EC 4.0 nutrient solution compared to those of EC 1.5 at 8 and 9 weeks. The EC 2.0 condition also increased two growth parameters (height and the number of leaves) compared with the EC 1.5 condition. Although the EC 4.0 condition led to mounted growth rates, TPC, TFC, FRAP, and radical scavenging activities were significantly lower than in the EC 2.0 condition. The EC 4.0 sample had lower levels of three representative active compounds in A. rugosa (RA, tilianin, and acacetin) compared to the EC 2.0 condition, which may have been driven from overly affluent states, because the synthesis of secondary metabolites is boosted against stressful environments in plants. The TPC, TFC, FRAP, and radical scavenging activities were not prominently changed by the drying method, but cold air drying elevated the contents of tilianin and acacetin. As tilianin and acacetin are potent chemicals, cold-air-dried samples showed higher photoprotective effects in HaCaT and Hs68 cell lines compared to lyophilized groups. Put together, EC 4.0 condition could elevate A. rugosa’s growth rate and yield, but A. rugosa cultivated with the EC 2.0 nutrient solution showed higher functional activities. In the post-harvest process, cold air drying augmented the additional synthesis of tilianin and acacetin and resulted in increased photoprotective effects of A. rugosa. Our results reveal the impacts of EC and drying methods during A. rugosa product formation and propose optimized conditions depending on its industrial purposes.

Author Contributions

Conceptualization, Y.-J.S.; investigation, Y.-J.S. and J.-E.P.; methodology, J.-E.P.; project administration, C.W.N.; visualization, Y.-J.S. and J.-E.P.; writing—original draft, Y.-J.S., J.-E.P. and C.W.N.; writing—review and editing, Y.-J.S., J.-E.P. and C.W.N. All authors have read and agreed to the published version of the manuscript.

Funding

This work was supported by the National Research Foundation of Korea (grant number 2019M3A9I3090993). This work was also supported by the Chung-Ang University Research Grants in 2021.

Data Availability Statement

The all datasets used in the study are available from the authors on reasonable request.

Conflicts of Interest

The authors have no conflict of interest to declare.

Abbreviations

HIV: human immunodeficiency virus; HO-1, heme oxygenase-1; GSH, glutathione; SOD, superoxide dismutase; UV, ultraviolet; ROS, reactive oxygen species; MMP, matrix metalloproteinase; RA, rosmarinic acid; MAPK, mitogen-activated kinase; EC, electrical conductivity; DFT, deep-flow technique; WAS, weeks after sowing; TPC, total phenolic acid contents; TFC, total flavonoid contents; DMEM, Dulbecco modified eagle medium; FBS, fetal bovine serum; PBS, phosphate-buffered saline; DCFDA, 2′, 7′-dichlorofluorescein diacetate; ANOVA, analysis of variance; SD, standard deviation; PCA, principle component analysis; PAL, phenylalanine ammonia-lyase; C4H, cinnamate 4-hydroxylase; 4CL, 4-coumarate coenzyme A ligase; SIRT3, sirtuin-3; MAO, monoamine oxidase; MIRI, myocardial ischemia/reperfusion injury.

References

  1. Xu, H.; Kim, Y.K.; Jin, X.; Lee, S.Y.; Park, S.U. Rosmarinic acid biosynthesis in callus and cell cultures of Agastache rugosa Kuntze. J. Med. Plants Res. 2008, 2, 237–241. [Google Scholar]
  2. Desta, K.T.; Kim, G.S.; Kim, Y.H.; Lee, W.S.; Lee, S.J.; Jin, J.S.; Abd El-Aty, A.; Shin, H.C.; Shim, J.H.; Shin, S.C. The polyphenolic profiles and antioxidant effects of Agastache rugosa Kuntze (Banga) flower, leaf, stem and root. Biomed. Chromatogr. 2016, 30, 225–231. [Google Scholar] [CrossRef]
  3. Kim, Y.B.; Kim, J.K.; Uddin, M.R.; Xu, H.; Park, W.T.; Tuan, P.A.; Li, X.; Chung, E.; Lee, J.-H.; Park, S.U. Metabolomics analysis and biosynthesis of rosmarinic acid in Agastache rugosa Kuntze treated with methyl jasmonate. PLoS ONE 2013, 8, e64199. [Google Scholar] [CrossRef]
  4. Oh, Y.; Lim, H.-W.; Huang, Y.-H.; Kwon, H.-S.; Jin, C.D.; Kim, K.; Lim, C.-J. Attenuating properties of Agastache rugosa leaf extract against ultraviolet-B-induced photoaging via up-regulating glutathione and superoxide dismutase in a human keratinocyte cell line. J. Photochem. Photobiol. B Biol. 2016, 163, 170–176. [Google Scholar] [CrossRef]
  5. Hong, J.-J.; Choi, J.-H.; Oh, S.-R.; Lee, H.-K.; Park, J.-H.; Lee, K.-Y.; Kim, J.-J.; Jeong, T.-S.; Oh, G.T. Inhibition of cytokine-induced vascular cell adhesion molecule-1 expression; possible mechanism for anti-atherogenic effect of Agastache rugosa. FEBS Lett. 2001, 495, 142–147. [Google Scholar] [CrossRef] [PubMed]
  6. Haiyan, G.; Lijuan, H.; Shaoyu, L.; Chen, Z.; Ashraf, M.A. Antimicrobial, antibiofilm and antitumor activities of essential oil of Agastache rugosa from Xinjiang, China. Saudi J. Biol. Sci. 2016, 23, 524–530. [Google Scholar] [CrossRef] [PubMed]
  7. Kim, H.K.; Lee, H.-K.; Shin, C.-G.; Huh, H. HIV integrase inhibitory activity of Agastache rugosa. Arch. Pharmacal Res. 1999, 22, 520–523. [Google Scholar] [CrossRef] [PubMed]
  8. Jun, H.-J.; Chung, M.J.; Dawson, K.; Rodriguez, R.L.; Houng, S.-J.; Cho, S.-Y.; Jeun, J.; Kim, J.-Y.; Kim, K.H.; Park, K.W. Nutrigenomic analysis of hypolipidemic effects of Agastache rugosa essential oils in HepG2 cells and C57BL/6 mice. Food Sci. Biotechnol. 2010, 19, 219–227. [Google Scholar] [CrossRef]
  9. Oh, H.M.; Kang, Y.J.; Lee, Y.S.; Park, M.K.; Kim, S.H.; Kim, H.J.; Seo, H.G.; Lee, J.H.; Chang, K.C. Protein kinase G-dependent heme oxygenase-1 induction by Agastache rugosa leaf extract protects RAW264. 7 cells from hydrogen peroxide-induced injury. J. Ethnopharmacol. 2006, 103, 229–235. [Google Scholar] [CrossRef]
  10. Hong, S.; Cha, K.H.; Son, Y.J.; Kim, S.M.; Choi, J.-H.; Yoo, G.; Nho, C.W. Agastache rugosa ethanol extract suppresses bone loss via induction of osteoblast differentiation with alteration of gut microbiota. Phytomedicine 2021, 84, 153517. [Google Scholar] [CrossRef]
  11. Shin, S.; Kang, C.A. Antifungal activity of the essential oil of Agastache rugosa Kuntze and its synergism with ketoconazole. Lett. Appl. Microbiol. 2003, 36, 111–115. [Google Scholar] [CrossRef] [PubMed]
  12. Yun, M.-S.; Kim, C.; Hwang, J.-K. Agastache rugosa Kuntze Attenuates UVB-Induced Photoaging in Hairless Mice through the Regulation of MAPK/AP-1 and TGF-β Smad Pathways. J. Microbiol. Biotechnol. 2019, 29, 1349–1360. [Google Scholar] [CrossRef]
  13. Lee, Y.; Lim, H.-W.; Ryu, I.W.; Huang, Y.-H.; Park, M.; Chi, Y.M.; Lim, C.-J. Anti-Inflammatory, Barrier-Protective, and Antiwrinkle Properties of Agastache rugosa Kuntze in Human Epidermal Keratinocytes. BioMed Res. Int. 2020, 2020, 1759067. [Google Scholar] [CrossRef] [PubMed]
  14. Shin, D.; Lee, Y.; Huang, Y.-H.; Lim, H.-W.; Jang, K.; Kim, D.-D.; Lim, C.-J. Probiotic fermentation augments the skin anti-photoaging properties of Agastache rugosa through up-regulating antioxidant components in UV-B-irradiated HaCaT keratinocytes. BMC Complement. Altern. Med. 2018, 18, 196. [Google Scholar] [CrossRef] [PubMed]
  15. Seo, H.; Kim, C.; Kim, M.-B.; Hwang, J.-K. Anti-photoaging effect of Korean mint (Agastache rugosa Kuntze) extract on UVB-irradiated human dermal fibroblasts. Prev. Nutr. Food Sci. 2019, 24, 442. [Google Scholar] [CrossRef] [PubMed]
  16. Park, W.T.; Yeo, S.K.; Sathasivam, R.; Park, J.S.; Kim, J.K.; Park, S.U. Influence of light-emitting diodes on phenylpropanoid biosynthetic gene expression and phenylpropanoid accumulation in Agastache rugosa. Appl. Biol. Chem. 2020, 63, 25. [Google Scholar] [CrossRef]
  17. Jeong, E.H.; Yang, H.; Kim, J.-E.; Lee, K.W. Safflower Seed Oil and Its Active Compound Acacetin Inhibit UVB-Induced Skin Photoaging. J. Microbiol. Biotechnol. 2020, 30, 1567–1573. [Google Scholar] [CrossRef]
  18. Mu, J.; Chen, H.; Ye, M.; Zhang, X.; Ma, H. Acacetin resists UVA photoaging by mediating the SIRT3/ROS/MAPKs pathway. J. Cell. Mol. Med. 2022, 26, 4624–4628. [Google Scholar] [CrossRef]
  19. Park, W.T.; Arasu, M.V.; Al-Dhabi, N.A.; Yeo, S.K.; Jeon, J.; Park, J.S.; Lee, S.Y.; Park, S.U. Yeast extract and silver nitrate induce the expression of phenylpropanoid biosynthetic genes and induce the accumulation of rosmarinic acid in Agastache rugosa cell culture. Molecules 2016, 21, 426. [Google Scholar] [CrossRef]
  20. Zielińska, S.; Dryś, A.; Piątczak, E.; Kolniak-Ostek, J.; Podgórska, M.; Oszmiański, J.; Matkowski, A. Effect of LED illumination and amino acid supplementation on phenolic compounds profile in Agastache rugosa in vitro cultures. Phytochem. Lett. 2019, 31, 12–19. [Google Scholar] [CrossRef]
  21. Zielińska, S.; Piątczak, E.; Kalemba, D.; Matkowski, A. Influence of plant growth regulators on volatiles produced by in vitro grown shoots of Agastache rugosa (Fischer & C.A.Meyer) O. Kuntze. Plant Cell Tissue Organ Cult. PCTOC 2011, 107, 161. [Google Scholar] [CrossRef]
  22. Kim, T.H.; Shin, J.H.; Baek, H.H.; Lee, H.J. Volatile flavour compounds in suspension culture of Agastache rugosa Kuntze (Korean mint). J. Sci. Food Agric. 2001, 81, 569–575. [Google Scholar] [CrossRef]
  23. Liu, J.; Liu, Y.; Wu, K.; Pan, L.; Tang, Z.-H. Comparative analysis of metabolite profiles from Panax herbs in specific tissues and cultivation conditions reveals the strategy of accumulation. J. Pharm. Biomed. Anal. 2020, 188, 113368. [Google Scholar] [CrossRef] [PubMed]
  24. Putra, P.A.; Yuliando, H. Soilless culture system to support water use efficiency and product quality: A review. Agric. Agric. Sci. Procedia 2015, 3, 283–288. [Google Scholar] [CrossRef]
  25. Singleton, V.L.; Rossi, J.A. Colorimetry of total phenolics with phosphomolybdic-phosphotungstic acid reagents. Am. J. Enol. Vitic. 1965, 16, 144–158. [Google Scholar] [CrossRef]
  26. Meda, A.; Lamien, C.E.; Romito, M.; Millogo, J.; Nacoulma, O.G. Determination of the total phenolic, flavonoid and proline contents in Burkina Fasan honey, as well as their radical scavenging activity. Food Chem. 2005, 91, 571–577. [Google Scholar] [CrossRef]
  27. Son, Y.-J.; Choi, S.Y.; Hwang, I.-K.; Nho, C.W.; Kim, S.H. Could Defatted Mealworm (Tenebrio molitor) and Mealworm Oil Be Used as Food Ingredients? Foods 2020, 9, 40. [Google Scholar] [CrossRef] [PubMed]
  28. Benzie, I.F.F.; Strain, J.J. The ferric reducing ability of plasma (FRAP) as a measure of “antioxidant power”: The FRAP assay. Anal. Biochem. 1996, 239, 70–76. [Google Scholar] [CrossRef]
  29. Li, Y.L.; Stanghellini, C. Analysis of the effect of EC and potential transpiration on vegetative growth of tomato. Sci. Hortic. 2001, 89, 9–21. [Google Scholar] [CrossRef]
  30. Auerswald, H.; Schwarz, D.; Kornelson, C.; Krumbein, A.; Brückner, B. Sensory analysis, sugar and acid content of tomato at different EC values of the nutrient solution. Sci. Hortic. 1999, 82, 227–242. [Google Scholar] [CrossRef]
  31. Wu, M.; Kubota, C. Effects of high electrical conductivity of nutrient solution and its application timing on lycopene, chlorophyll and sugar concentrations of hydroponic tomatoes during ripening. Sci. Hortic. 2008, 116, 122–129. [Google Scholar] [CrossRef]
  32. Degl’Innocenti, E.; Hafsi, C.; Guidi, L.; Navari-Izzo, F. The effect of salinity on photosynthetic activity in potassium-deficient barley species. J. Plant Physiol. 2009, 166, 1968–1981. [Google Scholar] [CrossRef]
  33. Koyro, H.W. Effect of salinity on growth, photosynthesis, water relations and solute composition of the potential cash crop halophyte Plantago coronopus (L.). Environ. Exp. Bot. 2006, 56, 136–146. [Google Scholar] [CrossRef]
  34. Lam, V.P.; Kim, S.J.; Park, J.S. Optimizing the electrical conductivity of a nutrient solution for plant growth and bioactive compounds of Agastache rugosa in a plant factory. Agronomy 2020, 10, 76. [Google Scholar] [CrossRef]
  35. Hoekenga, O.A. Using metabolomics to estimate unintended effects in transgenic crop plants: Problems, promises, and opportunities. J. Biomol. Tech. JBT 2008, 19, 159. [Google Scholar]
  36. Zobayed, S.M.A.; Afreen, F.; Kozai, T. Temperature stress can alter the photosynthetic efficiency and secondary metabolite concentrations in St. John’s wort. Plant Physiol. Biochem. 2005, 43, 977–984. [Google Scholar] [CrossRef]
  37. Narayani, M.; Srivastava, S. Elicitation: A stimulation of stress in in vitro plant cell/tissue cultures for enhancement of secondary metabolite production. Phytochem. Rev. 2017, 16, 1227–1252. [Google Scholar] [CrossRef]
  38. Lu, N.; Bernardo, E.L.; Tippayadarapanich, C.; Takagaki, M.; Kagawa, N.; Yamori, W. Growth and accumulation of secondary metabolites in perilla as affected by photosynthetic photon flux density and electrical conductivity of the nutrient solution. Front. Plant Sci. 2017, 8, 708. [Google Scholar] [CrossRef] [PubMed]
  39. Chen, Y.; Guo, Q.; Liu, L.; Liao, L.; Zhu, Z. Influence of fertilization and drought stress on the growth and production of secondary metabolites in Prunella vulgaris L. J. Med. Plants Res. 2011, 5, 1749–1755. [Google Scholar]
  40. Stewart, A.J.; Chapman, W.; Jenkins, G.I.; Graham, I.; Martin, T.; Crozier, A. The effect of nitrogen and phosphorus deficiency on flavonol accumulation in plant tissues. Plant Cell Environ. 2001, 24, 1189–1197. [Google Scholar] [CrossRef]
  41. Tuan, P.A.; Park, W.T.; Xu, H.; Park, N.I.; Park, S.U. Accumulation of Tilianin and Rosmarinic Acid and Expression of Phenylpropanoid Biosynthetic Genes in Agastache rugosa. J. Agric. Food Chem. 2012, 60, 5945–5951. [Google Scholar] [CrossRef]
  42. Akagi, T.; Ikegami, A.; Suzuki, Y.; Yoshida, J.; Yamada, M.; Sato, A.; Yonemori, K. Expression balances of structural genes in shikimate and flavonoid biosynthesis cause a difference in proanthocyanidin accumulation in persimmon (Diospyros kaki Thunb.) fruit. Planta 2009, 230, 899–915. [Google Scholar] [CrossRef]
  43. Lillo, C.; Lea, U.S.; Ruoff, P. Nutrient depletion as a key factor for manipulating gene expression and product formation in different branches of the flavonoid pathway. Plant Cell Environ. 2008, 31, 587–601. [Google Scholar] [CrossRef]
  44. Moses, J.A.; Norton, T.; Alagusundaram, K.; Tiwari, B.K. Novel Drying Techniques for the Food Industry. Food Eng. Rev. 2014, 6, 43–55. [Google Scholar] [CrossRef]
  45. Prosapio, V.; Norton, I. Influence of osmotic dehydration pre-treatment on oven drying and freeze drying performance. LWT 2017, 80, 401–408. [Google Scholar] [CrossRef]
  46. Park, C.H.; Yeo, H.J.; Park, C.; Chung, Y.S.; Park, S.U. The Effect of Different Drying Methods on Primary and Secondary Metabolites in Korean Mint Flower. Agronomy 2021, 11, 698. [Google Scholar] [CrossRef]
  47. Das, A.; Raychaudhuri, U.; Chakraborty, R. Effect of freeze drying and oven drying on antioxidant properties of fresh wheatgrass. Int. J. Food Sci. Nutr. 2012, 63, 718–721. [Google Scholar] [CrossRef]
  48. Najjaa, H.; Chekki, R.; Elfalleh, W.; Tlili, H.; Jaballah, S.; Bouzouita, N. Freeze-dried, oven-dried, and microencapsulation of essential oil from Allium sativum as potential preservative agents of minced meat. Food Sci. Nutr. 2020, 8, 1995–2003. [Google Scholar] [CrossRef]
  49. Song, J.-H.; Kim, M.-J.; Kwon, H.-D.; Park, I.-H. Antimicrobial activity and components of extracts from Agastache rugosa during growth period. Prev. Nutr. Food Sci. 2001, 6, 10–15. [Google Scholar]
  50. Lee, T.H.; Park, S.; Yoo, G.; Jang, C.; Kim, M.-h.; Kim, S.H.; Kim, S.Y. Demethyleugenol β-glucopyranoside isolated from Agastache rugosa decreases melanin synthesis via down-regulation of MITF and SOX9. J. Agric. Food Chem. 2016, 64, 7733–7742. [Google Scholar] [CrossRef] [PubMed]
  51. Semwal, R.B.; Semwal, D.K.; Combrinck, S.; Trill, J.; Gibbons, S.; Viljoen, A. Acacetin—A simple flavone exhibiting diverse pharmacological activities. Phytochem. Lett. 2019, 32, 56–65. [Google Scholar] [CrossRef]
  52. Akanda, M.R.; Uddin, M.N.; Kim, I.-S.; Ahn, D.; Tae, H.-J.; Park, B.-Y. The biological and pharmacological roles of polyphenol flavonoid tilianin. Eur. J. Pharmacol. 2019, 842, 291–297. [Google Scholar] [CrossRef] [PubMed]
  53. Lee, H.W.; Ryu, H.W.; Baek, S.C.; Kang, M.-G.; Park, D.; Han, H.-Y.; An, J.H.; Oh, S.-R.; Kim, H. Potent inhibitions of monoamine oxidase A and B by acacetin and its 7-O-(6-O-malonylglucoside) derivative from Agastache rugosa. Int. J. Biol. Macromol. 2017, 104, 547–553. [Google Scholar] [CrossRef] [PubMed]
  54. Tian, L.; Cao, W.; Yue, R.; Yuan, Y.; Guo, X.; Qin, D.; Xing, J.; Wang, X. Pretreatment with Tilianin improves mitochondrial energy metabolism and oxidative stress in rats with myocardial ischemia/reperfusion injury via AMPK/SIRT1/PGC-1 alpha signaling pathway. J. Pharmacol. Sci. 2019, 139, 352–360. [Google Scholar] [CrossRef] [PubMed]
Figure 1. The preparation steps of A. rugosa samples. We applied the three EC conditions (1.5, 2.0, and 4.0 dS·m−1) for nutrient solution during cultivation and dried them by the freeze-drying (FD) or cold-air-drying (CD) methods.
Agronomy 13 02165 g001
Figure 2. Photographs of A. rugosa plants collected at weeks six, eight, and nine.
Agronomy 13 02165 g002
Figure 3. Growth parameters of A. rugosa plants cultivated under different nutrient solution concentrations. We measured plant height (A), the number of leaves (B), the fresh weight of the aerial (C) and underground parts (D), and the dry weight of the aerial (E) and root parts (F). Growth parameters were measured at weeks six, eight, and nine. Results are represented by the mean ± SD. Different letters indicate statistical differences within samples collected at the same week (p < 0.05, N = 5).
Agronomy 13 02165 g003
Figure 4. The antioxidative properties of A. rugosa samples. TPC (A), TFC (B), DPPH (C), ABTS (D), and FRAP (E) were determined. Results are represented by the mean ± SD. Different letters indicate statistical differences in p < 0.05 (N = 4). TPC, total phenolic acids contents; TFC, total flavonoid contents.
Agronomy 13 02165 g004
Figure 5. The cell viabilities of HaCaT and Hs68 cell lines after treatment with A. rugosa extracts. We first determined the cell toxicities of A. rugosa extracts in HaCaT and Hs68 cells (A,B). We also determined cell viability after treatment with A. rugosa extracts in UV-B irradiated HaCaT and Hs68 cells (C,D). The results are represented as the mean ± SD. Different letters indicate statistical differences in p < 0.05 (N = 4). NS, not significant.
Agronomy 13 02165 g005
Figure 6. Correlation plot of the characteristics of A. rugosa samples. The Pearson’s correlation was conducted between variables related to the antioxidative properties (TPC, TFC, DPPH, ABTS, and FRAP), major metabolites (RA, tilianin, and acacetin), and photoprotective effects (ROS_HaCaT and ROS_Hs68) of A. rugosa. ROS_HaCaT, reactive oxygen species amounts in UV-B irradiated HaCaT cell with treatment of A. rugosa extracts (40 μg/mL); ROS_Hs68, reactive oxygen species amounts in UV-B irradiated Hs68 cell with A. rugosa extract treatment (40 μg/mL).
Agronomy 13 02165 g006
Figure 7. Principal component analysis (PCA) plot of the variables and sample groups. The PCA was analyzed using the variables (A) and the loading plot was visualized (B).
Agronomy 13 02165 g007
Table 1. Concentration of rosmarinic acid (RA), tilianin, and acacetin in dried A. rugosa samples. The samples were harvested at week 9 and dried with cold-air-drying or freeze-drying methods.
SampleRosmarinic Acid
(mg/g, DW)
Tilianin
(mg/g, DW)
Acacetin
(mg/g, DW)
CD_1.5 (1)3.20 ± 0.83 b (2)3.83 ± 1.23 a0.02 ± 0.05 a
CD_2.00.61 ± 0.23 a9.10 ± 1.22 b0.98 ± 0.46 b
CD_4.00.09 ± 0.01 a4.01 ± 3.13 a0.87 ± 0.72 b
FD_1.54.50 ± 0.61 c3.30 ± 2.10 a0.20 ± 0.10 a
FD_2.04.18 ± 1.22 c4.86 ± 2.57 a0.29 ± 0.21 a
FD_4.03.00 ± 0.37 b3.17 ± 2.37 a0.12 ± 0.06 a
(1) CD_1.5, A. rugosa grown under EC 1.5 and cold-air-dried; CD_2.0, A. rugosa grown under EC 2.0 and cold-air-dried; CD_4.0, A. rugosa grown under EC 4.0 and cold-air-dried; FD_1.5, A. rugosa grown under EC 1.5 and freeze-dried; FD_2.0, A. rugosa grown under EC 2.0 and freeze-dried; FD_4.0, A. rugosa grown under EC 4.0 and freeze-dried. (2) Different letters indicate statistical differences within each column (p < 0.05, N = 6).
Table 2. The reactive oxygen species (ROS) content in UV-B irradiated HaCaT cells after A. rugosa extract treatment.
Sample ConditionSample Concentration
(μg/mL)
ROS Content
(Fold)
Drying MethodEC
Control cell (UV-B only)-34.29 ± 1.95 a
Cold air drying1.5532.39 ± 2.20 abc
2031.38 ± 1.62 abcde
4028.55 ± 1.74 efg
2.0531.83 ± 0.83 abcd
2028.48 ± 1.60 efg
4026.68 ± 1.78 g
4.0532.34 ± 1.17 abc
2031.28 ± 2.07 bcde
4029.85 ± 2.06 cdef
Freeze drying1.5533.52 ± 1.46 ab
2031.42 ± 2.36 abcde
4028.53 ± 2.02 efg
2.0532.57 ± 1.85 abc
2029.89 ± 1.49 cdef
4027.57 ± 2.02 fg
4.0533.50 ± 2.06 ab
2031.84 ± 1.55 abcd
4029.11 ± 1.49 defg
Results are represented as the mean ± SD. Different letters indicate statistical differences in p < 0.05 (N = 4).
Table 3. The ROS content in UV-B irradiated Hs68 cells after A. rugosa extract treatment.
Sample ConditionSample Concentration
(μg/mL)
ROS Content (Fold)
Drying MethodEC
Control cell (UV-B only)-30.22 ± 1.44 a
Cold air drying1.5529.69 ± 1.75 abc
2028.44 ± 1.98 abcde
4028.81 ± 2.67 abcd
2.0528.54 ± 0.98 abcde
2026.37 ± 1.46 ef
4025.67 ± 2.07 f
4.0530.49 ± 0.31 a
2028.99 ± 1.39 abcd
4028.96 ± 0.83 abcd
Freeze drying1.5529.13 ± 0.79 abcd
2028.56 ± 0.34 abcde
4027.80 ± 0.76 bcdef
2.0530.35 ± 1.26 a
2027.45 ± 0.79 cdef
4026.96 ± 0.74 def
4.0529.81 ± 0.56 ab
2028.39 ± 1.18 abcde
4028.53 ± 1.78 abcde
Results are represented as the mean ± SD. Different letters indicate statistical differences in p < 0.05 (N = 4).
Disclaimer/Publisher’s Note: The statements, opinions and data contained in all publications are solely those of the individual author(s) and contributor(s) and not of MDPI and/or the editor(s). MDPI and/or the editor(s) disclaim responsibility for any injury to people or property resulting from any ideas, methods, instructions or products referred to in the content.

