Article

Evaluation of Nitrogen and Phosphorus Responses on Yield, Quality and Economic Advantage of Winter Wheat (Triticum aestivum, L.) under Four Different Agro-Climatic Zones in Afghanistan

1
Department of Agriculture, Food, Environment and Forestry (DAGRI), University of Florence, Piazzale delle Cascine 18, 50144 Florence, Italy
2
Department of Agronomy, University of Baghlan, Pozaeshan, Baghlan 3602, Afghanistan
*
Authors to whom correspondence should be addressed.
Agronomy 2023, 13(2), 345; https://doi.org/10.3390/agronomy13020345
Submission received: 24 November 2022 / Revised: 18 January 2023 / Accepted: 21 January 2023 / Published: 25 January 2023

Abstract

:
The response of winter wheat (Triticum aestivum L.) to the application of different rates of nitrogen (N) and phosphorus (P) on different agro-climatic zones (ACZs) has not been well studied in Afghanistan. The objectives of this study were to (1) determine the impact of soil and climate on the responses of wheat to N and P fertilization, (2) quantify the specific N and P response of winter wheat for different ACZs, and (3) determine the economical application rates of N and P for farmers for each considered ACZs. This paper evaluates the effects of nitrogen levels (NL) at 35.28, 65, 95, and 120 kg N ha−1 and phosphorus levels (PL) at 0, 50, 70, and 90 kg P2O5 ha−1, respectively, in four locations (L) for two growing seasons (GS), on both yield and quality characteristics of winter wheat. Soil pH was the main environmental parameter affecting straw yield (SY), grain yield (GY), protein content (PC), and protein yield (PY). Winter wheat SY, GY, PC, and PY increased significantly (p < 0.05) with PL rates up to 50 kg P2O5 ha−1 and with NL rates up to 120 kg N ha−1. NL was the most important parameter in determining PC, thus showing potential for further improvement in N management. The highest marginal rate of return was used as an index for the farmers to accept site-specific N and P fertilizer recommendations.

1. Introduction

Winter wheat (Triticum aestivum L.) serves as a staple food crop in Afghanistan, followed by rice, barley, and maize, respectively. This crop contributes to about 60% of the total calories of the population’s diet with an annual consumption per capita of about 181 kg [1]. Winter wheat is considered a pivotal factor in improving farmers’ income, ensuring national food security, as well as creating jobs in Afghanistan [2]. Winter wheat has occupied about 70% of the total crop cultivation area in Afghanistan, accounting for 76% of national-cereal production, 49% of agriculture share in GDP, and 13.6% of the national GDP [1,3]. Winter wheat production in Afghanistan was estimated at around 3.902 million tons for 2021, which represents a reduction of 25% and 18% compared to 2020 and the last five-year average, respectively [4]. The average wheat productivity in Afghanistan is 2.5 t ha−1 in irrigated fields, but only 1.0 t ha−1 under rainfed conditions. Some major constraints were identified in the wheat sector of Afghanistan as follows: unfavorable climate conditions (severe drought), inadequate seed quality, poor field and nutrient management practices, and invasion of pests and diseases [5]. Moreover, the low quality of available fertilizers in the local market as well as poor knowledge about the supply of fertilizers were also found to be major determining factors for the low production [6]. Due to the above-mentioned factors, winter wheat production does not meet the national requirement [7] of about 7 million metric tons.
Potential opportunities to improve yield in the wheat sector of Afghanistan may include proper crop management, the wide use of good quality seeds, and the use of fertilizers [8]. In particular, nitrogen (N) and phosphorus (P) supply can play a vital role in plant development and optimal grain yield [9]. In plants, N is a key component of proteins, enzymes, and chlorophyll, thus affecting photosynthesis, substance synthesis and distribution, organ construction, and physiological processes [10]. In soil, N is mainly related to the soil organic matter (OM), as it is a component of OM and is subjected to transformation via microorganism activity [11,12]. P is involved in cellular respiration and energy transfer via adenosine triphosphate (ATP) and participates in the formation of cellular membranes and physiologic processes such as cell division and development in the roots and the growing tip [10,13]. Soils contain usually high pools of total P, but a small amount of readily available P. The P availability is mainly influenced by soil pH. In basic soils, such as those commonly occurring in Afghanistan, available monocalcium phosphate is shortly immobilized into tricalcium phosphate [14,15]. In these conditions, crop production losses related to the unavailability of phosphorus often occur [16,17].
The N and P balance represents a big challenge in optimizing local crop production [18]. On the one hand, fertilization increases production costs, but on the other hand, the correct amount of fertilizer distributed at the right moment can enhance both wheat quality and quantity [19,20]. Although topdressing N application can maximize both GY and N use efficiency, attention should be paid to the optimal doses for reducing N volatilization and leaching [21]. Furthermore, despite P being found to enhance winter wheat quality as well as quantity, it is necessary to expand the current knowledge regarding optimal dosage, given the low availability in soil [22,23].
The Ministry of Agriculture Irrigation and Livestock of Islamic Republic of Afghanistan recommended for winter wheat improved varieties that farmers apply 115 kg N ha−1 and 92 kg P2O5 ha−1 that can be reduced to 46 kg P2O5 ha−1 when P fertilizers are not economically affordable. However, this recommendation does not take into consideration differences in climate and soil parameters despite them significantly affect the nutrient use efficiency and winter wheat productivity [24,25]. In fact, contradictory effects in response to N and P fertilization on winter wheat have been reported by previous studies in different locations (L) of Afghanistan [26,27,28]. Conversely, the best N and P levels should be selected on the basis of growth limits imposed by the different soil and climatic conditions, which can vary greatly between the 7 agro-climatic zones (ACZ) into which Afghanistan is divided.
Better matching of N and P fertilizers at rates suitable to the local climate and soil type can increase the productivity of wheat. Thus, the development of recommendations on N and P fertilization of winter wheat, differentiated according to, soil type, and economic returns of farmers, could be a potential opportunity to improve winter wheat production in Afghanistan. Therefore, the objectives of this study were to (1) determine the impact of soil and climate on the responses of wheat to N and P fertilization; (2) quantify the specific N and P response of winter wheat for different ACZs; and (3) determine the economical application rates of N and P for farmers for each considered ACZs.

2. Materials and Methods

2.1. Field Experiment

The experimental fields were set up in Afghanistan, from September 2016 to July 2018 under irrigation, at four locations in different ACZs: Baghlan (BGL), Balkh (BLK), Helmand (HLM), and Herat (HRT) (Figure 1).
The soil at all locations was alkaline and characterized by low organic matter and poor nutrient availability, specifically N and P (Table 1). Of the four locations, the highest available P and N values were detected in BGL, while the lowest were in BLK.
In this case, 16 treatments were obtained from the factorial combination of 4 nitrogen fertilization levels (NL) (35.28, 65, 95, and 120 kg N ha−1, namely NL35.28, NL65, NL95, and NL120, respectively) and 4 phosphorus fertilization levels (PL) (0, 50, 70 and 90 kg P2O5 ha−1, namely, PL0, PL50, PL70, and PL90, respectively). The NL35.28 and PL0 treatments represented the control for nitrogen and phosphorous fertilization rates, respectively. One improved winter wheat variety (Kabul-13) was used for this study, originating from the international maize and wheat improvement center (CIMMYT), with the pedigree of WAXWING*2/TUKURU. This wheat variety is resistant to Ug99 and is resistant to most rust varieties in Afghanistan. Furthermore, this variety was capable of producing an average grain yield of over six tons per hectare. For these reasons, the winter wheat variety Kabul-13 is considered the most promising for improving Afghan wheat production in the coming time. The sowing was performed at a rate of 120 kg seed ha−1. The trail was arranged in a split-plot design (SPD) with three replicates, where NL was arranged in the main plots and PL in the sub-plots, respectively. The plot size was 1.5 × 5 m (7.5 m2), and each plot contained six rows with a spacing of 0.25 m. Four central rows with a net experimental unit size of 4 m2 were considered for the investigation and data collection. The soil was plowed at a depth of 0.40 m and then harrowed at a depth of 0.10 m in October 2016 and September 2017, for both the first and the second growing seasons (1st GS, 2nd GS), respectively. The different farm operations, including sowing, fertilizer distribution, weeding, irrigation, pest and disease control, common wheat harvesting, and threshing, were carried out manually. In both growing seasons, although no chemicals were used to control pests and diseases, the plants were healthy, and no damage was observed. P fertilizer in form of triple superphosphate (P2O5: 46%) was applied at sowing, while the required N fertilizer was applied in the form of Urea (N:46%) in three applications as follows: 18% at sowing, 41% tillering, and 41% at stem elongation. In all locations, plots were irrigated by furrow with riverine water. A total of 500 mm of water was divided into five applications. Two irrigations were performed in the fall: about 150 mm of water were distributed before sowing to increase the soil water reserves in the topsoil layer and to obtain uniform germination. In this case, 50 mm of water was scheduled 21 days after sowing to favor the crown root initiation. Next, three irrigations (100 mm of water each) were performed in the spring by distributing water at the booting, at the flowering, and at the milking stage.
At physiological maturity, 20 plants were randomly chosen from each experiment unit to count the tiller number (TN; n) and to measure the plant height from ground level to the spike peak (PH; m). At harvesting, the above-ground biomass was collected and the weight of the kernels (GY; kg ha−1 [adjusted to 12% moisture]), the straw yield (SY; kg ha−1), and the thousand kernel weight (TKW; g 1000 seeds−1) were measured for each plot. The whole meal flour samples (5 mg) were analyzed with a CHNS analyzer (CHN-S Flash E1112, Thermo-Finnigan LLC, San Jose, CA, USA) to determine total nitrogen percentage and then converted to total protein percentage (PC, %) by multiplying by 5.7, according to ICC Standard 167 (2000), as reported in Soofizada et al. (2022) [29]. The protein yield per hectare (PY, kg ha−1) was calculated as the product of GY by PC.
According to the recommendations of CIMMYT (1988) [30], a partial budget was calculated as a function of total variable cost (TVC), gross benefit (GB), the net benefit (NB), and lastly the calculation of the marginal rate of return (MRR). The average market price for input (fertilizer) at sowing time and for output (GY and SY) at harvest time were considered. Accordingly, 0.48, and 0.90 US dollars were calculated per kg of N and P, and 269.8 and 126 US dollars were per metric ton of GY and SY, respectively. Meanwhile, on average one US dollar was equivalent to 72.23 Afghani (AFS). However, for the calculation of the net revenue (NR) and the percentage of the marginal rate of return (MRR), we applied the following formula:
NR = TR TF
MRR = ( n 2 n 1 ) ( f 2 f 1 ) × 100
This equation is represented by the following variables as follows: TR = total revenue (total price gained from GY and SY); TF = the total cost paid for fertilizer; n2 = the higher level of net revenue; n1 = the lower level of net revenue; f2 = the higher level of fertilizer and f1 = the lower level of fertilizer, respectively.

2.2. Meteorology Data

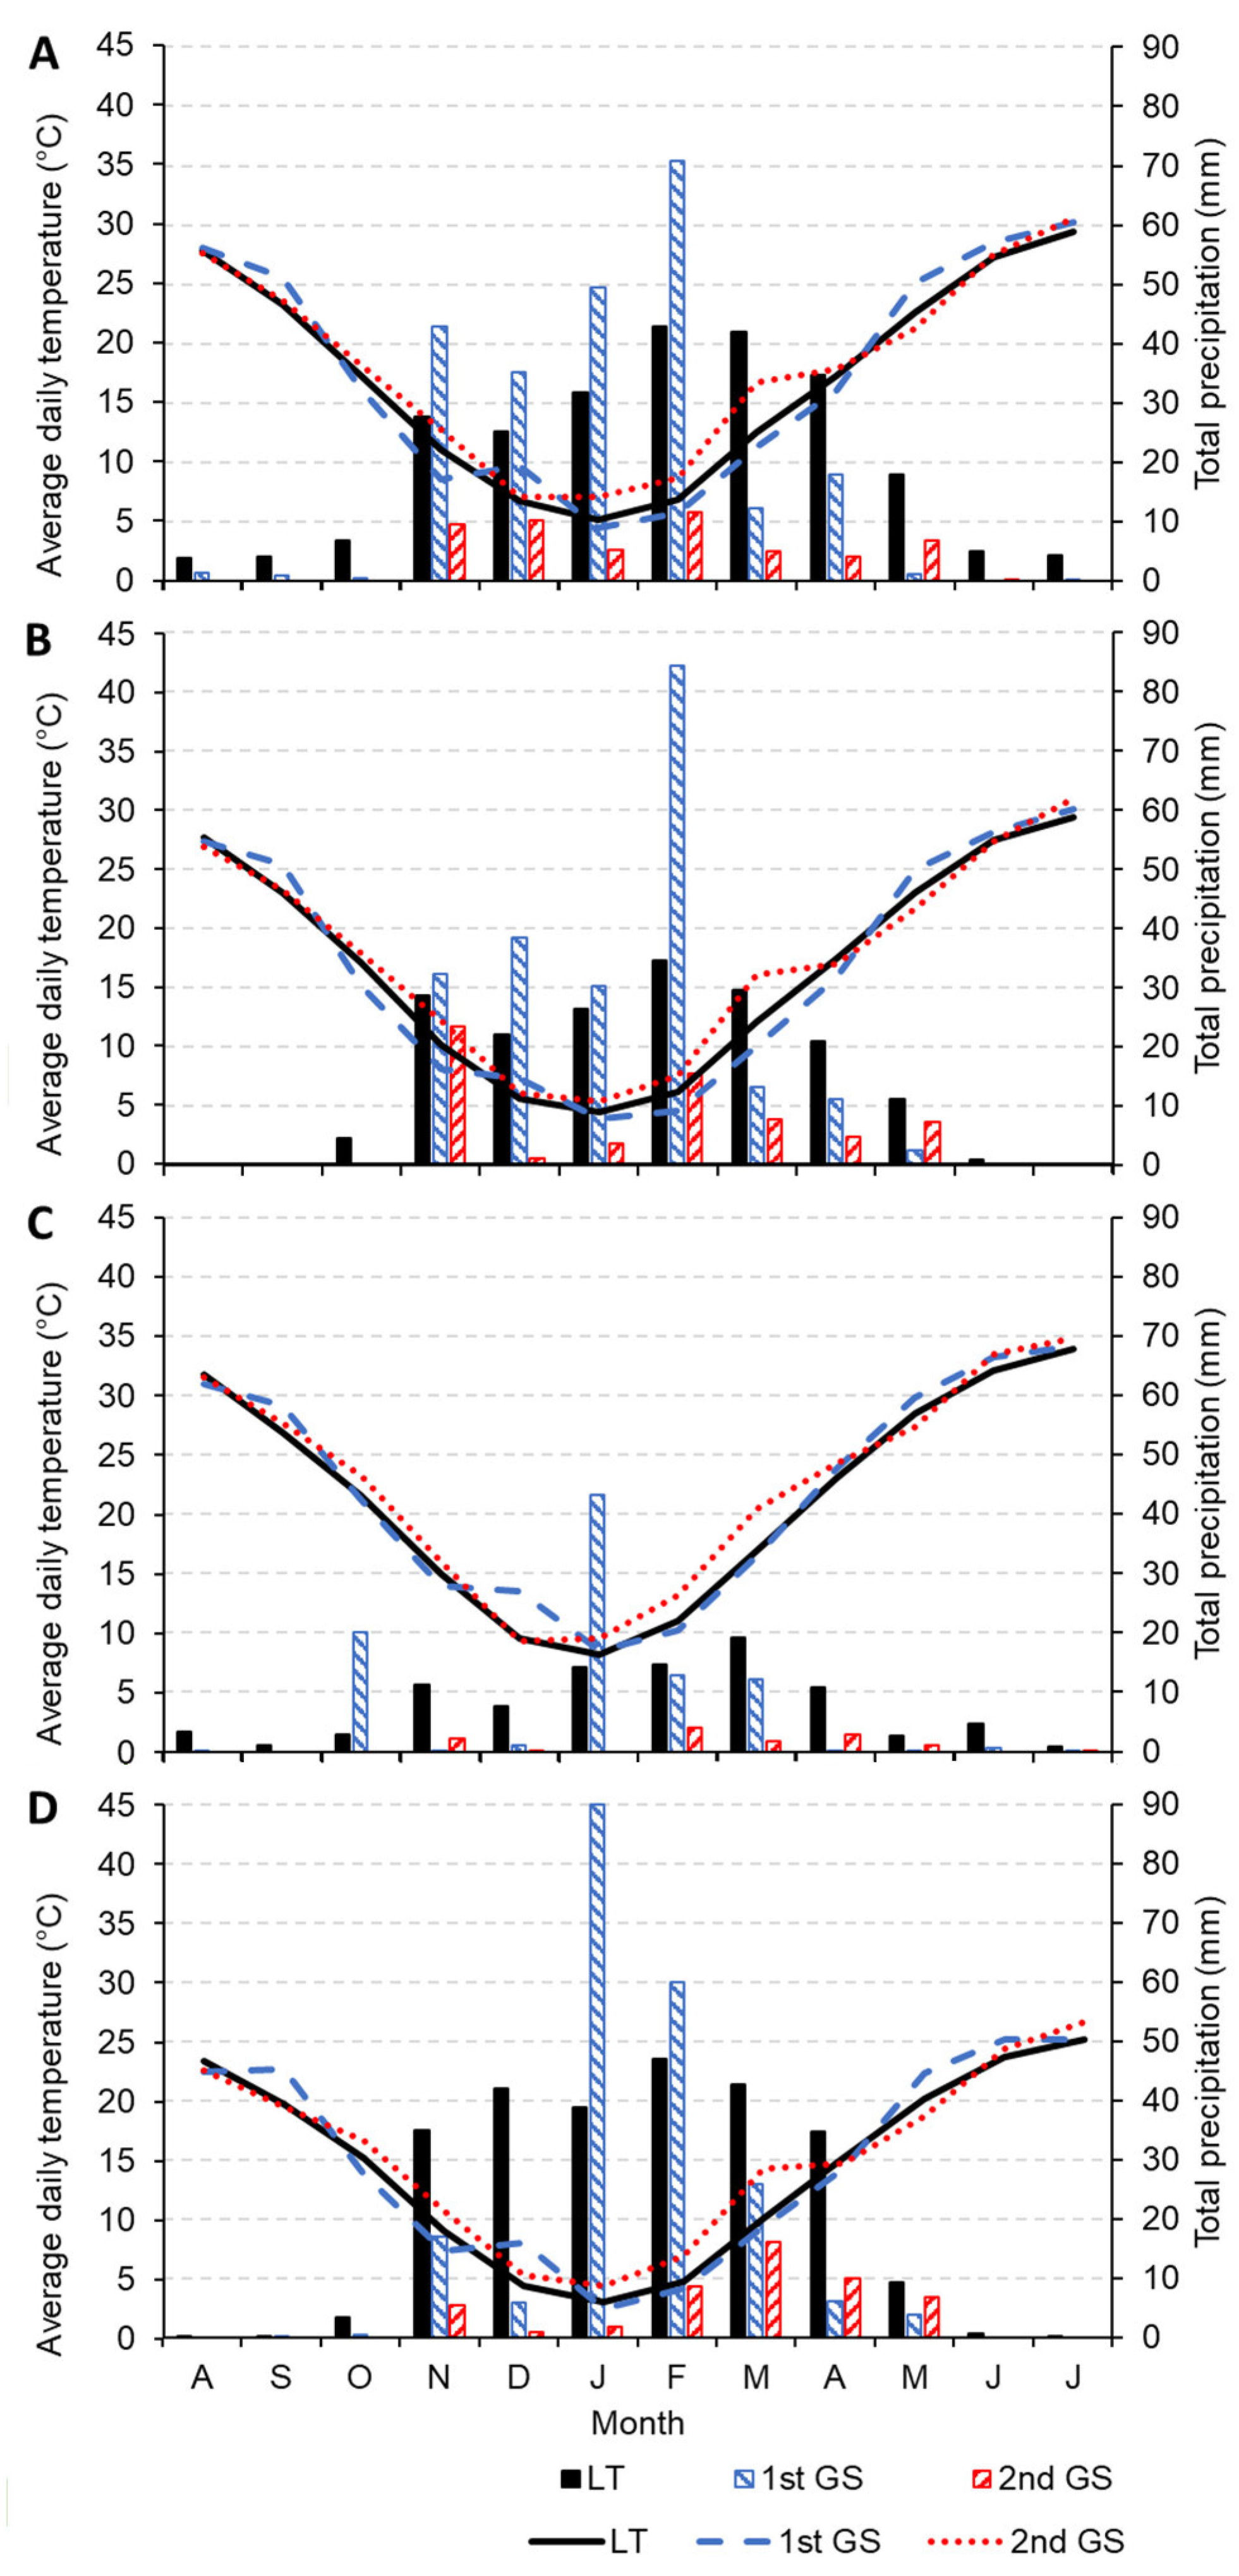
According to FAO (1998) [31], all the locations were considered semi-arid, except HLM which was considered arid. The climatic conditions were further analyzed by collecting data from the NASA database (https://power.larc.nasa.gov/data-access-viewer/, accessed on 17 December 2022). Long-term (2001–2020), as well as the 1st and 2nd growing season (GS), (2017 and 2018) data of the four locations, were elaborated (Figure 2). According to the long-term data, among the experimental sites, HLM was the location with the highest average temperature (21.5 °C) and lowest precipitation (rainfall+snow) (93.1 mm). Likewise, the BLK and BGL regions reported almost similar temperature patterns, but BLK (178.85 mm) had a lower average annual precipitation than BGL (245.83 mm). Moreover, HRT was the coldest and wettest of the experimental fields considered, with an average annual temperature of 14.5 °C, and an average precipitation of 253.95 mm. During the 1st GS, there was a similar temperature pattern compared to that of the long-term, except for December. The average annual precipitation for the considered locations was not significantly different from the long-term values, but differences were detected in the pattern of monthly precipitation distribution. The 2nd GS was completely dry and hot for all the considered locations. In fact, during August, September, and October of the 2nd GS no precipitation events occurred, and in HLM only 15 mm of precipitation occurred during the growing season. For each L and GS, the cumulated precipitation values for the tillering to grain filling period (P_TGf) were calculated as the accumulation of daily precipitation in the same period. The growing degree day (GDD) [32] is commonly used to describe the timing of biological processes [33,34,35]. The GDD value was daily calculated as the difference between the daily average temperature (Tavg; °C) and a crop base temperature (Tb; °C). According to Fabbri et al., (2000) [35] and Saiyed et al., (2009) [36], the Tb was set to 4 °C. The cumulated GDD values for the tillering to grain filling period (GDD_TGf) were calculated as the accumulation of daily GDD over the same period.

2.3. Statistical Analysis

Analyses of data were performed utilizing the RStudio version (R 4.1.1.). A multifactorial analysis of variance (ANOVA) was performed to determine the main effect of NL and PL fertilization and their interactions. In the case of significant differences, differences between means were compared using the Tukey HSD post-hoc test. Significance was determined as follows: * = 0.05, ** = 0.01, *** = 0.001, n.s. = not significant. A gradient-boosted regression tree (GBRT) statistical analysis was performed to assess the relative influence of explanatory variables on the variation of winter wheat agronomic traits (SY; GY; PC; PY). A correlation matrix was used to check for redundancy among covariates and eliminate collinear variables, using a threshold of 0.8. The BRT fit was analyzed using a tenfold cross validation. BRT model was performed using a tree complexity of 5 and a learning rate of 0.01.

3. Results

3.1. Agronomic Traits and Kernel Analyses

In terms of TN per plant, L was the dominant factor followed by PL and GS, while NL did not significantly affect GY (Table 2). Additionally, TN was significantly affected by the interaction GSxL, while no other significant interactions were detected. The highest average TN was detected in HRT, followed by BLK and HLM, while the lowest average TN was recorded in BGL (Table 3). Furthermore, the mean TN at PL70 and PL90 was significantly higher than the control by 10.07% and 9.74%, respectively.
The L was the principal factor affecting average PH, followed in decreasing order by PL, GS, and NL, respectively. Additionally, average PH was significantly affected by two order interactions, in particular GSxL, LxPL, and LxNL. The average PH significantly increased as PL and NL rates increased, with the highest average PH values being measured at NL120 and PL90. The highest average PH was measured in HRT, followed in decreasing order by BGL, HLM, and BLK, respectively. Lastly, the average PH measured in the second GS was significantly higher than that measured in the first GS.
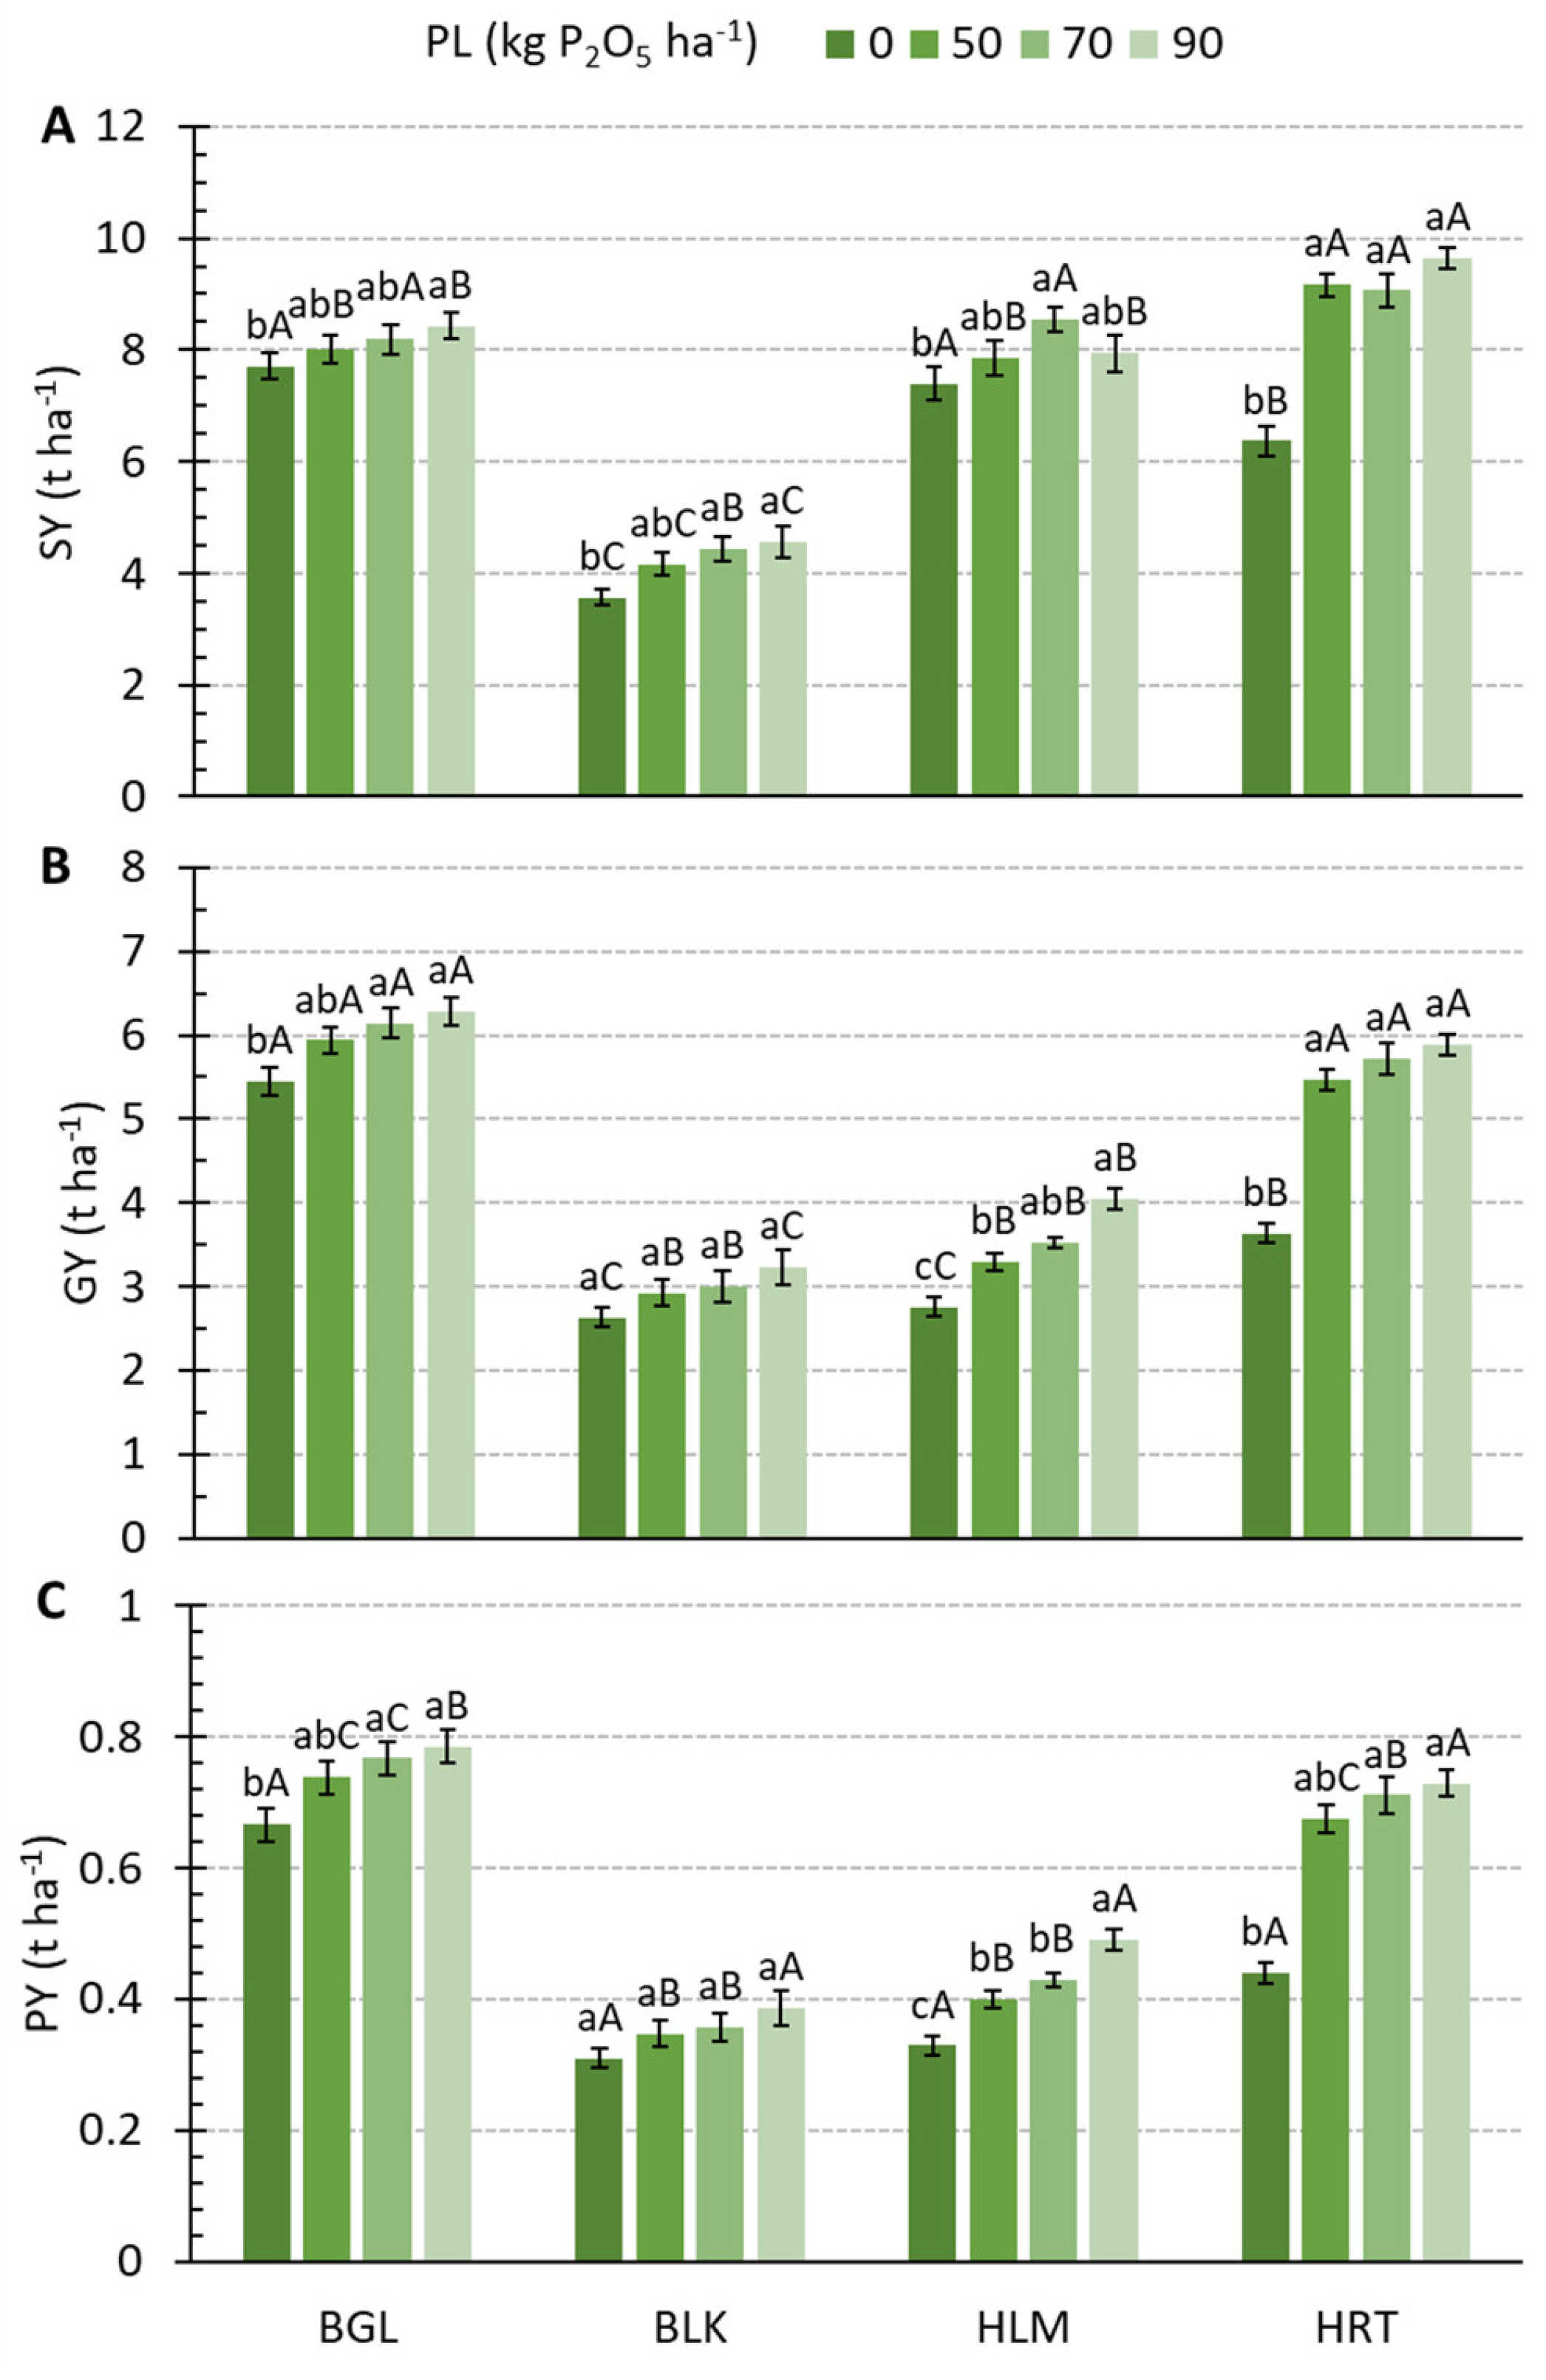
SY was firstly affected by L and secondly by PL, while the remaining principal factors did not significantly influence SY. The same two interactions, GSxL and LxPL, showed a significant influence on SY. The results indicated that the lowest SY was measured at PL0. Instead, SY at PL90, PL70, and PL50 was higher than the control by about 18.06%, 17.19%, and 14.25%, respectively. Furthermore, results indicated that L strongly influenced SY. The highest SY was recorded in HRT, followed in decreasing order by BGL, HLM, and then BLK, which showed the lowest SY. It was found that SY increased significantly as the PL increased in BLK, whereas in BGL, no significant increment was detected (Figure 3). The phosphorous fertilization significantly increased the straw production in HRT with respect to the control, while no significant difference in SY was detected between the PL fertilization rate from 50 to 90 kg P2O5 ha−1. In HLM, the highest SY was measured in PL at 70 kg P2O5 ha−1.
ANOVA results indicated that GY was mainly affected by L, followed by GS, PL, and NL. As regards the second-order interaction, only GSxL and LxPL significantly affected GY. The results indicated that the nitrogen rate at 65, 95, and 120 kg N ha−1 significantly increased GY by 9.11%, 14.69%, and 18.28%, respectively, compared to the lowest N rate (NL35.28). Furthermore, the mean GY values significantly increased by 17.91%, 21.30%, and 25.51%, for PL50, PL70, and PL90, respectively, compared to the lowest P rate (PL0). The highest average GY was measured in BGL, followed in decreasing order by HRT, HLM, and BLK, respectively. The average GY measured at the harvest of the 2nd GS was 12.8% lower than that measured in the first GS. It was found that GY increased significantly as the PL increased in BLK and HRT, whereas no significant increment was detected in BLK (Figure 3). In HRT, the phosphorous fertilization significantly increased the grain production with respect to the control, while no significant difference in GY was detected between the PL fertilization rate from 50 to 90 kg P2O5 ha−1.
In the present study, TKW was mainly affected by L, followed by GS, NL, and PL, the sole factor affecting HW (Table 2). Furthermore, TKW was affected by all the second-order interactions except GSxPL. BLK and HLM locations featured the highest TKW values, followed by HRT, and lastly BGL, which showed the lowest TKW value. The nitrogen fertilization increased the TKW. The TKW was increased by 2.35 and 4.30% in NL95 and NL120, respectively, compared to the control. No significant difference in TKW values was detected between NL65, NL95, and NL120, although all of the latter were significantly higher than the control. The average TKN value measured in the 1st GS was significantly higher than that measured in the 2nd GS.
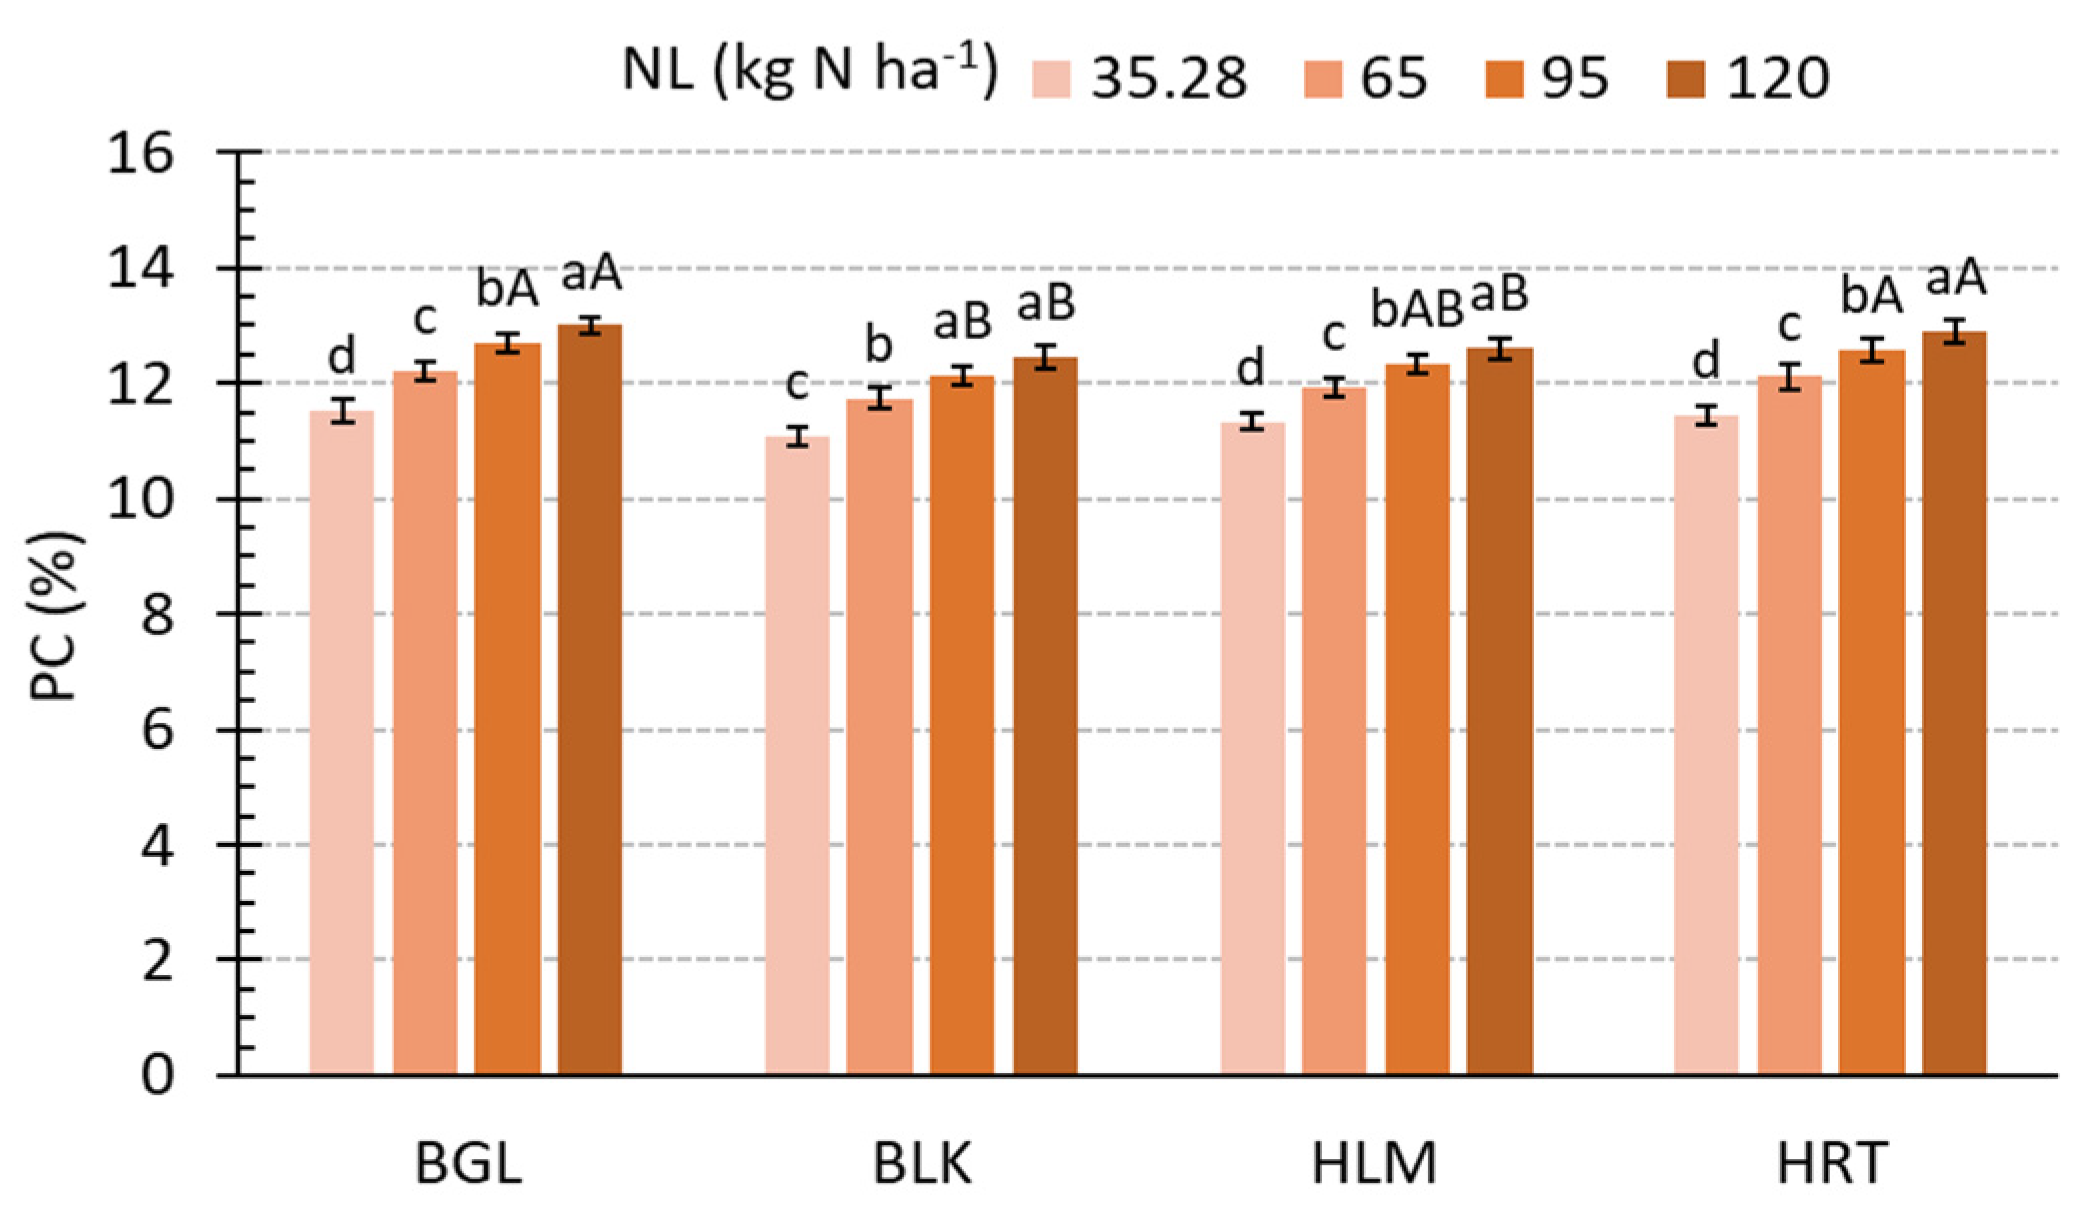
According to the ANOVA, the PC was significantly dominated by NL, followed by L, GS, and then PL, respectively. On the contrary, L was the dominant factor for PY, followed in decreasing order by Gen, NL, PL, and GS. As regards the second-order interaction, PC and PY were significantly affected by GSxL, LxNL, and LxPL. The results indicated that PC significantly increased as the N rate increased. In particular, the NL65, NL95, and NL120 treatments increased the average PC by 5.8%, 9.6%, and 12.3%, respectively, compared to the control. Similarly, the NL65, NL95, and NL120 treatments increased the average PY by 18.1%, 29.5%, and 38.6%, respectively, in comparison to the control. PC and PY significantly increased between PL0 and PL50, while no further significant increase between PL50 and the other two PL levels was detected. The highest average PC was determined in BGL, with the lowest recorded in BLK. The average PC determined in BGL and HRT was significantly higher than that determined in HLM and BLK. The average PC determined in the 1st GS was higher than that determined in the 2nd GS, while the opposite was detected for the average PY. In HLM and HRT, the PC increased as NL significantly increased from NL35.28 to NL120 (Figure 4). In contrast, in BGL and BLK, the PC increased as NL increased from NL35.28 to NL95, but no further significant increment was detected between NL95 and NL120. In BLK and HRT, the PY increased significantly as the PL increased, while in BLK no significant increment was detected (Figure 3). In HRT, the phosphorous fertilization significantly increased protein production with respect to the control, while no significant difference in PY was detected between the PL fertilization rate from 50 to 90 kg P2O5 ha−1.
Soil pH was negatively correlated to OM, Av_P, Av_K, and Tot_N (Table 4). Whereas, OM, Av_P, Av_K, and Tot_N were positively correlated to each other. GDD_TGf correlation with P_TGf was significant and negative. GDD_TGf was negatively correlated with OM, Av_P, Av_K, and Tot_N, while positively correlated with pH. On the opposite, P_TGf was positively correlated with OM, Av_P, Av_K, and Tot_N, while negatively correlated with pH. The correlation of GY, PC, and PY with pH was significant and negative, while the correlation with OM was significant and positive. SY was negatively correlated with pH, while no significant correlation with OM was detected. The correlation of both Av_P and Tot_N with SY, GY, PC, and PY was positive and significant. Conversely, Av_K was positively correlated with GY and PY, negatively correlated to SY, and not significantly correlated to PC. Both GDD_TGf and P_TGf were not significantly correlated to SY and PC. Further, GY and PY were negatively correlated to GDD_TGf, while positively correlated to P_TGf. The correlation of GY, PC, and PY with NL and PL were significant and positive. SY was positively correlated by PL, while no significant correlation with NL was detected. NL and PL were not significantly correlated to any soil and climatic parameters.
The GBRT model provided the relative contribution of each parameter on SY, GY, PC, and PY (Figure 5). Among the parameters, the management parameters were the most influential (having altogether 41.6% relative contribution to SY). NL was the most influential parameter in SY production, followed by PL, pH, and GDD_TGf. The relative contribution of NL, PL, pH, and GDD_TGf was 22.1%, 19.4%, 18.9%, and 14.8%, respectively, while the relative contribution of OM, Av_P, and P_TGf was lower than 10%. The relative contribution of soil, climate, and management parameters to GY was 46.7%, 22.5%, and 30.8%, respectively. In particular, pH was the most important parameter affecting GY, followed by Av_P, PL, GDD_TGf, and NL. The relative contribution of Av_P, PL, GDD_TGf, and NL on GY was 26.25%, 15.9%, 15.6%, 15.1%, and 15.1%, respectively, while the relative contribution of OM and P_TGf was lower than 10%. The range between the two leading parameters was high (58.5%), with NL being the most dominant parameter in explaining PC variability (relative contribution = 70.2%), followed by pH (relative contribution = 11.7%). PL and GDD_TGf explained the 7.5% and 6.9% of the PC variability, while the percentage of the relative contribution of OM, Av_P, and P_TGf was lower than 2%. Soil, climate, and management parameters contribute to explain the 46.1%, 20.3%, and 33.6%, respectively, of PY variability. pH was found to have the highest contribution in explaining the PY variability (27.5%), followed in decreasing order by NL, PL, Av_P, and GDD_TGf, with 18.5%, 15.2%, 14.8%, and 13.4%, respectively. The relative contribution of OM and P_TGf was 3.8% and 6.9%.

3.2. Partial Economic Analyses

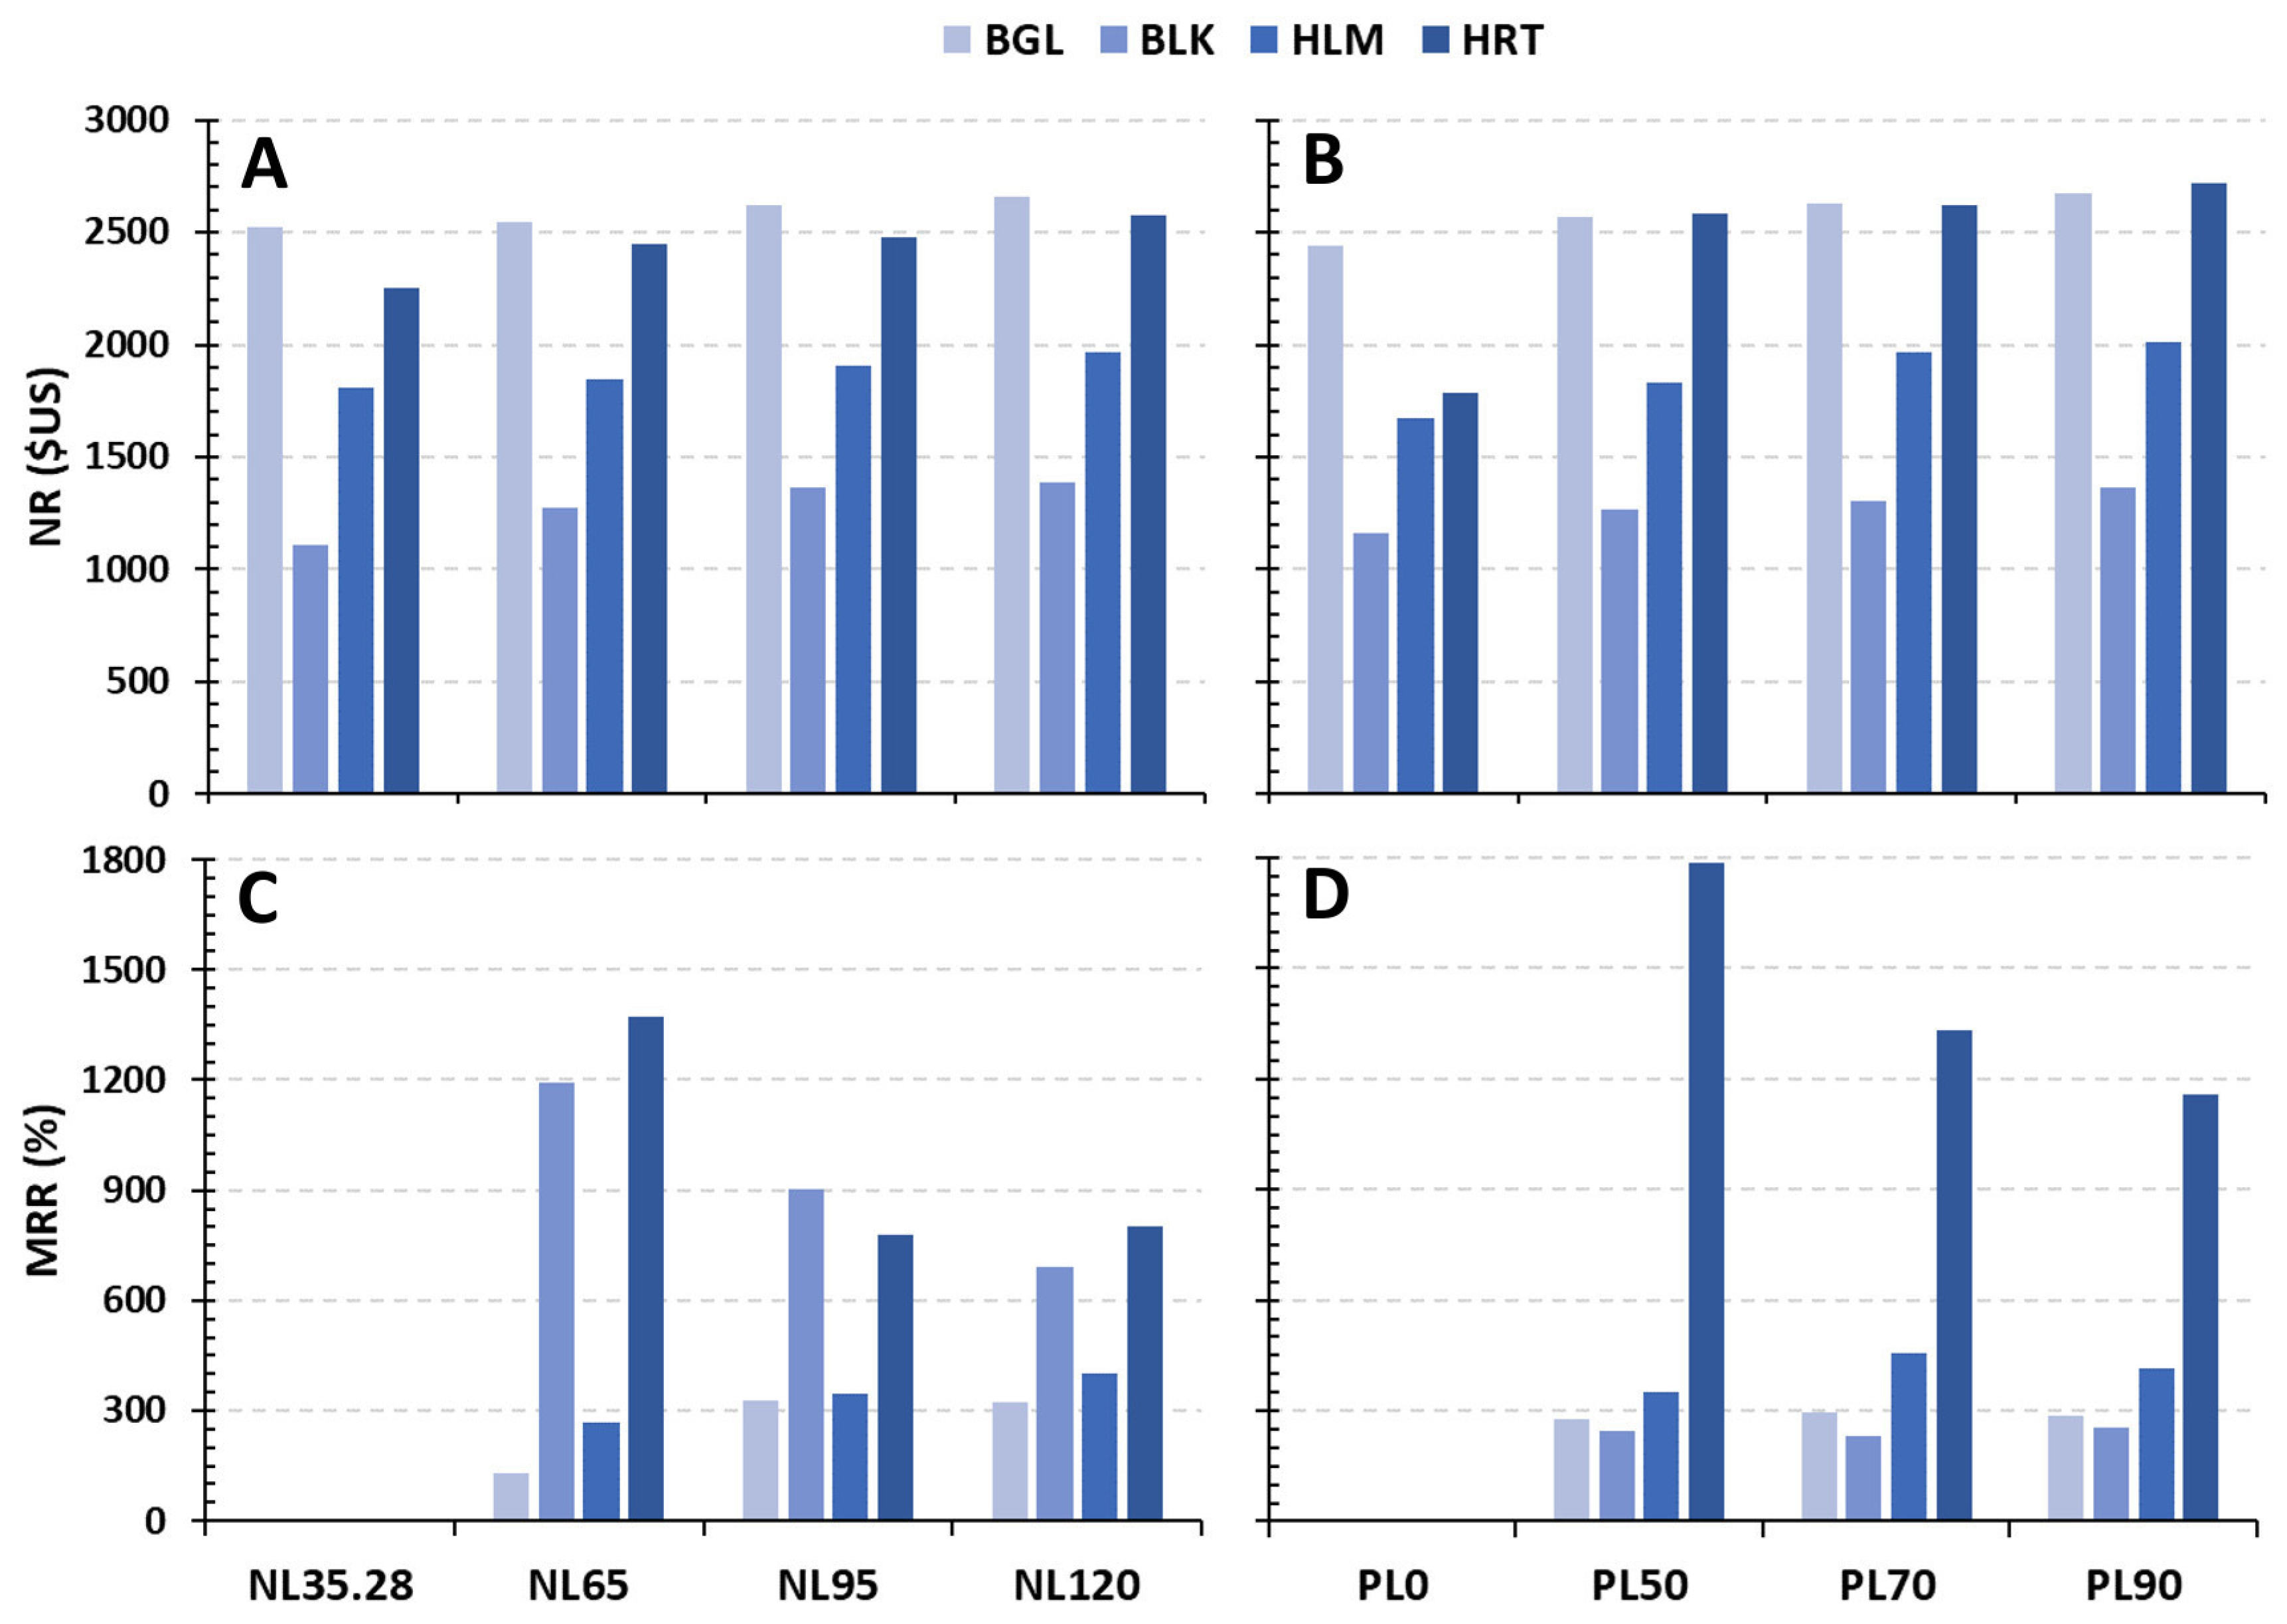
The results indicated that a farmer distributing 90 kg P2O5 ha−1 can gain an increase of about 1089, 398, 254, and 208 US$ in net profit as compared to PL0, at HRT, HLM, BGL, and BLK, respectively (Supplementary Table S1). Further, by distributing 120 kg N ha−1, farmers can gain an increase by about 408, 335, 202, and 195 US$ in net profit, as compared to the NL35.28, at HRT, BLK, HLM, and BGL, respectively. Additionally, this study found that by invest of 1.4 US$ (1 kg P), a farmer can obtain a net profit of 15, 4.1, 2.8 and 2.1 US$, at HRT, HLM, BGL and BLK, respectively. In addition, a farmer can obtain net profit of 5.7, 5.4, 2.1, and 2 US$, by invest of 0.7 US$ (1 kg N), at HRT, BLK, HLM, and BGL, respectively.
The marginal rate of return due to N and P fertilization at each level was greater than 100% at all Ls (Figure 6), but the response to fertilization was found to differ according to L. Subsequently, in BGL the highest MRR was obtained from NL95 and PL70, indicating that in BGL the highest rates of N and P were not the best choices from an economic point of view. Nevertheless, in BLK, NL65, as well as PL90, showed the highest MRR. A similar result was evident in HLM, where NL65 showed the highest MRR for the N rate, and PL90 for the P rate, respectively. In HRT, NL120 and PL50 showed the highest MRRs for N and P rates, respectively.

4. Discussion

As reported by Hashimi et al., (2020) [37], Afghanistan’s soils are formed under arid and semi-arid climatic conditions and are characterized by sub-alkaline to alkaline pH, high in calcium carbonate, but low in OM content. Further, deficiencies of Tot_N and Av_P are widespread in Afghanistan soils [38,39]. Our results indicate that the soil and climate conditions in Afghanistan can affect winter wheat SY, GY, and PY, as much as N and P fertilization.
Since the plots were irrigated in the 4 L, the P_TGf effect on winter wheat growth was marginal as compared to the effect of GDD_TGf and other soil and management parameters. This result suggested that irrigation softens the effects of high GDD_TGf and P_TGf shortage during the growing season. However, as suggested by Zaveri and Lobell (2019) [40] any increase in irrigation access should also be accompanied by sustainability considerations to avoid groundwater depletion and surface water scarcity during drought periods. In general, the results can be useful for Afghan agriculture given that irrigated agriculture is the mainstay of food security and income for the majority of the rural population in Afghanistan [41]. In fact, as reported by Kawasaki et al. (2012) [42], the agricultural output in irrigated agriculture is twice or three times larger than that in rainfed one. However, our results can support the farmer’s decision in irrigated land under arid climates, such as those of Afghanistan, while they should be evaluated with caution in areas where farmers can only rely on rainfall for water.
Considering the 4 Ls in this study, soil pH appeared to play a more important role in affecting GY and PY than other soil (Av_P and OM), climate (GDD_TGf and P_TGf), and management (NL and PL) parameters. Further, pH was also the main environmental parameter affecting SY and PC. It is well known that pH influences the activity of microorganisms, enzymes, and the availability of nutrients, and so it plays an important role in regulating plant growth and yield. In particular, alkaline soils, such as those in BLK and HLM, generally have reduced availability of Av_P and micronutrients such as boron, iron, manganese, and zinc. The results suggested that lowering the pH in Afghan alkaline soils could greatly boost production. However, soils containing carbonate (pH > 7.3) could require a large number of ameliorants, such as elemental sulfur, to neutralize carbonate before they can reduce soil pH. Therefore, due to the cost, the application of ameliorants to acidify soils could be more practical for horticultural crops than for field crops. While in field crops, such as winter wheat, farmers could overcome lower availability of Av_P and micronutrients with banded phosphorus fertilizer and chelated micronutrient applications.
P is often the most limiting nutrient for crop yield in Afghanistan. In addition, it was shown in the present study that P availability was a limiting factor for winter wheat growth. Our results indicated that winter wheat GY and PY increased significantly with PL rates (p < 0.05) in the four Ls. This is in accordance with the previous results observed by other authors [38,39,41]. P was also found positively affect the winter wheat SY, with SY harvested in PL50, PL70, and PL90 being significantly higher than that in PL0. Despite the highest SY measured by distributing 90 kg P2O5 ha−1, no significant differences were detected between PL50, PL70, and PL90. Regarding PC and PY, a significant difference was detected between PL0 and PL50, while a further increase in P application did not significantly affect both quality parameters. Our results indicate that the distribution of 50 kg P2O5 ha−1 can be considered an adequate rate so that the availability of P2O5 is not limiting for winter wheat growth. These results were consistent with previous studies [26,37,40,41].
The present study showed a significant increase in GY with increasing rates of N application on different Ls. These results are consistent with previous research documenting significant increases in winter wheat GY to increases in N fertilization rate on different soil types [29,43,44,45,46]. Further, the effect of the N fertilization was shown to be more effective for quality parameters as compared to the P distribution. The present results for PC and PY were consistent with those measured in previous studies showing that N fertilization substantially increased the PC and PY [29,47]. As expected, NL was the most important factor in determining PC, compared to other considered variables including climate and soil parameters, showing potential for further improvement in N management. Further, it should be also noted that the application of urea or ammonium N fertilizer can locally induce soil acidification by the oxidation of organic compounds, loss of basic cations through ion exchange, plant uptake, and nitrification of ammonium [48]. In general, this could have positive effects on alkaline soils such as those in BLK and HLM. Conversely, attention should be paid to applying animal manure as it may raise the soil pH.
The cost-benefit analysis is crucial to winter wheat growers because they are interested in observing the increased net benefit from the investment in fertilization. According to the economic training manual for farmers by CIMMYT [30], an increase in output generally rises profit as much as the marginal rate of return is higher than the minimum rate of return, i.e., 50 to 100%. Since the marginal rate of return in all Ls due to N and P application is higher than 100%, the application of N and P fertilizers can be considered economical. When considering the net revenue, the highest values were observed at NL120 and PL90 for all Ls. These results were consistent with previous studies, showing for invest of 1 US$ for N and P in soil, the farmer’s net profit increased up to 6.25 US$ in Afghanistan [49]. However, in each Ls, farmers must choose the N and P fertilization levels according to the highest marginal rate of return. In fact, the highest marginal rate of return can be considered a guarantee for the farmers to accept site-specific fertilizer recommendations.

5. Conclusions

From the results of this study, it can be concluded that the high soil pH the main environmental factor limiting the efficiency of N and P fertilization in irrigated winter wheat in Afghanistan. Across all four Ls, the application of 50 kg P2O5 ha−1 was sufficient for winter wheat grain production both in terms of quantity and quality. Given soil pH above 7.3, to increase the P efficiency it should be applied at planting, banded with or near the seeds. A significant increase in SY and GY with increasing rates of N application was found in all Ls. As expected, N fertilization was the most important factor in determining PC, showing potential for further improvement in N management. However, the optimal N rates in each Ls should not be calculated on the basis of the highest expected production, but on the basis of the highest marginal rate of return. Further field trials in different pedo-climatic conditions should be carried out to improve the understanding of the factors limiting the N and P fertilization efficiency.

Supplementary Materials

The following supporting information can be downloaded at: https://www.mdpi.com/article/10.3390/agronomy13020345/s1.

Author Contributions

Conceptualization, Q.S., A.P. and M.N.; methodology, Q.S. and M.N.; validation, Q.S., R.A. and M.N.; formal analysis, Q.S., A.P. and M.N.; investigation, Q.S. and R.A.; resources Q.S. and R.A.; data curation, Q.S., R.A. and C.G.; writing—original draft preparation, Q.S., A.P. and M.N.; writing—review and edi ting, M.N.; visualization, M.N.; supervision, M.N. and S.O.; project administration, Q.S. and R.A.; funding acquisition, Q.S., R.A. and M.N. All authors have read and agreed to the published version of the manuscript.

Funding

This research received no external funding.

Data Availability Statement

Data will be made available on request.

Acknowledgments

We thank the Ministry of Agriculture, Irrigation, and Livestock (MAIL) of Afghanistan and the Agricultural Research Institute of Afghanistan (ARIA) for the financial support of this project. We also thank the researchers of Poza-e-Eshan, Dehdadi, Urdokhan, and Bolan research stations for their significant contribution to collecting data. The authors thank Anne Whittaker (Department of Agricultural and Food Sciences, University of Bologna) for English correction.

Conflicts of Interest

The authors declare no conflict of interest.

References

  1. Ministry of Agriculture Irrigation and Livestock (MAIL), Food and Agriculture Organization (FAO). Wheat Sector Development Programme of Afghanistan; FAO: Rome, Italy, 2013; pp. 1–2. [Google Scholar]
  2. Halimi, G.H. Trade and agriculture policy options to improve the wheat subsector in Afghanistan. Ph.D. Thesis, Purdue University, West Lafayette, NI, USA, 2016. [Google Scholar]
  3. Chabot, P.; Dorosh, P.A. Wheat markets, food aid and food security in Afghanistan. Food Policy 2007, 32, 334–353. [Google Scholar] [CrossRef]
  4. FEWS NET. Food security outlook: Conflict and poor agricultural production expected to drive deteriorating food security in Afghanistan. Knoenam data hub. 2021. Available online: https://fews.net/central-asia/afghanistan/food-security-outlook/. (accessed on 12 September 2021).
  5. Ministry of Agriculture Irrigation and Livestock (MAIL), Food and Agriculture Organization (FAO). Agriculture and Food Production in Post-War Afghanistan; FAO: Rome, Italy, 2002. [Google Scholar]
  6. World Bank. Agricultural Sector Review Revitalizing Agriculture for Economic Growth, Job Creation and Food Security; World Bank: Washington, DC, USA, 2014; pp. 21–27. Available online: https://openknowledge.worldbank.org/handle/10986/21733 (accessed on 21 December 2022).
  7. Sharma, R. Sustainable Wheat and Maize Production in Afghanistan; Project report; International Maize and Wheat Improvement Center: Kabul, Afghanistan, 2019; pp. 21–22. Available online: https://www.aciar.gov.au/project/cim-2011-026 (accessed on 21 December 2022).
  8. Dreisigacker, S.; Sharma, R.K.; Huttner, E.; Karimov, A.; Obaidi, M.Q.; Singh, P.K.; Sansaloni, C.; Shrestha, R.; Sonder, K.; Braun, H.J. Tracking the adoption of bread wheat varieties in Afghanistan using DNA fingerprinting. Acta Sci. Agron. 2019, 20, 660. [Google Scholar] [CrossRef]
  9. Mussarat, M.; Shair, M.; Muhammad, D.; Mian, I.A.; Khan, S.; Adnan, M.; Fahad, S.; Dessoky, E.S.; el Sabagh, A.; Zia, A.; et al. Accentuating the role of nitrogen to phosphorus ratio on the growth and yield of wheat crop. Sustainability 2021, 13, 2253. [Google Scholar] [CrossRef]
  10. Maathuis, F.J. Physiological functions of mineral macronutrients. Curr. Opin. Plant Biol. 2009, 12, 250–258. [Google Scholar] [CrossRef] [PubMed]
  11. Cotrufo, M.F.; Wallenstein, M.D.; Boot, C.M.; Denef, K.; Paul, E. The microbial efficiency-matrix stabilization (MEMS) framework integrates plant litter decomposition with soil organic matter stabilization: Do labile plant inputs form stable soil organic matter? Glob. Change Biol. 2013, 19, 988–995. [Google Scholar] [CrossRef] [Green Version]
  12. Kallenbach, C.M.; Frey, S.D.; Grandy, A.S. Direct evidence for microbial-derived soil organic matter formation and its ecophysiological controls. Nat. Commun. 2013, 7, 13630. [Google Scholar] [CrossRef] [PubMed] [Green Version]
  13. Plaxton, W.C.; Tran, H.T. Metabolic adaptations of phosphate-starved plants. Plant Physiol. 2011, 156, 1006–1015. [Google Scholar] [CrossRef] [Green Version]
  14. Lindsay, W.L.; Vlek, P.L.; Chien, S.H. Phosphate minerals. Miner. Soil Environ. 1989, 1, 1089–1130. [Google Scholar]
  15. Sato, S.; Solomon, D.; Hyland, C.; Ketterings, Q.M.; Lehmann, J. Phosphorus speciation in manure and manure-amended soils using XANES spectroscopy. Environ. Sci. Technol. 2005, 39, 7485–7491. [Google Scholar] [CrossRef] [PubMed]
  16. Penn, C.; Camberato, J. A critical review on soil chemical processes that control how soil pH Affects phosphorus availability to plants. Agriculture 2019, 9, 120. [Google Scholar] [CrossRef] [Green Version]
  17. Devau, N.; Le Cadre, E.; Hinsinger, P.; Gérard, F. A mechanistic model for understanding root-induced chemical changes controlling phosphorus availability. Ann. Bot. 2010, 105, 1183–1197. [Google Scholar] [CrossRef] [PubMed]
  18. Güsewell, S. N:P ratios in terrestrial plants: Variation and functional significance. New Phytol. 2004, 164, 243–266. [Google Scholar] [CrossRef] [PubMed]
  19. Mandic, V.; Krnjaja, V.; Tomic, Z.; Bijelic, Z.; Simic, A.; Muslic, D. Nitrogen fertilizer influence on wheat yield and use efficiency under different environmental conditions. Chil. J. Agric. Res. 2015, 75, 92–97. [Google Scholar] [CrossRef] [Green Version]
  20. Ferrari, M.; Szareski, V.J.; Nardino, M.; de Pelegrin, A.J.; Carvalho, I.R.; de Souza, V.Q. Effects of sources and split application of nitrogen fertilizer on wheat genotypes performance. Aust. J. Crop Sci. 2016, 10, 1669–1674. [Google Scholar] [CrossRef]
  21. Barraclough, P.B.; Howarth, J.R.; Jones, J.; Lopez-Bellido, R.; Parmar, S.; Shepherd, C.E.; Hawkesford, M.J. Nitrogen efficiency of wheat: Genotypic and environmental variation and prospects for improvement. Eur. J. Agron. 2010, 33, 1–11. [Google Scholar] [CrossRef]
  22. Majeed, M.A.; Ahmad, R.; Tahir, M.; Tanveer, A.; Ahmad, M. Effect of phosphorus fertilizer sources and rates on growth and yield of wheat (Triticum aestivum L.). Asian J. Agric. Biol. 2014, 2, 14–19. [Google Scholar]
  23. Islam, S.; Ullah, S.; Anjum, M.; Ali, N.; Ahmad, B.; Ahmad, S. Impact of various levels of phosphorus on wheat (CV. PIRSABAK-2013). Int. J. Environ. Sci. Nat. Res. 2017, 6, 106–111. [Google Scholar]
  24. Dargie, S.; Girma, T.; Chibsa, T.; Kassa, S.; Boke, S.; Abera, A.; Haileselassie, B.; Addisie, S.; Amsalu, S.; Haileselassie, M.; et al. Balanced fertilization increases wheat yield response on different soils and agroecological zones in Ethiopia. Exp. Agric. 2022, 58, E23. [Google Scholar] [CrossRef]
  25. Sileshi, G. Dose-response models to guide site-specific nutrient management and lessons for fertiliser trial design in sub-Saharan Africa. Exp. Agric. 2022, 58, E2. [Google Scholar] [CrossRef]
  26. Agha, J.; Dass, A.; Rajanna, G.A.; Sarkar, S.K.; Rana, K.S. Influence of varying nitrogen levels on performance of wheat (Triticum aestivum L.) under semi-arid hot climate of Kandahar, Afghanistan. Ann. Agric. Res. 2016, 37, 347–352. [Google Scholar]
  27. Gyeltshen, K.; Sharma, S. Integrated Plant Nutrition System Modules for Major Crops and Cropping Systems in South Asia; SAARC Agriculture Centre, SAARC: Dhaka, Bangladesh, 2019; p. 184. [Google Scholar]
  28. Obaid, H.; khalili, A.; Sharifi, S.; Dhar, S. Effect of different levels of phosphorus on growth and yield of wheat (Triticum aestivum, L.) in Kandahar region of Afghanistan. Ann. Agric. Res. 2019, 40, 1–5. [Google Scholar]
  29. Soofizada, Q.; Pescatore, A.; Guerrini, L.; Fabbri, C.; Mancini, M.; Orlandini, S.; Napoli, M. Effects of nitrogen plus sulfur fertilization and seeding density on yield, rheological parameters, and asparagine content in old varieties of common wheat (Triticum aestivum L.). Agronomy 2022, 12, 351. [Google Scholar] [CrossRef]
  30. International Maize and Wheat Improvement Center (CIMMYT). From Agronomic Data to Farmer Recommendations; International Maize and Wheat Improvement Center: El Batan, Mexico, 1988; pp. 9–28. Available online: https://repository.cimmyt.org/xmlui/bitstream/handle/10883/830/13803.pdf (accessed on 21 December 2022).
  31. Food Agricultural Organization (FAO). Agricultural Agro-Ecological Zoning of Afghanistan; FAO: Rome, Italy, 2019. [Google Scholar]
  32. Salazar-Gutierrez, M.R.; Johnson, J.; Chaves-Cordoba, B.; Hoogenboom, G. Relationship of base temperature to develop-ment of winter wheat. Int. J. Plant Prod. 2013, 7, 741–762. [Google Scholar]
  33. Grassi, C.; Cecchi, S.; Baldi, A.; Zanchi, C.A.; Orlandini, S.; Pardini, A.; Napoli, M. Crop suitability assessment in remedia-tion of Zn contaminated soil. Chemosphere 2020, 246, 125706. [Google Scholar] [CrossRef]
  34. Li, Q.Y.; Yin, J.; Liu, W.D.; Zhou, S.M.; Li, L.; Niu, J.S.; Niu, H. bin, Ma, Y. Determination of optimum Growing Degree-Days (GDD) range before winter for wheat cultivars with different growth characteristics in North China Plain. J. Integr. Agric. 2012, 11, 405–415. [Google Scholar] [CrossRef]
  35. Fabbri, C.; Mancini, M.; Dalla Marta, A.; Orlandini, S.; Napoli, M. Integrating satellite data with a Nitrogen Nutrition Curve for precision topdress fertilization of durum wheat. Eur. J. Agron. 2020, 120, 126148. [Google Scholar] [CrossRef]
  36. Saiyed, I.M.; Bullock, P.R.; Sapirstein, H.D.; Finlay, G.J.; Jarvis, C.K. Thermal time models for estimating wheat phenologi-cal development and weather-based relationships to wheat quality. Can. J. Plant Sci. 2009, 89, 429–439. [Google Scholar] [CrossRef]
  37. Hashimi, R.; Matsuura, E.; Komatsuzaki, M. Effects of cultivating rice and wheat with and without organic fertilizer application on greenhouse gas emissions and soil quality in Khost, Afghanistan. Sustainability 2020, 12, 6508. [Google Scholar] [CrossRef]
  38. Ayubi, A.G. Principle of Irrigation and Drainage; Aazem Publication: Kabul, Afghanistan, 2016; Volume 31, p. 174. [Google Scholar]
  39. Sameen, A.Q.; Zaghard, M.A. Soil Chemistry and Plant Nutrients; World Bank: Kabul, Afghanistan, 2008; pp. 58–295. [Google Scholar]
  40. Zaveri, E.; Lobell, D. The role of irrigation in changing wheat yields and heat sensitivity in India. Nat. Commun. 2019, 10, 4144. [Google Scholar] [CrossRef] [Green Version]
  41. Rout, B. How the Water Flows: A Typology of Irrigation Systems in Afghanistan; Issue Paper Series: Water Management, Livestock and the Opium Economy; Afghanistan Research and Evaluation Unit: Kabul, Afghanistan, 2008; p. 57. [Google Scholar]
  42. Kawasaki, S.; Watanabe, F.; Suzuki, S.; Nishimaki, R.; Takahashi, S. Current situation and issues on agriculture of Afghanistan. J. Arid. Land Stud. 2012, 348, 345–348. [Google Scholar]
  43. Kostíc, M.M.; Tagarakis, A.C.; Ljubičíc, N.; Blagojevíc, D.; Radulovíc, M.; Ivoševíc, B.; Rakíc, D. The effect of N fertilizer application timing on wheat yield on chernozem soil. Agronomy 2021, 11, 1413. [Google Scholar] [CrossRef]
  44. Haile, D.; Nigussie, D.; Ayan, A. Nitrogen use efficiency of bread wheat: Effects of nitrogen rate and time of application. J. Soil Sci. Plant Nutr. 2012, 12, 389–409. [Google Scholar]
  45. Guarda, G.; Padovan, S.; Delogu, G. Grain yield, nitrogen-use efficiency and baking quality of old and modern Italian bread-wheat cultivars grown at different nitrogen levels. Eur. J. Agron. 2004, 21, 181–192. [Google Scholar] [CrossRef]
  46. Mansoor, H.A.; Ndondi, R.V.; Tanner, D.O.; Ndakidemi, P.; Ngatokewa, R.T. On-farm evaluation of the response of four bread wheat varieties to nitrogen fertilizer in Karatu district in northern Tanzania. In The Eleventh Regional Wheat Workshop for Eastern, Central and Southern Africa; CIMMYT: Addis Ababa, Ethiopia, 2000; pp. 352–359. ISBN 92-9146-087-7. [Google Scholar]
  47. Tao, Y.; Qin, Z.; Qi, W.; Xiao, W.; Jian, C.; Mei, H.; Dong, J. effects of nitrogen fertilizer on quality characteristics of wheat with the absence of different individual high-molecular-weight glutenin subunits (HMW-GSs). Int. J. Mol. Sci. 2022, 4, 23. [Google Scholar]
  48. Cai, A. Xu, M.; Wang, B.; Zhang, W.; Liang, G.; Hou, E.; Luo, Y. Manure acts as a better fertilizer for increasing crop yields than synthetic fertilizer does by improving soil fertility. Soil Tillage Res. 2019, 189, 168–175. [Google Scholar] [CrossRef]
  49. Food and Agriculture Organization (FAO). Soil Fertility and Fertilizer Use; Report of the Government of Afghanistan; Government of Afghanistan: Kabul, Afghanistan, 1971. [Google Scholar]
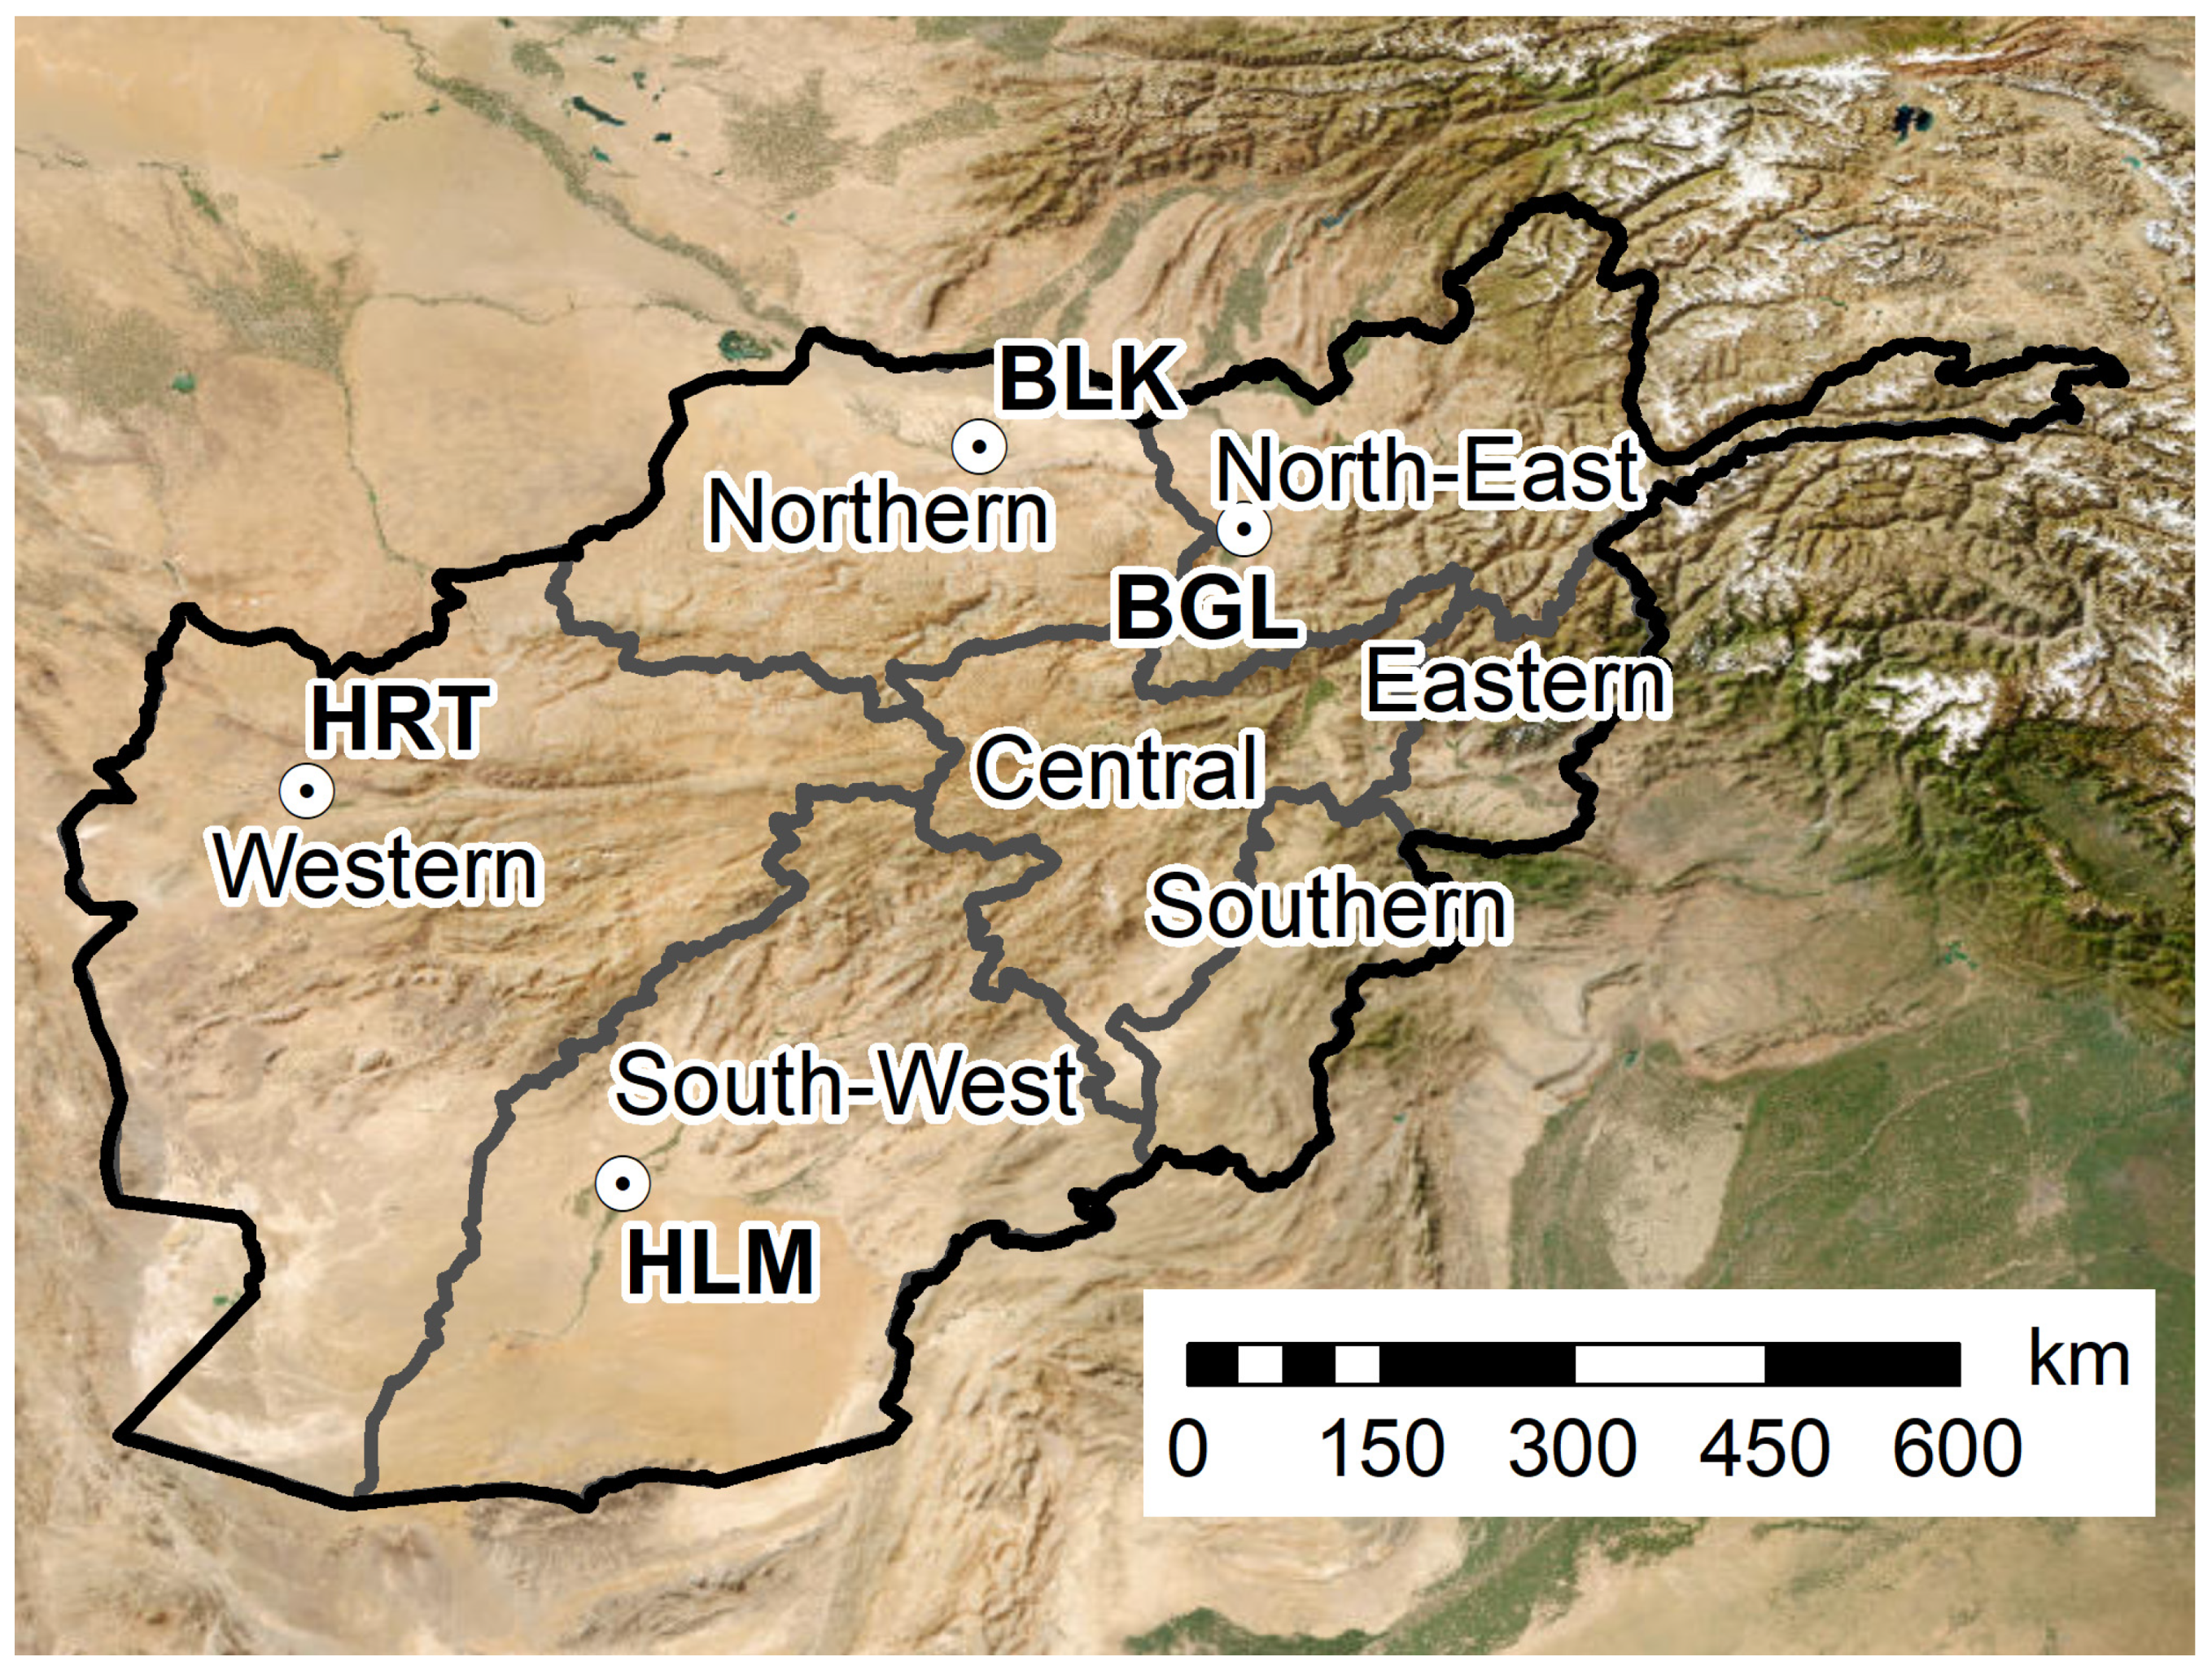
Figure 1. Map of the agro-climatic zones of Afghanistan with the four study sites: Baghlan (BGL), Balkh (BLK), Helmand (HLM), and Herat (HRT).
Agronomy 13 00345 g001
Figure 2. Walter-Lieth diagram of the study sites. (A) BGL (Baghlan), (B) BLK (Balkh), (C) HLM (Helmand) and (D) HRT (Herat). The long-term (LT) (2001–2020), average monthly temperature (°C, black continuous line) and monthly average precipitation (mm, black histograms). The 1st growing season (1st GS), (2016/2017), average monthly temperature (°C, blue dashed line) and monthly average precipitation (mm, blue histograms). The 2nd growing season (2nd GS), (2017/2018), average monthly temperature (°C, red dashed line) and monthly average precipitation (mm, red histograms).
Agronomy 13 00345 g002
Figure 3. From top to bottom, the effect of phosphorous fertilization level (PL) at the four locations (BGL: Baghlan; BLK: Balkh; HLM: Helmand; HRT: Herat) on (A) the straw yield (SY), (B) grain yield (GY) and (C) protein yield (PY). Lowercase letters represent significant differences between PL levels within the same locations, and uppercase letters represent significant differences between locations within the same PL level according to the Tukey HSD post hoc test results.
Agronomy 13 00345 g003
Figure 4. The effect of nitrogen fertilization level (NL) at the four locations (BGL: Baghlan; BLK: Balkh; HLM: Helmand; HRT: Herat) on the protein concentration in grain (PC). Lowercase letters represent significant differences between PL levels within the same locations, and uppercase letters represent significant differences between locations within the same PL level according to the Tukey HSD post hoc test results.
Agronomy 13 00345 g004
Figure 5. The relative contribution (%) of predictor parameters for the boosted regression tree model (BRTM) of straw yield (SY), grain yield (GY), protein concentration (PC), and protein yield (PY) shown in (AD), respectively. Measured and predicted annual SY, GY, PC, and PY by the BRTM model using predictors shown in (ad), respectively.
Agronomy 13 00345 g005
Figure 6. Partial budget analysis of bread wheat produced in relation to the application of nitrogen (NL) and phosphorus (PL). The histogram of (A,B) represent the net revenue (NR, $US) of NL and PL application, respectively. The histogram of (C,D) represent the marginal rate of return (MRR, %) of NL and PL application, respectively.
Agronomy 13 00345 g006
Table 1. Site and soil parameters of the experimental fields in four locations in Afghanistan.
CharacteristicLocations
BaghlanBalkhHelmandHerat
Location acronymBGLBLKHLMHRT
Research station namePoza EshanDehdadiBolanUrdokhan
Latitude (N)36°09′ N36°65′ N31°65′ N34°31′ N
Longitude (m)68°64′ E66°95′ E66°96′ E62°27′ E
Altitude (m)510378787927
ACZACZ-NEACZ-NACZ-SWACZ-W
pH7.508.127.917.60
Organic matter (%)1.501.010.630.82
Available P (mg P kg−1)8.505.416.127.54
Available K (mg K kg−1)120117107115
Total N (g N kg−1)1.000.610.700.85
Sand (%)36.818.924.763.8
Silt (%)37.652.353.226.0
Clay (%)25.628.822.110.2
Soil texture LoamSilty loamSilty loamSandy loam
Table 2. The results of the ANOVA on tiller number (TN), plant height (PH), grain yield (GY), straw yield (SY), 1000 kernel weight (TKW), protein concentration (PC), and protein yield (PY), by factors including growing season (GS), location (L), nitrogen (NL), and phosphorus (PL) fertilization treatment. The table columns report the significance as follows: * = 0.05, ** = 0.01, *** = 0.001, ns = not significant, whereas the percent columns show the F value and significant degree.
Variation SourceDFTN
(N)
PH
(cm)
SY
(t ha−1)
GY
(t ha−1)
TKW
(g)
PC
(%)
PY
(t ha−1)
FSigFSigFSigFSigFSigFSigFSig
GS13.94*41.25***0.25ns138.85***45.01***364.18***103.60***
L3338.07***331.19***268.57***803.29***332.71***546.52***819.50***
NL30.98ns6.79***0.81ns55.76***11.61***3901.40***124.67***
PL36.78***65.37***26.70***113.47***11.25***135.53***118.40***
GSxL3130.04***47.15***12.49***12.53***55.14***42.07***52.86***
GSxNL30.99ns1.25ns0.16ns0.51ns7.56***0.25ns2.53ns
LxNL90.62ns3.33***1.78ns0.95ns8.19***5.15***2.71**
GSxPL31.07ns1.8ns0.40ns1.77ns2.46ns1.45ns1.72ns
LxPL91.21ns9.94***5.94***13.86***2.77**3.47***13.66***
NLxPL90.42ns1.06ns0.54ns0.56ns3.08**0.78ns0.28ns
GSxLxNL90.87ns1.34ns0.94ns0.91ns1.55ns1.97*1.27ns
GSxLxPL90.86ns3.35***3.09**3.74***2.03*1.69ns3.81***
GSxNLxPL91.00ns0.46ns1.06ns0.42ns2.38*0.23ns0.47ns
LxNLxPL271.08ns1.13ns0.96ns0.50ns2.26**0.91ns0.55ns
GSxLxNLxPL270.62ns0.61ns0.53ns0.51ns1.88**0.92ns0.51ns
Residues256
Table 3. Mean of tiller number (TN), plant height (PH), grain yield (GY), straw yield (SY), harvest index (HI), 1000 kernel weight (TKW), protein concentration (PC), and protein yield (PY) parameter results, considering the factors, growing season (GS), location, nitrogen (NL), and phosphorus (PL) fertilization treatment. The lowercase letter shows the Tukey HSD post-hoc test results, and the value inside parentheses represents standard error.
Variation SourceObs. (N)TN
(N)
PH
(cm)
SY
(t ha−1)
GY
(t ha−1)
TKW
(g)
PC
(%)
PY
(t ha−1)
NL
(kg N ha−1)
35.28965.14 (0.21)91.98 (0.87) b7.06 (0.24)3.89 (0.14) d36.94 (0.46) bc11.34 (0.02) d0.44 (0.02) c
65965.30 (0.22)93.70 (0.76) ab7.18 (0.24)4.28 (0.15) c36.77 (0.45) c12.00 (0.03) c0.52 (0.02) b
95965.36 (0.22)93.54 (0.78) ab7.21 (0.23)4.56 (0.15) b37.83 (0.61) ab12.43 (0.03) b0.57 (0.02) ab
120965.19 (0.21)94.16 (0.80) a7.33 (0.22)4.76 (0.16) a38.60 (0.64) a12.74 (0.03) a0.61 (0.02) a
PL
(kg P2O5 ha−1)
0964.91 (0.21) b89.46 (0.86) c6.26 (0.21) b3.62 (0.13) d36.35 (0.50) b11.96 (0.06) b0.44 (0.02) b
50965.16 (0.21) ab92.81 (0.81) b7.30 (0.23) a4.41 (0.15) c37.84 (0.53) a12.16 (0.06) a0.54 (0.02) a
70965.46 (0.23) a94.94 (0.67) a7.56 (0.23) a4.60 (0.16) b37.64 (0.56) a12.20 (0.06) a0.57 (0.02) a
90965.44 (0.22) a96.17 (0.71) a7.64 (0.24) a4.86 (0.15) a38.31 (0.59) a12.20 (0.06) a0.60 (0.02) a
LBGL963.63 (0.09) c95.38 (0.55) b8.09 (0.13) b5.95 (0.09) a32.72 (0.24) c12.36 (0.06) a0.74 (0.01) a
BLK964.94 (0.18) b86.92 (0.48) d4.18 (0.12) c2.95 (0.09) d41.68 (0.45) a11.85 (0.06) b0.35 (0.01) d
HLM964.54 (0.13) b89.38 (0.76) c7.94 (0.16) b3.41 (0.07) c41.16 (0.49) a12.05 (0.05) b0.41 (0.01) c
HRT967.87 (0.15) a101.71 (0.36) a8.56 (0.18) a5.18 (0.12) b34.59 (0.26) b12.26 (0.06) a0.64 (0.02) b
GS1st GS1925.34 (0.18) a92.18 (0.53) b7.16 (0.15)4.67 (0.11) a38.37 (0.47) a12.04 (0.04) b0.57 (0.01) a
2nd GS1925.15 (0.12) b94.51 (0.60) a7.22 (0.18)4.07 (0.11) b36.70 (0.28) b12.22 (0.04) a0.50 (0.01) b
Table 4. Correlation between soil parameters (including: pH, organic matter (OM), available phosphorous (Av_P), available potassium (Av_K), total nitrogen (Tot_N), climatic parameters (including growing degree days (GDD_TGf) and precipitation amount (P_TGf ) cumulated between tillering and grain filling), and agronomic traits (including grain yield (GY), straw yield (SY), protein concentration (PC), and protein yield (PY)). The values reporting the correlation significance are as follows: *** = 0.001, ns = not significant.
pHOMAv_PAv_KTot_NGDD_TGfP_TGfNLPLGYSYPCPY
(%)(mg P2O5 kg−1)(kg K2O ha−1)(kg N ha−1)(°C)(mm)(kg ha−1)(kg ha−1)(t ha−1)(t ha−1)(%)(t ha−1)
pH1 ***0.48 ***−0.99 ***−0.37 ***−0.97 ***0.35 ***−0.38 ***0 ns0 ns−0.79 ***−0.64 ***−0.33 ***−0.78 ***
OM (%) 1 ***0.61 ***0.88 ***0.65 ***−0.33 ***0.25 ***0 ns0 ns0.5 ***−0.04 ns0.16 **0.49 ***
Av_P (mg kg−1) 1 ***0.49 ***1 ***−0.35 ***0.37 ***0 ns0 ns0.8 ***0.57 ***0.33 ***0.79 ***
Av_K (kg ha−1) 1 ***0.49 ***−0.7 ***0.58 ***0 ns0 ns0.43 ***−0.17 **0.11 ns0.42 ***
Tot_N (kg ha−1) 1 ***−0.3 ***0.32 ***0 ns0 ns0.8 ***0.55 ***0.33 ***0.78 ***
GDD_TGf (°C) 1 ***−0.95 ***0 ns0 ns−0.41 ***0.04 ns−0.06 ns−0.39 ***
P_TGf (mm) 1 ***0 ns0 ns0.48 ***0.02 ns0.06 ns0.46 ***
NL (kg ha−1) 1 ***0 ns0.21 ***0.04 ns0.88 ***0.31 ***
PL (kg ha−1) 1 ***0.3 ***0.24 ***0.16 **0.3 ***
GY (t ha−1) 1 ***0.59 ***0.51 ***0.99 ***
SY (t ha−1) 1 ***0.3 ***0.58 ***
PC (%) 1 ***0.6 ***
PY (t ha−1) 1 ***
Disclaimer/Publisher’s Note: The statements, opinions and data contained in all publications are solely those of the individual author(s) and contributor(s) and not of MDPI and/or the editor(s). MDPI and/or the editor(s) disclaim responsibility for any injury to people or property resulting from any ideas, methods, instructions or products referred to in the content.