Article

Transcriptomic and Metabolic Analyses Elucidate the Metabolomic Variation in Leaf Development of a Calcium-Rich Vegetable (Primulina eburnea)

1
Jiangxi Provincial Key Laboratory of Ex Situ Plant Conservation and Utilization, Lushan Botanical Garden, Chinese Academy of Sciences, Jiujiang 332900, China
2
College of Life Science, Nanchang University, Nanchang 330031, China
*
Author to whom correspondence should be addressed.
Agronomy 2023, 13(8), 2157; https://doi.org/10.3390/agronomy13082157
Submission received: 24 June 2023 / Revised: 8 August 2023 / Accepted: 16 August 2023 / Published: 17 August 2023
(This article belongs to the Special Issue Horticultural Crop Secondary Metabolism)

Abstract

:
Primulina eburnea, a plant with a longstanding history of traditional medicinal use, has emerged as a novel calcium-rich vegetable characterized by a remarkable abundance of soluble and bioavailable calcium within its leaves. However, most of the metabolites produced by P. eburnea have not been identified, and few studies have addressed the accumulation of nutritional and medicinal ingredients during leaf development. In the present study, we investigated the “Gaogai-1” cultivar by integrating transcriptomic and mestabolomic methods. A total of 1041 metabolites were identified in calcium-rich vegetable leaves. During leaf development, most of the flavor components, including amino acids and derivatives, organic acids and derivatives, and carbohydrates, decreased their content, which contrasted with the starch content. Most of the antioxidant components, e.g., flavonoids, alkaloids, vitamins, and phenolamines, were more highly accumulated in the bud leaves than in the mature leaves, but terpenes had the opposite trend. These results indicate that leaves of different developmental stages are suitable for different medicinal uses and that P. eburnea could be regarded as a new type of medicinal and edible vegetable. Furthermore, most of the coding genes related to the important components that influence the flavor and nutritional and medicinal values were identified, and their expressions were consistent with the component accumulation profiles. Transcription factors that may regulate the coding genes were identified by combining the co-expression network and cis-element binding ability prediction. The high level of water-soluble calcium was maintained by the high expression of Ca2+/cation antiporter genes in calcium-rich vegetable leaves. Our results uncovered metabolomic and molecular evidence of the mechanisms of nutritional and medicinal component accumulation underlying the leaf development of a calcium-rich vegetable. This study provides a wealth of data for the future utilization and improvement of calcium-rich vegetable cultivars.

1. Introduction

Calcium is an important mineral compound and one of the most abundant minerals in the human body. Humans cannot synthesize calcium inside their bodies, which makes calcium an essential dietary element. The National Institute of Health (USA) recommends an optimal calcium intake of more than 1000 mg per day for an adult [1]. Countries with high levels of mean calcium intake are all in northern Europe [2]. Although the recommended daily requirement for nutrient calcium intake varies in different countries [3], calcium intake in most countries is suboptimal and below their reference intakes [2,4]. There are many countries in which calcium intake is very low (<400 mg/day), including most Asian countries and some African and South American countries [2]. Long-term insufficient dietary calcium can decrease bone mass and thus result in skeletal diseases, such as fractures or osteoporosis [3,5]. In developed countries, the major sources of dietary calcium include milk and milk products, yogurt, and some calcium supplements [6]. Vitamin D accelerates the absorption of calcium. However, the expense of these foods and supplements is not feasible for people in developing countries. Calcium-rich vegetables, such as spinach, amaranth, and turnip, are also considered candidate sources for dietary calcium. However, low content and bioavailability reduce calcium intake efficiency. Thus, it is worthwhile to domesticate and develop cheap but efficient calcium-rich vegetables.
Primulina eburnea (Hance) Yin Z. Wang is a perennial herb in the Gesneriaceae family [7]. Due to the high content of soluble calcium (Ca2+) in its leaves [8], P. eburnea has been developed as a calcium-rich vegetable [9,10]. Many efforts have been devoted to improving the taste of this vegetable, such as developing fertilization strategies to decrease the leaf cellulose content and identifying genes involved in cellulose biosynthesis [10]. In addition, mass selection and recurrent selection in our lab have greatly increased the flavor and nutrition of this vegetable (unpublished data). Primulina eburnea has also been utilized as traditional Chinese medicine to treat pulmonary tuberculosis, cough with bleeding, and other weak diseases [11]. Its antibacterial effect has been demonstrated by Wang et al. [12], who found that P. eburnea leaf extract significantly impeded dysentery Bacillus and Bacillus coli. Phytochemistry and pharmacological studies have revealed the presence of bioactive substances, such as terpenes, flavonoids, and phenylethanoids [13,14]. However, detailed and comprehensive nutritional and medicinal data are not available for this calcium-rich vegetable. Metabolomics has been widely used to identify and quantify all endogenous small-molecule metabolites in many semi-domesticated crops, such as Lonicera japonica [15], Rubus ideaus [16], and Lycium ruthenicum [17]. Combining RNA sequencing (RNA-seq) and metabolomic analysis would yield information for understanding metabolic pathways and associated molecular mechanisms.
To gain a better understanding of the molecular and metabolic mechanisms of flavor and nutritional compounds in P. eburnea, we carried out a comparative analysis of the untargeted metabolome and transcriptome data derived from the bud leaves and mature leaves of the “Gaogai-1” cultivar, which was the first cultivar domesticated by our team. The present analysis revealed key metabolites and genes that contribute to nutrition and flavor development in the calcium-rich vegetable P. eburnea.

2. Materials and Methods

2.1. Plant Materials

The seeds of “Gaogai-1” cultivar were sown to germinate and obtain the necessary seedling materials. Subsequently, these seedlings were nurtured within a controlled research greenhouse at the Research Center of Lushan Botanical Garden, Chinese Academy of Science, Jiangxi Province (115.8382° E; 28.9112° N). They were managed by regular agricultural practices. In June 2022, 20 healthy plants with five pairs of leaves that have similar growth statuses were selected for the study. For the determination of water-soluble calcium content in leaves, we planted some seedlings and applied normal irrigation without any additional calcium fertilization.

2.2. Determination of Physiological Traits

Leaves of the second (L2), third (L3), and fourth (L4) pairs were collected to determine the fresh and dry weight, total acid, protein, and lignin contents. After recording the initial fresh weight, the leaves were then placed into an oven at 110 °C for 30 min and then continuously at 80 °C until a constant dry weight was achieved. We calculated the water content according to the fresh and dry weights. The lignin and protein contents were determined with kits (BC4200 and BC3185) provided by Beijing Solarbio Science Technology Co., Ltd. (Beijing, China), following the manufacturer’s instructions. The total acid content was measured using the acid–base titration method (GB/T12456-2008). The starch concentration was determined by HPLC, following our previously published work [18]. The water-soluble calcium was extracted and quantified according to the method of Qi et al. (2014) [8]. The calcium content was determined using atomic absorption spectrophotometer (PinAAcle 900F, PerkinElmer, Waltham, MA, USA).

2.3. RNA-seq and Expression Analysis

Transcriptome sequencing was performed for bud leaves (the second pair of leaves) and mature leaves (the fourth pair of leaves). Three plants were pooled to form a biological replicate, and four biological replicates were used. Total RNA extraction and complementary DNA (cDNA) library construction were conducted by BioMarker Co., Ltd. (Beijing, China). Afterward, cDNA libraries were sequenced using the Illumina NovaSeq 6000 paired-end sequencing platform, and 150 bp paired-end reads were obtained. The sequencing data were deposited to the Sequence Read Archive (SRA) of the National Centre for Biotechnology Information (NCBI) under accession number PRJNA979042.
Raw reads were quality-filtered with the methods described by Zhang et al. [10]. The clean reads were mapped to the P. eburnea reference genome [19] using HISAT2 v2.1.0 [20]. Mapped reads were assembled and quantitatively analyzed as fragments per kilobase of exon per million fragments mapped (FPKM) values using StringTie v2.1.3 [21]. Based on the FPKM value, differentially expressed gene (DEG) analysis in pairwise comparisons between bud leaves and mature leaves was conducted using the DESeq2 statistical R package. Here, a fold change (FC) with an absolute value of log2FC > 1 and a false discovery rate (FDR) < 0.05 were used as the thresholds for determining significant DEGs in pairwise comparisons. K-means clustering was employed to group the DEGs using Euclidean distances as the metric. This clustering was executed utilizing the Multi Experiment Viewer [22] based on FPKM values. KEGG analysis and GO enrichment for DEGs were performed using KEGG Orthology software and GO-seq R packages, respectively. The relative expression for gene members in different tissues was estimated by log2 scaling.

2.4. Metabolite Analysis

Samples for metabolite analysis were the same as those for transcriptome sequencing. Extraction and quantification of metabolites were performed by Wuhan MetWare Biotechnology Co., Ltd. (Wuhan, China) following the standard procedures described by Zhang et al. [23]. In brief, freeze-dried leaves were crushed using a mixer mill (MM 400; Retsch, Haan, Germany) with zirconia beads for 1.5 min at 30 Hz. Lyophilized powder (50 mg) was dissolved with 1.2 mL 70% methanol solution vortexed every 30 min for 30 s (6× total). The samples were then centrifuged for 10 min at 12,000 rpm and filtrated (SCAA-104, 0.22 μm pore size; ANPEL, Shanghai, China) before UPLC-ESI-MS/MS analysis. Quality control (QC) samples were prepared by combining all sample extracts to assess the repeatability of the measurement process. Then, metabolite profiling was analyzed by the UPLC-ESI-MS/MS system (UPLC, SHIMADZU Nexera X2; MS, Applied Biosystems 4500 Q TRAP, Waltham, MA, USA) with a UPLC column (1.8 μm, 2.1 mm × 100 mm; Agilent SBC18, Santa Clara, CA, USA). Analytical conditions were based on the procedures from Peng et al. [24]. Metabolite quantification was performed using multiple reaction monitoring (MRM) in triple quadrupole mass spectrometry [25]. Metabolites were identified by comparing the fragmentation patterns, retention times, and accurate m/z values with the standards in the self-compiled MWDB database (MetWare, Wuhan, China) and public metabolite databases. The chromatographic peak area was used to determine the relative metabolite content. The metabolites with VIP > 1 and p-value < 0.05 and |log2FC| > 1 were considered differentially accumulated metabolites (DAMs). Kyoto Encyclopedia of Genes and Genomes (KEGG) pathway analysis was conducted with the KEGG Orthology software (http://kobas.cbi.pku.edu.cn/ (accessed on 17 November 2022)).

2.5. Metabolite Biosynthesis Pathway Analysis

To further understand the key genes involved in the metabolite biosynthesis pathway, related genes were identified. The protein sequences for the related gene family in Arabidopsis were obtained from the TAIR database (https://www.arabidopsis.org/ (accessed on 20 November 2022)). These genes were regarded as queries for BLAST searches with a cutoff e-value of 1 × 10⁻⁵ in the P. eburnea protein database. Then, the candidate members of the gene family were submitted to NCBI-CDD database (https://www.ncbi.nlm.nih.gov/Structure/bwrpsb/bwrpsb.cgi (accessed on 24 November 2022)) and the Pfam database (http://pfam.xfam.org/search (accessed on 24 November 2022)) to distinguish the candidate genes. Eventually, the gene family members involved in the metabolite biosynthesis pathway were retrieved for subsequent analysis.

2.6. Validation by Quantitative Real-Time PCR (qRT-PCR)

To verify the reliability of the RNA-seq results with respect to the metabolite biosynthesis pathway, 10 genes were selected for qRT-PCR analysis. First, single-stranded cDNA was synthesized from total RNA. The specific primers for 10 genes were designed using Primer Premier v5.0 (Premier Biosoft, Palo Alto, CA, USA) (Table S1). qRT-PCR was performed with three biological replicates and ran on a Bio-Rad CFX96 real-time PCR detection system (Hercules, CA, USA). According to the output data, the relative mRNA expression of each sample was calculated in relation to the reference gene, PebActin [10].

2.7. Statistical Analysis Network Construction

Significant differences between the groups were determined by one-way analysis of variance (ANOVA) (p < 0.05). Principal component analysis (PCA), heatmap analysis, volcano plot, and enrichment analysis were performed using the FactoMineR, pheatmap, ggplot2, and clusterProfiler packages in R software. The transcriptional regulatory networks were constructed using Pearson’s coefficients (PCC > 0.9) between structural genes and transcription factors (TFs). The PCCs were calculated using the Scipy package in Python. The cis-elements involved in key structural genes were predicted with the PlantCARE database (http://bioinformatics.psb.ugent.be/webtools/plantcare/html/ (accessed on 23 March 2023)) using the 1500-bp upstream region of each gene. The networks were generated using Cytoscape software (v.3.7.2, Seattle, WA, USA) [26].

3. Results

3.1. Physiological Characteristics of Primulina eburnea Leaf during Development

The “Gaogai-1” leaves were collected at five developmental stages, from the first to the fifth pairs (L1–L5). The changes in leaf morphological and physiological traits during different developmental stages are shown in Figure 1A. The size of the L1 leaf was about 1/37 that of the L5 leaf, and the leaf experienced the fastest growth from L2 to L4 and then grew slowly (Figure 1A). The biomass of the L2 leaf was about 1/6 of the L4 leaf (Figure 1B). The water content of the leaves increased with leaf development, even though the differences among stages were not significant (Figure 1C). Similarly, the total acid accumulated increasingly but not significantly during the development (Figure 1D). The total protein increased significantly with leaf development (Figure 1E). L2 and L4 represent the start and the end of the fastest growth, and we selected them as the two representative stages, bud leaves (L2) and mature leaves (L4), for transcriptome and metabolome analyses.

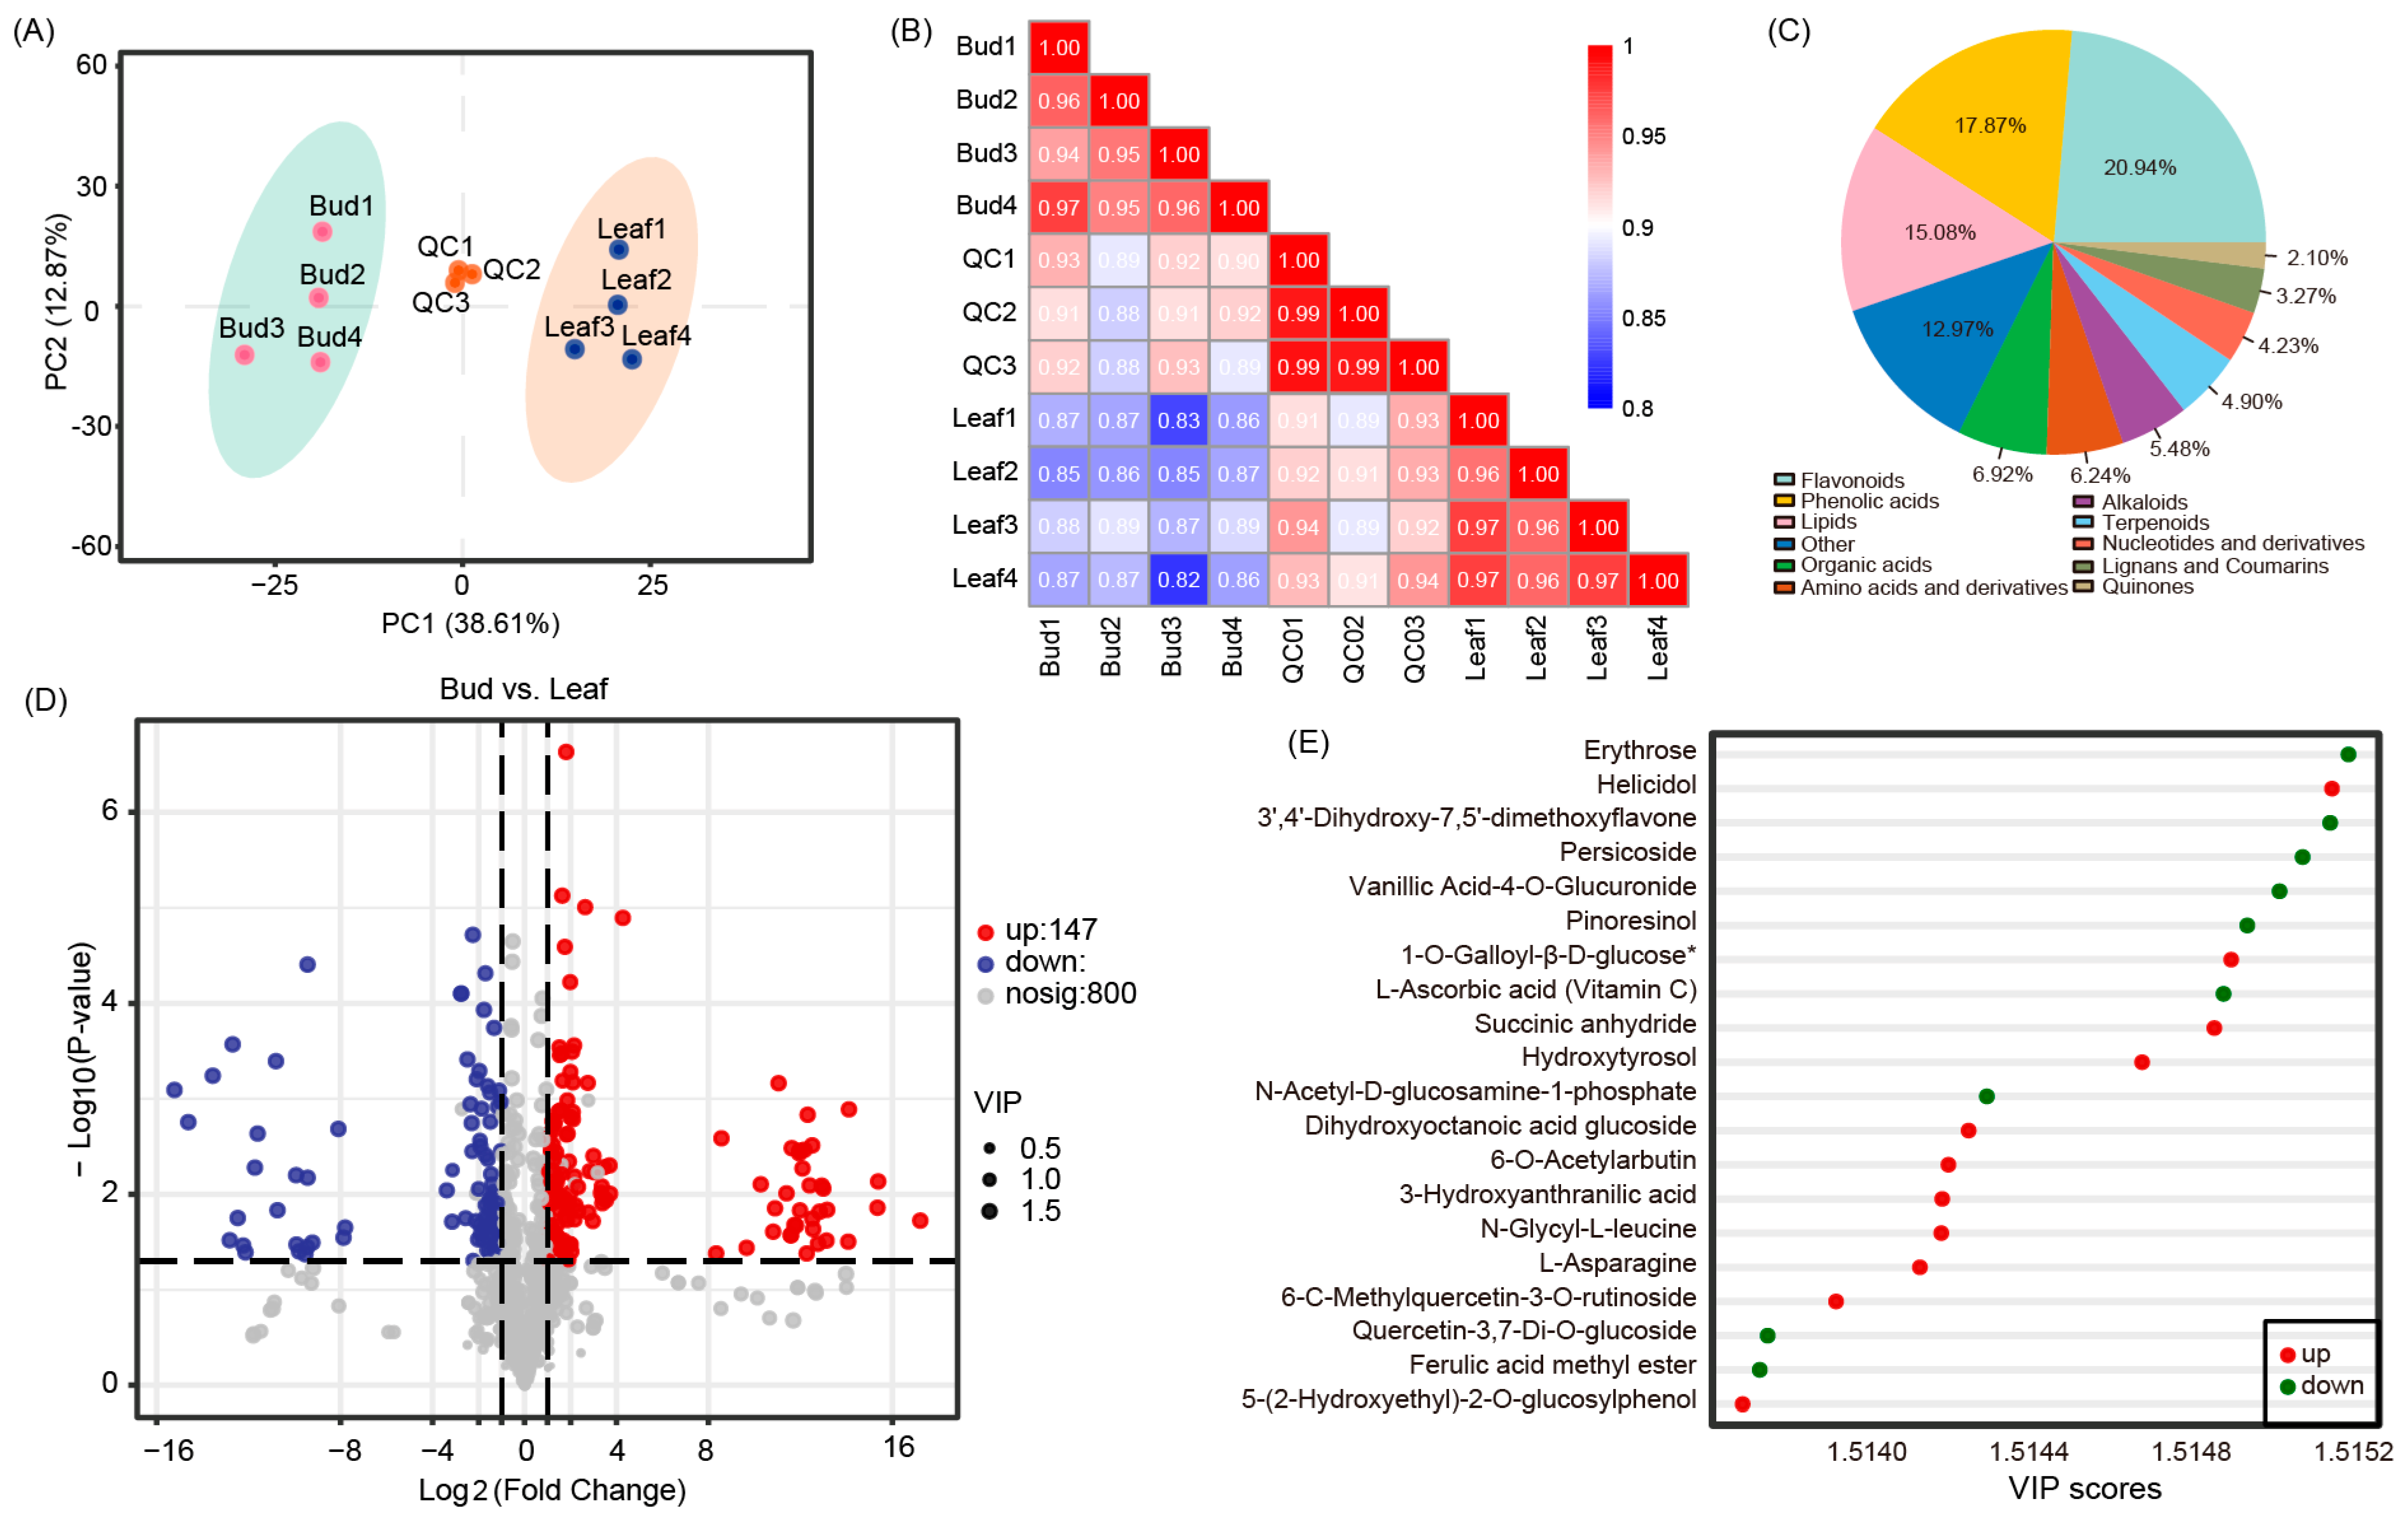
3.2. Metabolome Profiling

To better explore the metabolites in P. eburnea edible tissues, bud leaf and mature leaf samples were subjected to metabolome profiling via untargeted LC-MS. Principal component analysis (PCA) of bud leaf, mature leaf, and QC samples revealed effective separation (Figure 2A). The correlation among samples was analyzed with metabolite concentration data, and the clear distinguishability of different samples (Figure 2B) indicated that the metabolome data were highly reliable. Thus, PCA and correlation analysis showed that bud leaf and mature leaf samples had substantially different metabolite profiles.
A total of 1041 metabolites were identified, which were divided into 11 categories (Figure 2C). The largest number of metabolites were found in the category of flavonoids (approximately 21%) and could be classified into 98 flavones, 92 flavonols, 22 flavanonols, 4 chalcones, and 2 flavanols. In addition, phenolic acid and lipids contributed 17.87% and 15.08% of the metabolites, respectively. Among these metabolites, 1007 and 991 metabolites were detected in the bud leaves and mature leaves, respectively (Figure S1A).

3.3. Differentially Accumulated Metabolites (DAMs) in Bud and Mature Leaves

In total, 241 DAMs were identified; 146 and 94 metabolites were up and downregulated, respectively (Figure 2D and Figure S1B). Comparative analysis showed that more than 75% of the DAMs (183 metabolites) were detected in both bud leaves and mature leaves. The top-enriched Kyoto Encyclopedia of Genes and Genomes (KEGG) terms were biosynthesis of secondary metabolites, biosynthesis of amino acids, ABC transporters, 2-Oxocarboxylic acid metabolism, aminoacyl-tRNA biosynthesis, and phenylpropanoid biosynthesis (Figure 2E). The 241 DAMs were roughly divided into two classes. The first class of metabolites constituted antioxidant components, including flavonoids, alkaloids, terpenes, vitamins, and phenolamines (Table S2). Most of these antioxidant components were more highly accumulated in the bud leaves than in the mature leaves, except for the terpenes. Another class of metabolites constituted flavor components, including amino acids and derivatives, organic acids and derivatives, and carbohydrates (Table S2). Most carbohydrates decreased with leaf development, except glucose and fructose, which accumulated higher in mature leaves (Figure S2). We measured the starch content in the leaves and found that the starch accumulated during leaf development (Figure S2). In contrast to carbohydrates, most of the DAMs of amino acids and derivatives and organic acids and derivatives were significantly greater in the mature leaves than in the bud leaves (Table S2).

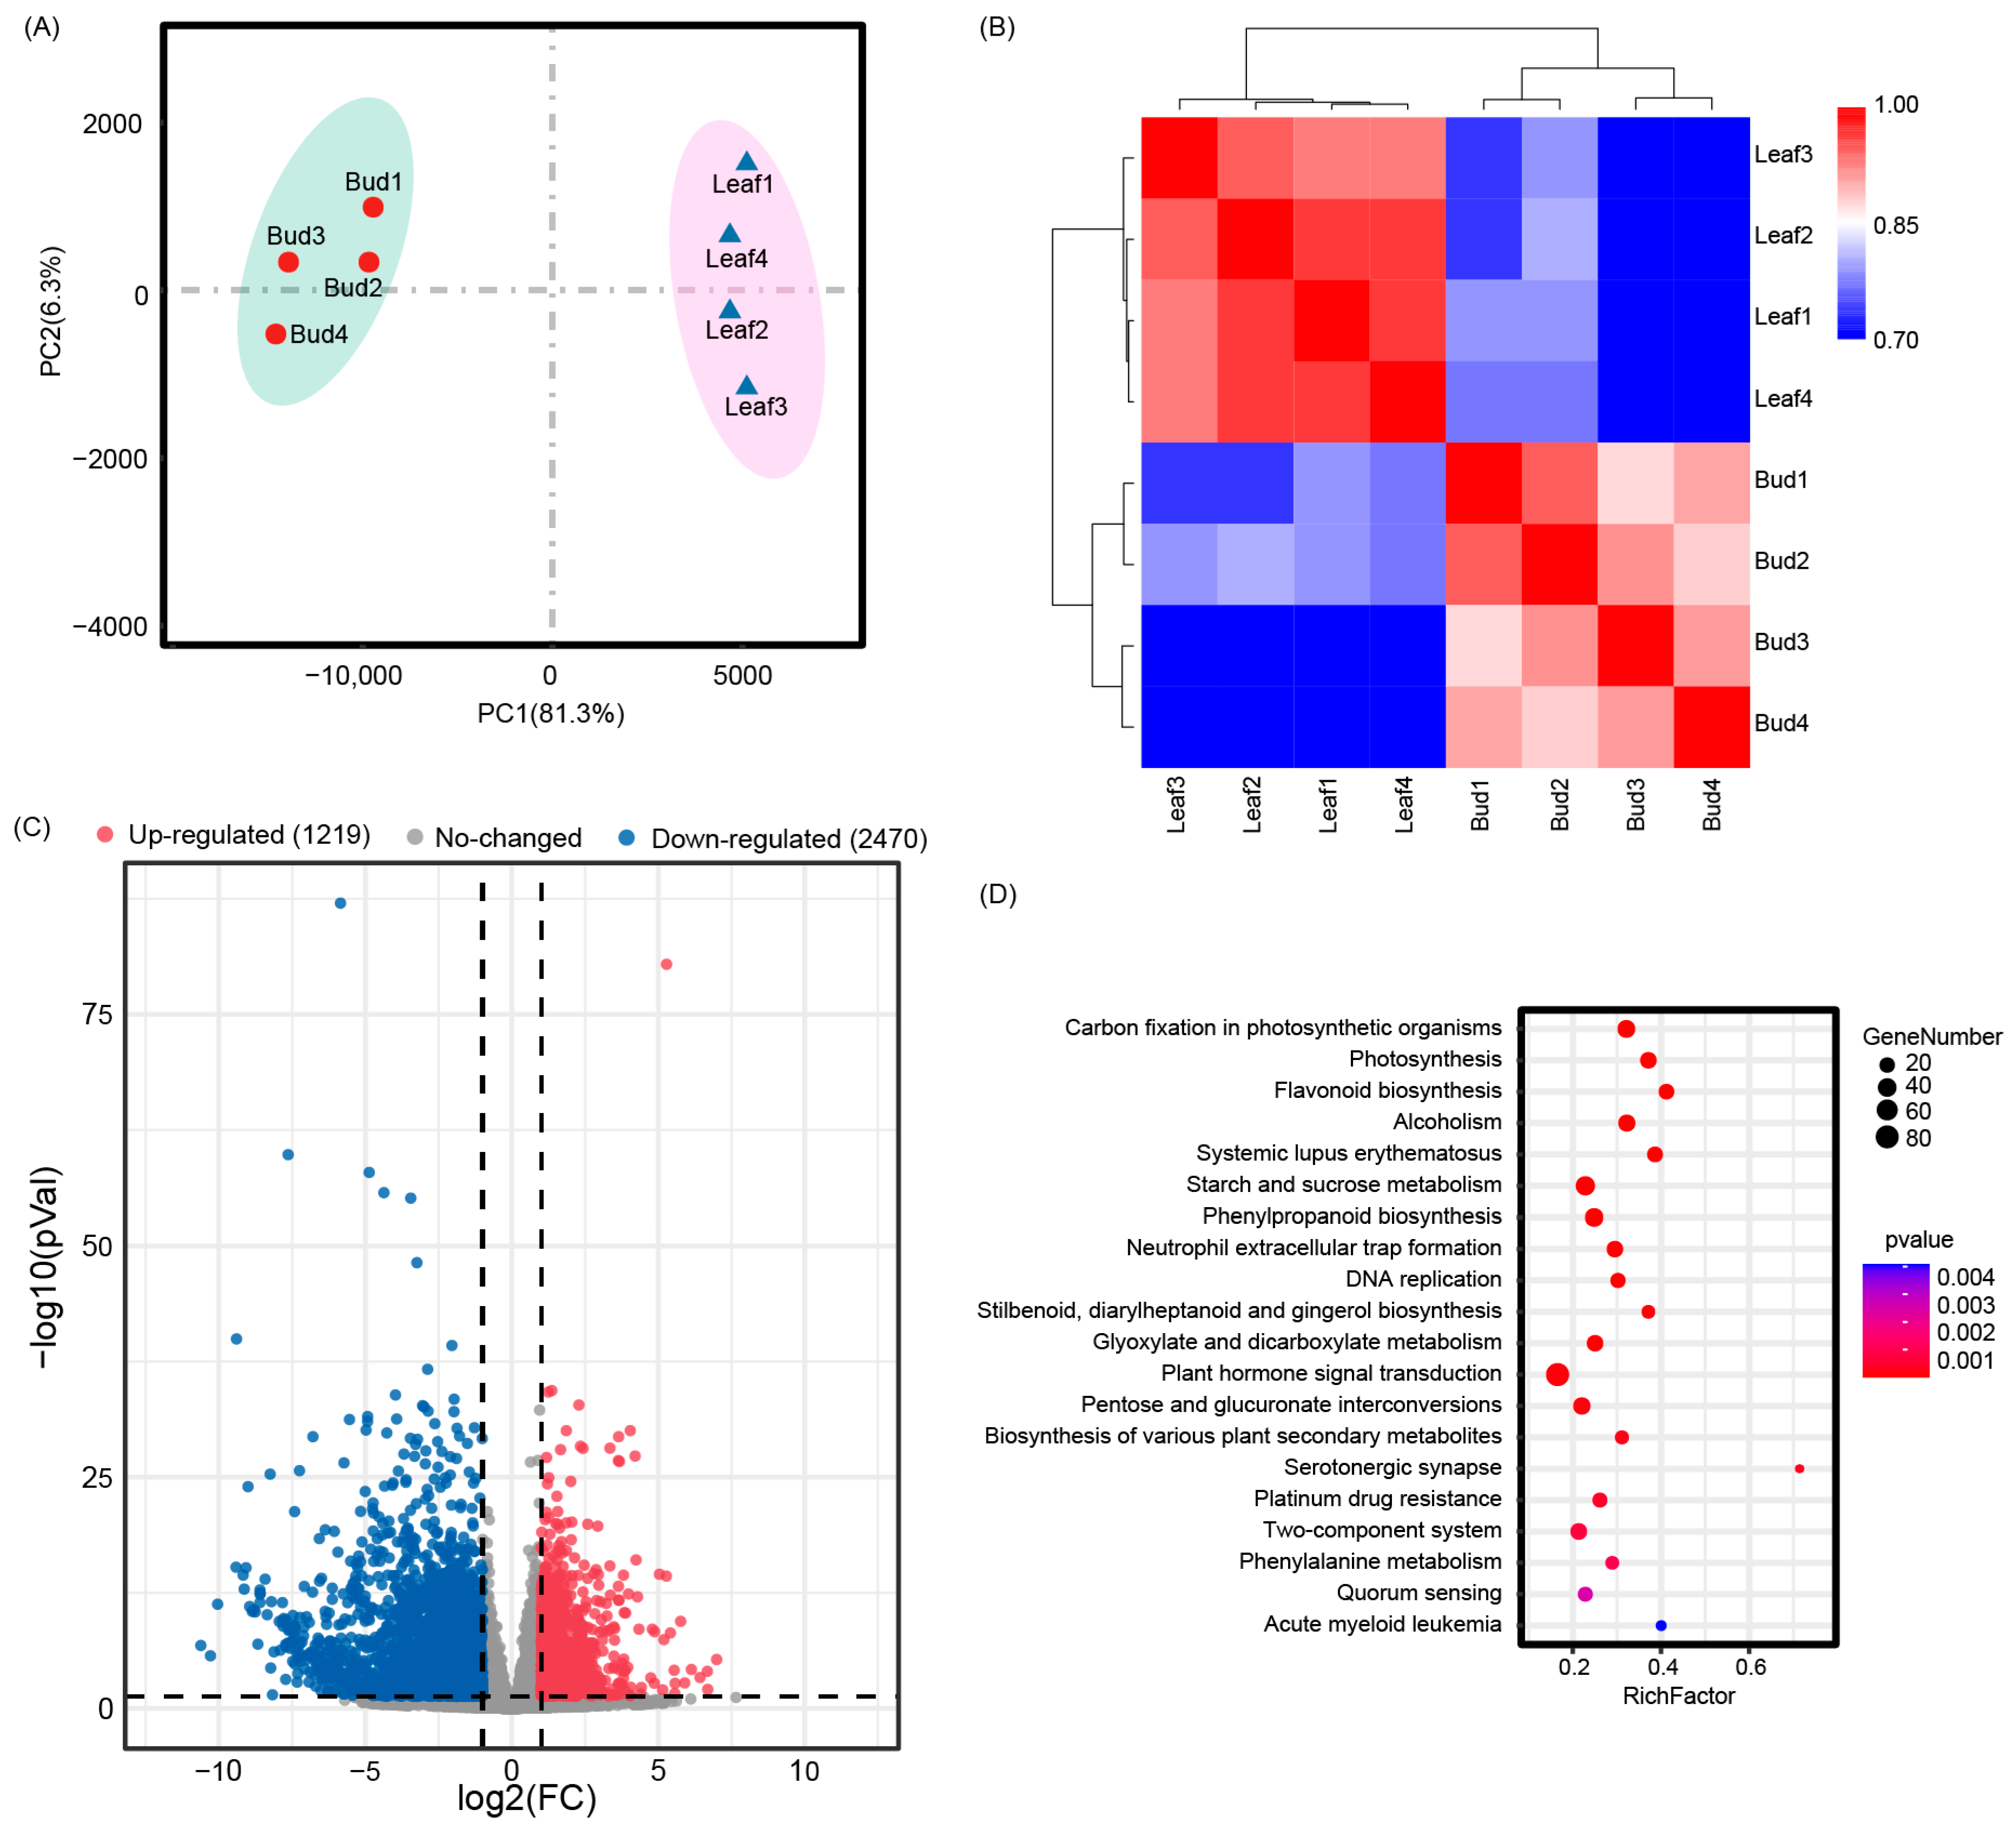
3.4. Transcriptome Profiles of Bud and Mature Leaves

For the eight RNA-seq samples, a total of 557,875,068 (bud leaves, 310,292,944; mature leaves, 247,582,124) reads were generated. Clean reads (bud leaves, 269,166,220; mature leaves, 218,765,974) were obtained by removing the low-quality reads. The Q30 values of all samples were 88.65–91.03% at different development stages (Table S3). The GC content was 44.72–45.63% (Table S3). The clean data were then mapped to the P. eburnea reference genome, with the mapping ratio varying from 81.09% to 87.13% (Table S3). PCA and correlation analysis revealed that biological replicates were grouped together and that different groups were separated clearly (Figure 3A,B). These results indicate the reliability of the transcriptome data.

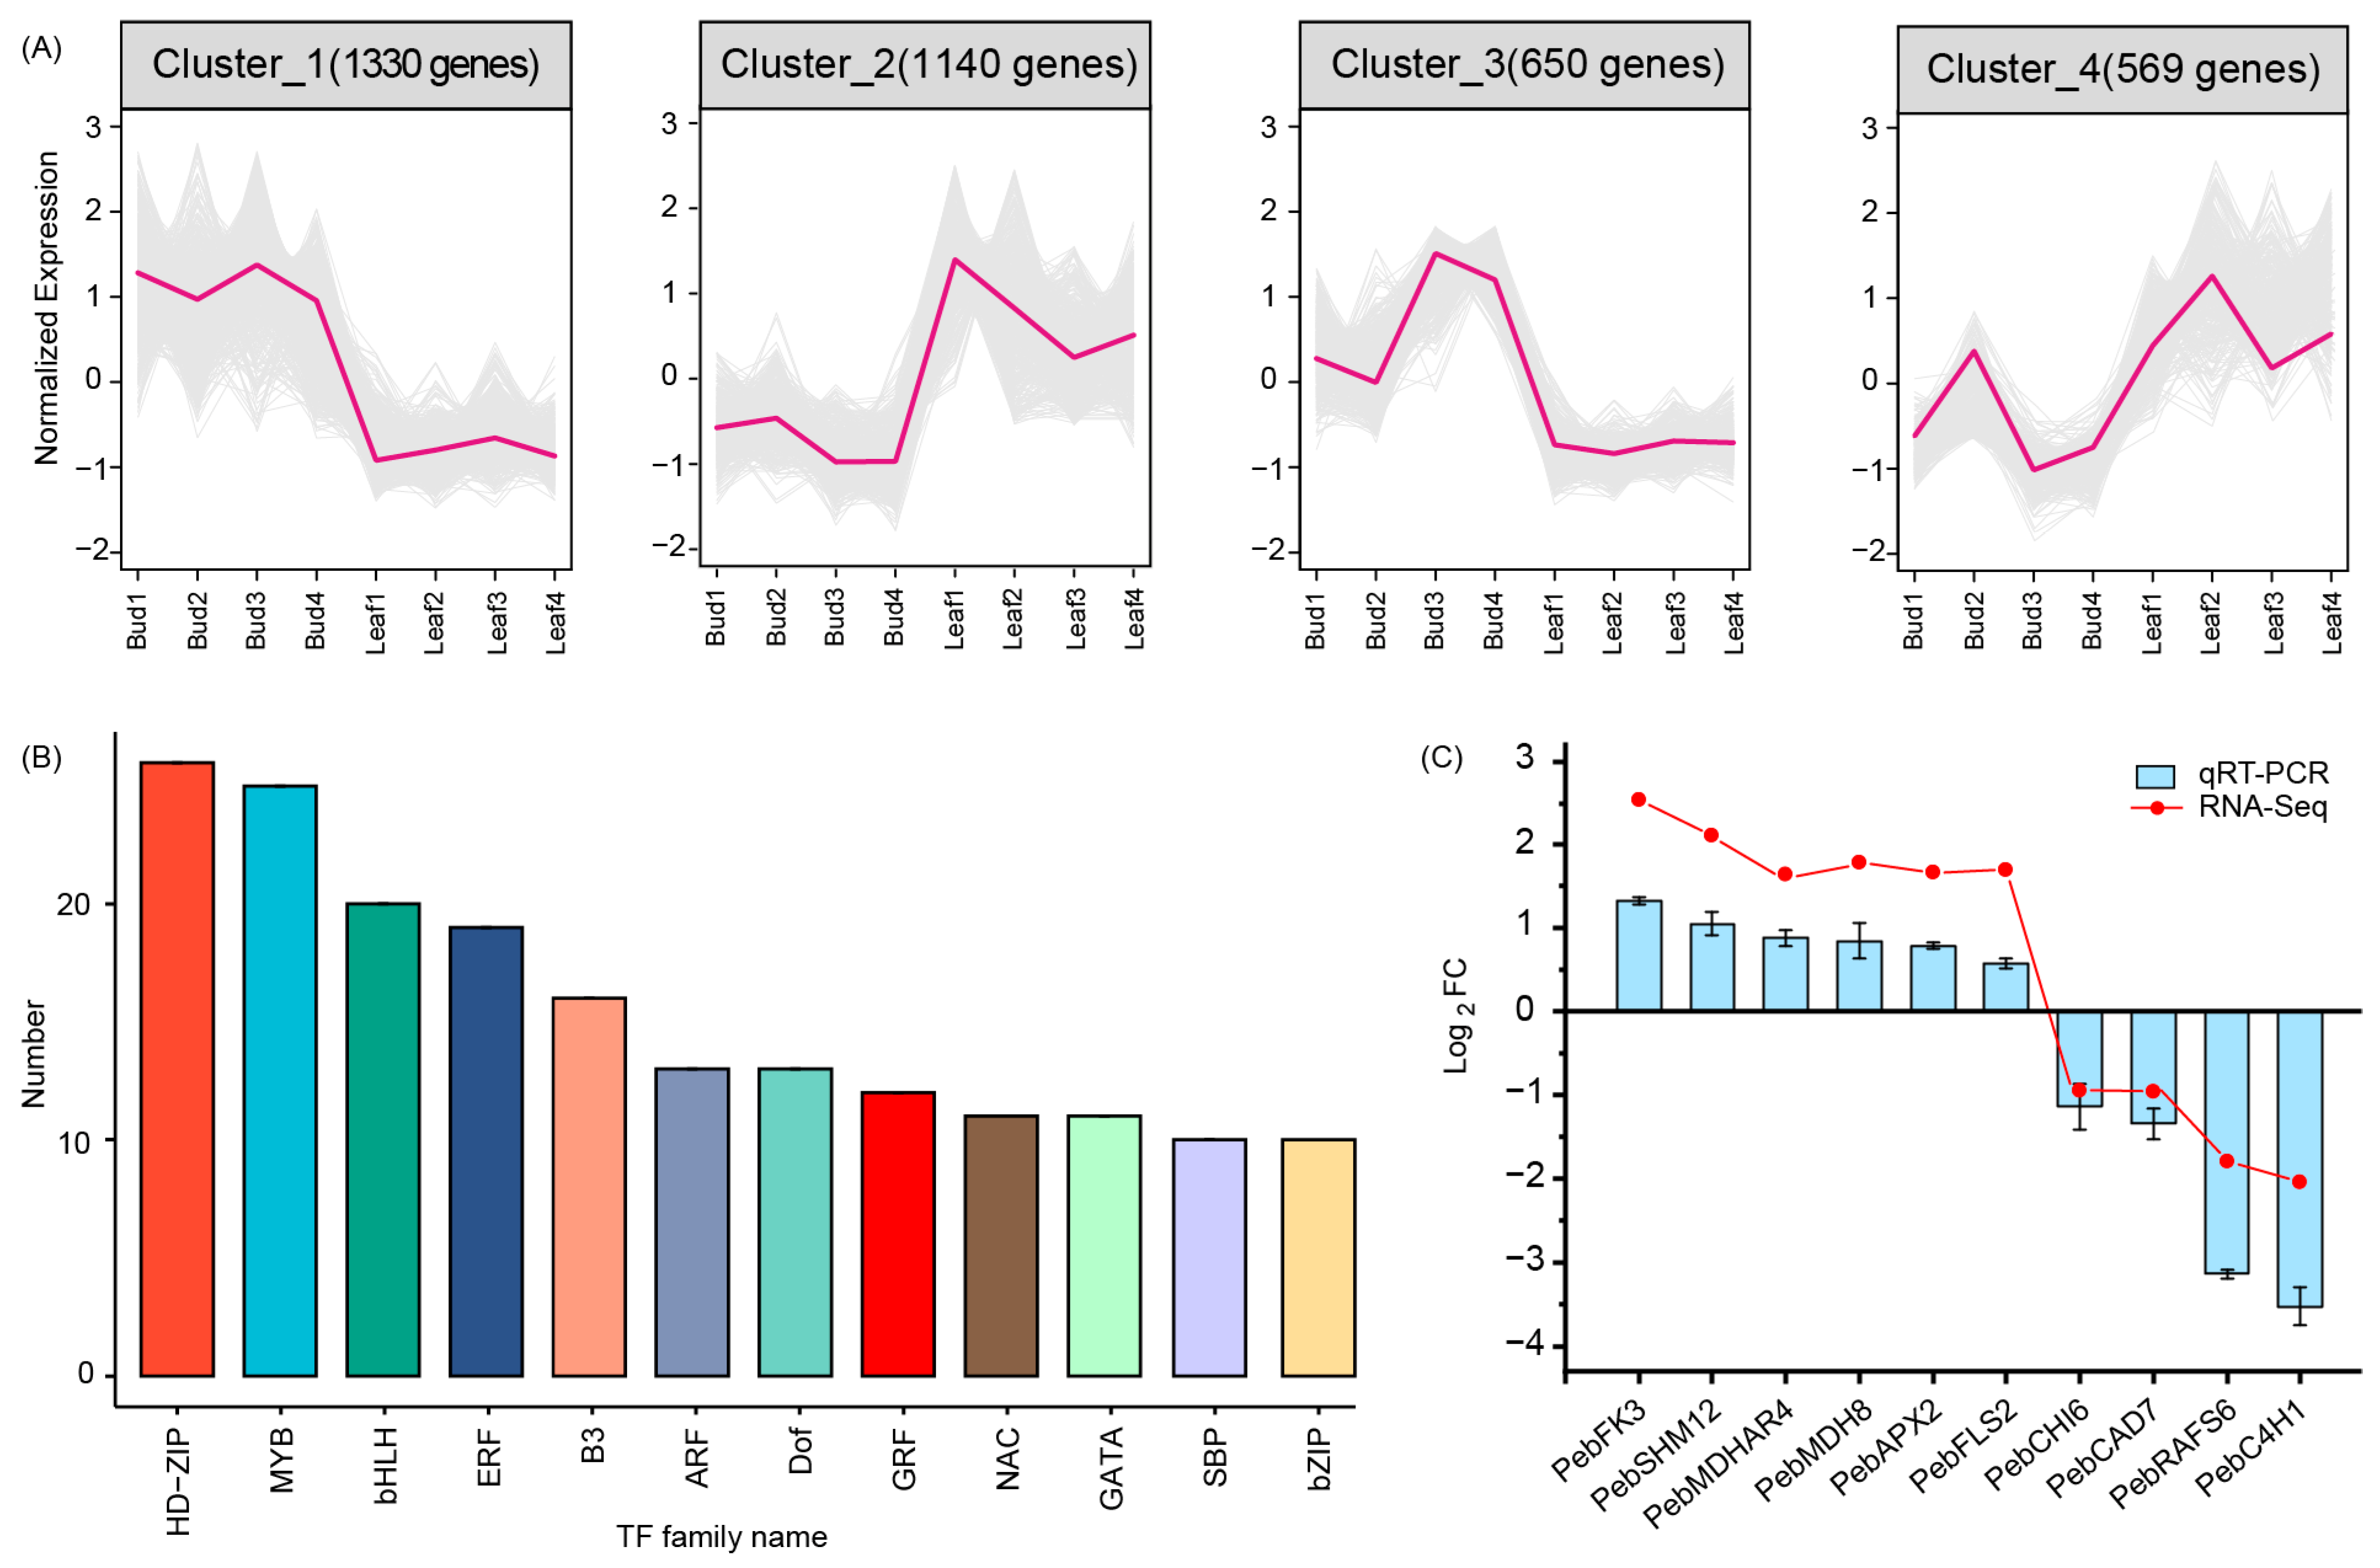
3.5. Differentially Expressed Genes between Bud and Mature Leaves

In total, 3689 DEGs were identified by log2FC > 1 (upregulated) or <1 (downregulated) in mature leaves compared with bud leaves. Among these, 1219 were upregulated, and 2470 were downregulated during leaf development (Figure 3C). In terms of GO annotation, the DEGs were mainly enriched in binding (1303; 35.32%), catalytic activity (1162; 31.50%), and metabolic process (1192; 32.31%) (Figure S3). The top-enriched KEGG terms were associated with the biosynthesis of secondary metabolites, plant hormone signal transduction, phenylpropanoid biosynthesis, flavonoid biosynthesis, and carbohydrate metabolism (Figure 3D).
The DEGs were grouped into four clusters according to their expression dynamism during leaf development (Figure 4A and Figure S4). Cluster 1 encompassed 1330 genes that showed a decrease in their expression levels from bud leaf to mature leaf, and 1140 genes were grouped into cluster 2, which increased their expression from bud leaf to mature leaf. These DEGs were found to encode 270 TFs, mainly HD-ZIP, MYB, bHLH, ERF, and so on (Figure 4B). MYB has been demonstrated to be the TFs that most often modulate or generate the new traits involved in flavor and nutrition in crops [27]. bHLH affects the Brassicales’ nutrition by regulating the biosynthesis of glucosinolates [28]. Therefore, we suspect that some of these 270 TFs may play key roles in modulating the expression levels of genes involved in the nutrition and flavor of P. eburnea leaves. Clusters 3 and 4 encompass 650 and 569 genes, respectively. They did not show obvious expression trends during leaf development; thus, their involvement in metabolite accumulation was unclear.

3.6. qRT-PCR Validation

To validate the accuracy of our RNA-seq data, 10 DEGs related to flavor ingredient biosynthesis were randomly selected for qRT-PCR (Figure 4C). Expression profiles from RNA-seq and qRT-PCR were similar. Pearson’s correlation analysis showed that R2 was 0.90 (Figure S4). Thus, the data were proven to be reliable.

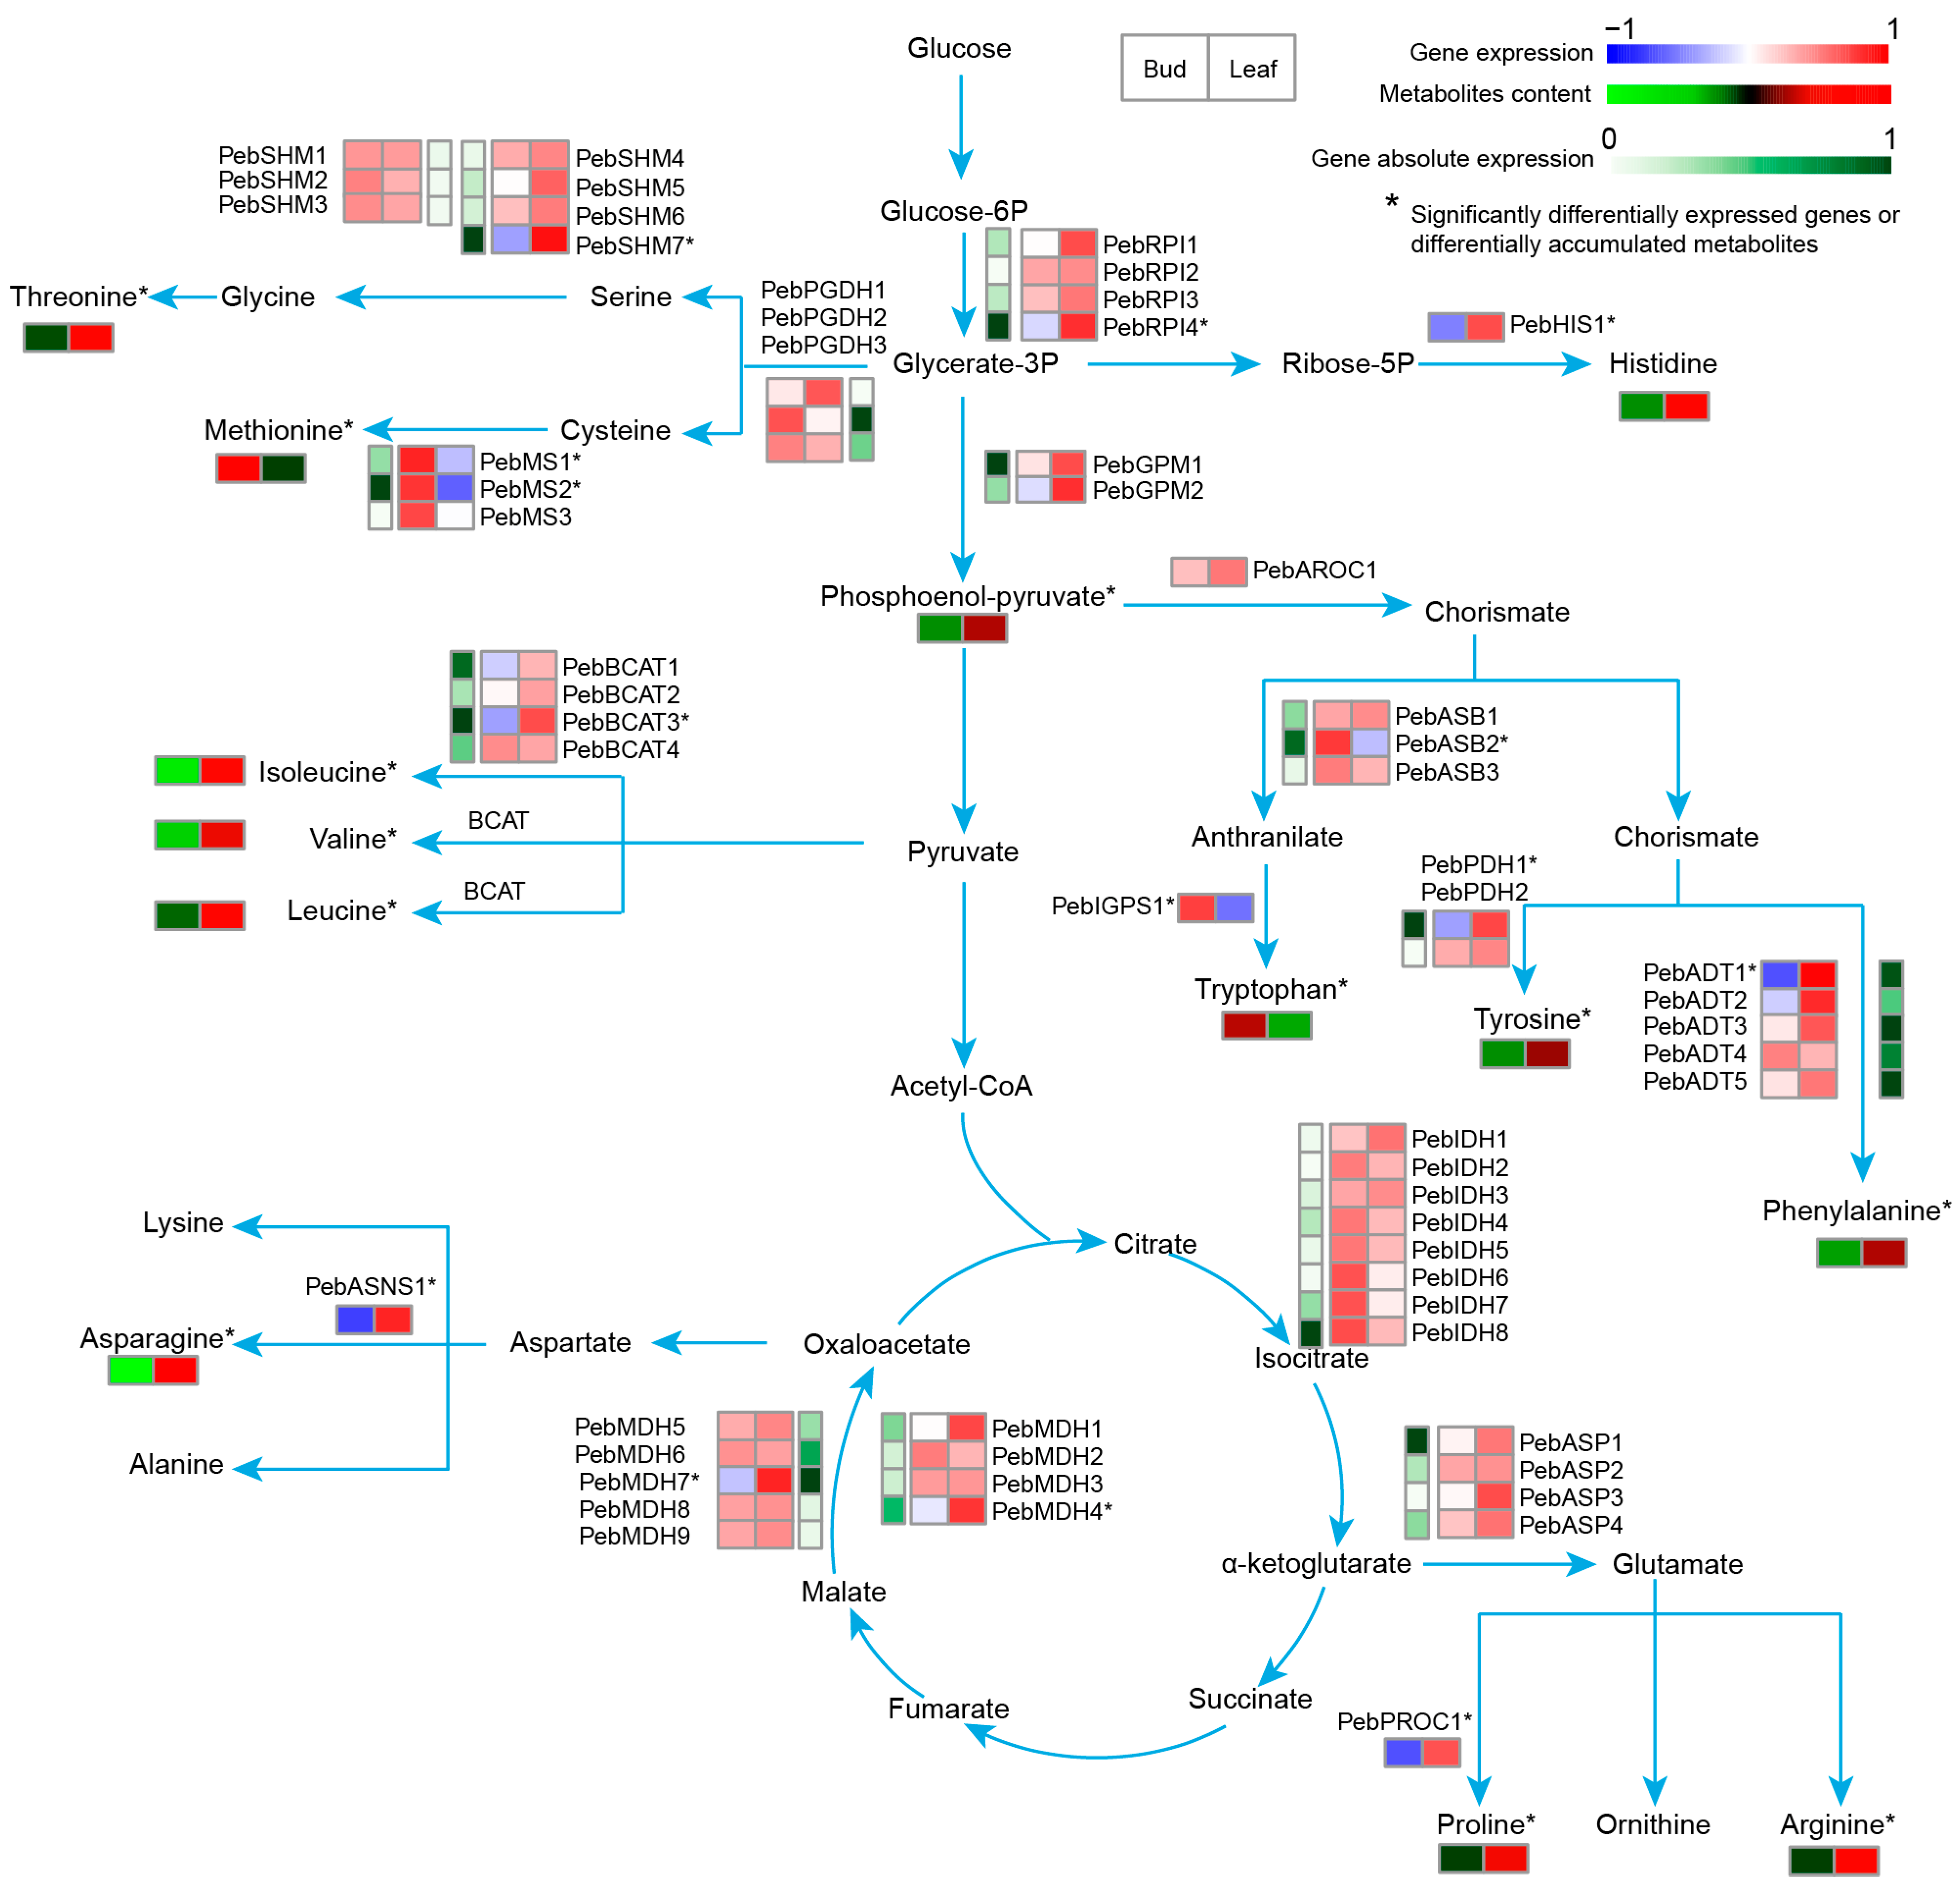
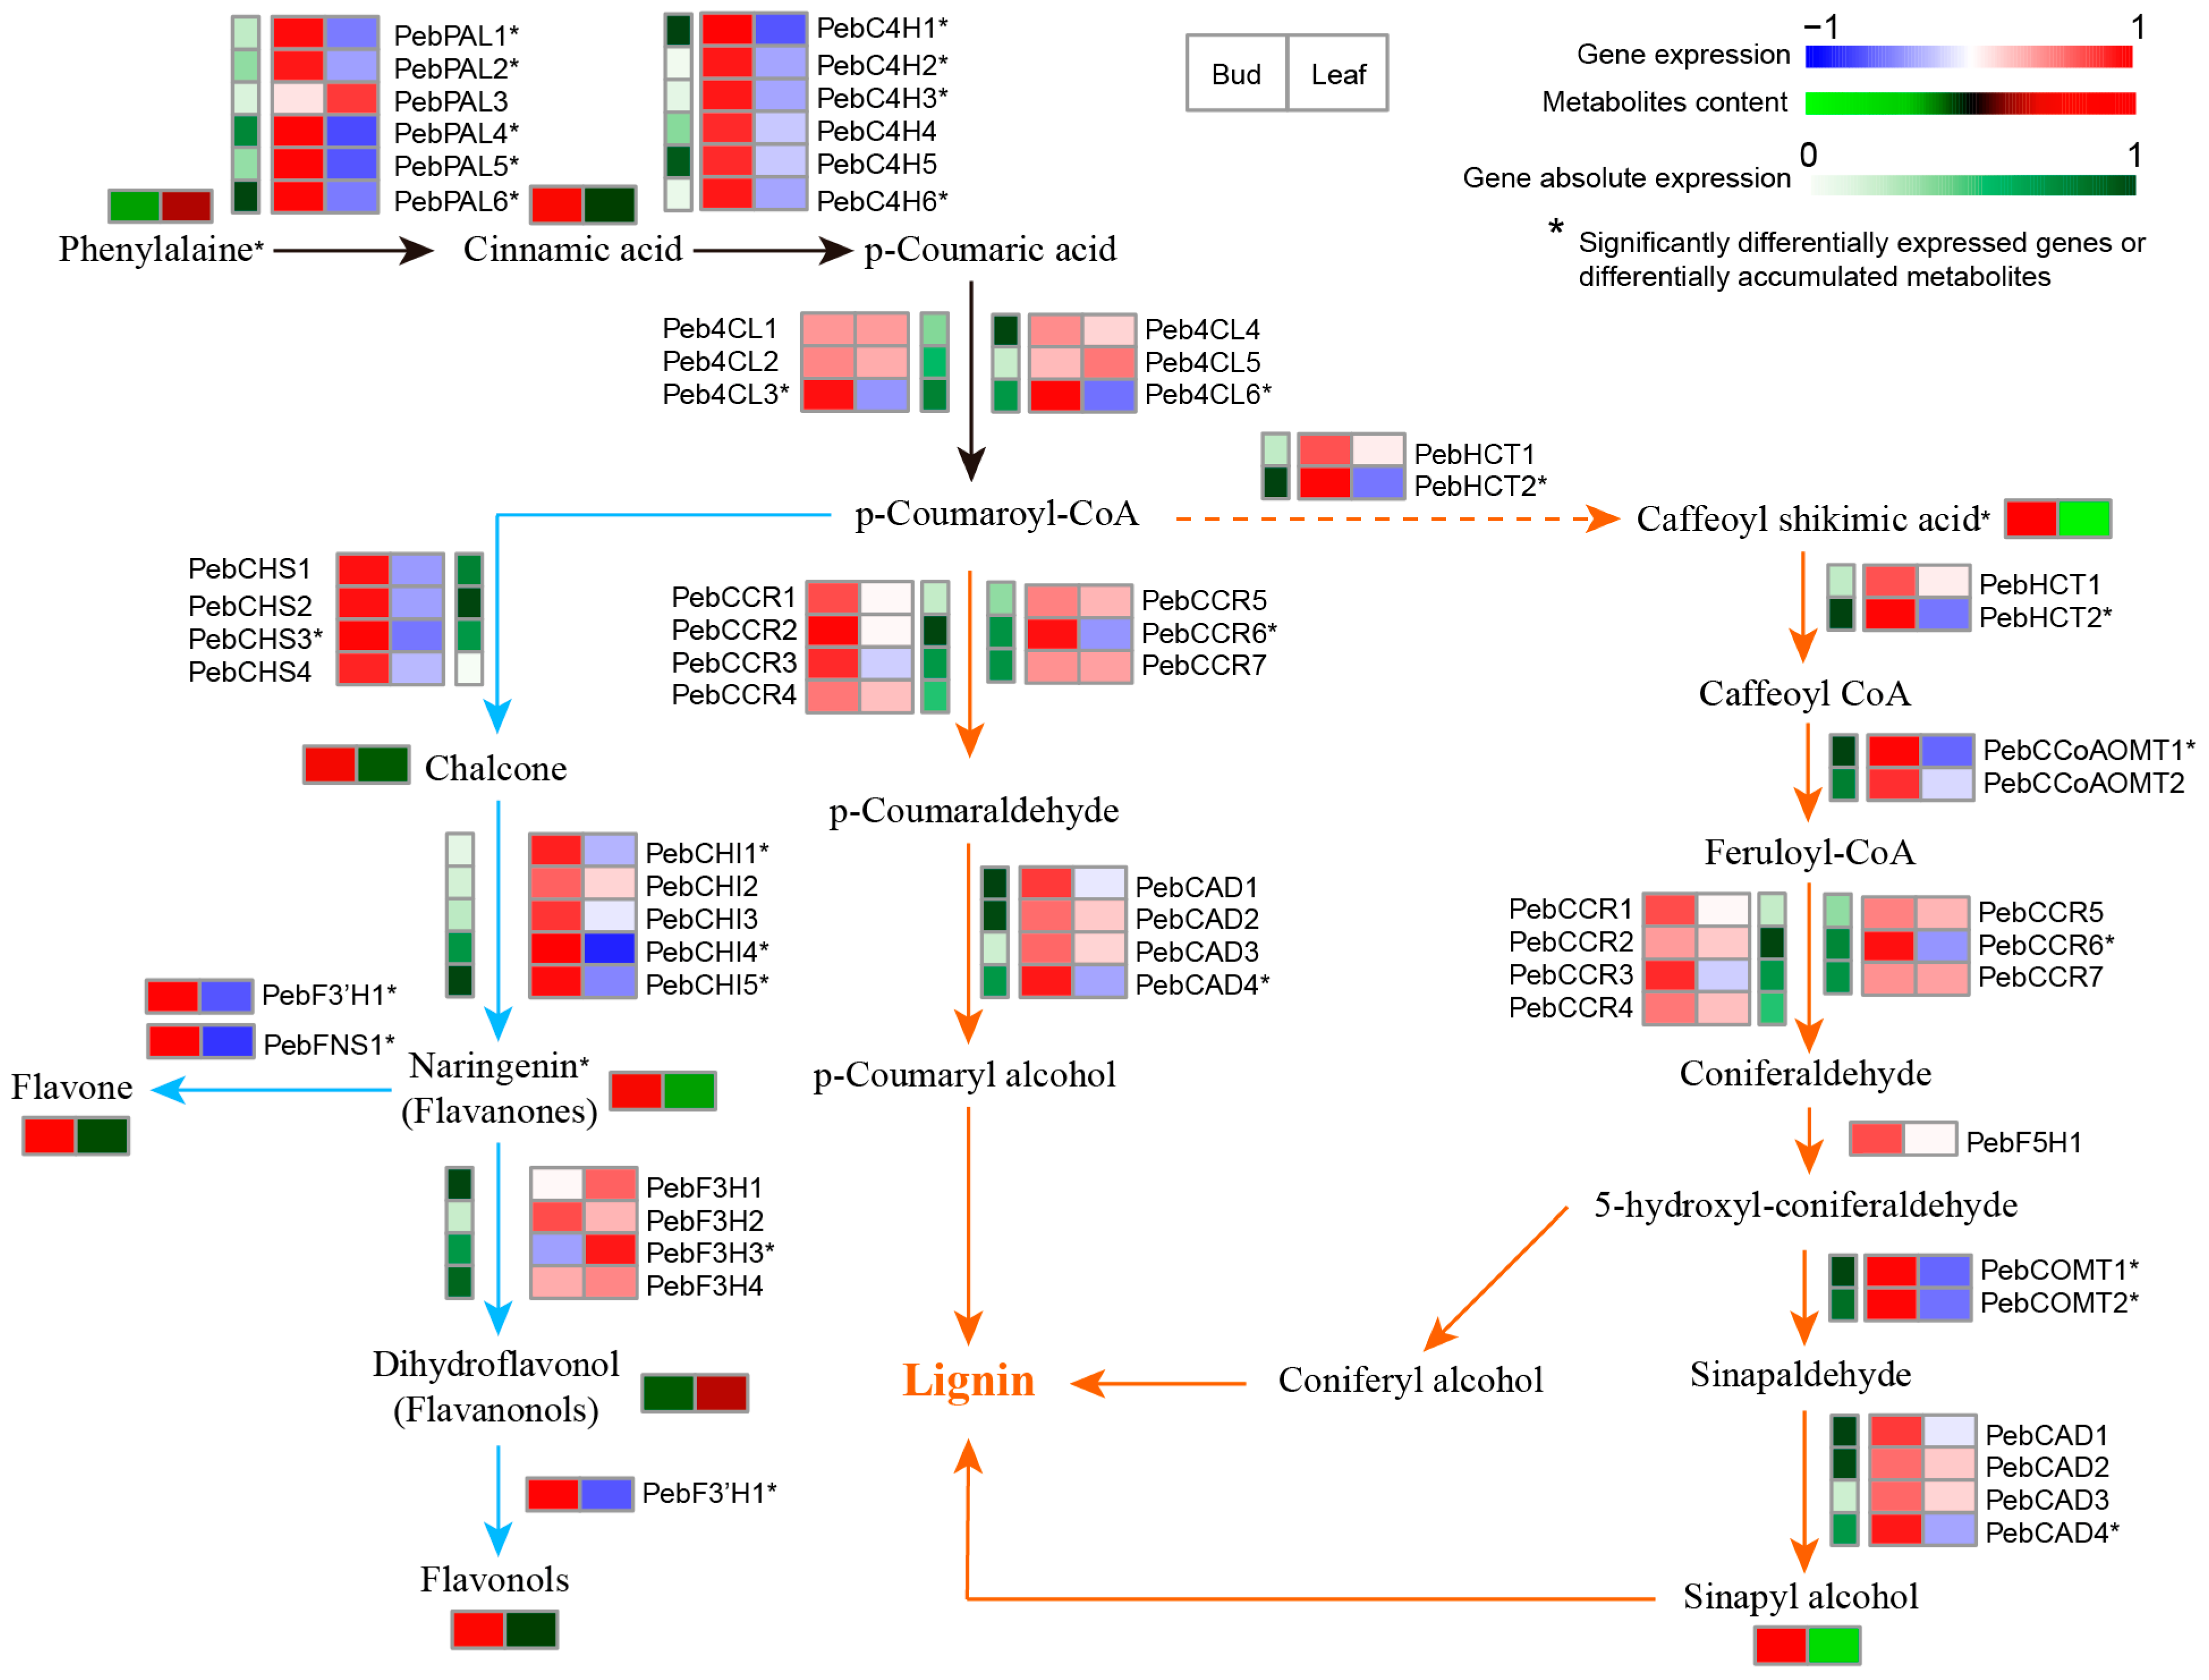
3.7. Related Genes in P. eburnea Flavor and Nutrition

To better understand the relationship between metabolites and genes in flavor and nutrition biosynthesis, some of the metabolites (sugar, amino acid, and flavonoids) and genes were combined to establish a network, aiming to show the relationship between associated structural gene expression and metabolite accumulation more intuitively. For soluble sugars, the sucrose content decreased with leaf development, which was in contrast to the accumulation patterns of fructose and glucose (Figure 5). Gene expression showed that the invertase genes (PebINV4 and 5) and sucrose synthase genes (PebSUS1, 2, 4 and 6) may play important roles in soluble sugar metabolism (Figure 5). The genes (PebAGPL, PebglgAs, and PebGBEs) related to starch biosynthesis were upregulated during leaf development (Figure 5). This is consistent with the accumulation of starch (Figure S2). Pectin, which affects the texture of the vegetable leaves, decreased the content during the development (Figure 5). The differentially expressed UDP-glucuronate 4-epimerase genes (PebGAE1 and 2) likely play important roles in the pectin synthesis. To further characterize the TFs that regulate sugar metabolism, we screened 108 differentially expressed TFs, including ERF, MYB, HD-ZIP, and bHLH families and constructed a regulation network through expression correlation (Figure S5A). It was very similar to the prediction of the binding ability to the cis-elements present in the promoter regions of these structural genes (Table S4). Among these 108 TFs, 36.1% and 26.9% belong to clusters 1 and 2, respectively (Table S5), similar to the proportion of clustered genes in all the DEGs (Figure 4A).
In the amino acids and derivatives, half of them (n = 33) differentially accumulated during leaf development (Table S2). Most of the DAMs (78%; n = 25) increased their content in mature leaves (Table S2; Figure 6). Among the important amino acids, L-proline plays an important role in osmotic regulation. Its content increased in the mature leaf, which is consistent with the expression pattern of the biosynthesis gene PebPROC1 (Figure 6). In the differentially accumulated amino acids, most of them accumulated similar to the expression patterns of their biosynthesis genes, including methionine and PebMSs (methionine synthase), tyrosine and PebPDHs (pyruvate dehydrogenase), and phenylalanine and the rate-limiting biosynthesis gene PebADTs (arogenate dehydratase), and so on (Figure 6). The differently expressed genes were assumed to be key structural genes in the amino acid biosynthesis pathways. Further analysis generated a correlation network based on the co-expressed key structural genes and TFs, which mainly included ERF, HD-ZIP, and MYB (Figure S5B). These main TFs were also supported by the cis-element binding ability prediction (Table S4). This suggests that these TFs correspond to the regulators controlling amino acid metabolism during leaf development. Over 40% (27 out of 67) of the predicted TFs belong to cluster 1 (Table S5), indicating that downregulated TFs play important roles in amino acid metabolic pathways. Among the 175 differentially expressed TFs that correlate with the sugar and amino acid metabolic pathways, 31 (18.3%) corresponded to the ERF type. The ERF TFs are not directly related to sugar and amino acid metabolites; they play critical roles in the regulation of ethylene-responsive genes, which are involved in various processes, such as plant growth, development, and response to biotic and abiotic stresses [29]. However, they are part of a complex regulatory network that responds to stresses [30] and modulates metabolic pathways that may indirectly impact sugar metabolism.
Flavonoids are synthesized through the phenylpropanoid pathway, which uses phenylalanine as a substrate [31]. The phenylalanine content and the expression level of the highly expressed phenylalanine biosynthesis gene PebADT1 increased in the mature leaves (Figure 6). However, the content of downstream products of phenylalanine metabolism, e.g., flavonoids, lignin, and salicylic acid, decreased content (Figure S6; Table S6). In these pathways, PebPALs encode the key gateway enzyme phenylalanine ammonia lyases. Decreasingly accumulated metabolites were determined by downregulating these genes. Similarly, the expression of nearly all downstream genes decreased, including five of six Peb4CLs, three of four PebF3H, and all PebC4Hs, PebCHSs, PebCHIs, PebF3′Hs, and PebFNS (Figure 7). However, the content of the deviates, such as L-Dopa and glycyl-L-phenylalanine, increased (Table S2; Figure S6). By combining the co-expression network and cis-element binding ability prediction, we identified some important TFs, which include HD-ZIP, MYB, GRF, and WRKY families (Figure S5C; Table S4). All these predicted TFs (64) belong to cluster 1 (65.6%) and cluster 2 (34.4%) (Table S5).

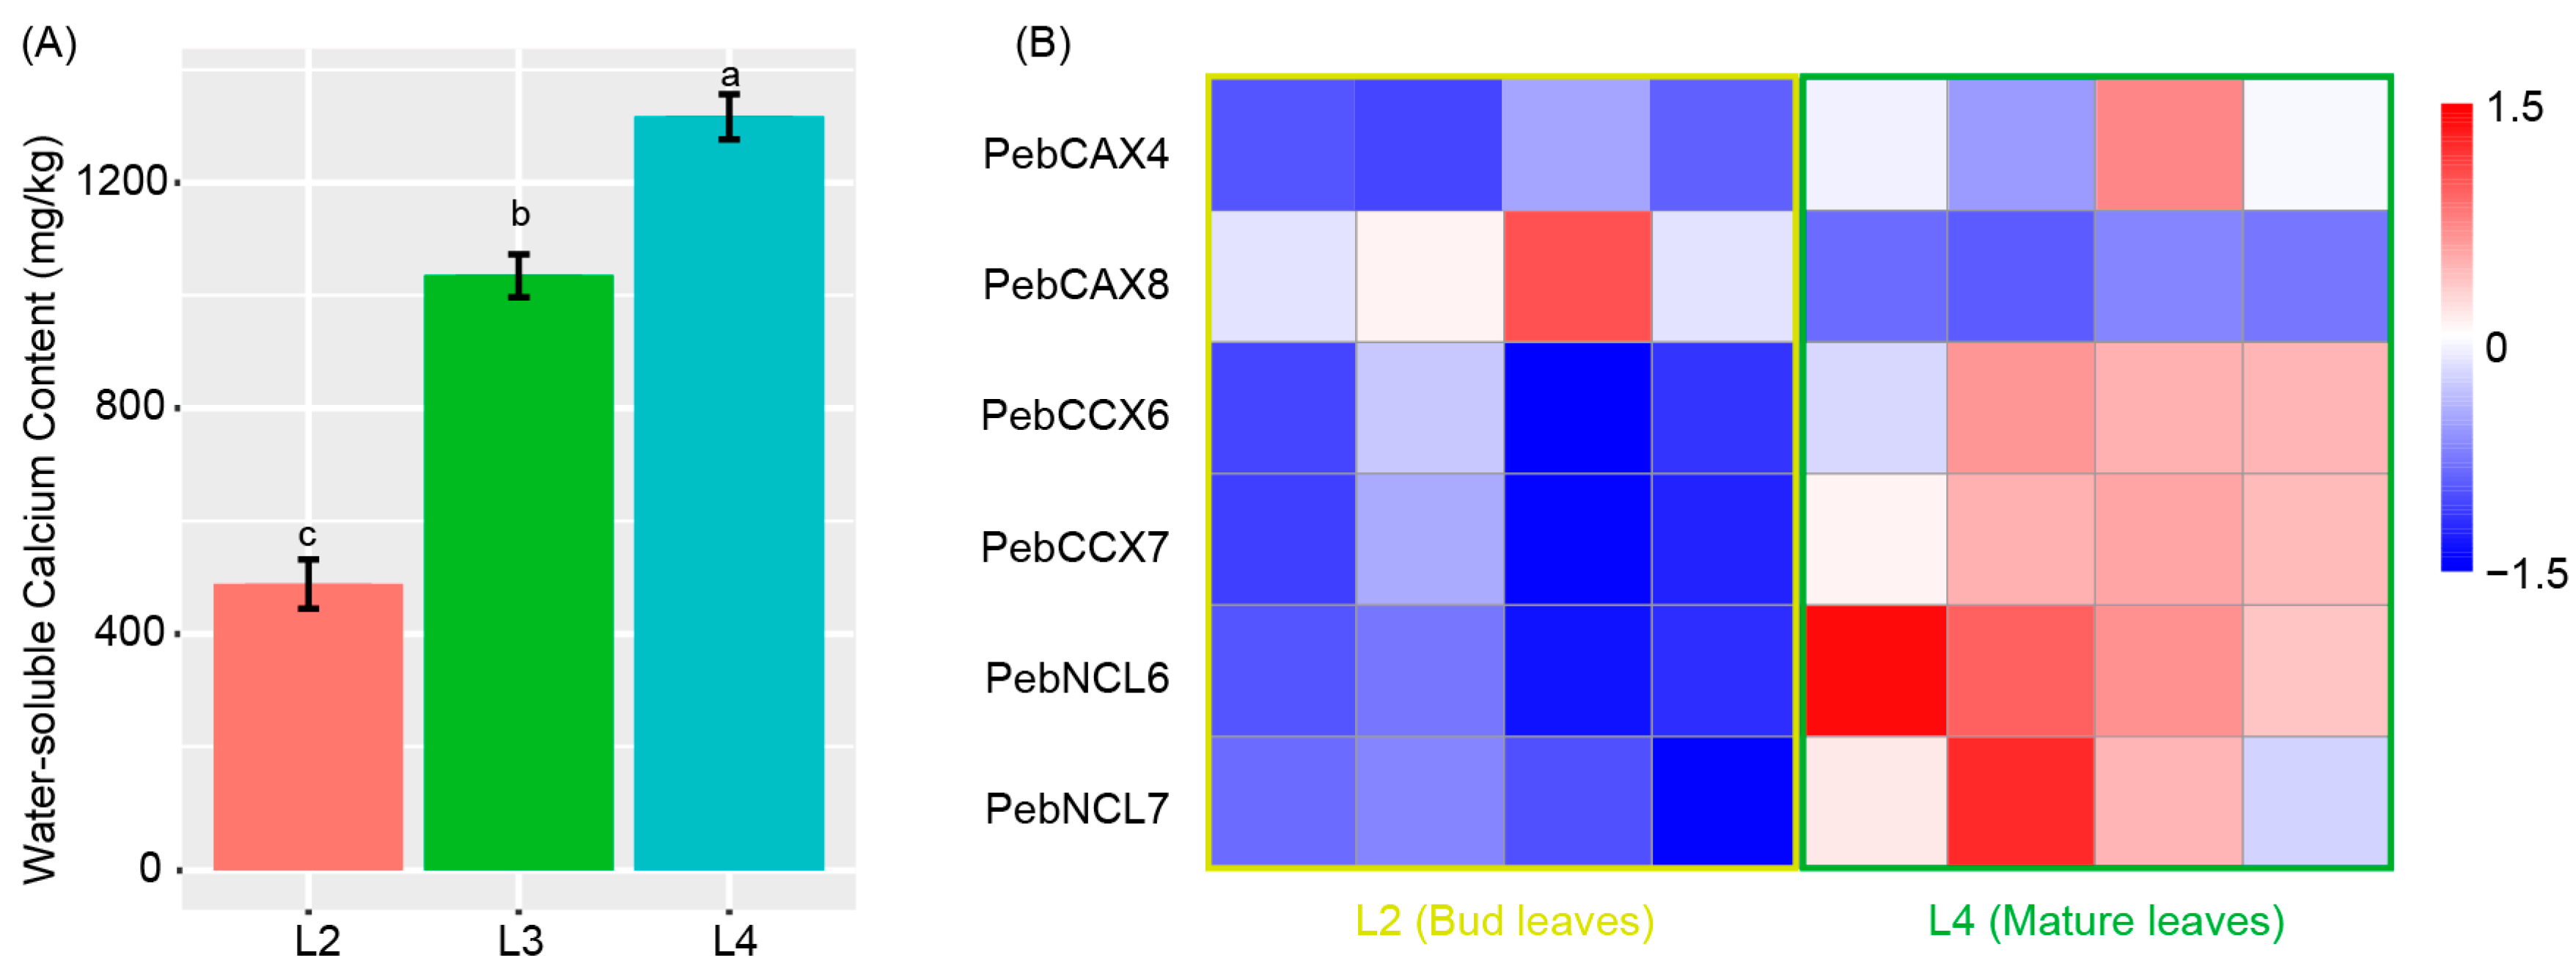
3.8. Metabolism of Water-Soluble Calcium in P. eburnea

Water-soluble calcium is one of the major ingredients of bioavailable calcium in crops, significantly increasing its content during the development of P. eburnea leaves (Figure 8A). Previous studies showed that the modulation in Ca2+ concentration across the cell membrane is mediated by three classes of membrane transporters: Ca2+-ATPases (PMCAs), Ca2+ permeable channels, and Ca2+/cation antiporters (CaCAs), which regulate cytosolic Ca2+ levels [32,33,34]. Here, we investigated the expression profiles of these gene members and some related genes and found that among the six differentially expressed CaCAs, five increased their transcript levels during the P. eburnea leaf development (Figure 8B). Expression of PMCAs and Ca2+ permeable channel genes did not show a significant difference between bud and mature leaves (Figure S7).

4. Discussion

Elucidating the metabolic pathways and regulators governing the accumulation of key flavor and nutritional compounds is essential for understanding and improving vegetable quality during domestication. As illustrated in this study, the comprehensive analysis of the flavor-related metabolome and transcriptome at different developmental stages of calcium-rich vegetables enabled the generation of regulatory networks associated with the accumulation of key flavor and nutrition components. Using our datasets, we identified key structural genes and TFs that regulate the metabolism of sugars, amino acids, and flavonoids. This not only helps to characterize the key genes controlling specific flavor and nutrition compounds but also provides a foundation for future breeding strategies aimed at improving calcium-rich vegetable quality.
Metabolomic analysis revealed 1041 metabolites, including sugars, amino acids and their derivatives, flavonoids, phenolic acids, organic acids and their derivatives, terpenes, and alkaloids, in P. eburnea developing leaves (Figure 2C). Some metabolites affect the flavor of this calcium-rich vegetable, and some are potentially medicinally or nutritionally active ingredients. For example, soluble sugars (e.g., glucose, fructose, and sucrose) and polysaccharides (e.g., pectin and starch) affect the taste and texture of vegetables. The content of most soluble sugars, except galactose and starch, decreased during leaf development (Figure 5). The decreased content of pectin (Figure 5) and cellulose [10] improved the taste of the mature leaves of calcium-rich vegetables. In addition to vegetable use, P. eburnea also has a long history as a source of medicine. Flavonoids, such as quercetin, luteolin, eriodictyol, and luteoloside, have antioxidative, anti-inflammatory, and neuroprotective effects [35]. In this study, P. eburnea was rich in these potential medicinal ingredients (Table S2), even though some of them decreased their contents during leaf development. P. eburnea could, therefore, be regarded as a new type of medicinal and edible vegetable. There were significant differences in metabolite profiles during leaf development. Most of the potentially medicinally active ingredients differentially accumulated between the two developmental stages. The downregulated ingredients in the leaves included 56% of the expressed flavonoids and 43% of the phenolic acids. However, 76% of the terpenoids were upregulated in the leaves. These results indicate that leaves in different developmental stages are likely suitable for different medicinal uses.
As discussed above, sugars strongly influence fresh vegetable quality and are the key factors involved in the development of fresh and sweet flavors [36]. In addition, soluble sugars are involved in osmoregulation mechanisms within the cell [37]. The contents of soluble sugar and starch are often related to stress responses in plants [38,39]. The accumulation of soluble sugar may be at least partially triggered by the degradation of polysaccharides [40]; thereby, starch metabolism is thought to be closely related to tolerance against stresses [41]. The high content of starch and the low content of soluble sugar represent a high capacity for stress resistance [37,39]. These indicate that the resistance of P. eburnea leaves may vary during development due to the fluctuating content of soluble sugar and starch. Here, an integrated analysis of transcriptomic and metabolomic data revealed 20 sugar hydrolysis and biosynthesis genes that were differentially expressed between P. eburnea bud and mature leaves (encoding the enzymes INV, SUS, FKK, MPI, glgA, SSS, GBSS, HXK, TPS, GAE, GOLS, and RAFS) (Figure 5). In potato and peach fruit, INV has been demonstrated to play important roles in cold resistance [42,43]. These genes could be developed as candidate genes for breeding and/or engineering this calcium-rich vegetable to increase both the resistance and flavor.
As one of the most important products of the phenylalanine ammonia-lyase pathway, salicylic acid was often introduced as the “sixth” principal plant hormone and serves as a defense-related hormone in plants [44,45]. In mature leaves, the salicylic acid content was lower than that in bud leaves (Figure S8; Table S4). A similar phenomenon was found for lignin (Table S4), which also plays an important role in host defense against pathogen invasion in plants [46]. L-Dopa can be detoxified from phenylalanine in plants [47] and inhibits plant growth, especially in the roots [48]. The increased accumulation of L-Dopa in P. eburnea leaves (Figure S6; Table S2) may not be advantageous to plant growth. These results indicate that P. eburnea leaves became more susceptible during the development but extended their medicinal and nutritional advantages. Integration analysis revealed two DEGs in salicylic acid synthesis (encoding ICS and PBS) and L-Dopa synthesis (encoding PPO) (Figure S6). Further research on the function of these genes could accelerate the medicinal use of this calcium-rich vegetable.
Different from dairy products, vegetable crops lack protein-chelated calcium, and water-soluble calcium is their primary bioavailable calcium. The content of water-soluble calcium increased during the leaf development of calcium-rich vegetables, and the membrane transporters responsible for calcium were CaCA proteins. The six differentially expressed CaCA genes during leaf development may play important roles in calcium membrane transport and the accumulation of water-soluble calcium in the calcium-rich vegetable. The functional analysis of these genes will benefit breeding efforts and help elucidate the adaptation of this calcium-rich vegetable to its kart landform environment.

5. Conclusions

In “Gaogai-1” cultivar leaves, a total of 1041 metabolites were identified in the untargeted metabolome. Most of the flavor components and antioxidant components showed decreased accumulation with leaf development. However, a contrasting phenomenon was found for starch and terpenes. This resulted in leaves of different developmental stages being suitable for different medicinal purposes. Integration analysis of the metabolome and transcriptome identified a series of key genes involved in the biosynthesis of flavor, nutritional, and medicinal ingredients. These genes could be developed as candidate genes for the breeding and engineering of this calcium-rich vegetable. The findings of the present study will be useful for the application of this underutilized vegetable in the food and medicinal industries in the future.

Supplementary Materials

The following supporting information can be downloaded at https://www.mdpi.com/article/10.3390/agronomy13082157/s1. Figure S1: (A) Venn diagram of the detected metabolites in “Gaogai-1” buds and leaves. (B) Categories’ statistics of differentially accumulated metabolites during the leaf development; Figure S2: Relative content of glucose (A), fructose (B), and galactose (C) in the second and fourth pairs of leaves, which were determined by MetWare. Total starch content of the second to fourth pairs of leaves (C), which was determined in our lab; Figure S3: Diagram showing the gene ontology categories of the differentially expressed genes during the “Gaogai-1” leaf development; Figure S4: Four clusters representing 3689 DEGs with distinct stage-specific expression patterns. These clusters were further grouped into two superclusters (Cluster 1 + 3 and Cluster 2 + 4). Heatmap of transcript accumulation patterns (relative expression) of these genes generated by RNA-seq was shown; Figure S5: Correlation analysis of qRT-PCR and RNA-seq results; Figure S6: Potential interacting networks between the differentially expressed structural genes and transcription factors. Pearson correlation coefficient (PCC) values were calculated, and a PCC value over 0.9 was used to determine potential interactions. (A), (B), and (C) represent pathways of carbohydrate, amino acid, and phenylpropanoid metabolism, respectively; Figure S7: Heatmap of transcript accumulation patterns (relative expression) of Ca2+-ATPases and Ca2+ permeable channel genes generated by RNA-seq. Scaled log2 expression values (FPKM) are shown in the heatmap legend. ANN: Annexin; PMCA: Ca2+-ATPase; CNGC: cyclic nucleotide-gated ion channel; GLR: glutamate receptor; MCA: Mid1-complementing activity; OSCA: hyperosmolarity-gated calcium-permeable channel; and TPC: two-pore calcium channel; Figure S8: Simplified model of biosynthesis pathways of L-Dopa and salicylic acid in “Gaogai-1” and the heatmap of metabolite accumulation and related gene expression patterns at different developmental stages. The differentially expressed genes and differentially accumulated metabolites are marked with asterisks; Table S1: Information of primers used for qRT-PCR; Table S2: Differentially accumulated metabolites (bud leaves vs. mature leaves) statistics; Table S3: Summary of the sequence analysis of 14 RNA-seq libraries; Table S4: Statistics of TF binding sites prediction in the promoter regions of the key structural genes; Table S5: Statistics of transcription factors in co-expression networks; Table S6: Physiological traits variation during the leaf development.

Author Contributions

Y.Z. and C.F. designed this study. Y.Z., E.Y. and Q.L. performed the experiments. Y.Z., E.Y. and C.F. conducted the data analysis and wrote the manuscript. All the authors were involved in the discussion of the data and approved the final manuscript. All authors have read and agreed to the published version of the manuscript.

Funding

This work was supported by the Biological Resources Programme, Chinese Academy of Sciences (KFJ-BRP-007-013) and the Special Project for Lushan Plants (2021ZWZX18).

Data Availability Statement

All data are contained in the manuscript.

Acknowledgments

We would like to thank Nanchang Botanical Garden for providing the greenhouse for seedling cultivation.

Conflicts of Interest

The authors declare no conflict of interest.

References

  1. Glade, M.J.; Altman, R.D.; Bezman, R.J.; Davis, R.M.; Genel, M.; Howe, J.P.; Karlan, M.S.; Numan, P.J.; Riggs, J.A.; Skelton, W.D.; et al. Intake of dietary calcium to reduce the incidence of osteoporosis. Arch. Fam. Med. 1997, 6, 495–499. [Google Scholar]
  2. Balk, E.M.; Adam, G.P.; Langberg, V.N.; Earley, A.; Clark, P.; Ebeling, P.R.; Mithal, A.; Rizzoli, R.; Zerbini, C.A.F.; Pierroz, D.D.; et al. Global dietary calcium intake among adults: A systematic review. Osteoporos. Int. 2017, 28, 3315–3324. [Google Scholar] [CrossRef]
  3. Yao, X.C.; Hu, J.T.; Kong, X.H.; Zhu, Z.X. Association between Dietary Calcium Intake and Bone Mineral Density in Older Adults. Ecol. Food Nutr. 2021, 60, 89–100. [Google Scholar] [CrossRef] [PubMed]
  4. Albertson, A.M.; Tobelmann, R.C.; Marquart, L. Estimated dietary calcium intake and food sources for adolescent females: 1980–1992. J. Adolesc. Health 1997, 20, 20–26. [Google Scholar] [CrossRef] [PubMed]
  5. Weaver, C.M.; Alexander, D.D.; Boushey, C.J.; Dawson-Hughes, B.; Lappe, J.M.; LeBoff, M.S.; Liu, S.; Looker, A.C.; Wallace, T.C.; Wang, D.D. Calcium plus vitamin D supplementation and risk of fractures: An updated meta-analysis from the National Osteoporosis Foundation. Osteoporos. Int. 2016, 27, 367–376. [Google Scholar] [CrossRef]
  6. Haas, E. Staying Healthy with Nutrition; Celestial Arts Publisher: Toronto, ON, Canada, 2015. [Google Scholar]
  7. Wang, Y.-Z.; Mao, R.-B.; Liu, Y.; Li, J.-M.; Dong, Y.; Li, Z.-Y.; Smith, J.F. Phylogenetic reconstruction of Chirita and allies (Gesneriaceae) with taxonomic treatments. J. Syst. Evol. 2011, 49, 50–64. [Google Scholar] [CrossRef]
  8. Qi, Q.; Hao, Z.; Tao, J.; Kang, M. Diversity of calcium speciation in leaves of Primulina species (Gesneriaceae). Biodivers. Sci. 2014, 21, 715–722. [Google Scholar] [CrossRef]
  9. Zhang, Y.; Fu, C.; Zhou, R.; Liu, Z.; Feng, C. Effect of prechilling and exogenous gibberellin on seed germination of Primulina eburnea: A calcium-rich vegetable. Seed Sci. Technol. 2023, 51, 1–6. [Google Scholar] [CrossRef]
  10. Zhang, Y.; Zhang, J.; Zou, S.; Liu, Z.; Huang, H.; Feng, C. Genome-wide analysis of the cellulose toolbox of Primulina eburnea, a calcium-rich vegetable. BMC Plant Biol. 2023, 23, 259. [Google Scholar] [CrossRef]
  11. Cai, X.H.; Luo, X.D.; Zhou, J.; Hao, X.J. A new naphthaquinone derivative from Chirita eburnea. J. Asian Nat. Prod. Res. 2006, 8, 351–353. [Google Scholar] [CrossRef]
  12. Wang, X.; Peng, Y.; Bai, Z.; Liu, Y. Antibacterial activity of plants of Gesneriaceae. J. Med. Pharm. Chin. Minor. 2011, 1, 37–38. [Google Scholar]
  13. Liu, H.; Li, B. A review of research developments in Primulina eburnea. J. Guilin Norm. Coll. 2018, 122, 110–113. [Google Scholar]
  14. Yang, L.; Wang, C.; Chen, J.; Qiu, J.; Du, C.; Wei, Y.; Hao, X.; Gu, W. Chemical constituents and bioactivitie of whole plant of Primulina eburnea from Guizhou. Chin. Tradit. Herb. Drugs 2023, 54, 3430–3437. [Google Scholar]
  15. Li, J.J.; Yu, X.J.; Shan, Q.R.; Shi, Z.B.; Li, J.H.; Zhao, X.T.; Chang, C.F.; Yu, J.J. Integrated volatile metabolomic and transcriptomic analysis provides insights into the regulation of floral scents between two contrasting varieties of Lonicera japonica. Front. Plant Sci. 2022, 13, 989036. [Google Scholar] [CrossRef] [PubMed]
  16. Zhu, X.L.; Zhang, S.B.; Li, X.; Wang, X.Q.; Li, Z.D.; Zhu, X.Y.; Liu, X.X.; Li, H.X.; Zhang, J.; Chen, X.L. Integrative analysis of high temperature-induced transcriptome and metabolome alterations in the leaves of five raspberry (Rubus ideaus L.) cultivars. Environ. Exp. Bot. 2022, 203, 105038. [Google Scholar] [CrossRef]
  17. Wang, Z.; Zhang, W.; Huang, W.; Biao, A.; Lin, S.; Wang, Y.; Yan, S.; Zeng, S. Salt stress affects the fruit quality of Lycium ruthenicum Murr. Ind. Crops Prod. 2023, 193, 116240. [Google Scholar] [CrossRef]
  18. Feng, C.; Feng, C.; Lin, X.; Liu, S.; Li, Y.; Kang, M. A chromosome-level genome assembly provides insights into ascorbic acid accumulation and fruit softening in guava (Psidium guajava). Plant Biotechnol. J. 2020, 19, 717–730. [Google Scholar] [CrossRef]
  19. Yi, H.; Wang, J.; Wang, J.; Rausher, M.; Kang, M. Genomic insights into inter- and intraspecific mating system shifts in Primulina. Mol. Ecol. 2022, 31, 5699–5713. [Google Scholar] [CrossRef]
  20. Kim, D.; Langmead, B.; Salzberg, S.L. HISAT: A fast spliced aligner with low memory requirements. Nat. Methods 2015, 12, 357–360. [Google Scholar] [CrossRef]
  21. Pertea, M.; Pertea, G.M.; Antonescu, C.M.; Chang, T.-C.; Mendell, J.T.; Salzberg, S.L. StringTie enables improved reconstruction of a transcriptome from RNA-seq reads. Nat. Biotechnol. 2015, 33, 290–295. [Google Scholar] [CrossRef]
  22. Saeed, A.I.; Bhagabati, N.K.; Braisted, J.C.; Liang, W.; Sharov, V.; Howe, E.A.; Li, J.; Thiagarajan, M.; White, J.A.; Quackenbush, J. TM4 microarray software suite. Methods Enzymol. 2006, 411, 134–193. [Google Scholar] [CrossRef] [PubMed]
  23. Zhang, Z.; Shi, Q.; Wang, B.; Ma, A.; Wang, Y.; Xue, Q.; Shen, B.; Hamaila, H.; Tang, T.; Qi, X.; et al. Jujube metabolome selection determined the edible properties acquired during domestication. Plant J. 2022, 109, 1116–1133. [Google Scholar] [CrossRef] [PubMed]
  24. Peng, L.; Gao, W.; Song, M.; Li, M.; He, D.; Wang, Z. Integrated Metabolome and Transcriptome Analysis of Fruit Flavor and Carotenoids Biosynthesis Differences Between Mature-Green and Tree-Ripe of cv. “Golden Phoenix” Mangoes (Mangifera indica L.). Front. Plant Sci. 2022, 13, 816492. [Google Scholar] [CrossRef]
  25. Chen, W.; Gong, L.; Guo, Z.; Wang, W.; Zhang, H.; Liu, X.; Yu, S.; Xiong, L.; Luo, J. A Novel Integrated Method for Large-Scale Detection, Identification, and Quantification of Widely Targeted Metabolites: Application in the Study of Rice Metabolomics. Mol. Plant 2013, 6, 1769–1780. [Google Scholar] [CrossRef] [PubMed]
  26. Kohl, M.; Wiese, S.; Warscheid, B. Cytoscape: Software for Visualization and Analysis of Biological Networks. In Data Mining in Proteomics: From Standards to Applications; Hamacher, M., Eisenacher, M., Stephan, C., Eds.; Humana Press: Totowa, NJ, USA, 2011; pp. 291–303. [Google Scholar]
  27. Allan, A.C.; Espley, R.V. MYBs Drive Novel Consumer Traits in Fruits and Vegetables. Trends Plant Sci. 2018, 23, 693–705. [Google Scholar] [CrossRef] [PubMed]
  28. Pireyre, M.; Burow, M. Regulation of MYB and bHLH transcription factors: A glance at the protein level. Mol. Plant 2015, 8, 378–388. [Google Scholar] [CrossRef]
  29. Riechmann, J.L.; Meyerowitz, E.M. The AP2/EREBP family of plant transcription factors. Biol. Chem. 1998, 379, 633–646. [Google Scholar] [CrossRef]
  30. Chinnusamy, V.; Schumaker, K.; Zhu, J.K. Molecular genetic perspectives on cross-talk and specificity in abiotic stress signalling in plants. J. Exp. Bot. 2004, 55, 225–236. [Google Scholar] [CrossRef]
  31. Falcone Ferreyra, M.L.; Rius, S.P.; Casati, P. Flavonoids: Biosynthesis, biological functions, and biotechnological applications. Front. Plant Sci. 2012, 3, 222. [Google Scholar] [CrossRef]
  32. Haug-Collet, K.; Pearson, B.; Webel, R.; Szerencsei, R.T.; Winkfein, R.J.; Schnetkamp, P.P.M.; Colley, N.J. Cloning and characterization of a potassium-dependent sodium/calcium exchanger in Drosophila. J. Cell Biol. 1999, 147, 659–669. [Google Scholar] [CrossRef]
  33. Sanders, D.; Brownlee, C.; Harper, J.F. Communicating with calcium. Plant Cell 1999, 11, 691–706. [Google Scholar] [CrossRef] [PubMed]
  34. Axelsen, K.B.; Palmgren, M.G. Inventory of the superfamily of P-type ion pumps in Arabidopsis. Plant Physiol. 2001, 126, 696–706. [Google Scholar] [CrossRef] [PubMed]
  35. Xiao, J.; Capanoglu, E.; Jassbi, A.R.; Miron, A. Advance on the Flavonoid C-glycosides and Health Benefits. Crit. Rev. Food Sci. Nutr. 2016, 56 (Suppl. S1), S29–S45. [Google Scholar] [CrossRef]
  36. Umer, M.J.; Bin Safdar, L.; Gebremeskel, H.; Zhao, S.; Yuan, P.; Zhu, H.; Kaseb, M.O.; Anees, M.; Lu, X.; He, N.; et al. Identification of key gene networks controlling organic acid and sugar metabolism during watermelon fruit development by integrating metabolic phenotypes and gene expression profiles. Hortic. Res. 2020, 7, 193. [Google Scholar] [CrossRef] [PubMed]
  37. Pattanagul, W.; Thitisaksakul, M. Effect of salinity stress on growth and carbohydrate metabolism in three rice (Oryza sativa L.) cultivars differing in salinity tolerance. Indian J. Exp. Biol. 2008, 46, 736–742. [Google Scholar]
  38. Du, Y.; Zhao, Q.; Chen, L.; Yao, X.; Zhang, W.; Zhang, B.; Xie, F. Effect of drought stress on sugar metabolism in leaves and roots of soybean seedlings. Plant Physiol. Biochem. 2020, 146, 1–12. [Google Scholar] [CrossRef]
  39. Boriboonkaset, T.; Theerawitaya, C.; Yamada, N.; Pichakum, A.; Supaibulwatana, K.; Cha-um, S.; Takabe, T.; Kirdmanee, C. Regulation of some carbohydrate metabolism-related genes, starch and soluble sugar contents, photosynthetic activities and yield attributes of two contrasting rice genotypes subjected to salt stress. Protoplasma 2013, 250, 1157–1167. [Google Scholar] [CrossRef] [PubMed]
  40. Huang, X.; Liang, Y.S.; Zhang, B.Q.; Song, X.P.; Li, Y.R.; Li, C.N.; Qin, Z.Q.; Li, D.W.; Wei, J.G.; Wu, J.M. Comparative Transcriptome Analysis Reveals Potential Gene Modules Associated with Cold Tolerance in Sugarcane (Saccharum officinarum L.). J. Plant Growth Regul. 2022, 41, 2614–2628. [Google Scholar] [CrossRef]
  41. Krasensky, J.; Jonak, C. Drought, salt, and temperature stress-induced metabolic rearrangements and regulatory networks. J. Exp. Bot. 2012, 63, 1593–1608. [Google Scholar] [CrossRef] [PubMed]
  42. Zhao, Y.Y.; Song, C.C.; Brummell, D.A.; Qi, S.N.; Lin, Q.; Bi, J.F.; Duan, Y.Q. Salicylic acid treatment mitigates chilling injury in peach fruit by regulation of sucrose metabolism and soluble sugar content. Food Chem. 2021, 358, 129867. [Google Scholar] [CrossRef]
  43. Liu, X.; Chen, L.; Shi, W.; Xu, X.; Li, Z.; Liu, T.; He, Q.; Xie, C.; Nie, B.; Song, B. Comparative transcriptome reveals distinct starch-sugar interconversion patterns in potato genotypes contrasting for cold-induced sweetening capacity. Food Chem. 2021, 334, 127550. [Google Scholar] [CrossRef] [PubMed]
  44. Ding, P.; Ding, Y. Stories of Salicylic Acid: A Plant Defense Hormone. Trends Plant Sci. 2020, 25, 549–565. [Google Scholar] [CrossRef] [PubMed]
  45. Dempsey, D.A.; Vlot, A.C.; Wildermuth, M.C.; Klessig, D.F. Salicylic Acid biosynthesis and metabolism. Arab. Book 2011, 9, e0156. [Google Scholar] [CrossRef] [PubMed]
  46. Bhuiyan, N.H.; Selvaraj, G.; Wei, Y.; King, J. Role of lignification in plant defense. Plant Signal. Behav. 2009, 4, 158–159. [Google Scholar] [CrossRef] [PubMed]
  47. Soares, A.R.; de Cássia Siqueira-Soares, R.; Salvador, V.H.; de Lourdes Lucio Ferrarese, M.; Ferrarese-Filho, O. The effects of l-DOPA on root growth, lignification and enzyme activity in soybean seedlings. Acta Physiol. Plant. 2012, 34, 1811–1817. [Google Scholar] [CrossRef]
  48. Soares, A.R.; Marchiosi, R.; Siqueira-Soares Rde, C.; Barbosa de Lima, R.; Dantas dos Santos, W.; Ferrarese-Filho, O. The role of L-DOPA in plants. Plant Signal. Behav. 2014, 9, e28275. [Google Scholar] [CrossRef]
Figure 1. (A) Leaf morphology of “Gaogai-1” during development. (BE) Biomass, water content, total acid content, and total protein content of the second to fourth pairs of leaves. Different lowercase letters indicated significant differences at 0.05 level.
Agronomy 13 02157 g001
Figure 2. Differential chemotypes between the bud leaves and mature leaves of “Gaogai-1”. (A) Principal component analysis of metabolites identified from buds and leaves. Equal volumes of bud and mature leaf samples were mixed to generate a quality control (QC) sample. (B) Correlation analysis of bud and leaf samples. The color indicates the level of correlation of each sample, from low (blue) to high (red). (C) Pie chart depicting the categories of metabolites. (D) Volcano plots display differentially accumulated metabolites (DAMs) that were upregulated, downregulated, or showed no change between bud and leaf samples. (E) Top-enriched Kyoto Encyclopedia of Genes and Genomes (KEGG) terms.
Agronomy 13 02157 g002
Figure 3. Differential phenotypes between Gaogai-1’ buds and leaves. (A) Principal component analysis of genes identified from buds and leaves. (B) Correlation analysis of bud and mature leaf samples. The color indicates the level of correlation of each sample, from low (blue) to high (red). The Z-score represents the correlation coefficient between each pair of samples. (C) Volcano plots and (D) top 20 KEGG pathways enriched in 3689 differentially expressed genes.
Agronomy 13 02157 g003
Figure 4. Gene expression and regulation during the development of “Gaogai-1” leaves. (A) Four clusters of differentially expressed genes. (B) Transcription factor families enriched in Clusters 1 and 2. (C) Relative expression of 10 genes in different tissues via qRT-PCR and RNA-seq.
Agronomy 13 02157 g004
Figure 5. Simplified model of carbohydrate metabolic pathway in “Gaogai-1” and the heatmap of metabolite accumulation and related gene expression pattern at different developmental stages. The differentially expressed genes and differentially accumulated metabolites are marked with asterisks.
Agronomy 13 02157 g005
Figure 6. Simplified model of amino acid metabolic pathways in “Gaogai-1” and the heatmap of metabolite accumulation and related gene expression patterns at different developmental stages. The differentially expressed genes and differentially accumulated metabolites are marked with asterisks.
Agronomy 13 02157 g006
Figure 7. Simplified model of the phenylpropanoid pathway in “Gaogai-1” and the heatmap of metabolite accumulation and related gene expression patterns at different developmental stages. The differentially expressed genes and differentially accumulated metabolites are marked with asterisks.
Agronomy 13 02157 g007
Figure 8. (A) Water-soluble calcium content of the second to fourth pairs of leaves. (B) Heatmap of transcript accumulation patterns (relative expression) of six differentially expressed calcium antiporter genes generated by RNA-seq. Scaled log2 expression values (FPKM) are shown in the heatmap legend. Different lowercase letters indicated significant differences at 0.05 level.
Agronomy 13 02157 g008
Disclaimer/Publisher’s Note: The statements, opinions and data contained in all publications are solely those of the individual author(s) and contributor(s) and not of MDPI and/or the editor(s). MDPI and/or the editor(s) disclaim responsibility for any injury to people or property resulting from any ideas, methods, instructions or products referred to in the content.

