Article

Metabolomic and Transcriptomic Insights into Anthocyanin Biosynthesis in ‘Ziyan’ Tea Plants under Varied Photoperiod and Temperature Conditions

1
College of Horticulture, Sichuan Agricultural University, Chengdu 611130, China
2
Tea Refining and Innovation Key Laboratory of Sichuan Province, Chengdu 611130, China
*
Authors to whom correspondence should be addressed.
Agronomy 2024, 14(1), 56; https://doi.org/10.3390/agronomy14010056
Submission received: 6 December 2023 / Revised: 20 December 2023 / Accepted: 22 December 2023 / Published: 25 December 2023
(This article belongs to the Special Issue Horticultural Crop Secondary Metabolism)

Abstract

:
(1) Background: Anthocyanins, the main pigments in plants, are influenced by both temperature and photoperiod. However, the specific mechanisms underlying anthocyanin accumulation in tea plants in response to these two environmental factors remain unclear. (2) Methods: This study subjected potted ‘Ziyan’ tea plants to four types of day-length and temperature treatments (HL (28 °C, 16 h), HS (28 °C, 8 h), LL (18 °C, 16 h), and LS (18 °C, 8 h)), and then conducted targeted metabolomic and transcriptomic analyses of the samples. (3) Results: Long photoperiods and low temperatures both promoted anthocyanin accumulation in the new shoots of the tea plants. Furthermore, the enhancing effects of these two environmental factors on anthocyanin accumulation are additive and exhibit interactive effects. Through a combined analysis of metabolomics and transcriptomics, five key differentially accumulated metabolites (DAMs) and twenty-two key differentially expressed genes (DEGs) were identified, the latter being found to participate in the regulation of anthocyanin biosynthesis pathways under varying light and temperature conditions. In summary, extended photoperiods primarily increase the content levels of ten metabolites, including cyanidin and naringenin-7-O-glucoside, by upregulating CHS, F3H, and ANS genes. In contrast, low temperatures primarily enhance the synthesis of seven anthocyanins, including cyanidin and cyanidin-3-O-rutinoside, by upregulating the ANS and UFGT genes. (4) Conclusions: Collectively, the differences in the expression levels of CHS, F3H, ANS, and UFGT might be responsible for ‘Ziyan’ tea plants’ purple shoot coloration, providing important data towards the discovery of candidate genes and molecular bases controlling the purple leaves of these tea plants under varied photoperiods and temperatures.

1. Introduction

Tea (Camellia sinensis) is a widely beloved beverage crop; however, the homogeneity among tea varieties has prompted continuous efforts by tea breeders to develop novel and distinctive cultivars. In recent times, purple foliage tea (PFT) has garnered considerable attention [1,2,3,4,5]. These varieties, renowned for their abundant anthocyanin content, present potential health benefits, including antioxidative, anti-inflammatory, lipid-regulating, and antidepressant effects [6,7,8,9,10]. At present, extensive research is dedicated to studying anthocyanins in PFT cultivars [11,12,13]. While traditional green foliage tea (GFT) cultivars typically contain around 0.01% anthocyanins, PFT cultivars can exhibit significantly higher levels, ranging from 0.5% to 1.0%. In particular, the anthocyanin content in the offspring of ‘Ziyan’ tea plants can surpass 4.5% [1], providing valuable insights for distinctive tea-plant varietal breeding and the enrichment of genetic resources.
The biosynthetic pathway of anthocyanins is a branch of flavonoid metabolism and is highly conserved across different species [14]. Genes encoding key enzymes in anthocyanin synthesis have been identified, including phenylalanine ammonia lyase (PAL), cinnamate-4-hydroxylase (C4H), 4-coumaroyl-CoA synthase (4CL), chalcone synthase (CHS), chalcone isomerase (CHI), flavanone-3-hydroxylase (F3H), dihydroflavonol 4-reductase (DFR), anthocyanidin synthase (ANS) or leucoanthocyanidin dioxygenase (LDOX), glucosyl transferases (GTs), and UDP-flavonoid 3-O-glucosyltransferase (UFGT) [15]. The synthesis of anthocyanins can be divided into three stages: the first stage utilizes phenylalanine as a substrate, catalyzed by PAL, C4H, and 4CL as upstream structural genes; the second stage, with cinnamoyl-CoA as a substrate, is catalyzed by the midstream structural genes CHS, CHI, and F3H; and the third stage, using dihydroflavonols as substrates, is catalyzed by the downstream structural genes DFR, ANS/LDOX, and UFGT. Various modifications take place, and the synthesized anthocyanins are transported to plant vacuoles for storage [16,17]. Furthermore, regulatory genes known as transcription factors (TFs) modulate the expression patterns and intensities of structural genes in the anthocyanin biosynthetic pathway by binding to specific sequences upstream of the 5’ end of structural genes. The primary classes of transcription factors involved in this regulation are MYB, bHLH, and WD40, which collectively form the molecular regulatory network of the anthocyanin glycoside synthesis pathway [18].
Various environmental factors impact anthocyanin synthesis and accumulation, including light, temperature, carbon–nitrogen elements, and plant hormones [19,20]. These factors regulate both structural genes and transcription factors in the anthocyanin biosynthetic pathway, thereby influencing the types and levels of anthocyanins synthesized in plants. Moreover, after anthocyanin accumulation, environmental factors affect its stability, with these factors either hastening or slowing down the degradation of anthocyanin glycosides [21]. Among these factors, light and temperature play pivotal roles in influencing anthocyanin metabolism during plant growth. Anthocyanin accumulation is closely linked to photoreceptors and light signal transduction factors [22]. Differences in the intensity of light can regulate the expression of key genes in the early stages of anthocyanin synthesis [23]. For instance, CHI, CHS, and R2R3-MYB transcription factors in roses and tea plants act as positive regulators responsive to light intensity [24,25,26]. In the case of ‘Zijuan’ tea plants, prolonged exposure to light significantly upregulates the expression of the anthocyanin synthesis gene CsLDOX1 [27]. Furthermore, most studies indicate that temperature has a dual effect on anthocyanin accumulation. On one hand, moderate low temperatures can enhance the expression of structural genes such as PAL, CHS, and ANS [28,29], as well as regulatory genes such as MYB [30,31], thereby promoting anthocyanin synthesis. On the other hand, high temperatures affect the stability of anthocyanins, both reducing their synthesis rate and increasing their degradation rate, ultimately leading to a decrease in anthocyanin accumulation [32,33].
However, whether low temperatures and prolonged light exposure have a synergistic effect on anthocyanin accumulation in tea plants and within the molecular mechanisms through which they respond to light and temperature in the anthocyanin biosynthetic pathway remain to be further investigated. To explore these issues, ‘Ziyan’ tea plants underwent varied photoperiod and temperature treatments. Integrated metabolomic and transcriptomic analyses were employed to elucidate the mechanisms governing the anthocyanin response to environmental factors. This study provides insights into the diverse pathways influencing anthocyanin accumulation in tea-plant shoots under different photoperiod and temperature conditions.

2. Materials and Methods

2.1. Plant Materials and Treatments

The study utilized the ‘Ziyan’ tea plant variety, known for its year-round purple color in its new shoots, leaves, and stems. Two-year-old ‘Ziyan’ tea plants were grown in pots (45 cm × 30 cm × 25 cm), with there being around 20 plants per pot. After topping and pruning, eight pots were exposed to four different photoperiod and temperature conditions: high temperature × long day-length (28 °C, 16 h), high temperature × short day-length (28 °C, 8 h), low temperature × long day-length (18 °C, 16 h), and low temperature × short day-length (18 °C, 16 h). The samples were maintained in growth chambers with 80% humidity and a light intensity of 30,000 lx.
When new shoots reached the one bud and two leaves (1B2L) stage, they were collected, rapidly frozen in liquid nitrogen, and then stored at −80 °C for further analysis. Each treatment consisted of three biological replicates.

2.2. Determination of Total Anthocyanin Content

Total anthocyanin content was determined using the pH differential method [11]. Briefly, 0.5 g of 1B2L per treatment was ground in liquid nitrogen and mixed with 4 mL of 1% HCl-MeOH solution at 4 °C for 2 h. After centrifugation, the supernatant was collected, and the process was repeated twice. The combined supernatants were filtered and analyzed for absorbance at 524 nm and 700 nm using a spectrophotometer (UV-1900i, Shimadzu, Japan).

2.3. Metabolome Analysis

Fresh leaves were freeze-dried using a vacuum freeze-dryer (Scientz-100F, Ningbo, China) and ground into a 50 mg dried powder through use of a ball mill (MM 400, Retsch, Haan, Germany). The powder was mixed with 500 μL of 50% methanol, vortexed, sonicated, and centrifuged. The supernatant, obtained through two repetitions, was stored for LC-MS/MS analysis. Targeted metabolomic analysis of anthocyanins involved qualitative and quantitative assessments post UPLC-MS/MS sample quality control, log2 transformation, and normalization. R software 4.3.0 was used to conduct hierarchical clustering analysis (HCA), principal component analysis (PCA), and orthogonal partial least-squares discriminant analysis (OPLS-DA) for the determination of specific metabolite accumulation. Significance (p < 0.05) and a fold change threshold of 2.0 identified differentially accumulated metabolites, which were subsequently visualized through Venn diagrams.

2.4. RNA Extraction and Transcriptome Sequencing

Total RNA was extracted from fresh leaves using TRIzol reagent (Invitrogen, San Diego, CA, USA). Purified mRNA underwent two rounds of polyadenylated selection and was fragmented at 94 °C for 5–7 min. Then, cDNA synthesis, double-stranded synthesis, and library preparation with an average fragment size of 300 bp were performed using an NEBNext kit (NEB, Ipswich, MA, USA). Sequencing was carried out on the Illumina Novaseq™ 6000 (Illumina, San Diego, CA, USA) platform in PE150 mode.

2.5. Quality Assessment and Differentially Expressed Genes’ Identification

Raw ‘fastq’ data underwent ‘cutadapt-1.9’ processing for adapter removal, resulting in ‘CleanData’. After alignment to the ‘Tieguanyin’ tea plant genome [34] with HISAT2 2.1.0, StringTie 2.1.5 software was used to perform the initial gene assembly. Merged results were obtained using gffcompare, and FPKM values were quantified with ballgown. Differential analysis was carried out through use of edgeR or DESeq2, with genes with FC > 2 or FC < 0.5 and p-value < 0.05 being considered as differentially expressed. Enrichment analyses focused on GO and KEGG pathways, emphasizing genes enriched in anthocyanin and flavonoid biosynthesis pathways as candidate DEGs.

2.6. Quantitative Real-Time PCR Analysis

Quantitative real-time PCR (qPCR) was performed using the CFX96 system (Bio-Rad, Hercules, CA, USA). The 25 μL reaction included SYBR® Premix Ex TaqTM II (2×) 12.5 μL, 1 μL of each of the upstream and downstream primers (10 μM each), 2 μL of cDNA, and 8.5 μL sterile ddH2O. Three replicate wells were used for each sample, with ‘no cDNA’ as a control. The reaction program included 40 cycles, with initial denaturation at 95 °C for 3 min, denaturation at 95 °C for 10 s, annealing at 55 °C for 30 s, and extension at 72 °C for 15 s. Fluorescence signals were collected, and a melting curve was generated. GAPDH served as the internal reference gene, and 2ΔΔCq calculated the relative expression levels of DEGs. Primer details are provided in Table S1.

2.7. Data Analysis

The experiment utilized a 2 × 2 factorial design, and two-way ANOVA was employed for significance analysis. GraphPad Prism v9.3.1 (GraphPad Software Inc., La Jolla, CA, USA) was used for variance analysis and graph plotting.

3. Results

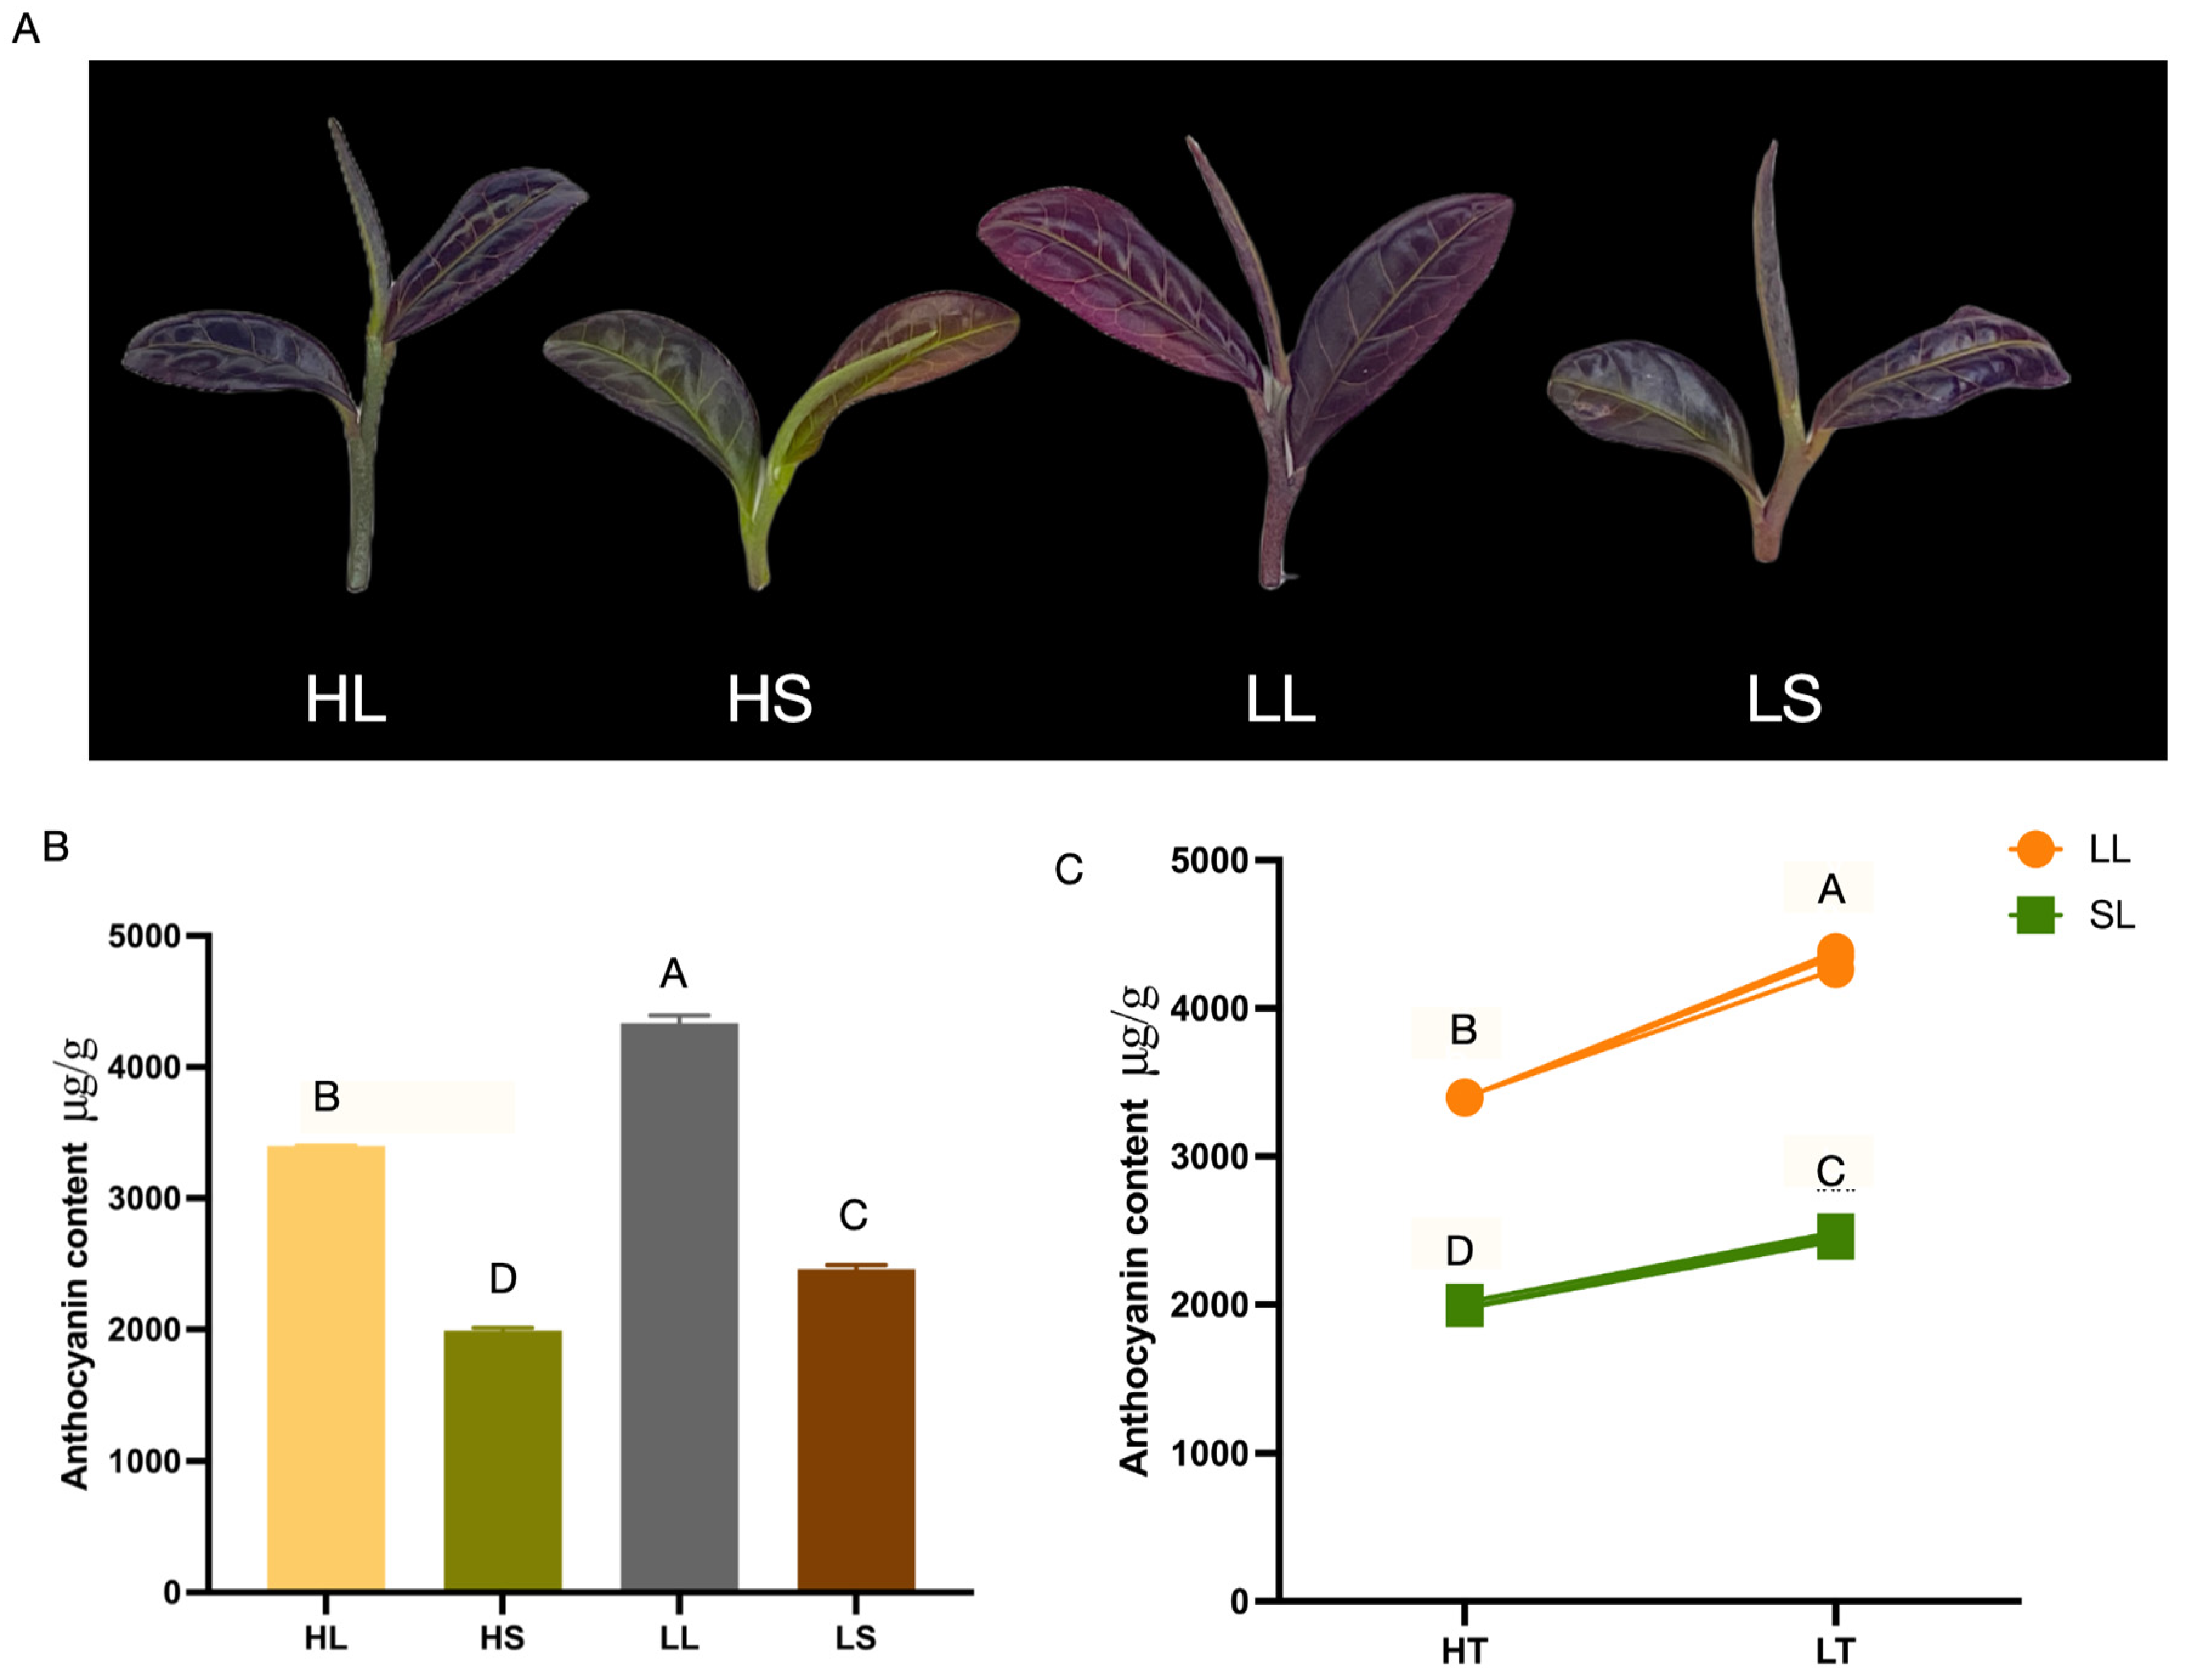
3.1. Low Temperatures and Extended Photoperiods Enhance the Total Anthocyanin Content of ‘Ziyan’ New Shoots

After exposing ‘Ziyan’ tea plants to controlled environments with a high temperature and long photoperiod (HL), a high temperature and a short photoperiod (HS), a low temperature and a long photoperiod (LL), and a low temperature and a short photoperiod (LS), noticeable color variations appeared in the new shoots of 1B2L (Figure 1A). Quantifying the total anthocyanin content in the new shoots of 1B2L revealed significant differences among the treatments (p < 0.001), with averages of 3396.7 μg/g (HL), 1990.3 μg/g (HS), 4332.02 μg/g (LL), and 2460.16 μg/g (LS) (Figure 1B). LL > HL and LS > HS indicate that lower temperatures enhance anthocyanin accumulation, while HL > HS and LL > LS suggest that longer photoperiods promote accumulation. Notably, the LL group exhibited the highest anthocyanin content, suggesting a potential synergistic effect. Figure 1C illustrates that the effects of temperature and photoperiod on anthocyanin accumulation differ at different levels of the corresponding factor, indicating an interaction effect. Temperature and photoperiod thus interact in influencing anthocyanin accumulation in new shoots.

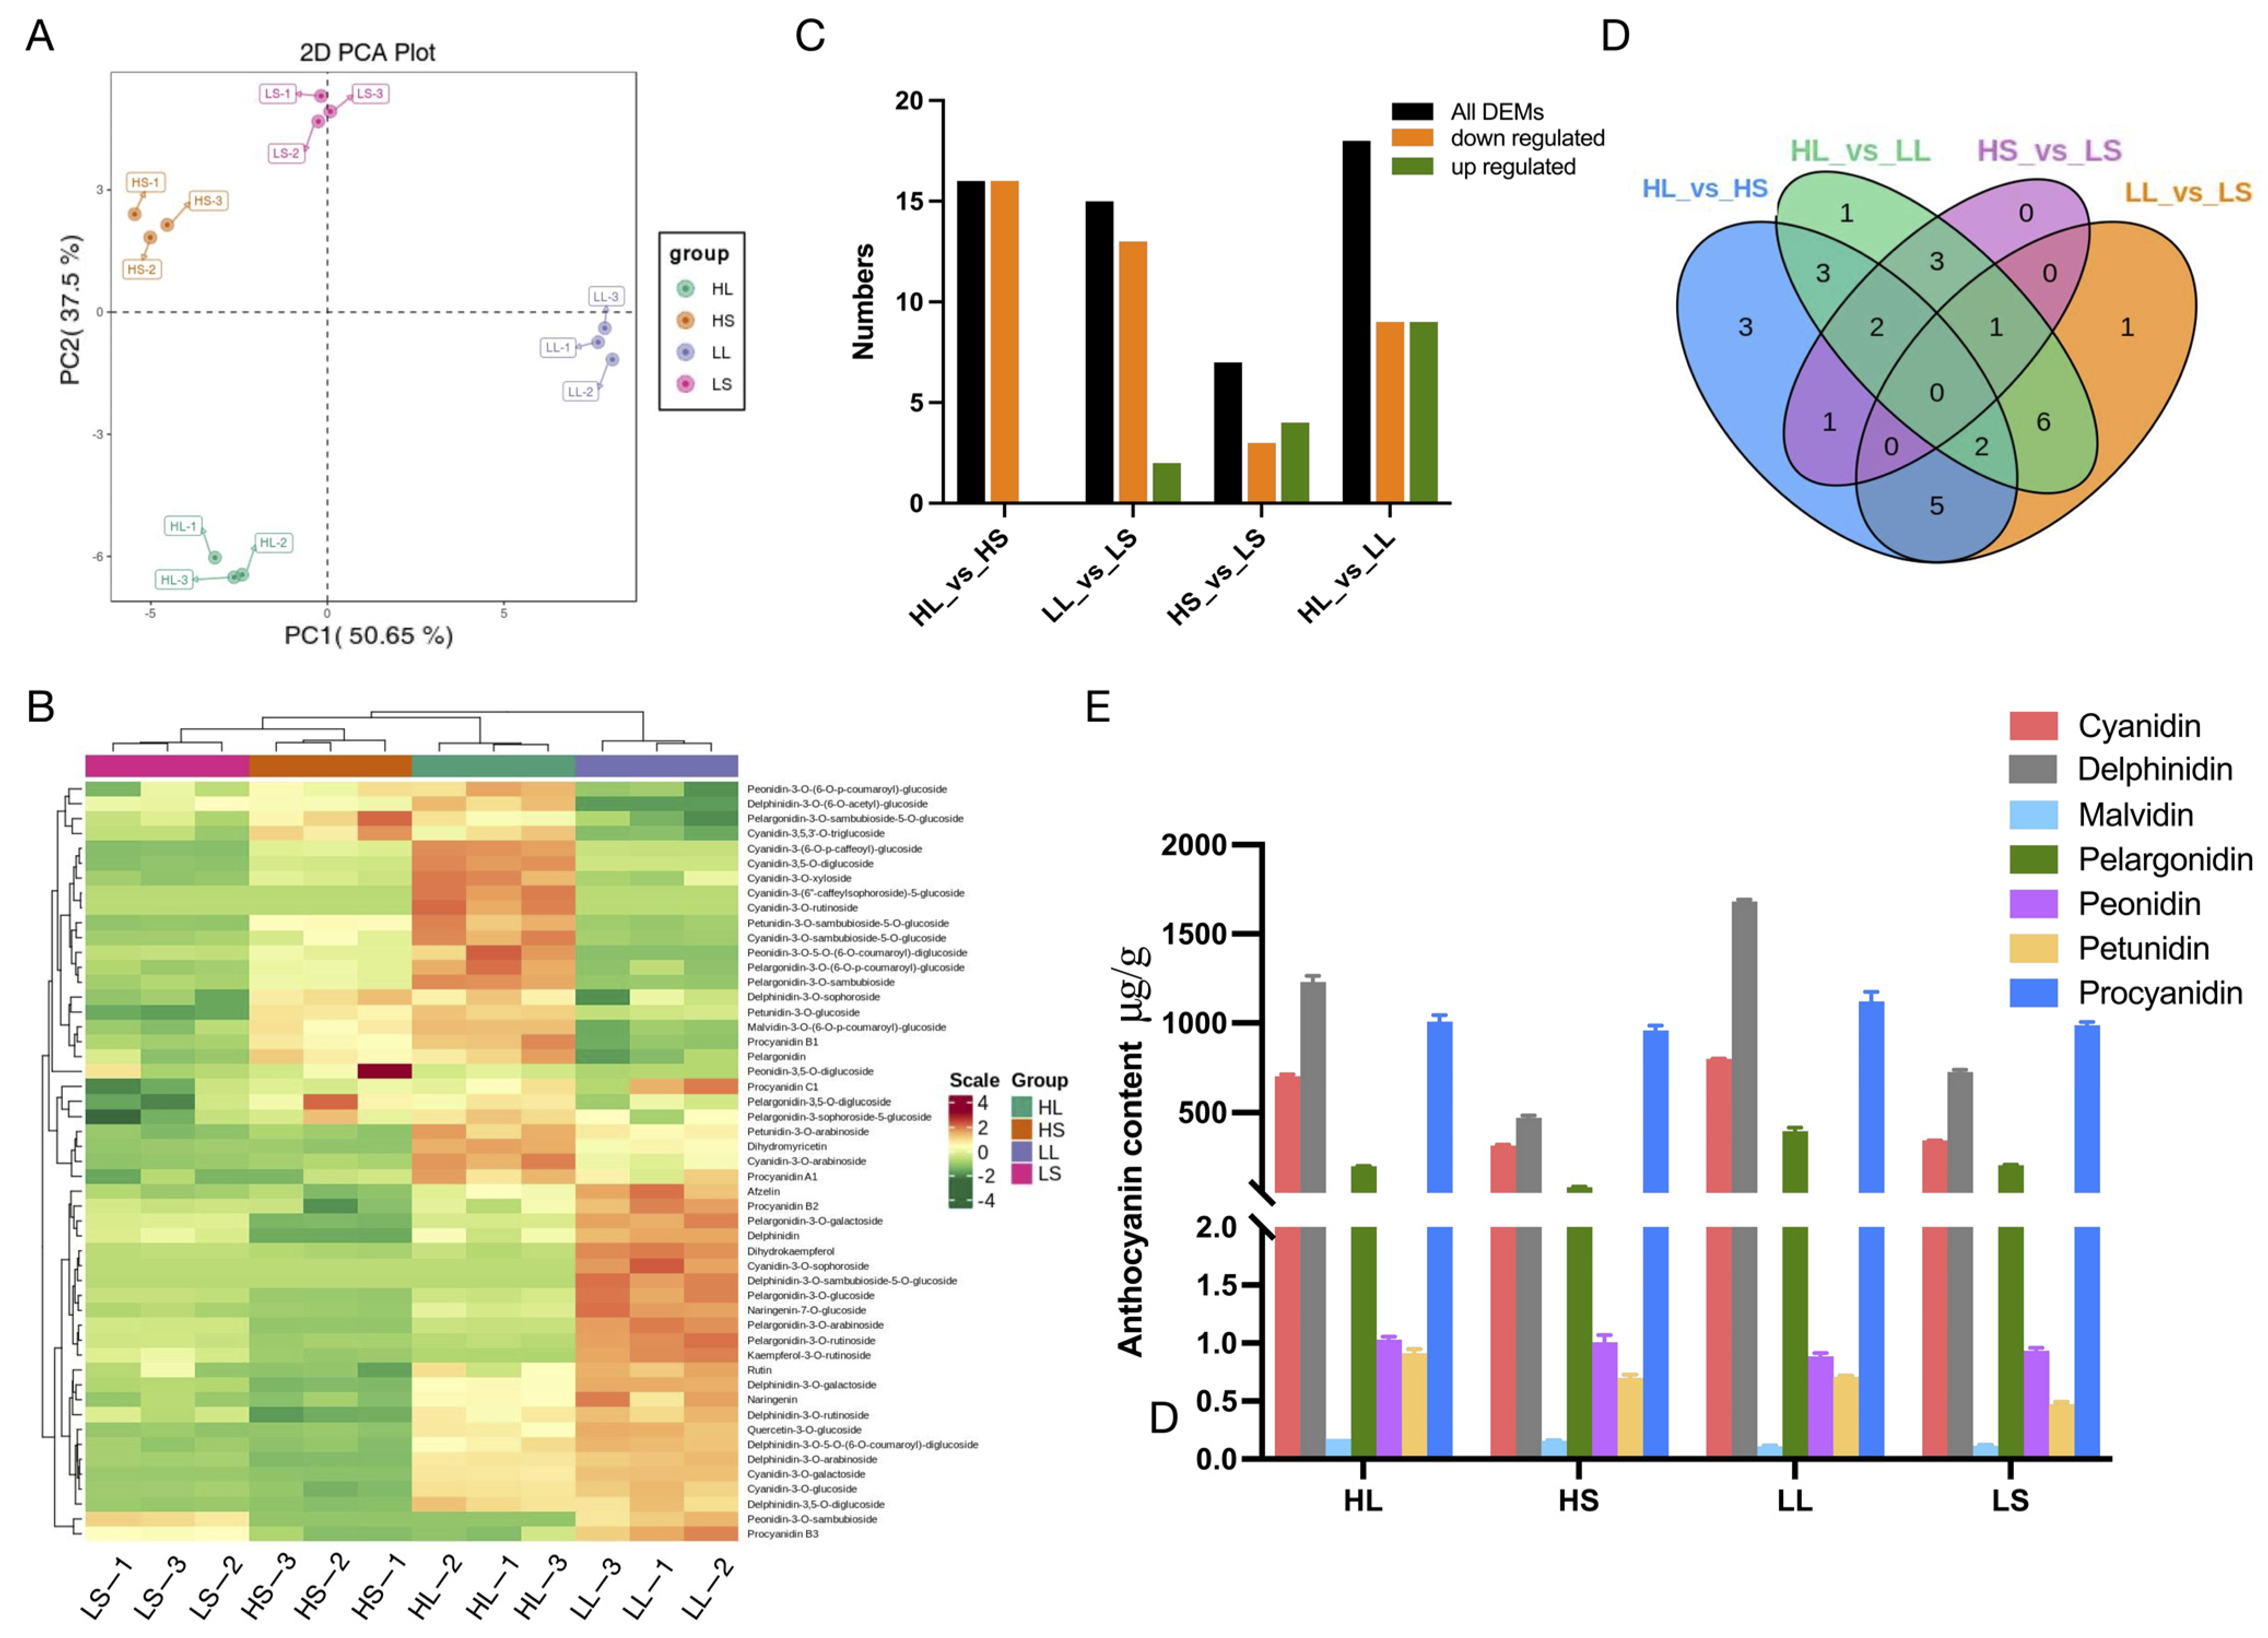
3.2. Anthocyanin Metabolites Analysis of ‘Ziyan’ New Shoots after Treatments with Different Photoperiods and Temperatures

The results of the metabolomic analysis indicate that, out of the 108 standards for anthocyanins, proanthocyanidins, and flavonoids, 51 compounds were detected. Furthermore, the principal component analysis (PCA) revealed that PC1 and PC2 are responsible for 50.65% and 37.5% of the sample variance, respectively (Figure 2A). Significant differences in metabolites in the ‘Ziyan’ shoots were observed after distinct photoperiod and temperature treatments (Figure 2B). Comparative statistical analysis of DAMs revealed 16 downregulated DAMs in the HL vs. HS group and 13 out of 15 DAMs downregulated in the LL vs. LS group, with both results indicating a light-dependent positive correlation with anthocyanin metabolite synthesis. We calculated the average number of upward and downward adjustments in the remaining two DAM groups (Figure 2C), and the results suggested both positive and negative regulation of anthocyanin accumulation under low-temperature conditions. Interestingly, the number of unique DAMs among the comparative groups ranged from zero to three, with no common DAMs shared across all four comparative groups (Figure 2D).
Total anthocyanin content, covering various types, was quantified and is presented in Figure 2E. Aside from the proanthocyanidin, in ‘Ziyan’ shoots across all treatments, the ranking of different anthocyanin types remained consistent: delphinidin > cyanidin > pelargonidin > peonidin > petunidin > malvidin. Under low-temperature conditions, cyanidin, delphinidin, and pelargonidin levels increased, with peonidin being particularly enhanced, especially under both long and short photoperiods, within which pelargonidin levels doubled, compared to the high-temperature treatment. Moreover, under long photoperiods, cyanidin, delphinidin, pelargonidin, and malvidin levels surpassed those under short photoperiods, with delphinidin levels increasing two to three times more than in the short photoperiods. Proanthocyanidin, positioned in the middle of the flavonoid biosynthetic pathway, showed a lower concentration than delphinidin under HL and LL conditions, while the results for HS and LS conditions demonstrated the opposite trend. This indicates that prolonged light exposure facilitates the conversion of proanthocyanidin into various anthocyanin types, with stable, colorless proanthocyanidin accumulating more readily under short photoperiods.

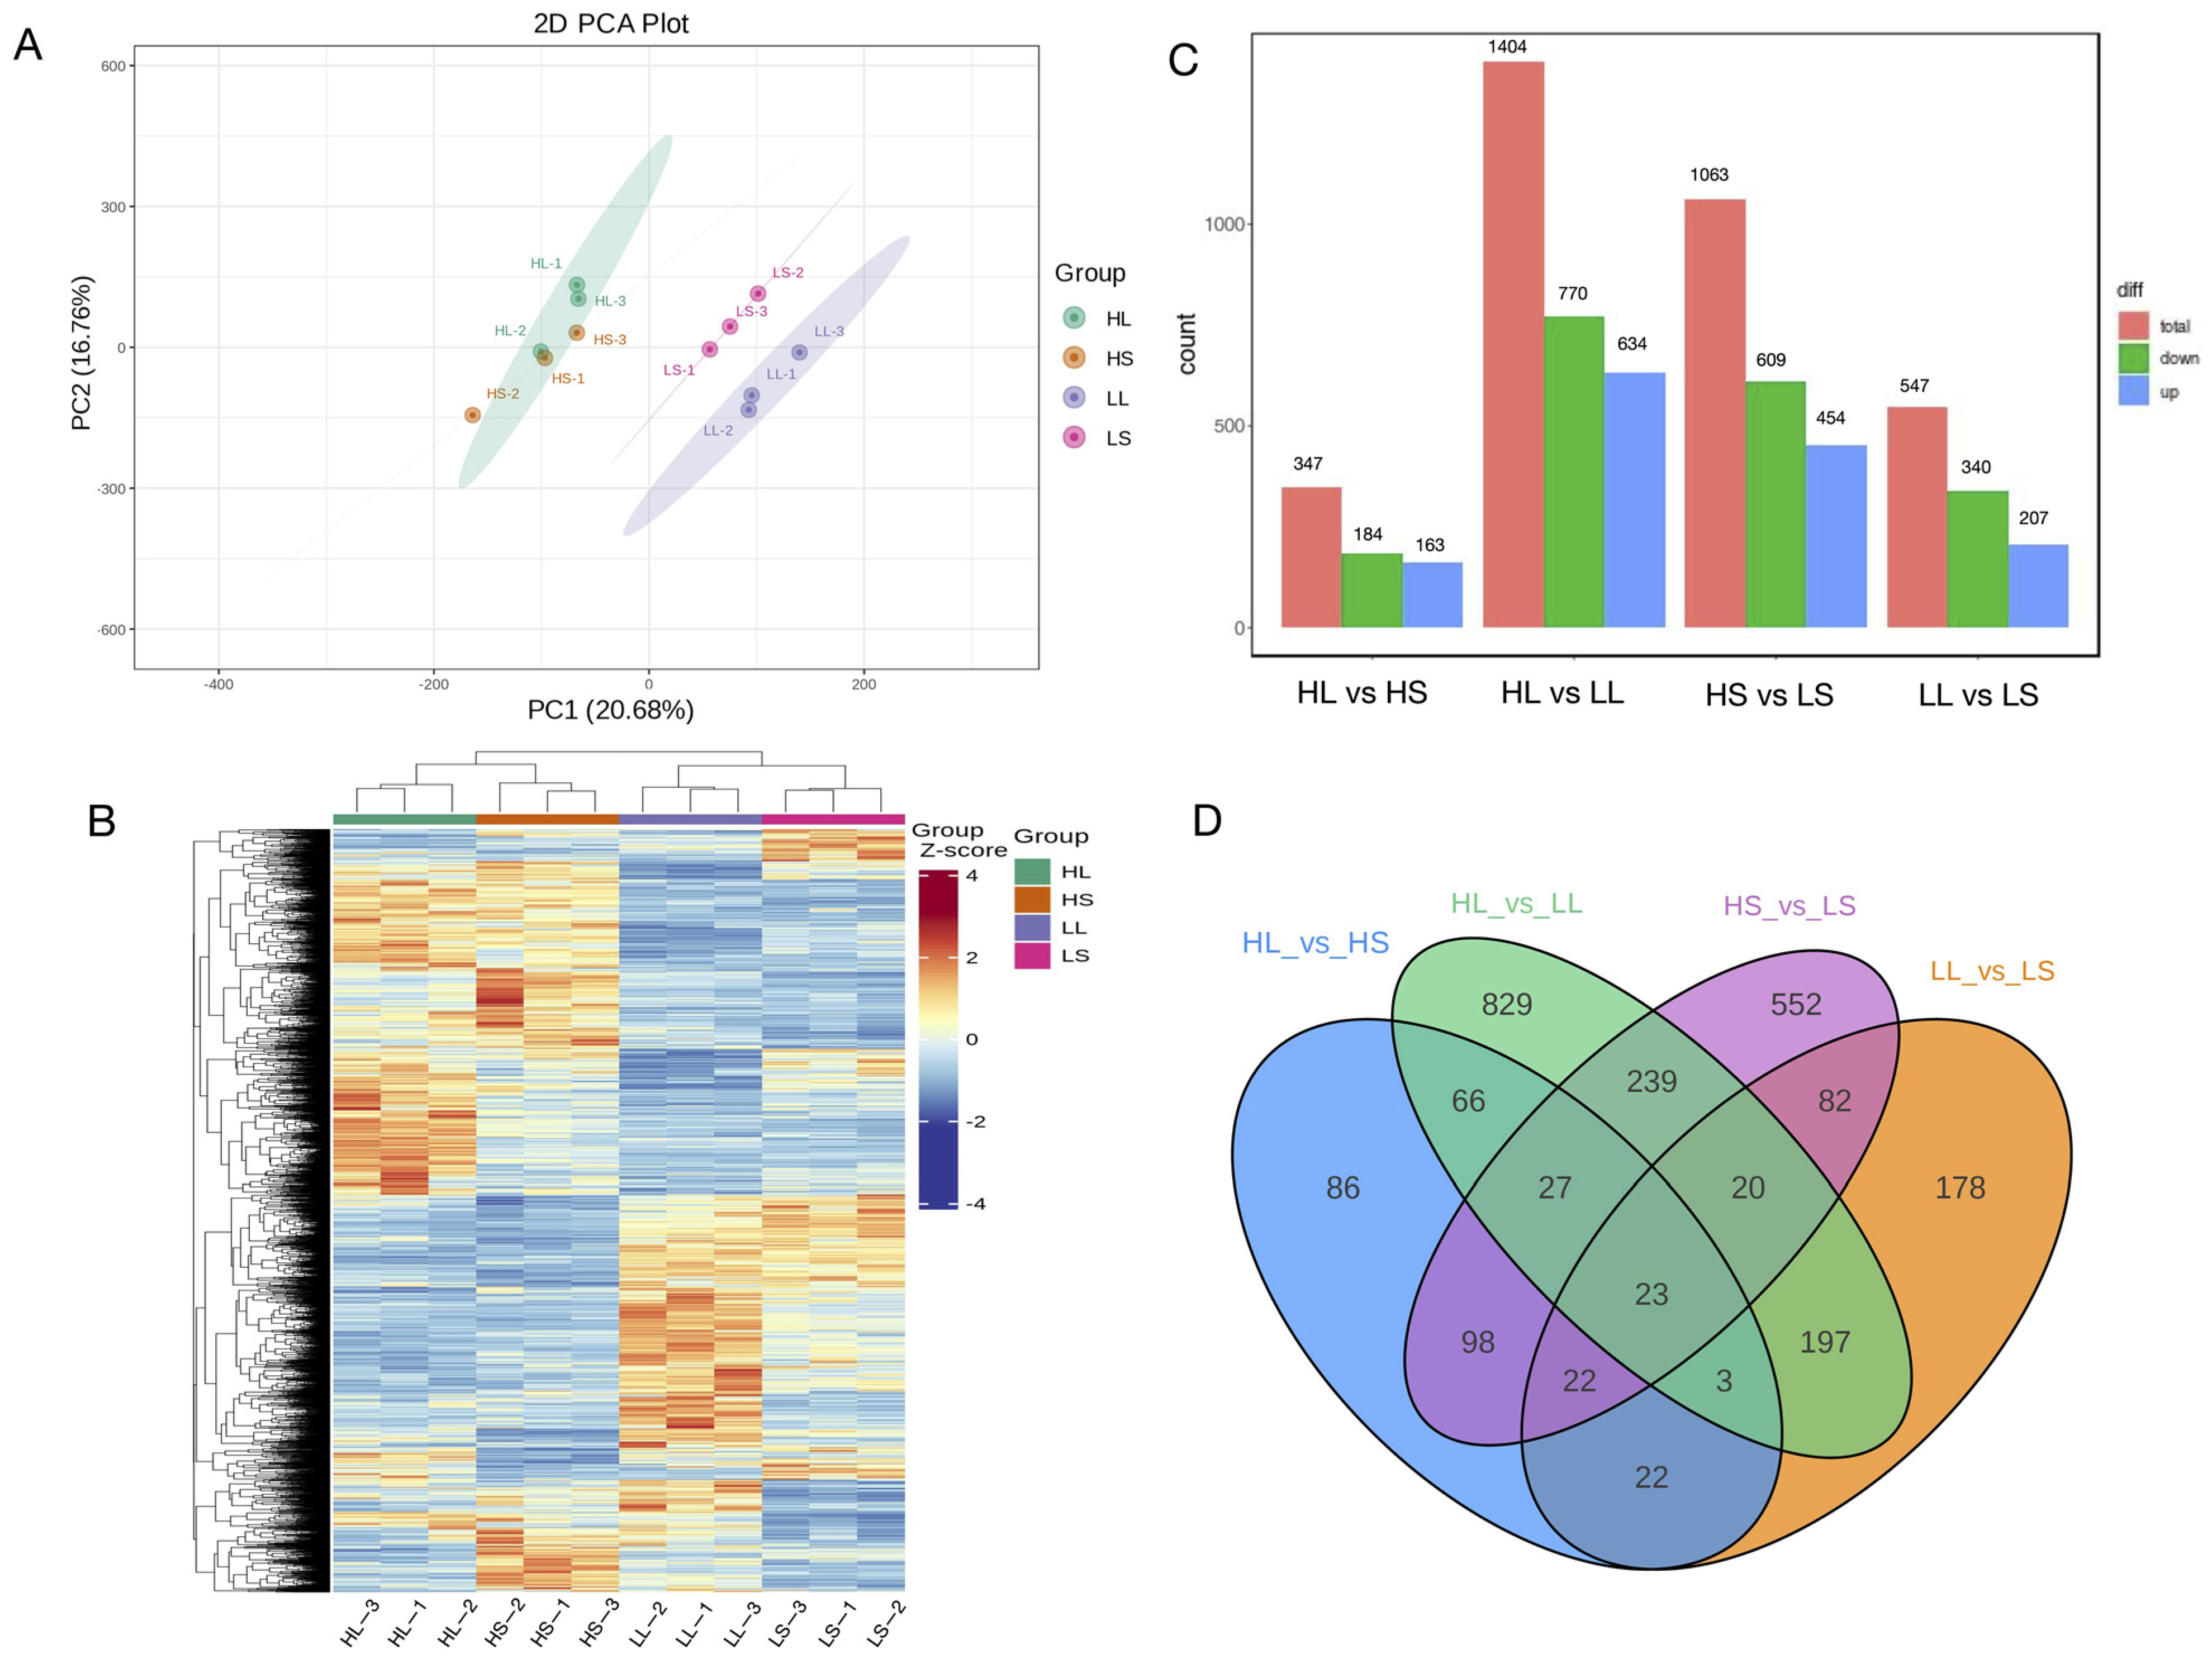
3.3. Differential Gene Expression Analysis under Different Photoperiod and Temperature Treatments

From the transcriptome sequencing data, as shown in Table 1, from 12 samples, we obtained a total of 540,894,802 clean reads (81.13 Gb). Each sample yielded an average of 45,074,567 clean reads (6.76 Gb). Quality metrics showed a Q30 above 89.87%, with it reaching up to 91.56%, and the GC content averaged 43.30%. HISAT2 alignment to the ‘Tieguanyin’ reference genome resulted in an efficiency range of 85.85% to 87.78%, with 80.94% to 82.66% of reads uniquely aligned, indicating reliable sequencing quality. Moreover, the principal component analysis and heatmap outcomes revealed that PC1 and PC2 are responsible for 20.68% and 16.76% of the sample variation, respectively, indicating differences among the four samples (Figure 3A,B). Figure 3A–C collectively show that compared to differences induced by various photoperiods, variations in temperatures result in a greater number of DEGs with more pronounced distinctions. Additionally, samples subjected to the same temperature but different light durations tend to cluster together. When analyzing the differential genes between the treatments, HL vs. HS exhibited the fewest DEGs, at 347 (184 upregulated and 163 downregulated), while HL vs. LL exhibited the highest number, with 1404 DEGs (770 upregulated and 634 downregulated). Unique DEGs included 86 for HL vs. HS, 829 for HL vs. LL, 552 for HS vs. LS, and 178 for LL vs. LS (Figure 3D). These findings collectively signify a more substantial impact of temperature variations on the differential regulation of the anthocyanin biosynthesis pathway in new shoots of ‘Ziyan’.

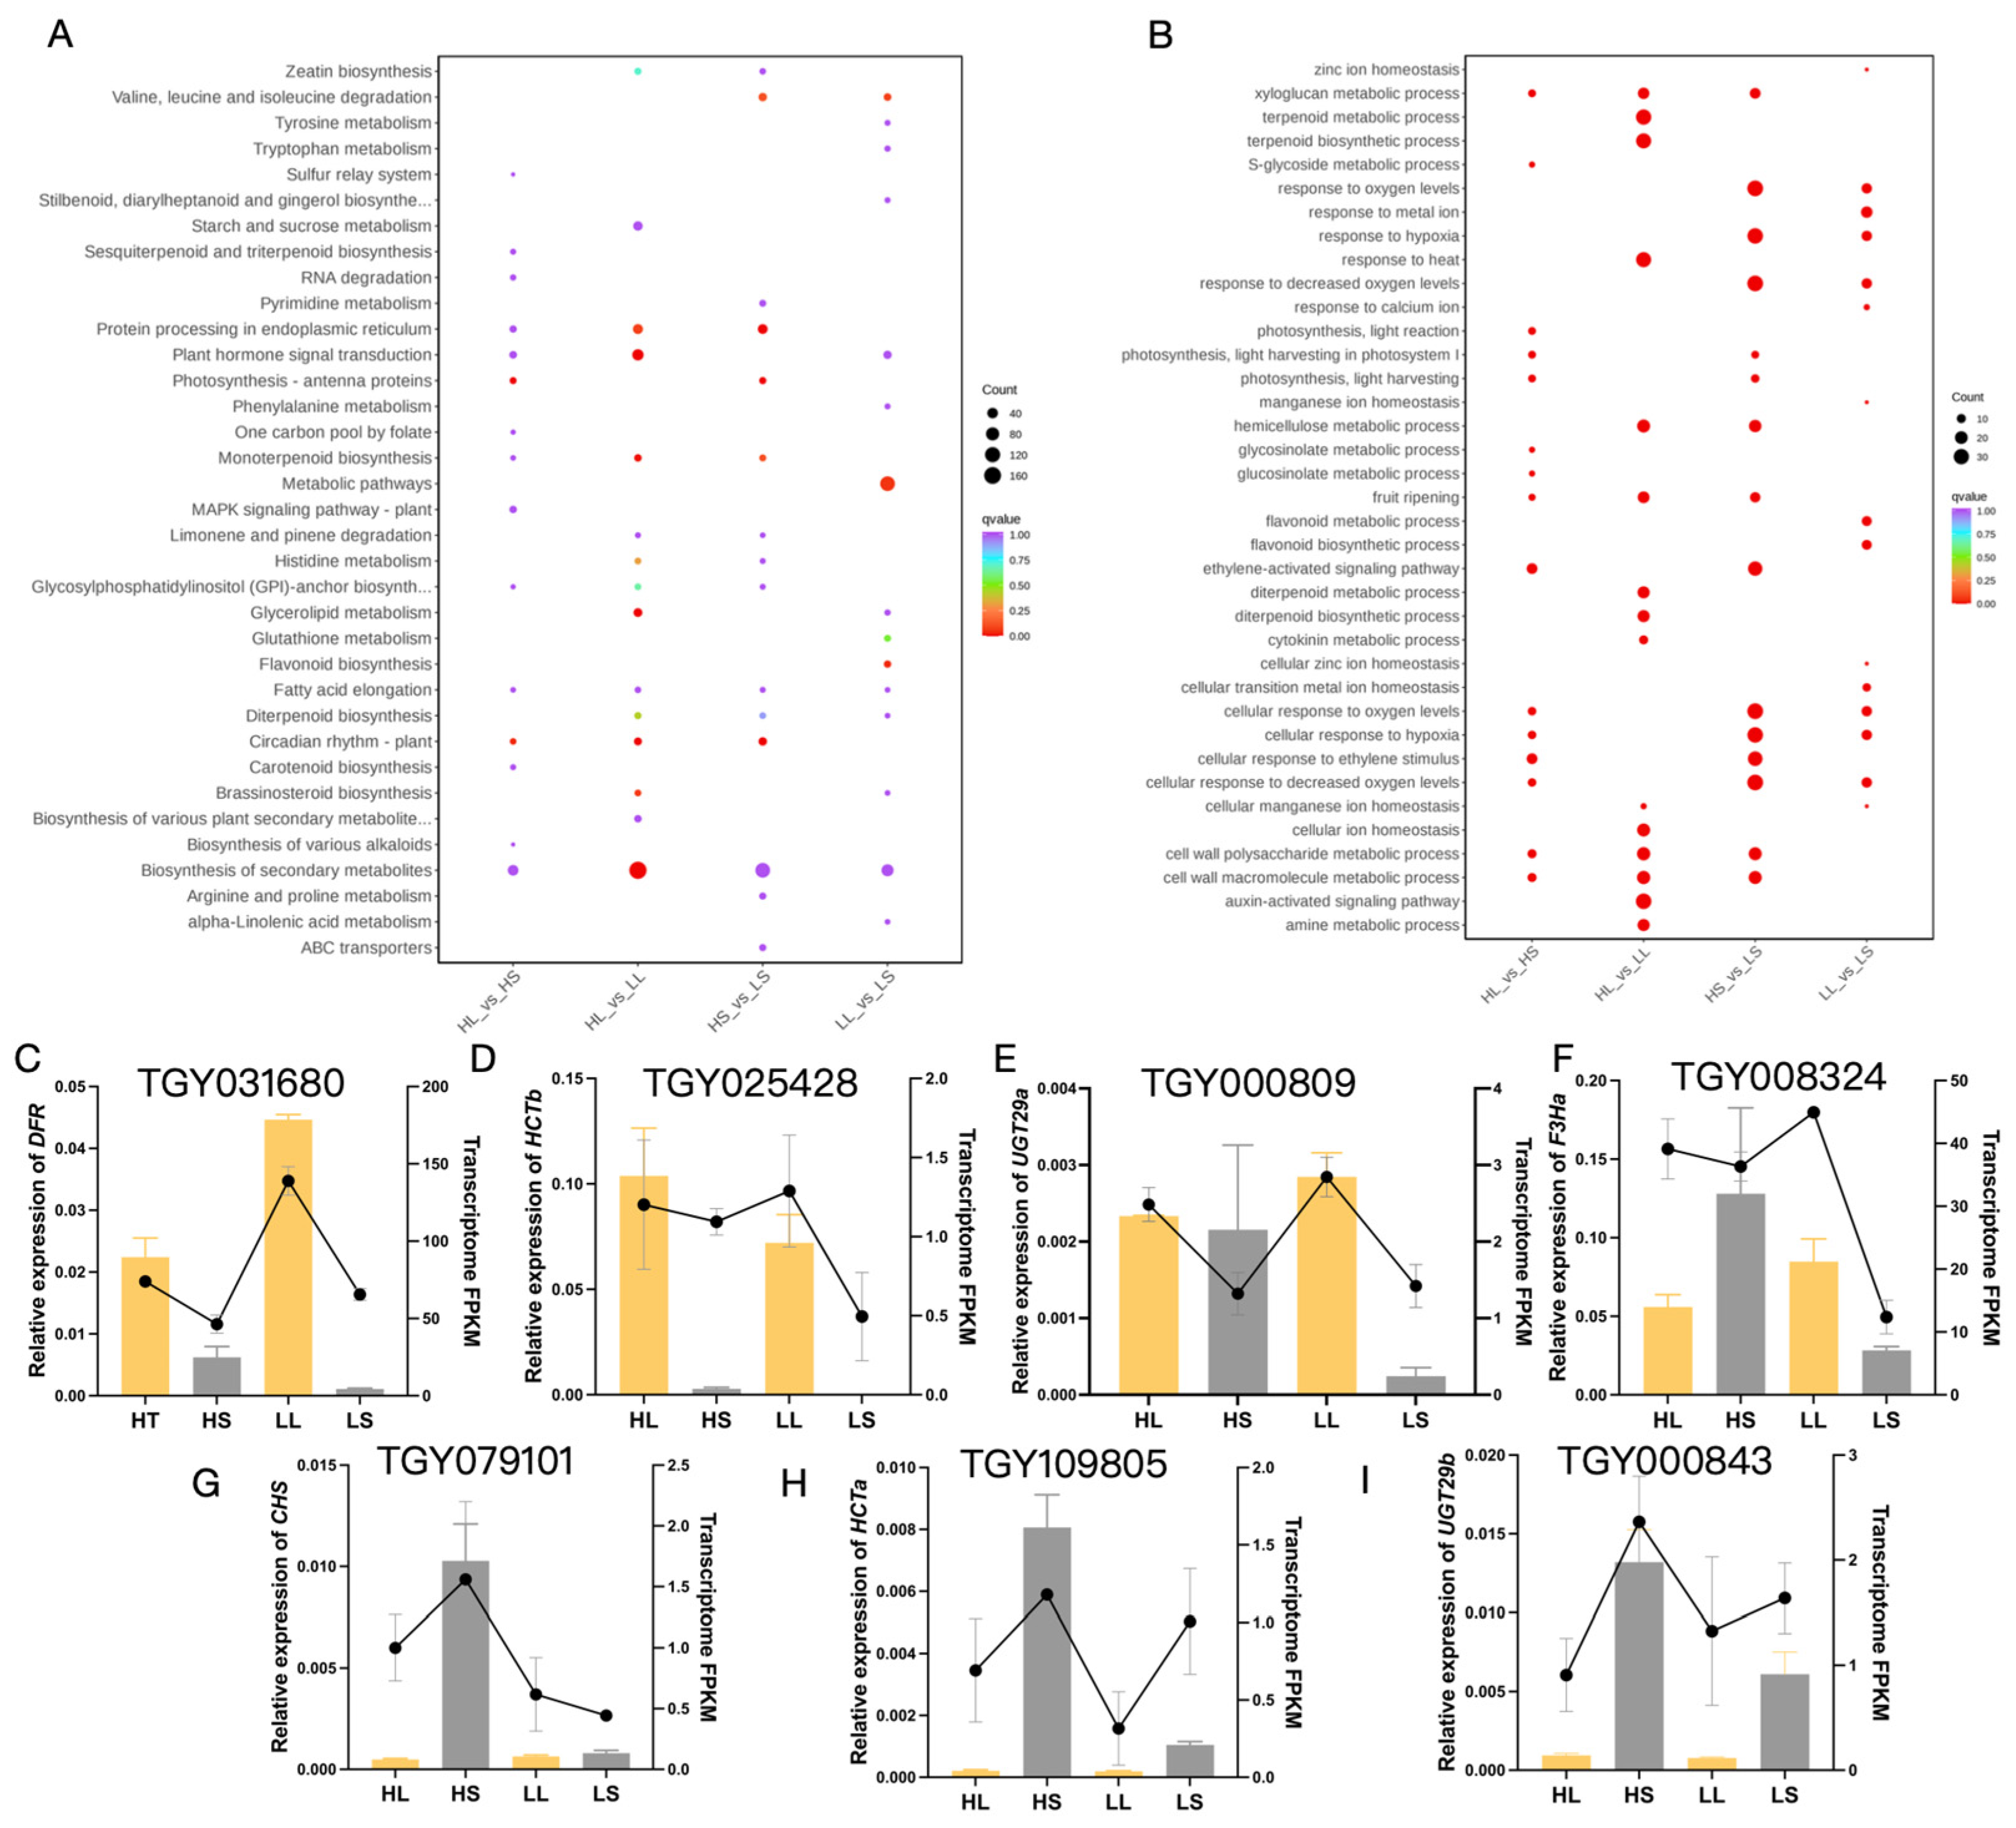
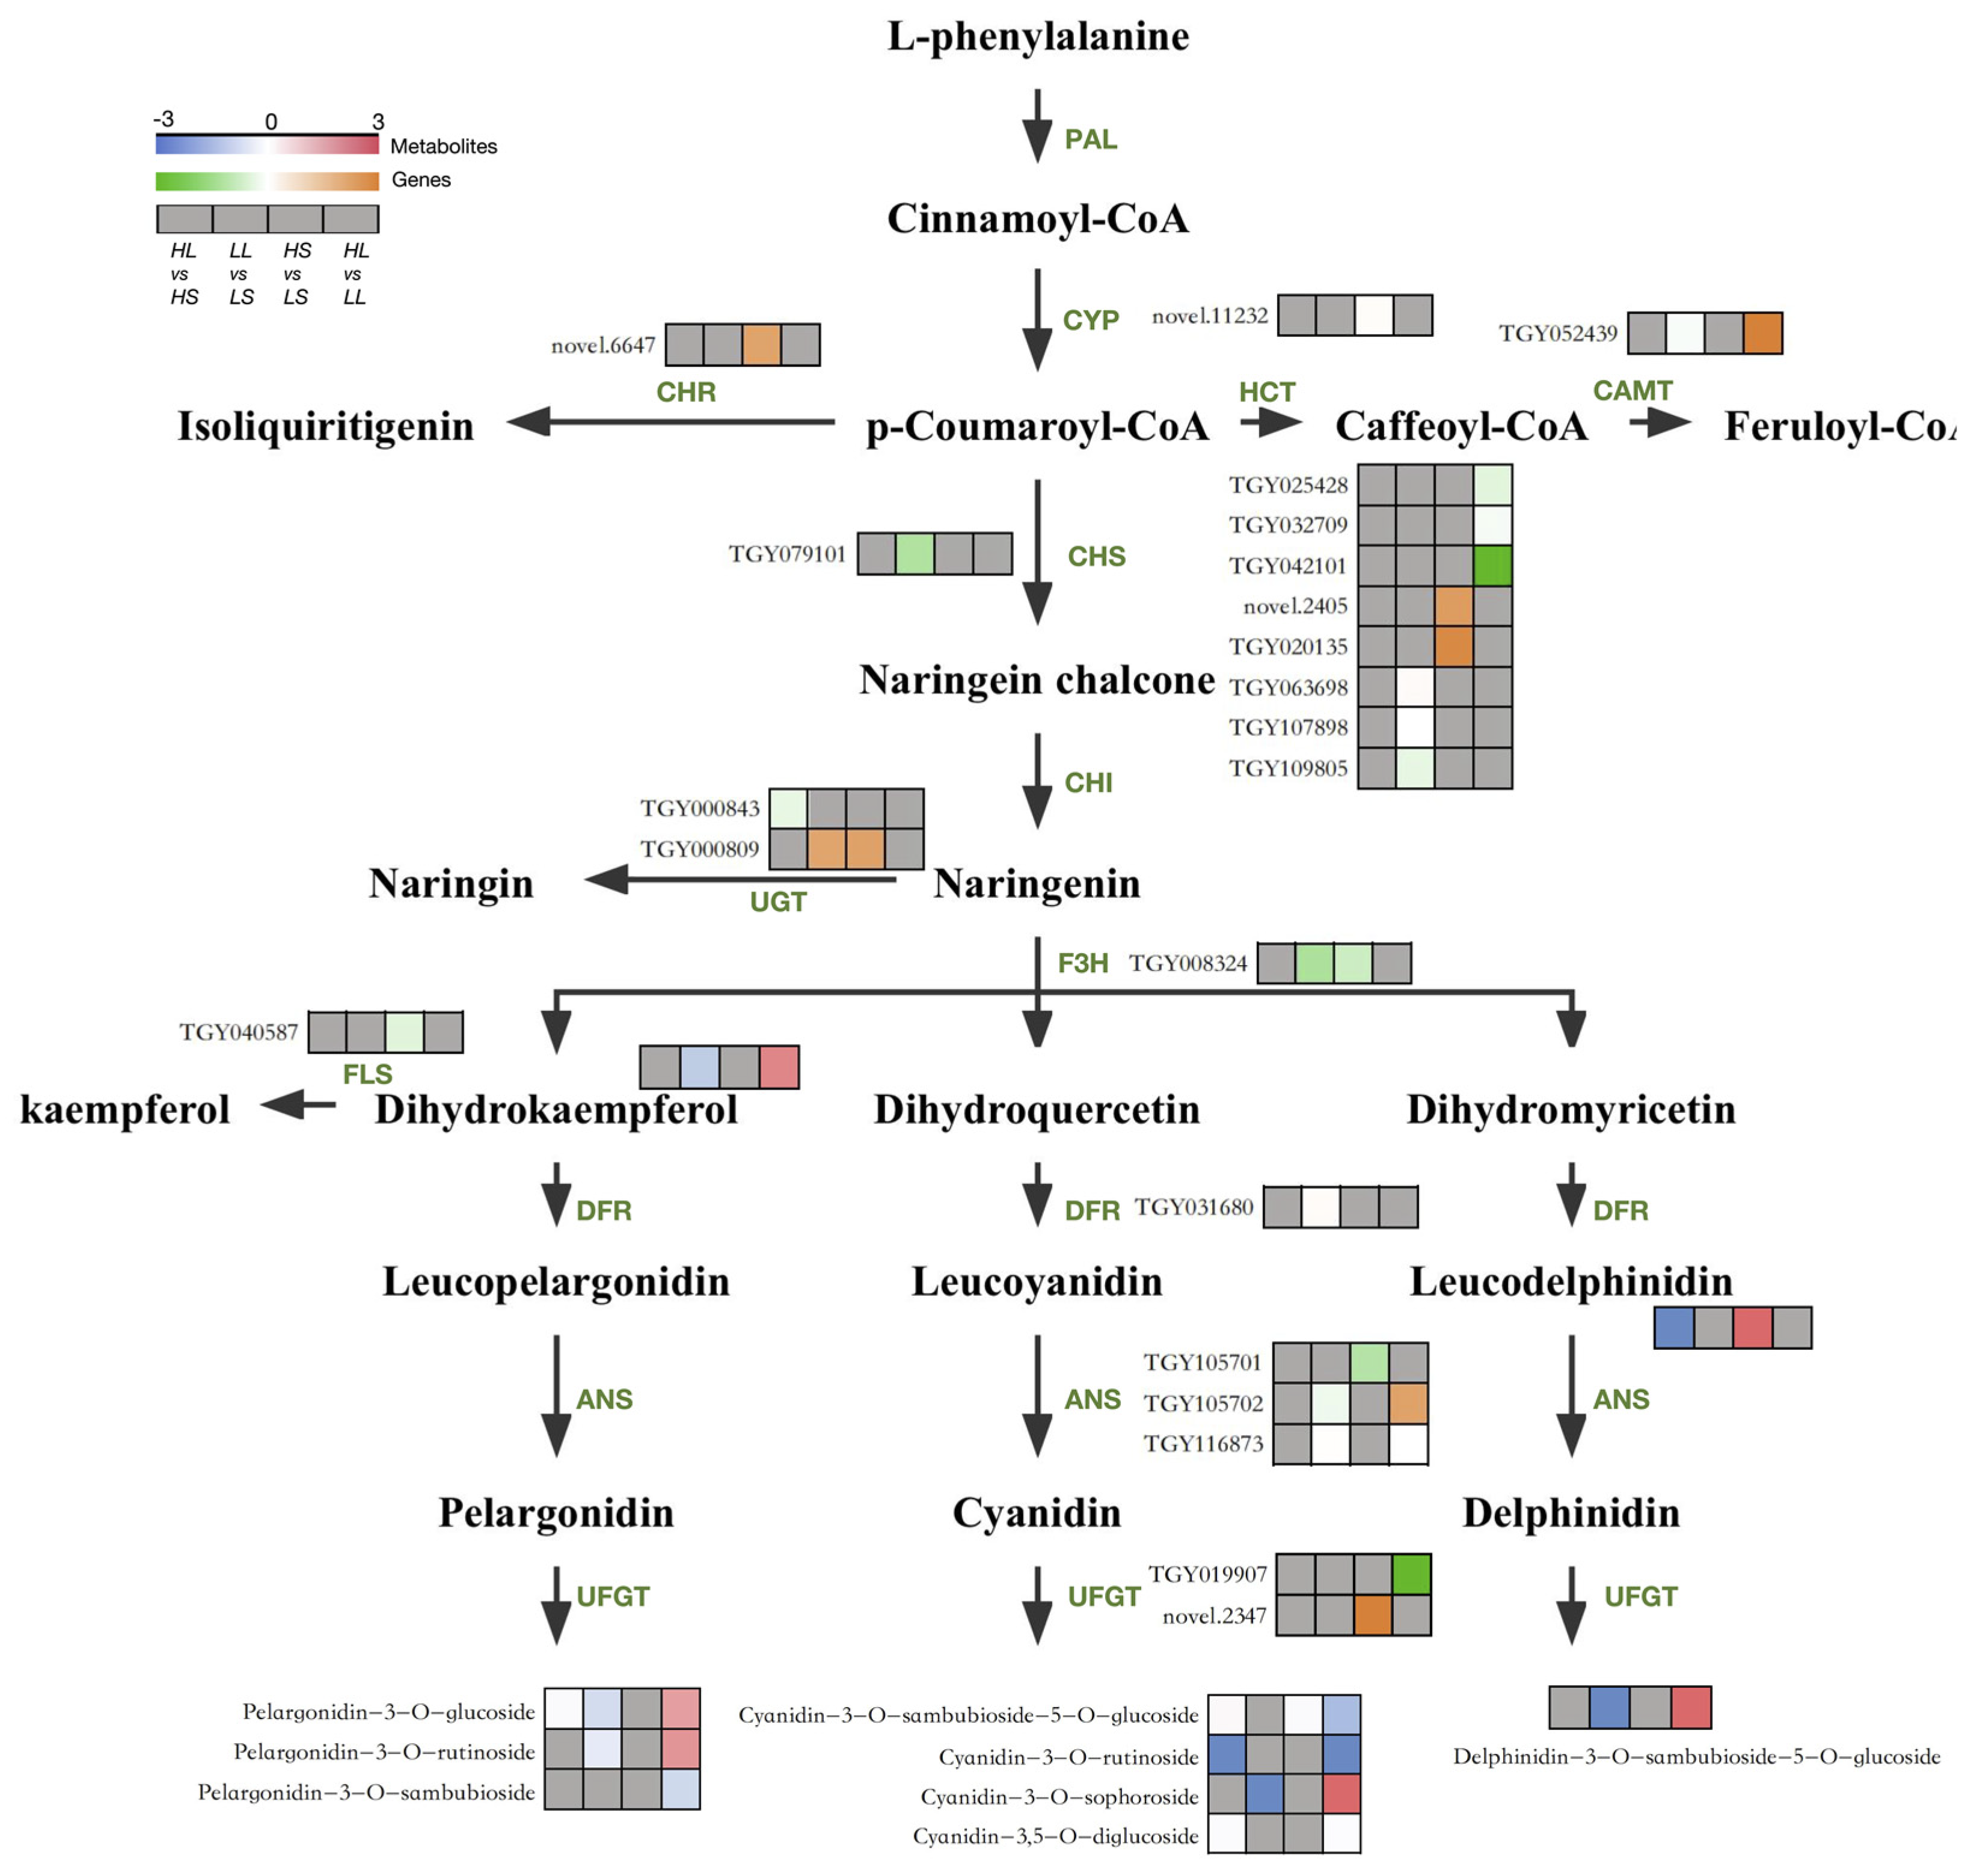
3.4. Analysis of DEGs Associated with the Anthocyanin Biosynthesis Pathway

To comprehend the functional implications of the DEGs, we annotated them to the Kyoto Encyclopedia of Genes and Genomes (KEGG) and Gene Ontology (GO) databases (Figure 4A,B). Enrichments were observed in KEGG pathways related to the ‘Biosynthesis and Metabolism of Secondary Metabolites’, ‘Plant Hormone Signal Transduction’, and ‘Plant Circadian Rhythms’ across all four comparison groups. GO analysis highlighted pathways such as ‘Terpenoid Biosynthetic Process’ and ‘Temperature Response.’ Specifically, focusing on genes associated with anthocyanin and flavonoid biosynthesis pathways (Table 2), we identified that low-temperature and extended photoperiod conditions upregulate key genes, including Anthocyanin Synthase (ANS), Dihydroflavonol 4-Reductase (DFR), Chalcone Synthase 3 (CHS), Caffeoyl-CoA-O-Methyltransferase (CCoAOMT), Anthocyanidin 3-O-Glucosyltransferase (UFGT), and Flavonoid 6-Hydroxylase (F6H), as well as some Shikimate Hydroxycinnamoyltransferase (HCT) genes. Validation through qRT-PCR analysis of seven randomly selected DEGs confirmed consistency with the transcriptomic data (Figure 4C–I).

3.5. Response of Anthocyanin Biosynthesis Metabolism in ‘Ziyan’ to Light and Temperature

To further elucidate the mechanisms underlying the response of the anthocyanin accumulation in ‘Ziyan’ new shoots to low temperatures and long photoperiods, we identified 5 DAMs and 22 DEGs involved in flavonoid and anthocyanin biosynthesis through use of a metabolic pathway heatmap (Figure 5). In the upstream flavonoid pathway, varying photoperiod and temperature conditions resulted in differential expression of CYP, CHR, CCoAOMT, HCT, CHS, UGT, and F3H genes, with low temperatures and extended photoperiods leading to increases in Dihydrokaempferol content. In the downstream anthocyanin biosynthesis pathway, specifically regulated by DFR, ANS, and UFGT genes, differences in the content of leucodelphinidin and pelargonidin, cyanidin, and delphinidin glycosides were observed.
In summary, extended photoperiods primarily upregulate CHS, F3H, and ANS genes, resulting in increased levels of 10 anthocyanin metabolites such as Cyanidin-3-O-sambubioside-5-O-glucoside, Cyanidin-3-O-rutinoside, and Pelargonidin-3-O-glucoside. On the other hand, low temperatures predominantly upregulate ANS and UFGT genes, promoting the synthesis of six anthocyanins, including Cyanidin-3-O-sophoroside, Delphinidin-3-O-sambubioside-5-O-glucoside, and Pelargonidin-3-O-rutinoside.

4. Discussion

Environmental factors, including light and temperature, have been investigated to determine their influence on plant anthocyanin synthesis. This study involved cultivating ‘Ziyan’ tea plants under varied temperature and photoperiod conditions, with subsequent assessment of their transcriptomic and metabolic profiles. The study’s results indicated that both low temperature and an extended photoperiod facilitated anthocyanin accumulation in new shoots of ‘Ziyan’, aligning with findings from prior studies by Li [25] and Sun [27]. Notably, a synergistic and interactive impact of a low temperature and an extended photoperiod on anthocyanin accumulation was discovered.
When exposed to both low temperature and an extended photoperiod, the upregulation of CHS, F3H, DFR, and ANS genes facilitated the synthesis of four anthocyanins in ‘Ziyan’: Cyanidin-3-O-sophoroside, Delphinidin-3-O-sambubioside-5-O-glucoside, Pelargonidin-3-O-glucoside, and Pelargonidin-3-O-rutinoside. Additionally, under high-temperature conditions and with an extended photoperiod, the synthesis of three of the anthocyanins, with the exclusion of pelargonidin-3-O-glucoside, was further promoted. However, at low temperatures, the downregulation of ANS and UFGT genes led to a decrease in certain anthocyanin levels, indicating that low temperatures and an extended photoperiod do not consistently positively regulate anthocyanin content or promote the synthesis of all types of anthocyanins. In a study by Shen [33], ‘Shuchazao’ tea plants subjected to a moderate low temperature (ML) and to severe low temperature (SL) stress, as well as a moderate high temperature (MH) and severe high temperature (SH) stress, showed inhibited flavonoid and anthocyanin metabolism under SH treatment for 8 days. Most structural genes were downregulated, and C4H, F3H/N3DO, LAR, and ANS were downregulated after 4 days of SH stress, which was also associated with a decrease in UGT75C1 expression. Under low-temperature conditions, genes involved in flavonoid and anthocyanin metabolism were also suppressed, in particular, along with observed upregulation in the expression of 4CL, FLS, and UGT75C1 after 8 days of SL stress. Consistently, in this study, UFGT gene expression was found to be upregulated under both low-temperature short-photoperiod (LS) and low-temperature long-photoperiod (LL) conditions. These results suggest a defense mechanism provided by structural genes in response to different temperature and light stresses in flavonoid and anthocyanin metabolic pathways. Light receptors and transcription factors are crucial components in regulating anthocyanins in response to environmental factors.
Interestingly, some anthocyanin metabolites are only synthesized under specific photoperiod and temperature conditions. Cyanidin-3-O-rutinoside and Cyanidin-3-(6″-caffeylsophoroside)-5-glucoside were detected in the HL group only, suggesting that both high-temperature and extended photoperiod conditions may be necessary to promote the synthesis of these substances in new shoots of the tea plant. Cyanidin-3-O-sophoroside and Delphinidin-3-O-sambubioside-5-O-glucoside were only detected in the LL group, indicating that these two anthocyanins might only accumulate under low temperature and extended photoperiod conditions. Lastly, Peonidin-3-O-sambubioside was only detected in the LL and LS groups, suggesting that low temperatures may enhance its synthesis or that high temperatures may inhibit its accumulation (Figure S1). This accumulation pattern has not been reported in other sources in the literature. However, the content of these anthocyanins reached a maximum of only 0.4 μg/g. Whether extending the treatment’s duration or adjusting the photoperiod and temperature conditions would lead to higher concentrations of these anthocyanins remains to be investigated in further studies.
In the regulation of plant anthocyanin responses, photoreceptors, including blue light receptors such as cryptochrome (CRY), red/far-red light receptors such as the photosensitive pigment phytochrome (PHY), and the UV light receptor UVR8, play pivotal roles. Light-responsive cis-acting elements, such as GATA-motif, G-box, ACE, and I-box, have been identified in the promoter regions of structural genes within plant anthocyanin biosynthetic pathways. Upon receiving light signals, upstream transcription factors bind to these response elements, thereby modulating the expression levels of structural genes. Hartmann [35] discovered these elements in the promoter sequence of the apple DFR gene. Moreover, they identified specific sites, MRE and MBS, that specifically bind to MYB transcription factors, along with the MYC recognition element E-box. Similar MYB transcription factor recognition elements were found in the promoter regions of CHS and flavanone F3H in Arabidopsis [36]. Meanwhile, our transcriptome data revealed an MYB1 transcription factor (TGY076670), and previous research highlights the crucial role of MYB1 in light-responsive anthocyanin pathways [37]. Yang [38] investigated the potential function of the mitogen-activated protein kinase MPK4 in light-induced anthocyanin accumulation in apple fruit peel. Antibody arrays and yeast two-hybrid analysis results indicated that proteins encoded by two MdMPK4 genes were light-activated and interacted with the anthocyanin biosynthesis regulator MdMYB1, and transient overexpression of MdMPK4 and MdMYB1 further demonstrated that light-induced anthocyanin accumulation relied on MdMPK4 kinase activity, which is crucial for enhancing MdMYB1 activity. Subsequently, we can explore such photoreceptor genes in the transcriptomic data for further validation of the interaction between photoreceptors and MYB transcription factors.

5. Conclusions

Through a dual-factor experiment involving different temperatures and photoperiod conditions, this study confirms that low temperatures and extended photoperiods independently promote anthocyanin synthesis in ‘Ziyan’ tea plants. Furthermore, the study’s results revealed an additive and interactive effect on anthocyanin content when these factors are combined. The study also elucidated the differences in anthocyanin content, synthesis types, and regulatory patterns for ‘Ziyan’ tea plants under different photoperiod and temperature conditions, exploring the similarities and differences in promoting the anthocyanin biosynthetic pathway in tea plants under low-temperature and extended photoperiod conditions. In conclusion, this study provides crucial insights for optimizing cultivation conditions, enhancing quality, and increasing yield in practical production. The study offers unique perspectives on the innovative utilization of tea-plant germplasm resources and valuable guidance for improving the quality of functional components in horticultural production.

Supplementary Materials

The following supporting information can be downloaded at: https://www.mdpi.com/article/10.3390/agronomy14010056/s1, Figure S1: The specific anthocyanin types accumulated under certain treatments. (A) Cyanidin-3-O-rutinoside. (B) Cyanidin-3-(6″-caffeylsophoroside)-5-glucoside. (C) Cyanidin-3-O-sophoroside. (D) Delphinidin-3-O-sambubioside-5-O-glucoside. (E) Peonidin-3-O-sambubioside; Table S1: List of qRT-PCR primers.

Author Contributions

Conceptualization, L.T. and Q.T.; methodology, W.C. and D.T.; software, C.Y.; validation, C.Y., X.T. and D.T.; formal analysis, C.Y.; investigation, C.Y.; resources, Q.T.; writing—original draft preparation, C.Y.; writing—review and editing, X.T.; visualization, C.Y.; supervision, Q.T. and L.T.; project administration, W.C.; funding acquisition, C.Y. and Q.T. All authors have read and agreed to the published version of the manuscript.

Funding

This research was funded by the Department of Science and Technology of Sichuan Province (2022JDRC0116, 2022ZHCG0103, and 2022JDRC0035) and the Sichuan Innovation Team of the National Modern Agricultural Industry System (sccxtd-2022-10).

Institutional Review Board Statement

Not applicable.

Informed Consent Statement

Not applicable.

Data Availability Statement

The data presented in this study are available from the corresponding author upon request. The additional data from the transcriptomic and metabolomic analyses are not publicly available due to the fact that they are intended for publication in other papers.

Conflicts of Interest

The authors declare no conflicts of interest.

References

  1. Tan, L.; Zhang, P.; Cui, D.; Yang, X.; Zhang, D.; Yang, Y.; Chen, W.; Tang, D.; Tang, Q.; Li, P. Multi-omics analysis revealed anthocyanin accumulation differences in purple tea plants ‘Ziyan’, ‘Zijuan’ and their dark-purple hybrid. Sci. Hortic. 2023, 321, 112275. [Google Scholar] [CrossRef]
  2. Honma, D.; Tagashira, M.; Kanda, T.; Nesumi, A.; Maeda-Yamamoto, M. Anthocyanins from new red leaf tea ‘Sunrouge’. J. Agric. Food Chem. 2011, 59, 4779–4782. [Google Scholar] [CrossRef]
  3. Li, F.; Deng, X.; Huang, Z.; Zhao, Z.; Li, C.; Song, Q.; He, Y.; Niu, S. Integrated transcriptome and metabolome provide insights into flavonoid biosynthesis in ‘P113’, a new purple tea of Camellia tachangensis. Beverage Plant Res. 2023, 3, 3. [Google Scholar] [CrossRef]
  4. Cai, J.; Lv, L.; Zeng, X.; Zhang, F.; Chen, Y.; Tian, W.; Li, J.; Li, X.; Li, Y. Integrative Analysis of Metabolomics and Transcriptomics Reveals Molecular Mechanisms of Anthocyanin Metabolism in the Zikui Tea Plant (Camellia sinensis cv. Zikui). Int. J. Mol. Sci. 2022, 23, 4780. [Google Scholar] [CrossRef] [PubMed]
  5. Jiang, L.; Shen, X.; Shoji, T.; Kanda, T.; Zhao, L. Characterization and Activity of Anthocyanins in Zijuan Tea (Camellia sinensis var. kitamura). J. Agric. Food Chem. 2013, 61, 3306–3310. [Google Scholar] [CrossRef] [PubMed]
  6. Wei, K.; Wang, L.; Zhang, Y.; Ruan, L.; Li, H.; Wu, L.; Xu, L.; Zhang, C.; Zhou, X.; Cheng, H.; et al. A coupled role for CsMYB75 and CsGSTF1 in anthocyanin hyperaccumulation in purple tea. Plant J. 2019, 97, 825–840. [Google Scholar] [CrossRef] [PubMed]
  7. Da silva, T.; Castilho, P.; SÁ-Nakanishi, A.; Vincente Seixas, F.; Dias, M.; Barros, L.; Ferreira, I.; Vracht, A.; Peralta, R. The inhibitory action of purple tea on in vivo starch digestion compared to other Camellia sinensis teas. Food Res. Int. 2021, 150, 110781. [Google Scholar] [CrossRef] [PubMed]
  8. Zou, C.; Li, R.; Chen, J.; Wang, F.; Gao, Y.; Fu, Y.; Xu, Y.; Yin, J. Zijuan tea- based kombucha: Physicochemical, sensorial, and antioxidant profile. Food Chem. 2021, 30, 130322. [Google Scholar] [CrossRef]
  9. Ahammed, G.; Li, X. Hormonal regulation of health-promoting compounds in tea (Camellia sinensis L.). Plant Physiol. Biochem. 2022, 15, 390–400. [Google Scholar] [CrossRef]
  10. Jia, W.B.; Tang, Q.; Zou, Y.; Yang, Y.; Wu, W.; Xu, W. Investigating the antidepressant effect of Ziyan green tea on chronic unpredictable mild stress mice through fecal metabolomics. Front. Microbiol. 2023, 14, 1256142. [Google Scholar] [CrossRef]
  11. Lai, Y.; Li, S.; Tang, Q.; Li, H.; Chen, S. The dark-purple tea cultivar ‘Ziyan’ accumulates a large amount of delphinidin-related anthocyanins. J. Agric. Food Chem. 2016, 64, 2719–2726. [Google Scholar] [CrossRef] [PubMed]
  12. Tian, Y.; Yin, Z.; Tang, Q. Water extraction process of anthocyanins from ‘Ziyan’ tea and the antitumor activity of its extracts. Journal of Anhui agricultural university. Environ. Sci. 2019, 186, 115273. [Google Scholar] [CrossRef]
  13. Tan, L.; Yang, C.; Zhou, B.; Wang, L.; Zou, Y.; Chen, W.; Xia, T.; Tang, Q. Inheritance and quantitative trait loci analyses of the anthocyanins and catechins of Camellia sinensis cultivar ‘Ziyan’ with dark-purple leaves. Physiol. Plant 2020, 170, 109–119. [Google Scholar] [CrossRef] [PubMed]
  14. Winkelshirley, B. Flavonoid Biosynthesis. A Colorful Model for Genetics, Biochemistry, Cell Biology, and Biotechnology. Plant Physiol. 2001, 126, 485–493. [Google Scholar] [CrossRef] [PubMed]
  15. Jaakola, L. New insights into the regulation of anthocyanin biosynthesis in fruits. Trends Plant Sci. 2013, 18, 477–483. [Google Scholar] [CrossRef] [PubMed]
  16. Jia, Z.; Ma, P.; Bian, X.; Yang, Q.; Guo, X.; Xie, Y. Biosynthesis Metabolic Pathway and Molecular Regulation of Plants Anthocyanin. Northwest Bot. J. 2014, 34, 1496–1506. [Google Scholar]
  17. Wang, L.; Dai, S.; Jin, X.; Huang, H.; Hong, Y. Advances in plant anthocyanin transport mechanism. J. Biotechnol. 2014, 30, 848–863. [Google Scholar] [CrossRef]
  18. Petroni, K.; Tonelli, C. Recent advances on the regulation of anthocyanin synthesis in reproductive organs. Plant Sci. 2011, 181, 219–229. [Google Scholar] [CrossRef]
  19. Solfanelli, C.; Poggi, A.; Loreti, E.; Alpi, A.; Perata, P. Sucrose-specific induction of the anthocyanin biosynthetic pathway in Arabidopsis. Plant Physiol. 2006, 140, 637–646. [Google Scholar] [CrossRef]
  20. David, W. Regulation of flower pigmentation and growth: Multiple signaling pathways control anthocyanin synthesis in expanding petals. Plant Physiol. 2000, 110, 152–157. [Google Scholar] [CrossRef]
  21. Hu, K.; Han, K.; Dai, S. Regulation of Plant Anthocyanin Synthesis and Pigmentation by Enviromental Factors. Chin. Bull. Bot. 2010, 45, 307–317. [Google Scholar]
  22. Sheehan, M.; Farmer, P.; Brutnell, T. Structure and expression of maize phytochrome family homeologs. Genetics 2004, 167, 1395–1405. [Google Scholar] [CrossRef] [PubMed]
  23. Albert, N.; Lewis, D.; Zhang, H.; Irving, L.; Jameson, P.; Davies, K. Light-induced vegetative anthocyanin pigmentation in Petunia. J. Exp. Bot. 2009, 60, 2191–2202. [Google Scholar] [CrossRef]
  24. Luo, Q.; Li, H.; Bai, B.; Yu, H.; You, J. Effect of Light on the Anthocyanin Biosynthesis and Expression of CHS and DFR in Rosa Chinensis ‘Spectra’. Mol. Plant Breed. 2013, 1, 126–131. [Google Scholar]
  25. Li, W.; Tan, L.; Zou, Y.; Tan, X.; Huang, J.; Chen, W.; Tang, Q. The Effects of Ultraviolet A/B Treatments on Anthocyanin Accumulation and Gene Expression in Dark-Purple Tea Cultivar ‘Ziyan’ (Camellia sinensis). Molecules 2020, 25, 354. [Google Scholar] [CrossRef] [PubMed]
  26. Yamagishi, M. A novel R2R3-MYB transcription factor regulates light-mediated floral and vegetative anthocyanin pigmentation patterns in Lilium regale. Mol. Breed. 2016, 36, 3. [Google Scholar] [CrossRef]
  27. Sun, B.; Zhu, Z.; Cao, P.; Chen, H.; Chen, C.; Zhou, X.; Mao, Y.; Lei, J.; Jiang, Y.; Meng, W.; et al. Purple foliage coloration in tea (Camellia sinensis L.) arises from activation of the R2R3-MYB transcription factor CsAN1. Sci. Rep. 2016, 6, 32534. [Google Scholar] [CrossRef] [PubMed]
  28. Ban, Y.; Honda, C.; Hatsuyama, Y.; Igarashi, M.; Bessho, H.; Moriguchi, T. Isolation and functional analysis of a MYB transcription factor gene that is a key regulator for the development of red coloration in apple skin. Plant Cell Physiol. 2007, 48, 958–970. [Google Scholar] [CrossRef]
  29. Fang, Z.; Wang, L.; Zhou, D.; Lin, Y.; Pan, S.; Espley, R.; Ye, X. Postharvest temperature and light treatments induce anthocyanin accumulation in peel of ‘Akihime’ plum (Prunus salicina Lindl.) via transcription factor PsMYB10.1. Postharvest Biol. Technol. 2021, 179, 111592. [Google Scholar] [CrossRef]
  30. Wang, N.; Zhang, Z.; Jiang, S.; Xu, H.; Wang, Y.; Feng, S.; Chen, X. Synergistic effects of light and temperature on anthocyanin biosynthesis in callus cultures of red-fleshed apple (Malus sieversii f. niedzwetzkyana). Plant Cell Tissue Organ Cult. 2016, 127, 217–227. [Google Scholar] [CrossRef]
  31. Rowan, D.; Cao, M.; Lin, W.; Cooney, J.; Jensen, D.; Austin, P.; Hunt, M.; Norling, C.; Hellens, R.; Schaffer, R.; et al. Environmental regulation of leaf colour in red 35S:PAP1 Arabidopsis thaliana. New Phytol. 2009, 182, 102–115. [Google Scholar] [CrossRef]
  32. Shaked, L.; Weiss, D.; Reuveini, M.; Nissim, A.; Oren, M. Increased anthocyanin accumulation in aster flowers at elevated temperatures due to magnesium treatment. Physiol Plant. 2002, 114, 559–565. [Google Scholar] [CrossRef] [PubMed]
  33. Shen, J.; Zhang, D.; Zhou, L.; Zhang, X.; Liao, J.; Duan, Y.; Wen, B.; Ma, Y.; Wang, Y.; Fang, W.; et al. Transcriptomic and metabolomic profiling of Camellia sinensis L. cv. ‘Suchazao’ exposed to temperature stresses reveals modification in protein synthesis and photosynthetic and anthocyanin biosynthetic pathways. Tree Physiol. 2019, 1, 1583–1599. [Google Scholar] [CrossRef] [PubMed]
  34. Zhang, X.; Chen, S.; Shi, L.; Gong, D.; Zhang, S.; Zhao, Q.; Zhan, D.; Vasseur, L.; Wang, Y.; Yu, J.; et al. Haplotype-resolved genome assembly provides insights into evolutionary history of the tea plant Camellia sinensis. Nat Genet. 2021, 53, 1250–1259. [Google Scholar] [CrossRef] [PubMed]
  35. Hartmann, U.; Valentine, W.; Christie, J.; Hays, J.; Jenkins, G.; Weisshaar, B. Identification of UV/blue light-response elements in the Arabidopsis thaliana chalcone synthase promoter using a homologous protoplast transient expression system. Plant Mol. Biol. 1998, 36, 741–754. [Google Scholar] [CrossRef] [PubMed]
  36. Hartmann, U.; Sagasser, M.; Mehrtens, F.; Stracke, R.; Weisshaar, B. Differential combinatorial interactions of cis-acting elements recognized by R2R3-MYB, BZIP, and BHLH factors control light-responsive and tissue-specific activation of phenylpropanoid biosynthesis genes. Plant Mol. Biol. 2005, 57, 155–171. [Google Scholar] [CrossRef] [PubMed]
  37. Zoratti, L.; Karppinen, K.; Escobar, A.; Häggman, H.; Jaakola, L. Light-controlled flavonoid biosynthesis in fruits. Front. Plant Sci. 2014, 9, 534. [Google Scholar] [CrossRef] [PubMed]
  38. Yang, T.; Ma, H.; Zhang, Y.; Zhang, J.; Wu, T.; Song, T.; Yao, Y.; Tian, J. Apple MPK4 mediates phosphorylation of MYB1 to enhance light-induced anthocyanin accumulation. Plant J. 2021, 106, 1728–1745. [Google Scholar] [CrossRef] [PubMed]
Figure 1. Tea-plant samples and anthocyanin contents: (A) ‘Ziyan’ 1B2L after different photoperiod and temperature treatments; (B) total anthocyanin contents of the different samples; (C) interaction plot describing the trends in anthocyanin content corresponding to two levels of two independent variables, temperature and photoperiod. HL: high temperature × long day-length; HS: high temperature × short day-length; LL: low temperature × long day-length and LS: low temperature × short day-length; HT: high temperature; LT: low temperature; LL: long photoperiod; SL: short photoperiod. Data are expressed as the means ± SD of three replicates, and the different letters shown indicate significant differences at p < 0.00.
Agronomy 14 00056 g001
Figure 2. Anthocyanin metabolite clustering of each sample and differential metabolites between samples: (A) anthocyanin metabolite PCA clustering; (B) anthocyanin metabolite and sample clustering heat map; (C) statistical histogram of differential metabolites; (D) statistical Wayne plot of differential metabolites; (E) histogram of classified anthocyanin content.
Agronomy 14 00056 g002
Figure 3. Statistical analysis of differentially expressed genes: (A) transcriptome principal component analysis; (B) DEGs clustering heatmap; (C) statistical histogram of DEGs; (D) statistical Wayne plot of DEGs.
Agronomy 14 00056 g003
Figure 4. Differentially expressed genes’ function enrichment and gene expression confirmation: (A) KEGG enrichment plots of DEGs for each differential group; (B) GO enrichment plots for DEGs for each differential group; (CI) differential gene expression levels of tea plants cultured under different photoperiod and temperature conditions. The bar chart displays the qRT-PCR results, corresponding to the left vertical axis; the line chart shows the FPKM values of the same genes in the transcriptome results, corresponding to the right vertical axis. The qRT-PCR results represent the means of three replicates.
Agronomy 14 00056 g004
Figure 5. Expression patterns of DAMs and DEGs in anthocyanin synthesis pathways in response to variations in light and temperature. The gray squares signify that the differences in metabolite abundance or gene expression levels among the samples are not significant.
Agronomy 14 00056 g005
Table 1. Statistical results of the sequencing.
SampleClean ReadsClean Base (Gb)Q30 (%)GC Content (%)Reads Mapped (%)Unique Mapped (%)
HL-143,832,7186.5790.6542.8186.3481.33
HL-247,538,3587.1390.1543.886.6181.93
HL-343,692,1826.5589.8742.9186.2481.56
HS-144,636,0126.790.243.6586.3781.65
HS-246,091,2726.9191.5643.9487.7882.66
HS-344,820,1146.7290.4943.4186.3281.33
LL-144,589,6486.6990.7743.4387.6282.52
LL-245,562,7986.8390.5143.487.1382.24
LL-344,766,8166.7291.243.1686.9681.86
LS-144,646,8146.790.9243.3787.2982.37
LS-245,546,0306.8390.5142.7685.8580.94
LS-345,172,0406.7889.9842.8786.3581.63
Table 2. Differentially expressed genes associated with the anthocyanin synthesis pathway.
Gene IDGene NameDescriptionFPKM Expression Mean
HSHLLSLL
TGY116873ANSaAnthocyanin synthase133.58134.3287.19194.49
TGY105701ANSbAnthocyanin synthase9.185.322.725.35
TGY031680DFRDihydroflavonol 4-reductase46.3673.9665.53138.97
TGY079101CHSChalcone synthase 30.621.000.441.56
TGY008324F3HaFlavanone-3-hydroxylase36.3239.1212.3744.94
TGY040587F3HbFlavanone-3-hydroxylase1.560.650.600.79
TGY109805HCTashikimate hydroxycinnamoyltransferase1.091.200.491.29
TGY025428HCTbshikimate hydroxycinnamoyltransferase17.0031.7514.0611.96
TGY042101HCTcshikimate hydroxycinnamoyltransferase0.290.750.060.11
TGY063698HCTdshikimate hydroxycinnamoyltransferase8.357.427.0814.81
TGY107898HCTeshikimate hydroxycinnamoyltransferase3.505.342.565.86
TGY032709HCTfshikimate hydroxycinnamoyltransferase25.2433.7418.3314.23
novel.2405HCTgshikimate hydroxycinnamoyltransferase0.600.871.411.69
TGY020135HCThshikimate hydroxycinnamoyltransferase0.320.691.011.18
TGY052439CCoAOMTCaffeoyl-CoA-O-methyltransferase0.980.871.343.16
TGY000809UGT29aFlavanone 7-O-glucoside 2″-O-beta-L-rhamnosyltransferase1.322.482.841.42
TGY000843UGT29b0.912.361.641.32
novel.2347UFGTaAnthocyanidin 3-O-glucosyltransferase1.141.232.532.41
TGY019907UFGTbAnthocyanidin 3-O-glucosyltransferase22.6124.7338.8451.77
novel.15478F6HFlavonoid 6-hydroxylase3.892.784.736.11
TGY009888BAHDIsoflavone 7-O-glucoside-6″-O-malonyltransferase0.661.280.390.51
TGY076670MYB1Transcription factor MYB15.8110.4017.5925.62
Disclaimer/Publisher’s Note: The statements, opinions and data contained in all publications are solely those of the individual author(s) and contributor(s) and not of MDPI and/or the editor(s). MDPI and/or the editor(s) disclaim responsibility for any injury to people or property resulting from any ideas, methods, instructions or products referred to in the content.

