Abstract
Green manure crops intercropping is an effective agricultural practice to alleviate water and nutrient deficit by improving soil properties in the Loess Plateau of China. However, green manure crops intercropping could cause water and nutrient competition, but the effects of different green manure crops intercropping on soil water and nutrient status are rarely evaluated. Thus, we conducted a field experiment to investigate the responses of soil moisture, nitrogen, and yield to green manure crops intercropping. Three intercropping patterns, apple–ryegrass (AR), apple–spring rape (AS), and apple–alfalfa (AA), were set up with a blank control (CK), which employed clean tillage in the inter-row and row. All treatments had no significant difference on evapotranspiration. At maturity, AR, AS, and AA treatments reduced soil organic matter content by 4.2%, 6.5%, and 18.8%, and total nitrogen content by 0.01%, 1.3%, and 20.3%, relative to CK, respectively. The water competition degree in AR, AS, and AA were 38.4%, 48.8%, and 64.6%, respectively. Ryegrass, spring rape, and alfalfa’s nitrogen use efficiency were 19.71%, 29.24%, and 39.42%, respectively. AR and AS treatments increased the apple yield by 11.7% and 5.7%, and water-use efficiency (WUE) by 14.4% and 7.5%, relative to CK, respectively. AA treatment reduced the apple yield by 6.9% and WUE by 6.8%, relative to CK. All treatments had no significant difference on apple quality. Therefore, in normal water years, we suggest adapting the ryegrass–apple tree intercropping pattern for apple production on the Plateau Loess, China.
1. Introduction
Apple is one of the most important fruit crops globally. Apple production in China had reached 4.6 × 10⁷ t, accounting for 49.37% of the world’s total production (9.31 × 10⁷ t) in 2021 [1]. The Loess Plateau is a major apple production area in China because of its appropriate temperature and sunshine [2]. However, the water scarcity has been restricting apple production of the Loess Plateau where the annual precipitation mostly happened from July to September. Most rainfall would be lost by evaporation during this period because of the high temperature [3]. In addition, another main reason for limiting apple production in the Loess Plateau is the poor soil fertility. In the Loess Plateau, the soil organic matter content in apple orchards is about 5.41–9.25 g/kg; in other Chinese apple-producing areas, it is usually 6.53–15.57 g/kg [4].
Green manure crops are extensively employed in orchards because of their benefits in promoting soil organic matter content, increasing water infiltration, decreasing soil erosion, controlling weeds, and improving biodiversity [5,6,7,8]. Some studies showed that planting green manure crops can improve soil water status in orchards. For instance, long-term grass intercropping significantly improved soil water-infiltration capacity and water-holding capacity in apple orchards [9]. Grass growth in the Weibei apple orchard could improve soil structure and promote soil water-storage capacity [10]. Cover crops increased the infiltration water amount and soil moisture compared with convention tillage [11]. Planting the subterranean clover (Trifolium repens L.) in olive orchards was proved to be effective as a way of improving available soil water [12]. Additionally, some studies also demonstrated that in orchards, green manure crops intercropping had the effect of fertility improvement. White clover, crown vetch (Coronilla varia L.), and perennial ryegrass living mulches significantly increased the soil total organic carbon, available phosphorus, and available potassium contents [13]. With the increase in planting years, grass growing could improve soil quality, and soil total nitrogen content increased by 3.05% [14]. By a meta-analysis, orchard grass mulch was identified as a promising practice to increase soil organic carbon stock stocks at the 0–30-cm soil layer across China [15]. Crown vetch, orchard grass, and white clover mulching significantly increased soil organic carbon and soil dissolved organic carbon contents in topsoil [16]. However, some people found that green manure crops intercropped in orchards competed with fruit trees for water and nutrients. Grass cover caused lower soil water content and exacerbated the desiccation of the deep soil layer, with the increase in planting years [17]. Grass mulching caused lower soil water content during the dry season on the arid area of the Weibei Loess Plateau [18].In the early stage of grass growth (4 years), soil nutrient consumption was greater than accumulation, and there was nutrient competition between apples and herbage in the 0–40-cm soil layer [19]. In apricot orchards of the arid Loess hilly and gully region, China, intercropping erect milkvetch were unsuitable and generated the competition of water and nutrients between apricots and erect milkvetch [20]. Therefore, it is significant to figure out the water and nutrient utilization of apple–green manure crops agroforestry system for promoting apple tree growth and improving yield.
As one of the essential mineral elements for fruit trees, nitrogen plays an important role in the growth and development of apple trees and its yield formation. In addition, 15N stable isotope tracing technique is an important method of nitrogen research at present. However, in recent years, few studies were reported on the water and nutrient utilization of apple tree–green manure crops agroforestry system, especially for intercropping different green manure crops. Thus, we conducted a field trial to (1) Investigate the effects of intercropping different green manure crops on soil moisture and fertility; (2) Explore the water and nitrogen competition mechanism of apple tree–green manure crop agroforestry systems; (3) Examine the effects of intercropping different green manure crops on fruit yield, water use efficiency, and apple quality; (4) Select an intercropping model with better water and nitrogen utilization effect for apple production in the gully area of the Loess Plateau in China.
2. Materials and Methods
2.1. Study Area
The study area was located in Xunyi county, Shaanxi Province, China (35°01′ N, 108°27′ E), which is a typical gully area on the Loess Plateau (Figure 1). The climate type of study area is temperate continental monsoon climate. The county has an average altitude of 1430 m and an average temperature difference between day and night of 12.6 °C. Annual mean temperature and precipitation are 10.2 °C and 721.2 mm, respectively (based on Xunyi county meteorological data for 1990–2022). The majority of rainfall falls in July, August, and September (Figure 2). There are approximately 170 frost-free days and 2390 sunshine hours per year. The field capacity of the tested orchard in the 0–1-m soil layer was found to be 21.47% (w/w), while the average dry bulk density was 1.48 g/cm³. In the 0–1-m soil layer, the basic fertility (mass ratio) was 11.62 g/kg of organic matter, 0.64 g/kg of total nitrogen, 7.90 mg/kg of nitrate nitrogen, 5 mg/kg of ammonium nitrogen, 21.67 mg/kg of available phosphorus, and 85.20 mg/kg of available potassium.
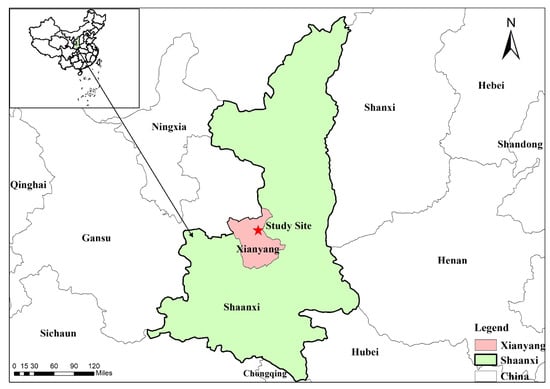
Figure 1.
Geographical location of the study area.
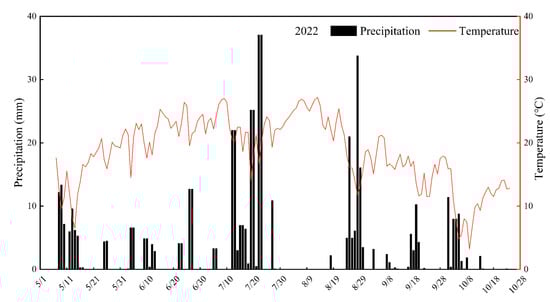
Figure 2.
Precipitation and temperature from May to October in 2022.
2.2. Experimental Design
The experiment was carried out between May and October of 2022 in the Xunyi Apple Experimental Station in Xianyang City, Shaanxi Province, China. The study site is a typical gully area on the Loess Plateau. The total precipitation in 2022 is 698.2 mm. Based on the precipitation data of Xunyi County from 1990–2020, the corresponding frequency value of precipitation in 2022 was 50.3% via Pearson III curve, which was close to the frequency value of the water normal year (p = 50%). Thus, the experiment’s results were considered to be of certain representativeness.
The apple trees (Malus pumila M.) were planted in 2016. The row spacing of the trees was 1.5 m × 4 m with a south–north orientation. The green manure crops (ryegrass (Lolium perenne L.), spring rape (Brassica napus L.), and alfalfa (Medicago L.)) were sown in inter-row (3 m) on the 12th of May in 2022. No irrigation and fertilization were employed on them during the trial. Three green manure crops were ploughed at the end of the experiment to fertilize the soil. The densities of seeding were recommended locally as follows: spring rape of 15 kg/hm2, alfalfa of 15 kg/hm2, and ryegrass of 15 kg/hm2. We tilled the soil before sowing the green manure crops. Three intercropping treatments were weeding regularly. The plots on both sides of the test area were set as protection rows. The other management practices of apple trees are consistent with local practices. The daily irrigation and fertilization of the orchard were conducted by drip irrigation. The position of the drip irrigation belt is 50 cm above the ground of the fruit tree row.
The experiment was composed of two parts as follows. Experiment Ⅰ (May to October of 2022). The experiment was designed on a randomized block with four treatments: apple–ryegrass intercropping (AR), apple–spring rape intercropping (AS), apple–alfalfa intercropping (AA), and the control (CK) of employing clean tillage in the inter-row and row (Figure 3). Each treatment was done with three replications (20 apple trees for each replication). Experiment II (July to October of 2022): 15N field tracer microplots were set up in the test plots of Experiment I (Figure 3). One microplot was randomly set up in each test plot, and three microplots were set up under each treatment as replications. The setting of the field tracer microplot was as follows: in each experimental plot, randomly selecting a well-growing apple tree and using the iron sheet to create a square area around it (one meter in length, width and depth; the iron sheet was 10 cm above the ground) (Figure 3). Applying 10 g of 15N-labeled urea (Shanghai Research Institute of Chemical Industry, abundance 10.02%) in each field tracer microplot on 28th of July in 2022. The specific application method of the 15N-labeled urea was as follows: completely dissolving 10 g 15N-labeled urea in the watering can and spraying all of it evenly in the field tracer microplot. Finally, evenly covering a thin layer of soil on the surface of the field tracer microplot. The sowing density of green manure crops in the microplot was consistent with the test plot; the water and fertilizer managements in the microplot were consistent with local orchards.
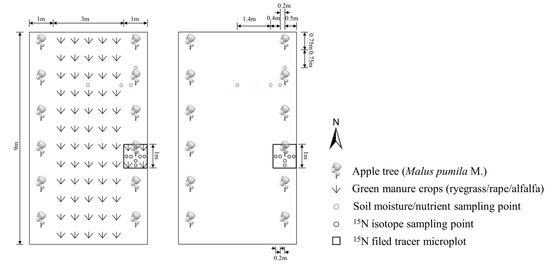
Figure 3.
Experiment layout and the sampling points of soil moisture/nutrient and 15N isotope.
2.3. Measurements and Calculations
2.3.1. Soil Water Content (SWC) Measurements
In each plot, soils were sampled at four points (Figure 3). The soil samples in the 0–1 m (with an interval of 20 cm) in each plot were collected by a soil auger (4 cm in diameter) during the trial. The soil samples in each layer were partly separated to determine soil water content via the oven-drying method (105 °C, 24 h). At the beginning of the experiment, the soil samples were also collected to determine the initial SWC.
2.3.2. Soil Nutrient Content Determinations
Some subsamples of the above soils were taken into lab for nutrient content determination. Soil organic matter (SOM), total nitrogen (TN), nitrate nitrogen (NN), ammonium nitrogen (AN), available phosphorus (AP), and available potassium (AK) were measured in 0–60-cm soil layers in each plot. SOM was determined by the potassium dichromate external heating method; TN was determined by the Kjeldahl method; NN and AN were measured via 1 mol/L KCL solution extraction and the AA3 continuous flow analyzer (SEAL, Norderstedt, Germany); AP was determined by sodium bicarbonate extraction colorimetry method; AK was determined by flame photometry. The determination methods of SOM, N, P, and K contents were based on the book Soil Agricultural Chemistry Analysis [21].
2.3.3. 15N Isotope Abundance Determinations
In fruit-maturing period, the soil and plant samples from each 15N field tracer microplot were collected to measure 15N isotope abundance by stable isotope ratio mass spectrometer (IRMS). An auger (4 cm diameter) was employed to collect 0–60-cm (with an interval of 20 cm) isotope soil samples whose location of sampling points was shown in Figure 3. Plant samples included apple trees’ roots, stems, branches (annual and perennial), leaves, fruits, and the aboveground part of green manure crops in the microplot.
2.3.4. Nitrogen-Efficiency Determinations
In this study, the growth model was used to estimate the biomass of apple trees. The growth model is to establish the mathematical relationship between the dry weight of each part of the plant and each tree measurement factor through the actual monitoring value, which can reflect the relationship between plant biomass and tree measurement factor relations [22]. According to the nonlinear apple tree growth model established in this study area [23] and the easily obtained tree measurement factors (tree height and base diameter), the biomass of apple trees in this test site was estimated. The growth model was provided by [22]:
where is the biomass of fruit tree; and are the growth model parameters; is the base diameter of the fruit tree; is the tree height. In order not to damage the fruit trees, the biomass of roots, stems, and branches were calculated by the model, and the biomass of leaves and fruits were measured in fruit maturing. H and D were measured every month from fruit swelling to fruit maturing. , and prediction accuracy are shown in Table 1 [23]. Prediction accuracy (P, %) is the accuracy verification index for the prediction effect of the biomass model, and the specific calculation method is as follows:
where is the actual observed value, is the estimated value of the model; is the average estimated value; n is the number of sample units; is the number of parameters; is the t value at the confidence level α.

Table 1.
Parameters of growth model.
The proportion (Ndff) of plant N derived from the urea labeled by 15N is provided by
where atom%15Nexcess = atom%15N–15N natural abundance, and 15N natural abundance = 0.3663 ± 0.0004 [24].
The nitrogen utilization rate of plant was calculated by:
where is the total nitrogen amount of plant organs, which equals organ biomass multiplied by organ TN. In fruit maturing, 15N plant samples’ TN were also needed to measure.
The nitrogen residue rate of 0–60-cm soil layer was calculated by:
where is the total nitrogen amount of the 0–60-cm soil layer, which equals TN of 0–60 soil layer multiplied by corresponding soil volume. In fruit maturing, 15N soil samples’ TN were also needed to measure.
The nitrogen loss rate of the 15N-labeled urea was calculated by:
2.3.5. Soil Water Storage (SWS)
The formula of calculating soil water storage (SWS) was as:
where is the soil gravimetric water content of each layer, is the bulk density of each layer; is the thickness of each layer.
2.3.6. Soil Water Difference Ratio (SWDR) [25]
A simple index was introduced to demonstrate the possibility of water competition between apple trees and green manure crops as follows:
where and represent the soil gravimetric water content in the inter-row and row, respectively. We calculated the SWDR values of the control check (SWDRc) and an intercropping treatment (SWDRi), respectively. If the value of SWDRi is negative and its value is less than SWDRc, the water competition of green manure crops with apple trees may take place with a high probability.
2.3.7. Evapotranspiration (ET) and Water Use Efficiency (WUE)
The calculation of crop water requirements (ET) based on soil–water balance equation:
where , , are the amount of irrigation, precipitation, and soil water-storage change in 0–1 m respectively from the beginning of the experiment (early May) to the ending of the experiment (late October). The runoff, underground water recharge, and leakage were neglected due to no heavy rain occurring and the deep level of underground water table.
where is the yield of apple.
2.3.8. Fruit Yield and Quality
Six apple trees were randomly selected at the fruit-maturing period from every plot to measure apple yield. Four apples from four directions of each apple tree were collected to determine fruit quality.
2.3.9. Data Analysis
The data were analyzed and processed via SPSS 26 and Excel 2016. One-way ANOVA and multi-way ANOVA were performed to test whether different elements significantly influence experimental indicators or not. The least significant difference method (LSD) at p < 0.05 was used to evaluate any significant differences.
3. Results
3.1. Variation of Soil Water, TN, and SOM Contents
3.1.1. SWC Change
In general, during the trial period, the SWC of CK was greater than the other treatments, averaging more than three intercropping treatments 3.8–10.3% and at different growth stages, treatments were significant on SWC (Figure 4 and Table 2); the ET of CK was greater than the other treatments averagely 0.1–2.5% and treatments had no significant difference (Table 3 and Figure 5). During the fruit setting and fruit swelling, the SWC of each treatment generally showed a trend of increasing with the depth of the soil layer increased; at fruit maturing, the SWC of each treatment showed a downward trend; in addition, we found the SWC of each treatment in fruit setting was generally lower than the other growth periods (Figure 4). Among three intercropping treatments, the maximum value of total ET in AA treatment and the minimum value occurred in AR treatment (Table 3). The ET at different growth stages under different intercropping treatments showed a trend of increasing first and then decreasing; it reached the maximum values in the early fruit swelling (Figure 5).
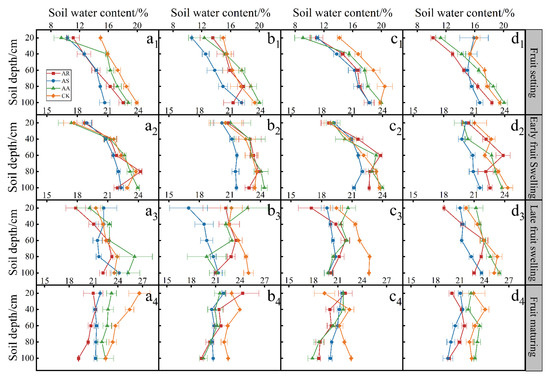
Figure 4.
Spatio–temporal distribution of soil-water contents (SWC) in 0–1-m soil layer during the experiment. a, b, c, d are the four sampling points perpendicular to the tree row; the distance from a, b, c to the tree row are 0.2 m, 0.6 m, and 1 m respectively; d is located in the middle position between the selected tree and the prior tree. 1, 2, 3, and 4 represent four growth periods: fruit setting, early fruit swelling, late fruit swelling, and fruit maturing, respectively. AR, AS, AA, and CK represent apple–ryegrass, apple–spring rape, apple–alfalfa intercropping pattern and a control treatment with clear tillage in the inter-row and row, respectively.
Table 2.
Significance analysis of SWC in 0–1 m during the test.
Table 3.
Yield, ET, and WUE of each treatment.
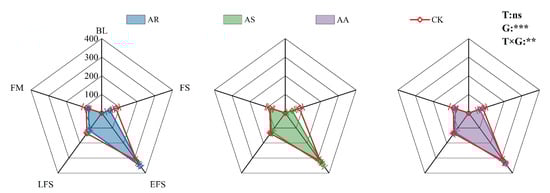
Figure 5.
Variation of evapotranspiration (ET) at different growth stages under different green manure crops treatments. AR, AS, AA, and CK represent apple–ryegrass, apple–spring rape, apple–alfalfa intercropping pattern and a control treatment with clear tillage in the inter-row and row, respectively. BL, FS, EFS, LFS, and FM represent blooming, fruit setting, early fruit swelling, late fruit swelling, and fruit maturing, respectively. T, G and T × G represent the influence of treatment, growth period, and treatment-growth period interaction on ET, respectively. **, ***, and ns represent significances at the p < 0.01, p <0.001 levels and no significance, respectively.
3.1.2. Distribution of TN and SOM Contents
The variation tendency of TN and SOM contents were consistent, and the maximum value appeared in CK treatment; among three intercropping treatments, the maximum value appeared in AR treatment, and the minimum value appeared in AA treatment (Figure 6). The TN and SOM contents of three intercropping treatments were significantly lower than CK treatment. At maturity, AR, AS, and AA treatments reduced soil organic matter content by 4.2%, 6.5%, and 18.8%, and total nitrogen content by 0.01%, 1.3%, and 20.3%, relative to CK, respectively (Figure 6).
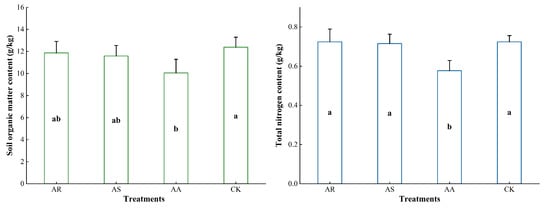
Figure 6.
Soil organic matter (SOM) and total nitrogen(TN) contents of each treatment at fruit maturing. AR, AS, AA, and CK represent apple–ryegrass, apple–spring rape, apple–alfalfa intercropping pattern, and a control treatment with clear tillage in the inter-row and row, respectively. Different lowercase letters represent significant differences among different treatments (p < 0.05).
3.2. Water and Nitrogen Competition of Intercropping System
3.2.1. Water Competition
The results of SWDR showed that the times of water competition between green manure crops and fruit trees among three intercropping treatments were AR: 7 times, AS: 6 times, AA: 7 times (Figure 7). We considered the absolute value of SWDR difference (SWDRi-SWDRc) as an indicator to estimate the degrees of water competition because the times did not show significant difference. The water competition degrees of AR, AA, and AS were 38.4%, 48.8%, and 64.6%, respectively.
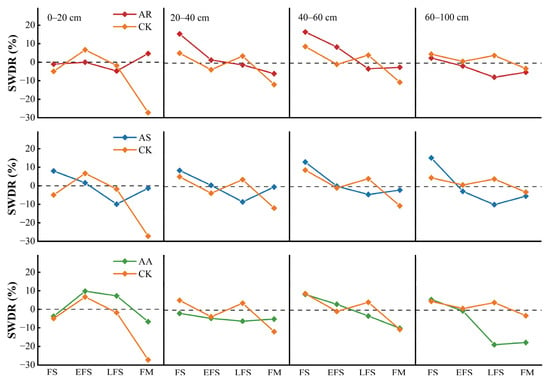
Figure 7.
Soil water difference ratio (SWDR) of each treatment during the trial. AR, AS, AA, and CK represent apple–ryegrass, apple–spring rape, apple–alfalfa intercropping pattern, and a control treatment with clear tillage in the inter-row and row, respectively. BL, FS, EFS, LFS, and FM represent blooming, fruit setting, early fruit swelling, late fruit swelling, and fruit maturing, respectively.
3.2.2. Nitrogen Competition
The results of 15N isotope tracing indicated that the NUE of roots, stems, and branches in apple trees were higher than the other organs of fruit trees. The NUE of fruit trees in all three intercropping treatments were higher than CK treatment; among three intercropping treatments, the maximum value of NUE of fruit trees appeared in AR treatment (24.37%), which was 1.41 times of CK treatment, and the minimum value appeared in AA treatment (19.74%), which was 1.14 times of CK treatment (Table 4). Green manure crops’ NUE of AA treatment was the highest (39.42%); their NUE of AR treatment was the lowest (19.71%). The nitrogen loss rate of all three intercropping treatments were less than CK treatment (Table 4).
Table 4.
Nitrogen efficiency of each treatment based on 15N isotope tracer technique.
3.3. Yield, WUE, and Fruit Quality
AR treatment had the highest yield and AA treatment had the lowest yield. The yield of AR and AS treatment were higher than CK treatment, but the yield of AA treatment was lower than CK treatment (Table 3). The variation trend of WUE in each treatment was consistent with the yield; the WUE of AR and AS treatment were higher than CK treatment; and the WUE of AA treatment was lower than CK treatment (Table 3). In terms of apple quality, there were no significant differences in all treatments (Table 5).
Table 5.
Fruit quality of each treatment.
4. Discussion
This article is based on one-season experimental data to expand. In addition, we demonstrate the reliability of this study as follows. Firstly, the total precipitation in 2022 is 698.2 mm. Based on the precipitation data of Xunyi County from 1990–2020, the corresponding frequency value of precipitation in 2022 was 50.3% via Pearson III curve, which was fairly close to the frequency value of the normal water year (P = 50%). Thus, the experiment’s results were considered to be a certain representativeness in the condition of the normal water year. Secondly, in our study, the 15N isotope tracer technique was used to investigate nitrogen competition and utilization under different intercropping patterns. There are many studies on the use of 15N isotope technology to explore the nitrogen utilization of apple trees, among which there are also many studies using the 15N isotope experiment data of one season to obtain representative results [26,27,28,29]. Based on the above two points, we believe that the data obtained in our study are representative and credible. Of course, in subsequent tests, we will also further explore the long-term effects of different treatments to better serve agricultural production.
4.1. Effects of Different Green Manure Crops on Soil Moisture and Fertility
During the experiment, the ET of CK was greater than three intercropping treatments, but the SWC of three intercropping treatments was lower than CK treatment overall, and there was no significant difference in ET among the treatments either on the scale of the whole experimental cycle or on the scale of different growth periods (Figure 4 and Figure 5, and Table 3). This indicated that the intercropped green manure crops not only failed to play an important role in water retention during the experiment, but also the soil water depletion was exacerbated by the growth of green manure crops. This result contradicted previous studies [9,30]. This may be because our experiment focused on the effect of green manure crops on soil moisture of the apple orchard in the short period and did not consider the cumulative effect of long-term intercropping of green manure crops. It may also be due to the age of apple trees. These need to be further investigated in the follow-up experiment.
The SOM and TN content of each treatment decreased to different degrees compared to the beginning of the experiment, and the SOM and TN content of CK treatment were greater than three intercropping treatments (Figure 6). This indicated that three intercropping treatments intensified the nutrient consumption in soil to different degrees, which is different from previous studies [14,31,32]. The growing year, sowing density, and mixture composed of cover crops may be the reasons. The green manure crop in AA treatment is the legume crop, but the reduction degree of SOM and TN content in AA treatment were the greatest among treatments. This result is against the fact that legume green manure can fix nitrogen and provide benefits to the crop growth at the same time as it or to the subsequent crop [33]. This may be due to the short planting period of alfalfa, which not only did not serve to increase soil nitrogen but instead intensified the nitrogen depletion in soil [19,34].
4.2. Water and Nitrogen Competition of Intercropping Systems
In order to investigate whether green manure crops in intercropping systems competed with fruit trees for water and nitrogen, relevant techniques and indicators were employed. Firstly, a simple indicator (SWDR) was introduced to explore if green manure crops competed with fruit trees for water. The results of SWDR indicated that three green manure crops competed with fruit trees for water during the trial with a high probability (Figure 7). This may be related to planting years and planting density [17,31]. It needs to be explored in further experiments. The alfalfa of AA treatment competed with the fruit trees to a larger extent (64.6%), and the ryegrass of AR treatment competed with fruit trees to a smaller extent (38.4%).
The 15N isotope-tracing technique was introduced to investigate whether nitrogen competition occurred in intercropping systems. The results indicated that the NUE of fruit trees in all three intercropping treatments increased to different degrees compared to CK treatment, with the AR treatment showing the largest increase of 62.58% and the AA treatment showing a smaller increase of 39.65% compared to CK treatment (Table 4). This suggested that intercropping green manure crops could promote nitrogen uptake and utilization by fruit trees, which may be due to the reason that intercropping green manure crops promoted the growth and development of the root system [27,35]. The alfalfa of AA treatment had the highest nitrogen uptake rate, which also implied that the intercropped alfalfa in inter-row of the orchard competed nitrogen with fruit trees with a high possibility [34]. The ryegrass of AR treatment had lower nitrogen utilization and was less likely to compete with fruit trees for nitrogen among the three green manure crops. Compared with CK treatment, green manure crops in three intercropping treatments all reduced nitrogen losses from the soil to different degrees (Table 4). The part of nitrogen that avoided losing was either absorbed by the fruit trees or by the green manure crops themselves.
4.3. Effects of Different Green Manure Crops on Yield, WUE, and Apple Quality
The AA treatment had the lowest yield among three intercropping treatments, even lower than CK treatment, while both AR and AS treatments were higher than CK treatment (Table 3), which was closely related to the water and nitrogen competition between green manure crops and fruit trees in each treatment. The AA treatment had the largest degree of water and nitrogen competition among three intercropping treatments, followed by the AS treatment. AR treatment had the smallest degree of water and nitrogen competition (Figure 7 and Table 4). This also indicated that mild competition may contribute to yield improvement, while excessive competition would cause yield reduction, which is similar to other studies [36,37]. In addition, the variation tendency of SOM, TN, and WUE of three intercropping treatments were also consistent with yield (Table 3 and Figure 6). In addition, there was no significant difference in apple quality among different treatments (Table 5).
5. Conclusions
Based on the one-season field trial, our study showed that green manure crops intercropping did not significantly reduce evapotranspiration relative to CK. Meanwhile, AR, AS, and AA treatments reduced soil organic matter and total nitrogen content relative to CK. The AA treatment intensified water and nitrogen competition. The AR treatment had better water and nitrogen utilization effects relative to AS and AA treatments. Moreover, AR and AS treatments increased apple yield and WUE relative to CK. The AA treatment reduced apple yield and WUE relative to CK. All treatments had no significant difference on apple quality. Altogether, these results suggest that in normal water years, adapting the ryegrass–apple tree intercropping pattern is beneficial to apple production on the Plateau Loess, China.
Author Contributions
Conceptualization, Q.L. and T.Z.; methodology, Y.C.; software, Z.L. and W.G.; validation, T.Z.; formal analysis, Z.L.; investigation, Q.L., Z.L., and W.G.; resources, T.Z.; data curation, Q.L.; writing—original draft preparation, Q.L.; writing—review and editing, Q.L. and T.Z.; visualization, Q.L.; supervision, T.Z.; project administration, T.Z. and H.F.; funding acquisition, T.Z. All authors have read and agreed to the published version of the manuscript.
Funding
This research was funded by National Key R&D Program of China (2021YFD1900700), Key R&D Program of Shaanxi (2023-ZDLNY-53), Innovation Capability Support Program of Shaanxi (2022PT-23), and CAS “Light of West China” Program (XAB2022YW04).
Data Availability Statement
The data presented in this study are available on request from the corresponding author. The data are not publicly available due to ethical restrictions.
Acknowledgments
We are grateful for the support from the Xunyi Apple Experimental Station in Xianyang City, Shaanxi Province, China.
Conflicts of Interest
The authors declare no conflict of interest.
References
- FAOSTAT. 2021. Available online: https://www.fao.org/faostat/en/ (accessed on 11 March 2023).
- Liu, Y.; Gao, M.; Wu, W.; Tanveer, S.K.; Wen, X.; Liao, Y. The effects of conservation tillage practices on the soil water-holding capacity of a non-irrigated apple orchard in the Loess Plateau, China. Soil Till. Res. 2013, 130, 7–12. [Google Scholar] [CrossRef]
- Zheng, W.; Wen, M.; Zhao, Z.; Liu, J.; Wang, Z.; Zhai, B.; Li, Z. Black plastic mulch combined with summer cover crop increases the yield and water use efficiency of apple tree on the rainfed Loess Plateau. PLoS ONE 2017, 12, e0185705. [Google Scholar] [CrossRef] [PubMed]
- Ge, S.; Xu, H.; Ji, M.; Jiang, Y. Characteristics of Soil Organic Carbon, Total Nitrogen, and C/N Ratio in Chinese Apple Orchards. Open J. Soil Sci. 2013, 3, 213–217. [Google Scholar] [CrossRef]
- Coronado, A.; Linares, C.; López, M.; Ángel, F.; Zornoza, R. The impact of intercropping, tillage and fertilizer type on soil and crop yield in fruit orchards under Mediterranean conditions: A meta-analysis of field studies. Agric. Syst. 2020, 178, 102736. [Google Scholar] [CrossRef]
- Yves, B.; Lecomte, V.E.; Olivier, C. Grass strip effects on runoff and soil loss. Agron 2004, 24, 129–136. [Google Scholar] [CrossRef]
- Uliarte, E.; Schultz, H.; Frings, C.; Pfister, M.; Parera, C.; Monte, R. Seasonal dynamics of CO2 balance and water consumption of C3 and C4-type cover crops compared to bare soil in a suitability study for their use in vineyards in Germany and Argentina. Agric. For. Meteorol. 2013, 181, 1–16. [Google Scholar] [CrossRef]
- Elhakeem, A.; Werf, W.; Ajal, J.; Lucà, D.; Claus, S.; Vico, R.; Bastiaans, L. Cover crop mixtures result in a positive net biodiversity effect irrespective of seeding configuration. Agric. Ecosyst. Environ. 2019, 285, 106627. [Google Scholar] [CrossRef]
- Li, H.; Zhang, G.; Zhao, Z.; Li, K. Effects of Different Herbage on Soil Quality Characteristics of Non-Irrigated Apple Orchard in Weibei Loess Plateau. Sci. Agric. Sin. 2008, 7, 2070–2076. [Google Scholar] [CrossRef]
- Zhang, X.; Li, H.; Zhao, G.; Zhao, Z. Effects of Interplanting Different Herbageon Soil Moisture in Apple Orchards of Weibei Plateau. J. Northwest For. Univ. 2005, 3, 56–59. [Google Scholar] [CrossRef]
- Huang, J.; Wang, J.; Zhao, X.; Wu, P.; Qi, Z.; Li, H. Effects of permanent ground cover on soil moisture in jujube orchards under sloping ground: A simulation study. Agric. Water Manag. 2014, 138, 68–77. [Google Scholar] [CrossRef]
- Hernández, A.; Lacasta, C.; Pastor, J. Effects of different management practices on soil conservation and soil water in a rainfed olive orchard. Agric. Water Manag. 2005, 77, 232–248. [Google Scholar] [CrossRef]
- Qian, X.; Gu, J.; Pan, H.-J.; Zhang, K.-Y.; Sun, W.; Wang, X.-J.; Gao, H. Effects of living mulches on the soil nutrient contents, enzyme activities, and bacterial community diversities of apple orchard soils. Eur. J. Soil Biol. 2015, 70, 23–30. [Google Scholar] [CrossRef]
- Ren, J.; Li, F.; Yin, C. Orchard grass safeguards sustainable development of fruit industry in China. J. Clean. Product. 2023, 382, 135291. [Google Scholar] [CrossRef]
- Xiang, Y.; Li, Y.; Liu, Y.; Zhang, S.; Yue, X.; Yao, B.; Xue, J.; Lv, W.; Zhang, L.; Xu, X.; et al. Factors shaping soil organic carbon stocks in grass covered orchards across China: A meta-analysis. Sci. Total Environ. 2022, 807, 150632. [Google Scholar] [CrossRef] [PubMed]
- Yang, J.; Duan, Y.; Zhang, R.; Liu, C.; Wang, Y.; Li, M.; Ding, Y.; Awasthi, M.; Li, H. Connecting soil dissolved organic matter to soil bacterial community structure in a long-term grass-mulching apple orchard. Ind. Crops Prod. 2020, 149, 112344. [Google Scholar] [CrossRef]
- Suo, G.-D.; Xie, Y.-S.; Zhang, Y.; Luo, H. Long-term effects of different surface mulching techniques on soil water and fruit yield in an apple orchard on the Loess Plateau of China. Sci. Hortic. 2019, 246, 643–651. [Google Scholar] [CrossRef]
- Fang, K.; Li, H.; Wang, Z.; Dua, Y.; Wang, J. Comparative analysis on spatial variability of soil moisture under different land use types in orchard. Sci. Hortic. 2016, 207, 65–72. [Google Scholar] [CrossRef]
- Li, H.; Zhang, G.; Zhao, Z.; Li, K. Effects of interplanted herbage on soil properties of nonirrigated apple orchards in the Loess Plateau. Acta Prat. Sin. 2007, 2, 32–39. [Google Scholar] [CrossRef]
- Du, S.; Bai, G.; Yu, J. Soil properties and apricot growth under intercropping and mulching with erect milk vetch in the loess hilly-gully region. Plant Soil 2014, 390, 431–442. [Google Scholar] [CrossRef]
- Bao, S. Soil Agricultural Chemistry Analysis; China Agriculture Press: Beijing, China, 2013. [Google Scholar]
- Li, F. Forest Mensuration; China Forestry Publishing House: BeiJing, China, 2019. [Google Scholar]
- Lv, J. Study on Biomass and Carbon Absorption of Apple in the Residual Gully Area of Economic Forest Shaanxi Province. Master’s Thesis, Inner Mongolia Agricultural University, Hohhot, China, 2019. [Google Scholar]
- Junk, G.; Svec, H. The absolute abundance of the nitrogen isotopes in the atmosphere and compressed gas from various sources. Geochim. Et Cosmochim. Acta 1958, 14, 234–243. [Google Scholar] [CrossRef]
- Ling, Q.; Gao, X.; Zhao, X.; Huang, J.; Li, H.; Li, L.; Sun, W.; Wu, P. Soil water effects of agroforestry in rainfed jujube (Ziziphus jujube Mill.) orchards on loess hillslopes in Northwest China. Agric. Ecosyst. Environ. 2017, 247, 343–351. [Google Scholar] [CrossRef]
- Shi, J.; Xun, M.; Song, J.; Zhang, W.; Fan, W.; Yang, H. Regulation effects of carbonized apple branches on absorption, distribution, and utilization of 15N single-labeled ammonium nitrate 15NH4NO3 or NH415NO3) in Malus hupehensis. Plant Physiol Biochem 2022, 186, 197–206. [Google Scholar] [CrossRef] [PubMed]
- Peng, L.; Wen, Z.; An, X.; Jiang, H.; Jiang, Y. Effects of Interplanting grass on utilization, loss and accumulation of 15N in apple orchard. Acta Pedol. Sin. 2015, 52, 901143. [Google Scholar] [CrossRef]
- Zheng, Z.; Wang, Y.; Gong, Q.; Zheng, W.; Zhao, Z.; Zhai, B.; Han, M. Absorption, distribution and utilization of soil applied 15N-urea in young dwarf rootstock ‘Fuji’ apple trees. J. Plant Nutr. Fert. 2018, 24, 237–244. [Google Scholar] [CrossRef]
- Ge, S.; Jiang, Y.; Wei, S.; Fang, X. Nitrogen balance under different nitrogen application rates in young apple orchards. J. Plant Nutr. Fert. 2011, 17, 949–955. [Google Scholar] [CrossRef]
- Zhao, L.; Gao, X.; He, N.; Zhao, X. Ecohydrological advantage of young apple tree-based agroforestry and its response to extreme droughts on the semiarid Loess Plateau. Agric. For. Meteorol. 2022, 321, 108969. [Google Scholar] [CrossRef]
- Delpuech, X.; Metay, A. Adapting cover crop soil coverage to soil depth to limit competition for water in a Mediterranean vineyard. Eur. J. Agron. 2018, 97, 60–69. [Google Scholar] [CrossRef]
- Ramos, M.E.; Robles, A.B.; Navarro, A.; Rebollar, J. Soil responses to different management practices in rainfed orchards in semiarid environments. Soil Till. Res. 2011, 112, 85–91. [Google Scholar] [CrossRef]
- Virk, A.L.; Lin, B.-J.; Kan, Z.-R.; Qi, J.-Y.; Dang, Y.P.; Lal, R.; Zhao, X.; Zhang, H.-L. Simultaneous effects of legume cultivation on carbon and nitrogen accumulation in soil. Adv. Agron. 2022, 171, 75–110. [Google Scholar] [CrossRef]
- Wen, Z. The Influence of Planting Alfalfa on The Physico-Chemical Characteristics of Soil. Master’s Thesis, Northwest A&F University, Yangling, China, 2008. [Google Scholar]
- Li, H.; Li, J.; Wang, L.; Cao, W.; Mei, L. Effects of Interspecific Interaction on the Growth and Distribution of Roots in Apple-White Clover Intercropping System. Acta Agrestia Sin. 2011, 19, 960–968. [Google Scholar]
- He, Z.; Hu, Q.; Zhang, Y.; Cao, H.; Nan, X. Effects of irrigation and nitrogen management strategies on soil nitrogen and apple yields in loess plateau of China. Agric. Water Manag. 2023, 280, 108220. [Google Scholar] [CrossRef]
- El Jaouhari, N.; Abouabdillah, A.; Bouabid, R.; Bourioug, M.; Aleya, L.; Chaoui, M. Assessment of sustainable deficit irrigation in a Moroccan apple orchard as a climate change adaptation strategy. Sci. Total Environ. 2018, 642, 574–581. [Google Scholar] [CrossRef] [PubMed]


Disclaimer/Publisher’s Note: The statements, opinions and data contained in all publications are solely those of the individual author(s) and contributor(s) and not of MDPI and/or the editor(s). MDPI and/or the editor(s) disclaim responsibility for any injury to people or property resulting from any ideas, methods, instructions or products referred to in the content. |
© 2023 by the authors. Licensee MDPI, Basel, Switzerland. This article is an open access article distributed under the terms and conditions of the Creative Commons Attribution (CC BY) license (https://creativecommons.org/licenses/by/4.0/).