
RepC-MVSNet: A Reparameterized Self-Supervised 3D Reconstruction Algorithm for Wheat 3D Reconstruction
 , ,
, ,
Abstract
1. Introduction
- (1)
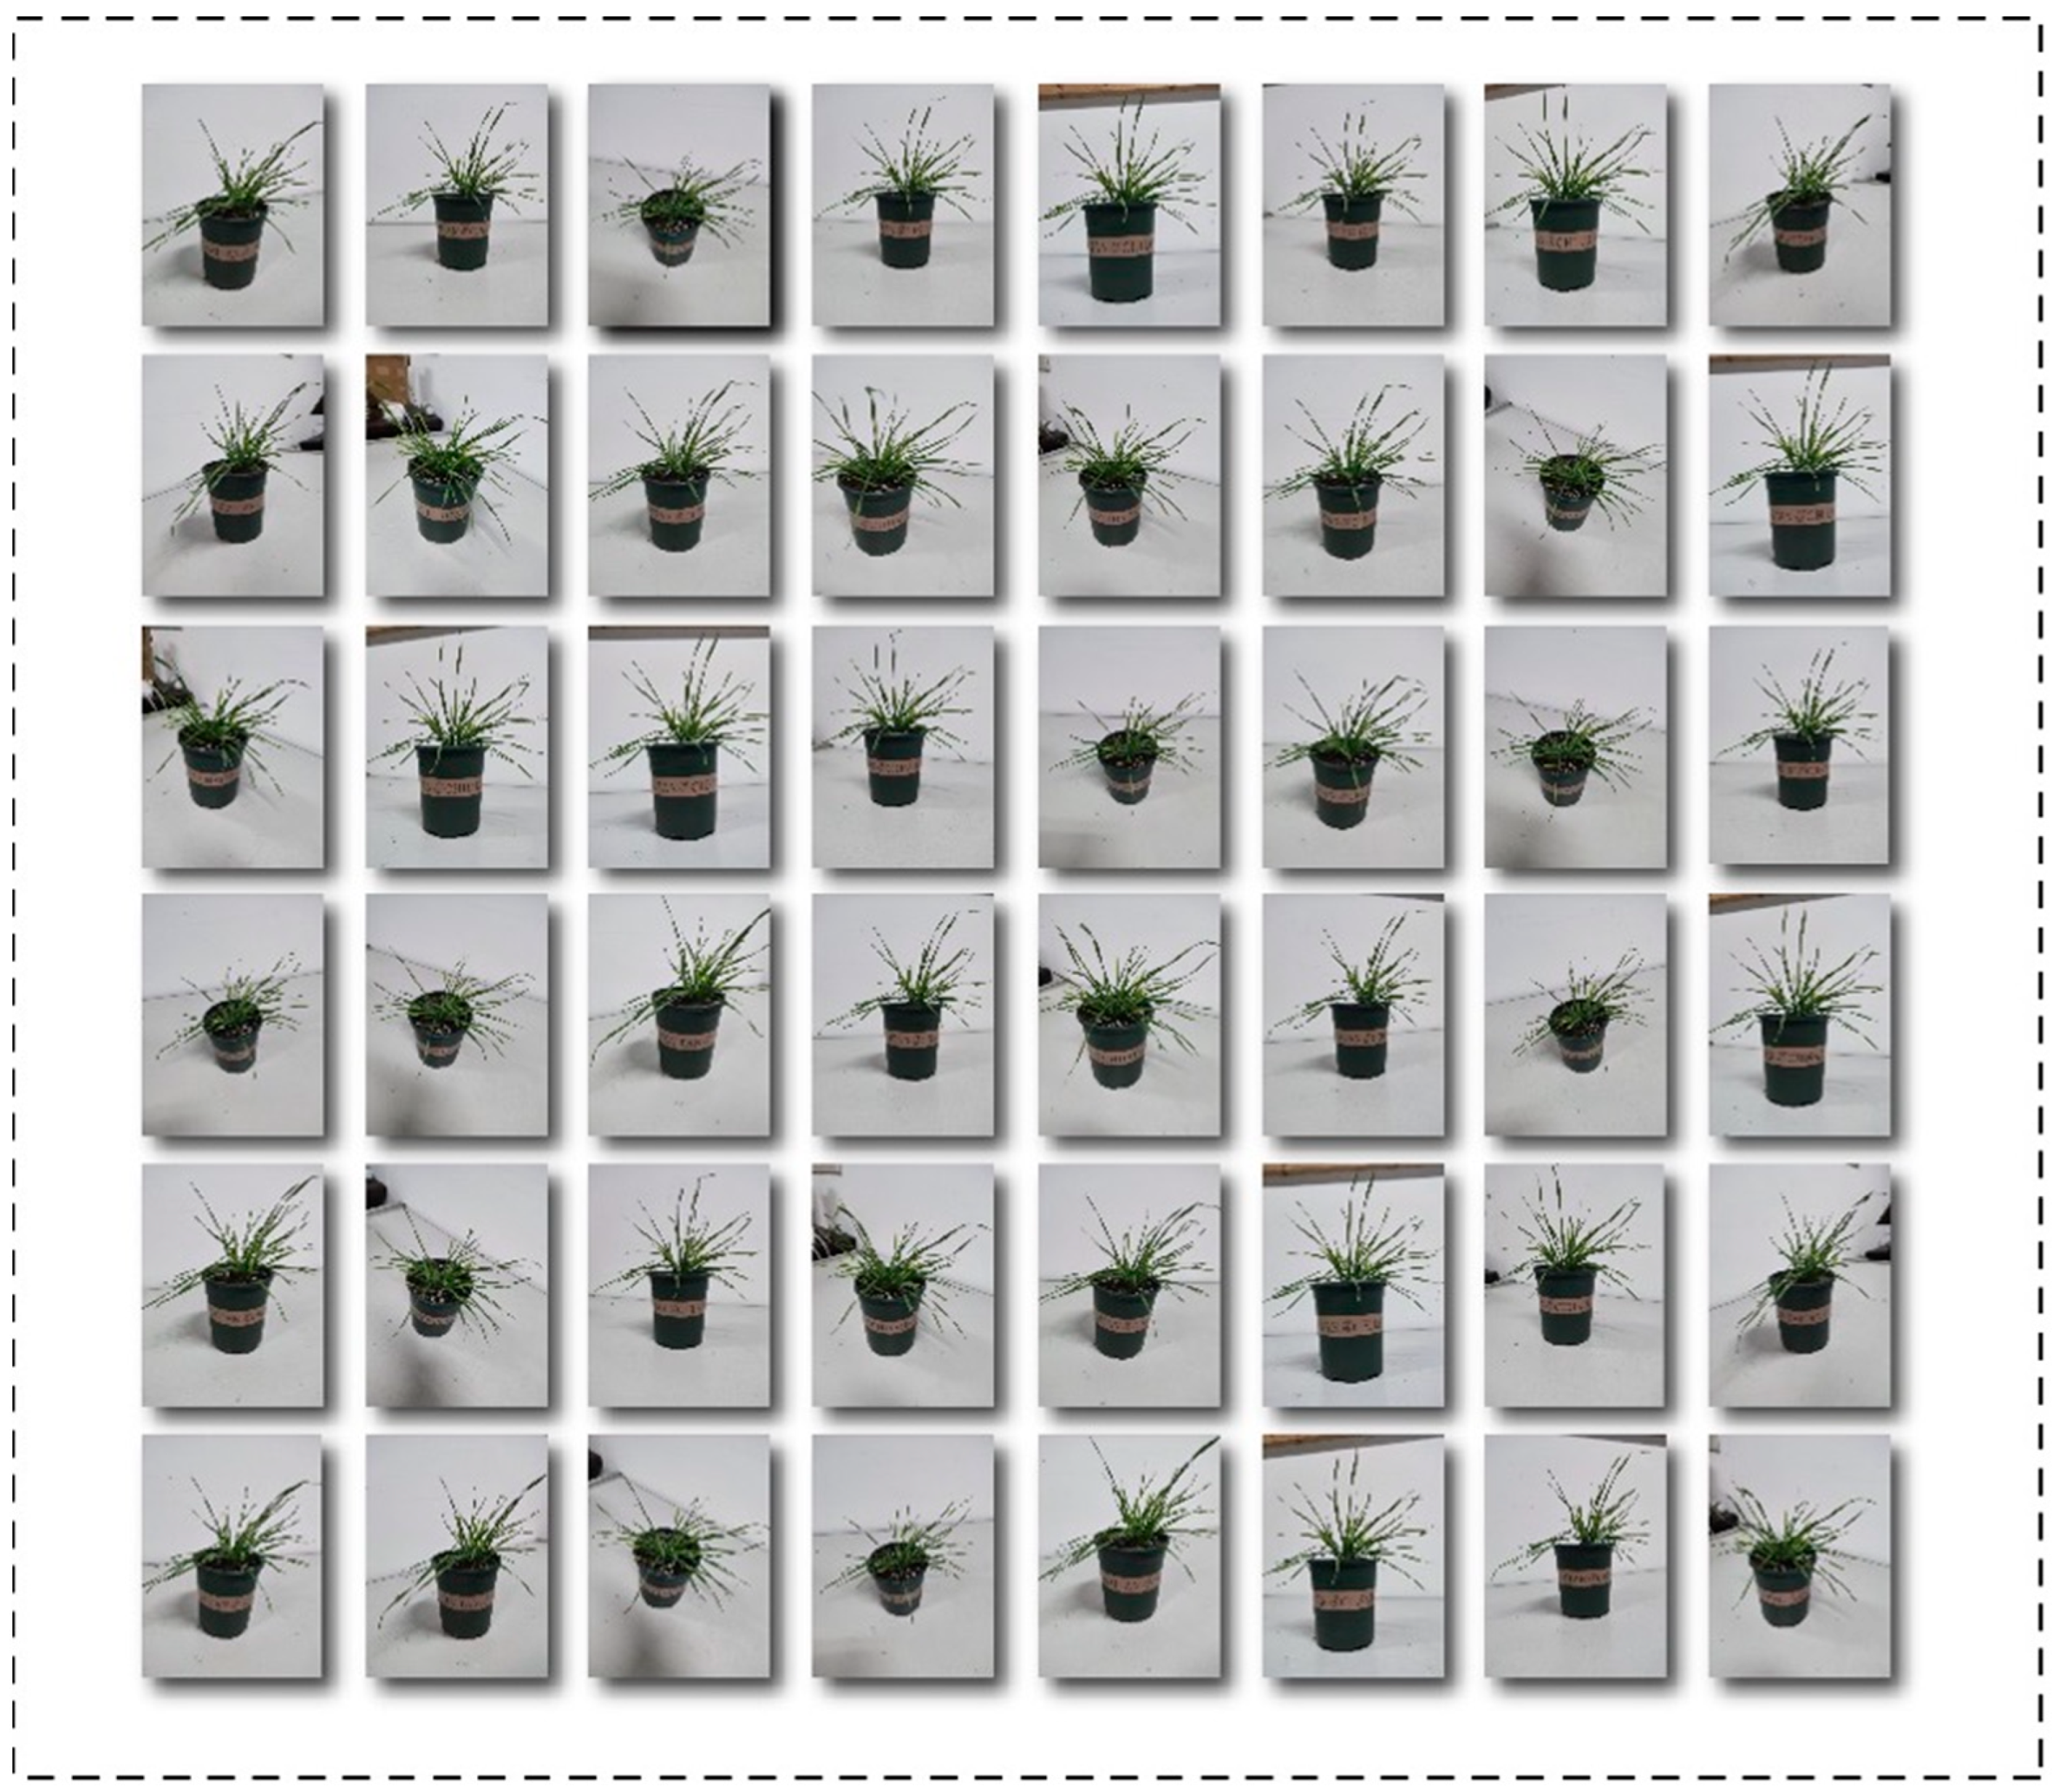
- This paper takes wheat as the research object and constructs a wheat point cloud generation dataset based on multi-view images to complete phenotypic analysis and 3D reconstruction for wheat and accelerate the research and breeding process.
- (2)
- We propose an integrated framework for non-contact, multi-view 3D reconstruction based on SfM and MVS and introduce various optimization and adjustment strategies to enhance the network performance. The camera parameter matrix information of wheat images was estimated using a structure-from-motion system, which solves the problems of the high cost of data acquisition and easy damage to plant phenotypes caused by previous devices.
- (3)
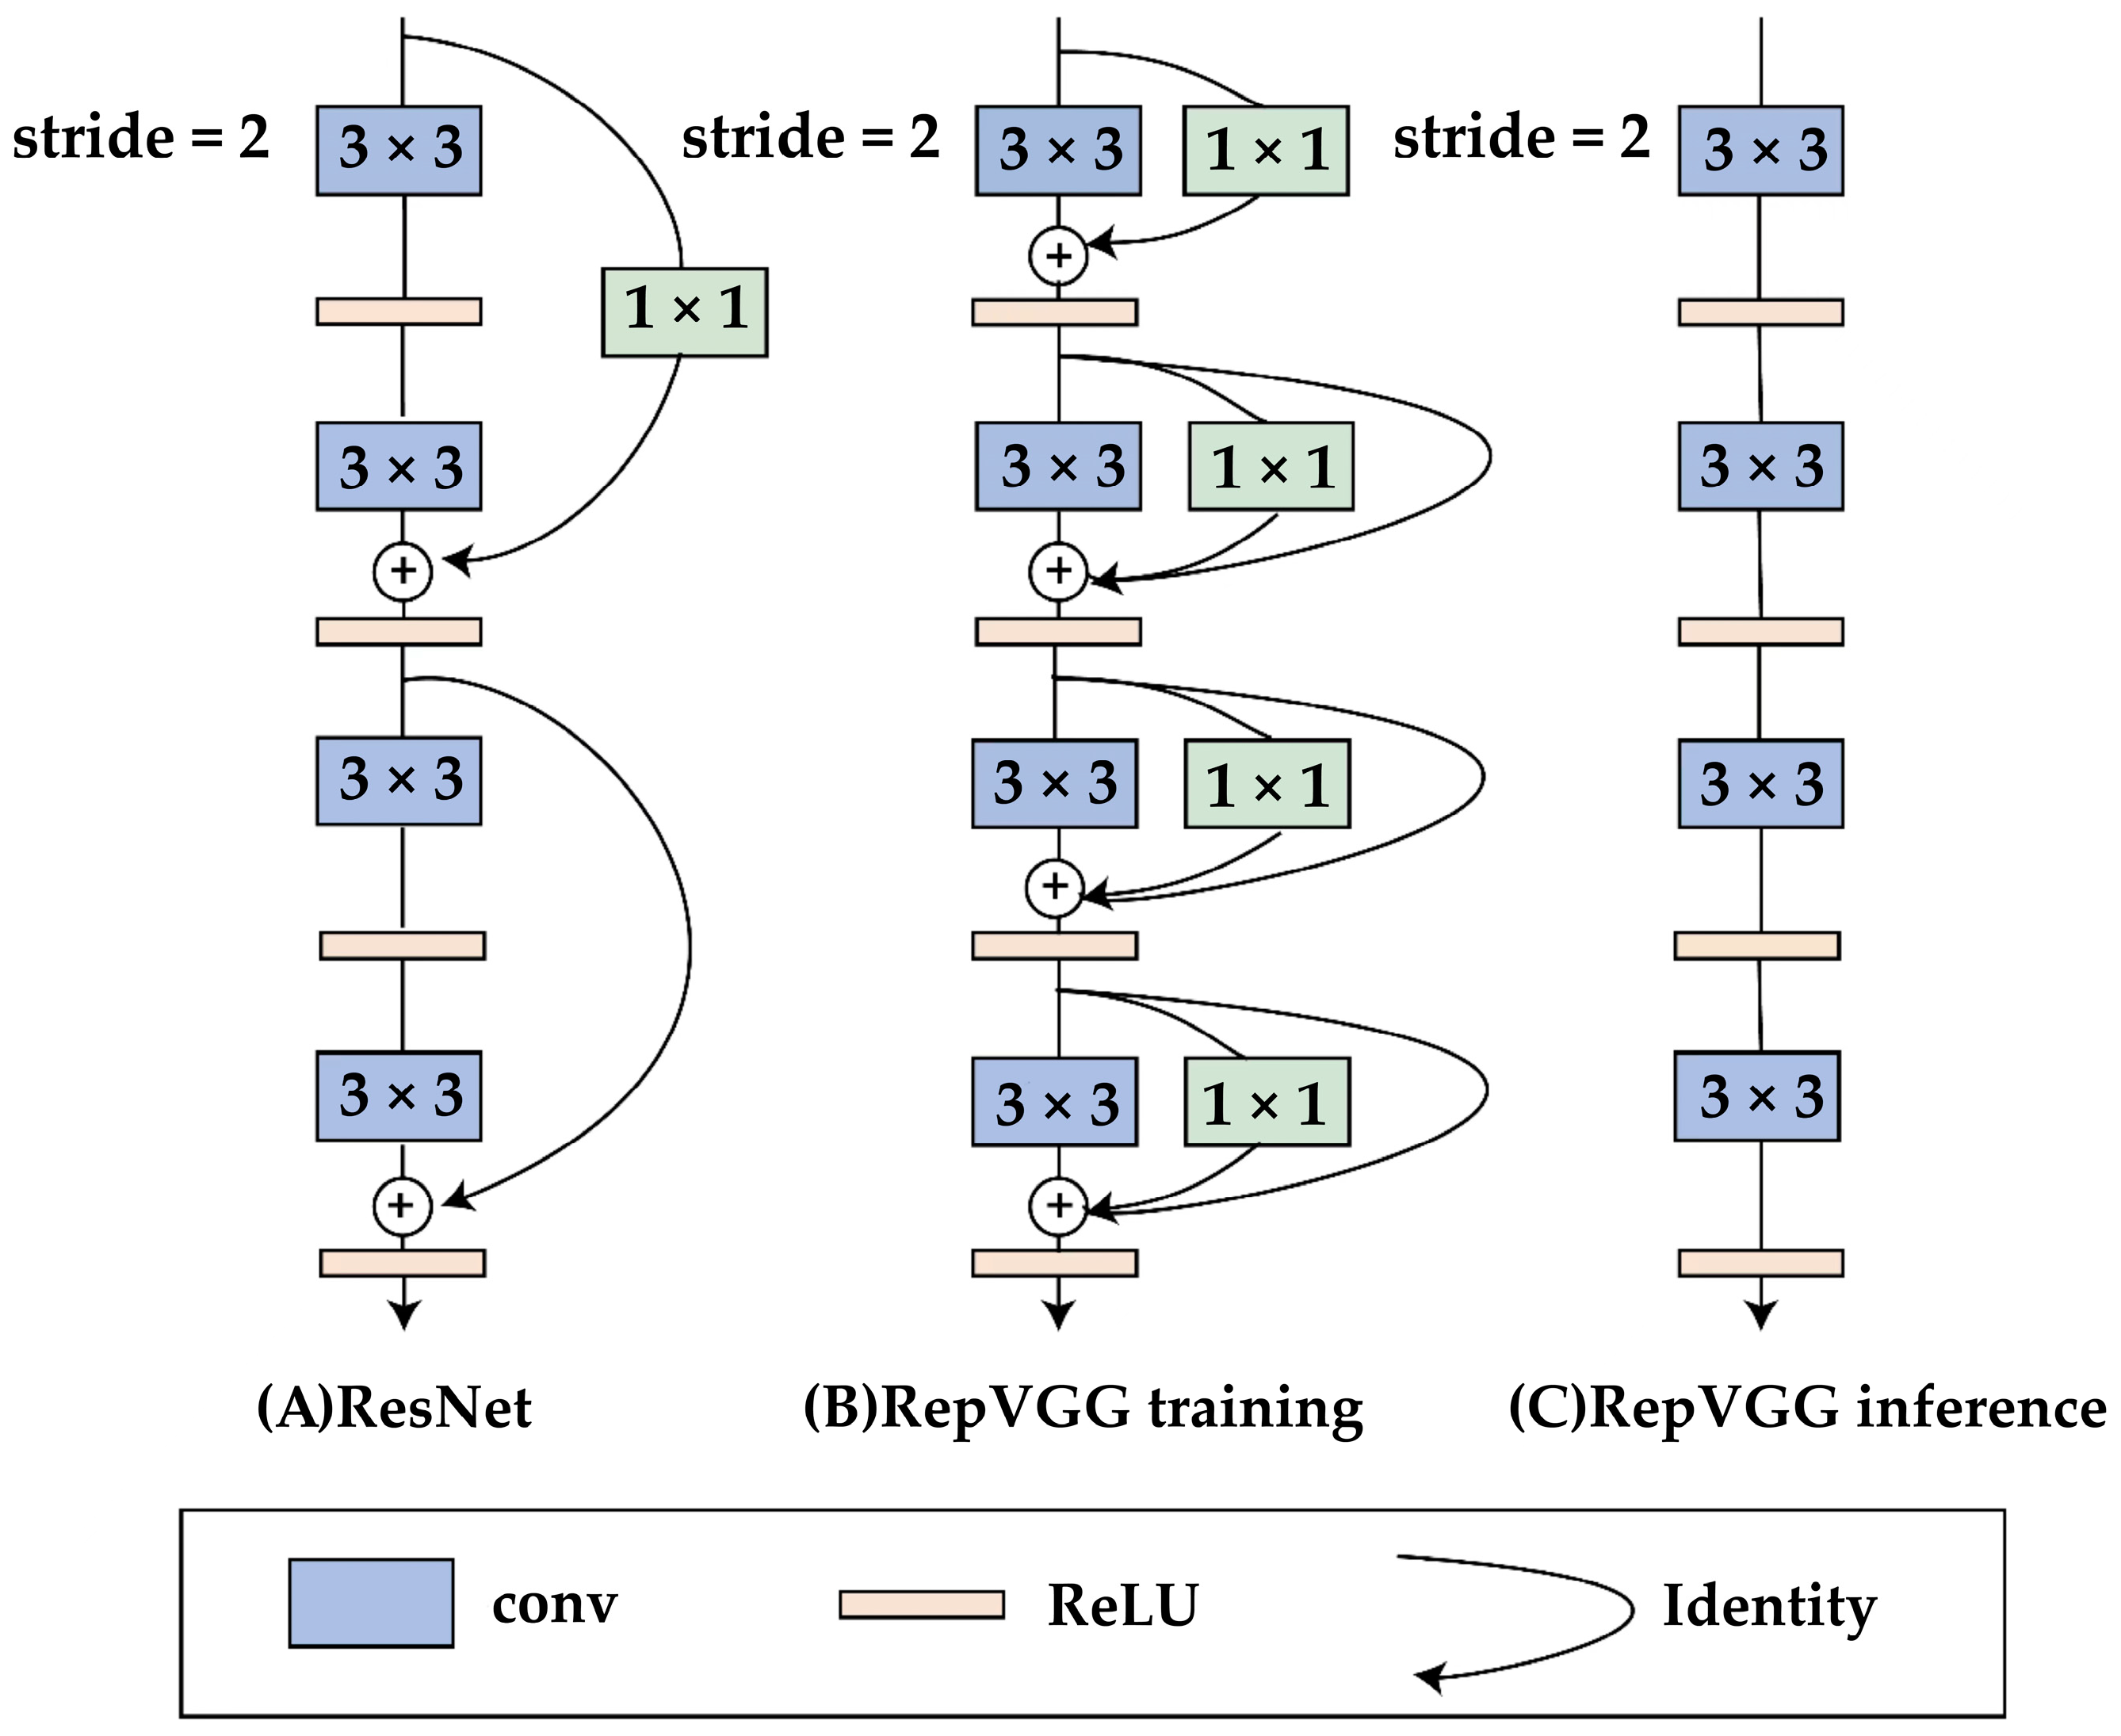
- We propose the RepC-MVSNet model, which incorporates the RepVGG module decoupled training and inference architecture to enhance the extraction of complex phenotypic features of wheat and can be widely applied to 3D reconstruction tasks of crops.
2. Related Work
2.1. Deep Learning
2.2. Three-Dimensional Reconstruction
2.3. Point Cloud Data
3. Materials and Methods
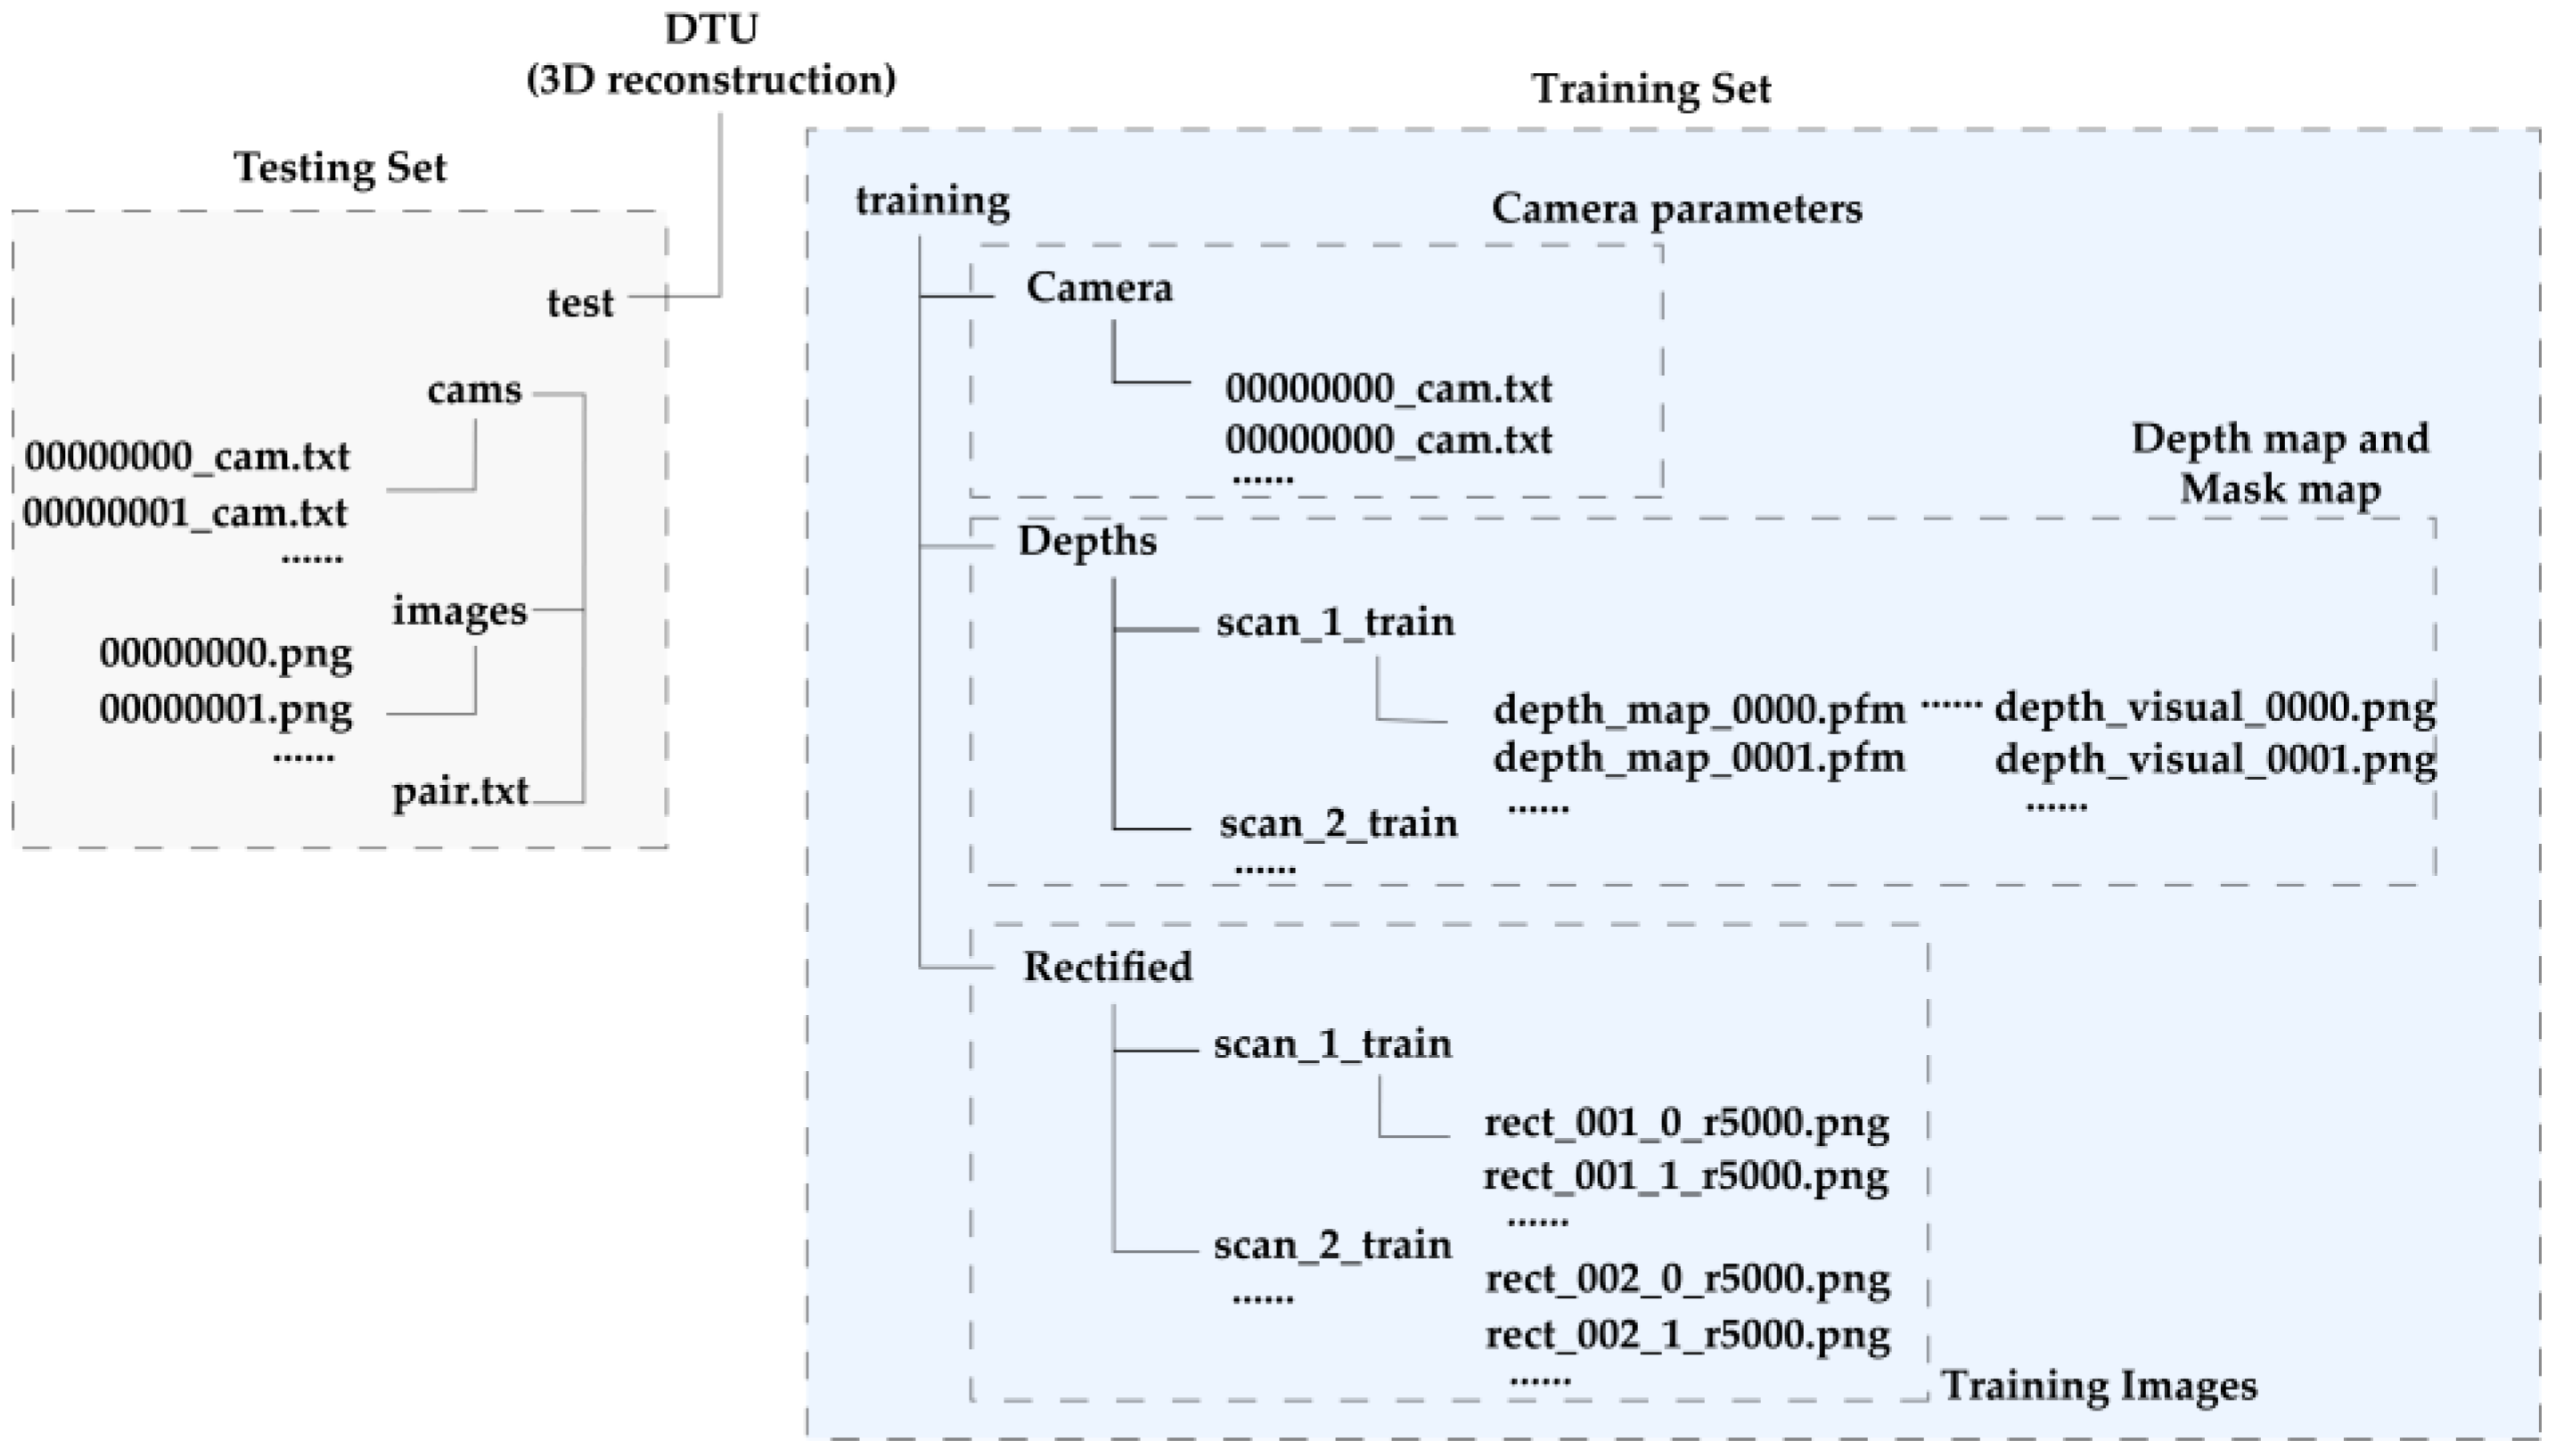
3.1. Materials
3.2. Methods
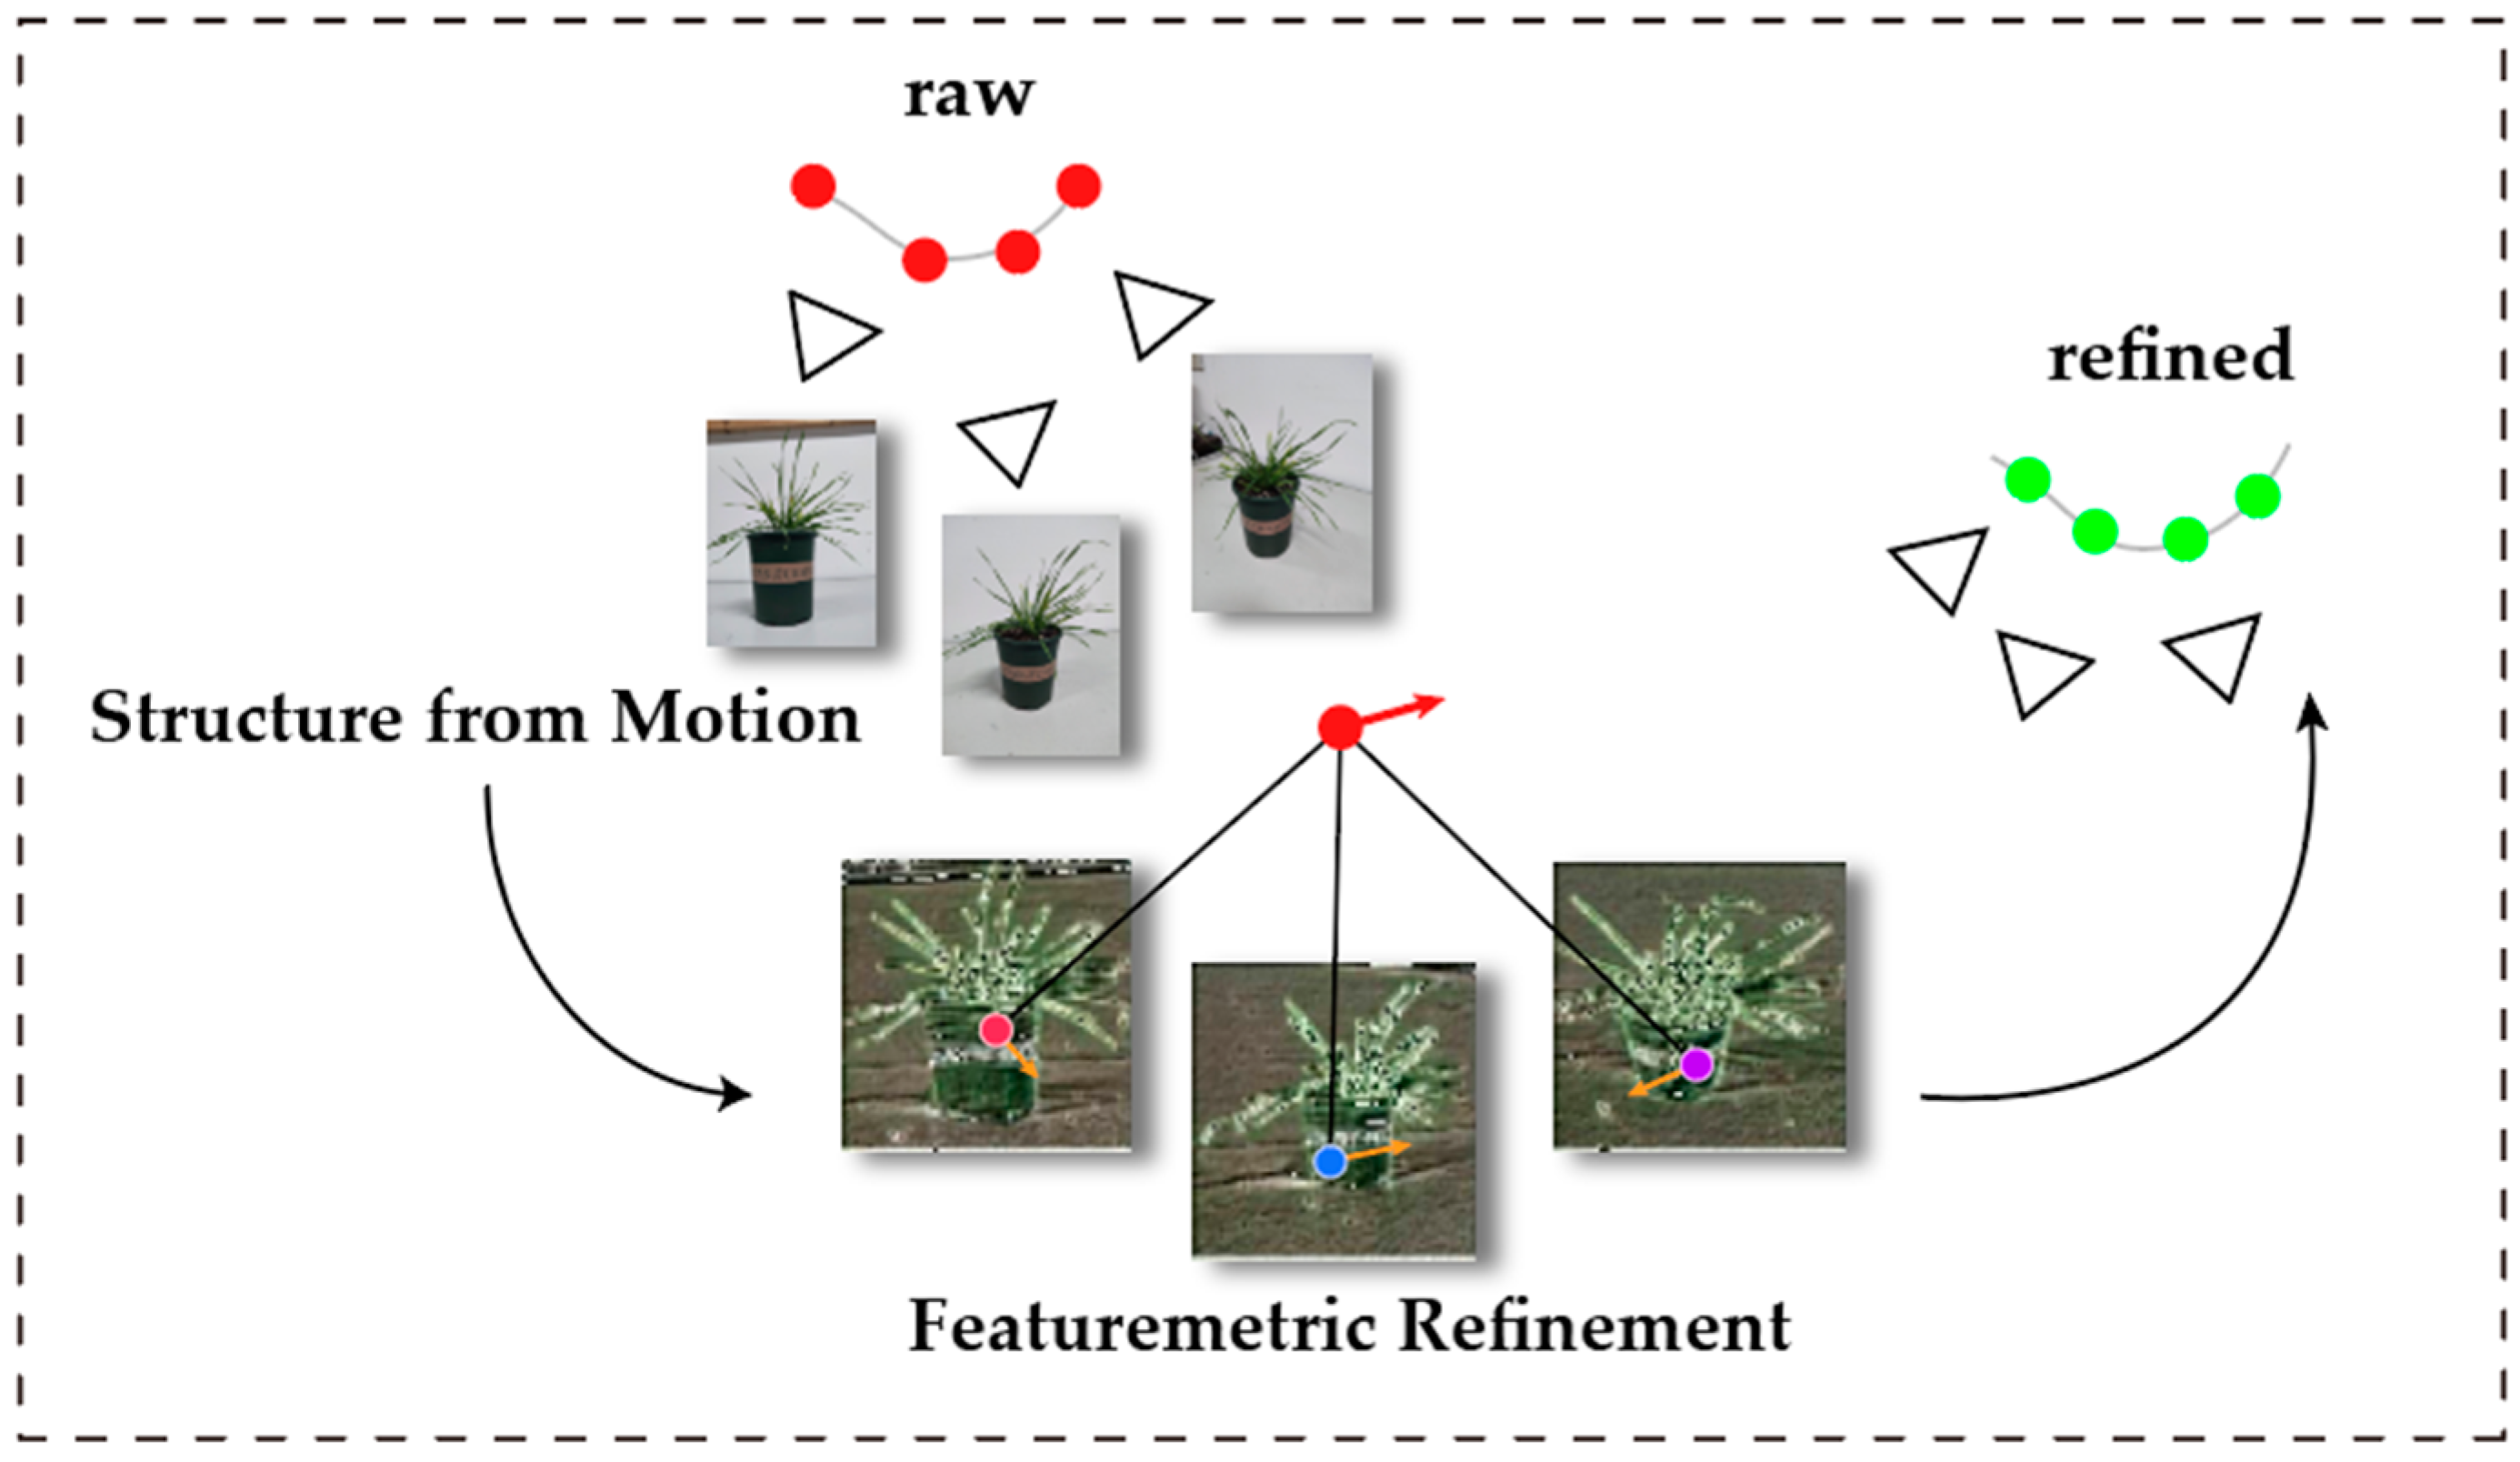
3.2.1. Structure from Motion System
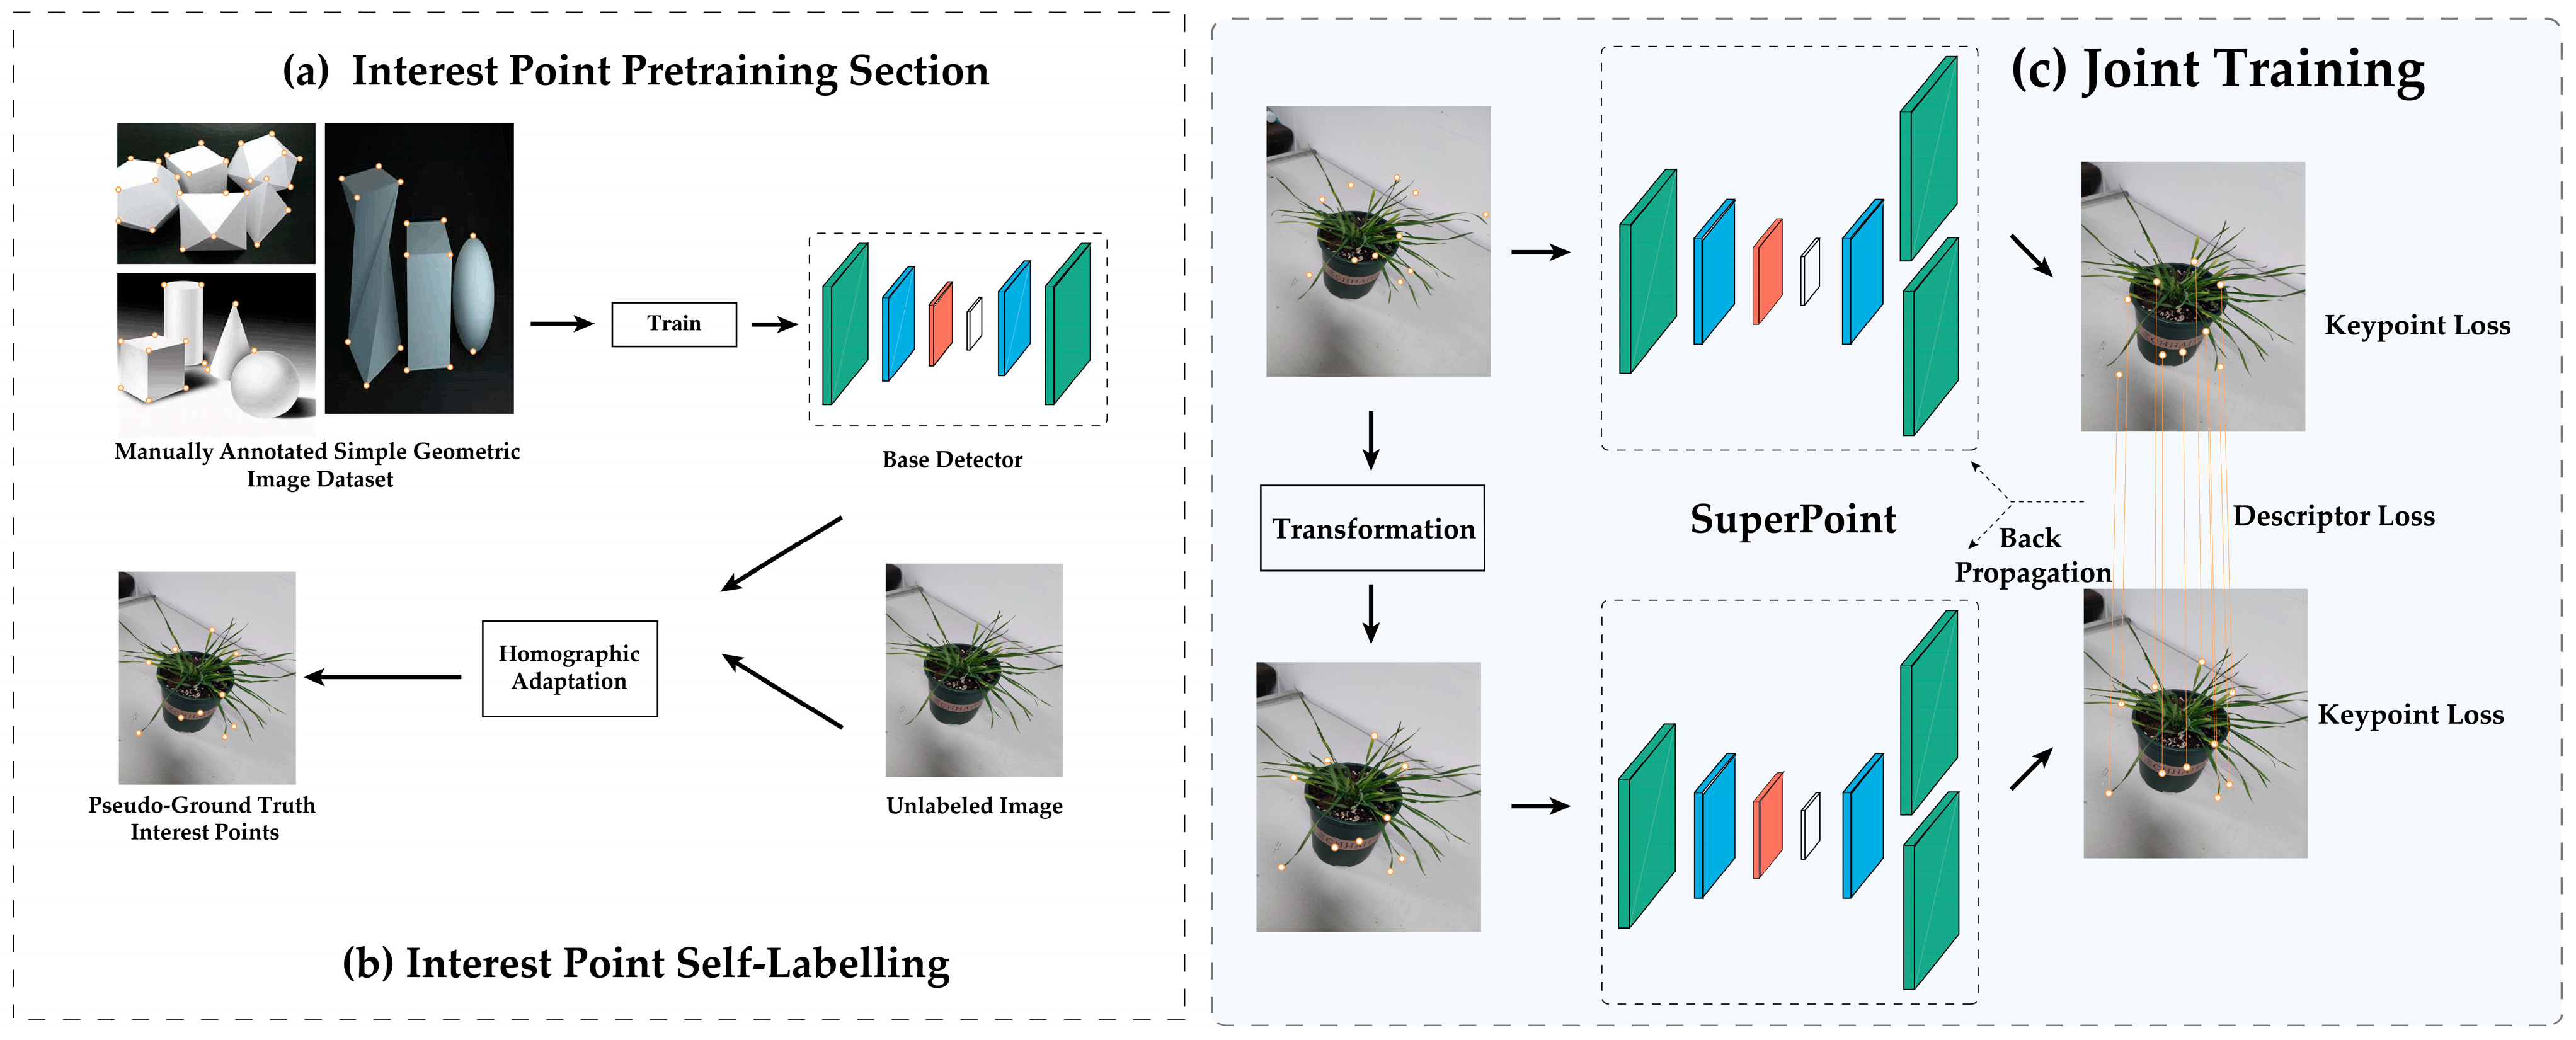
3.2.2. SfM-Based Network Camera Pose Acquisition for Wheat
- SuperPoint
- 2.
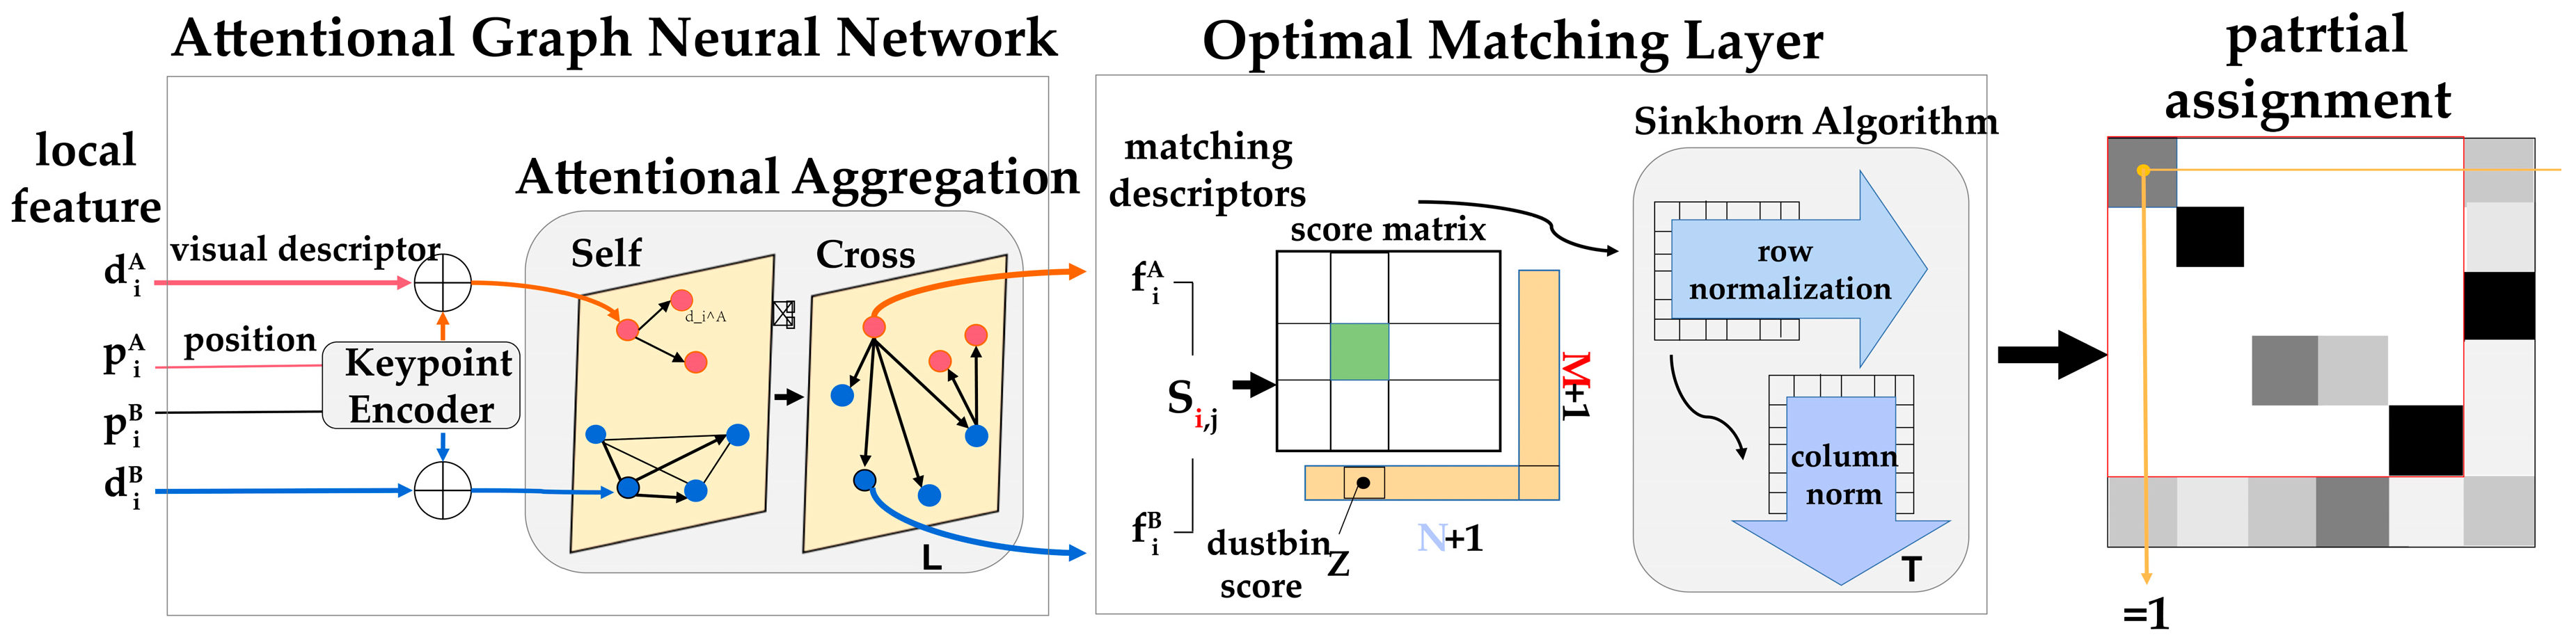
- SuperGlue
- 3.
- Featurematric Key Point Adjustment
3.2.3. MVS
3.2.4. MVS-Based Network for 3D Reconstruction
- (1)
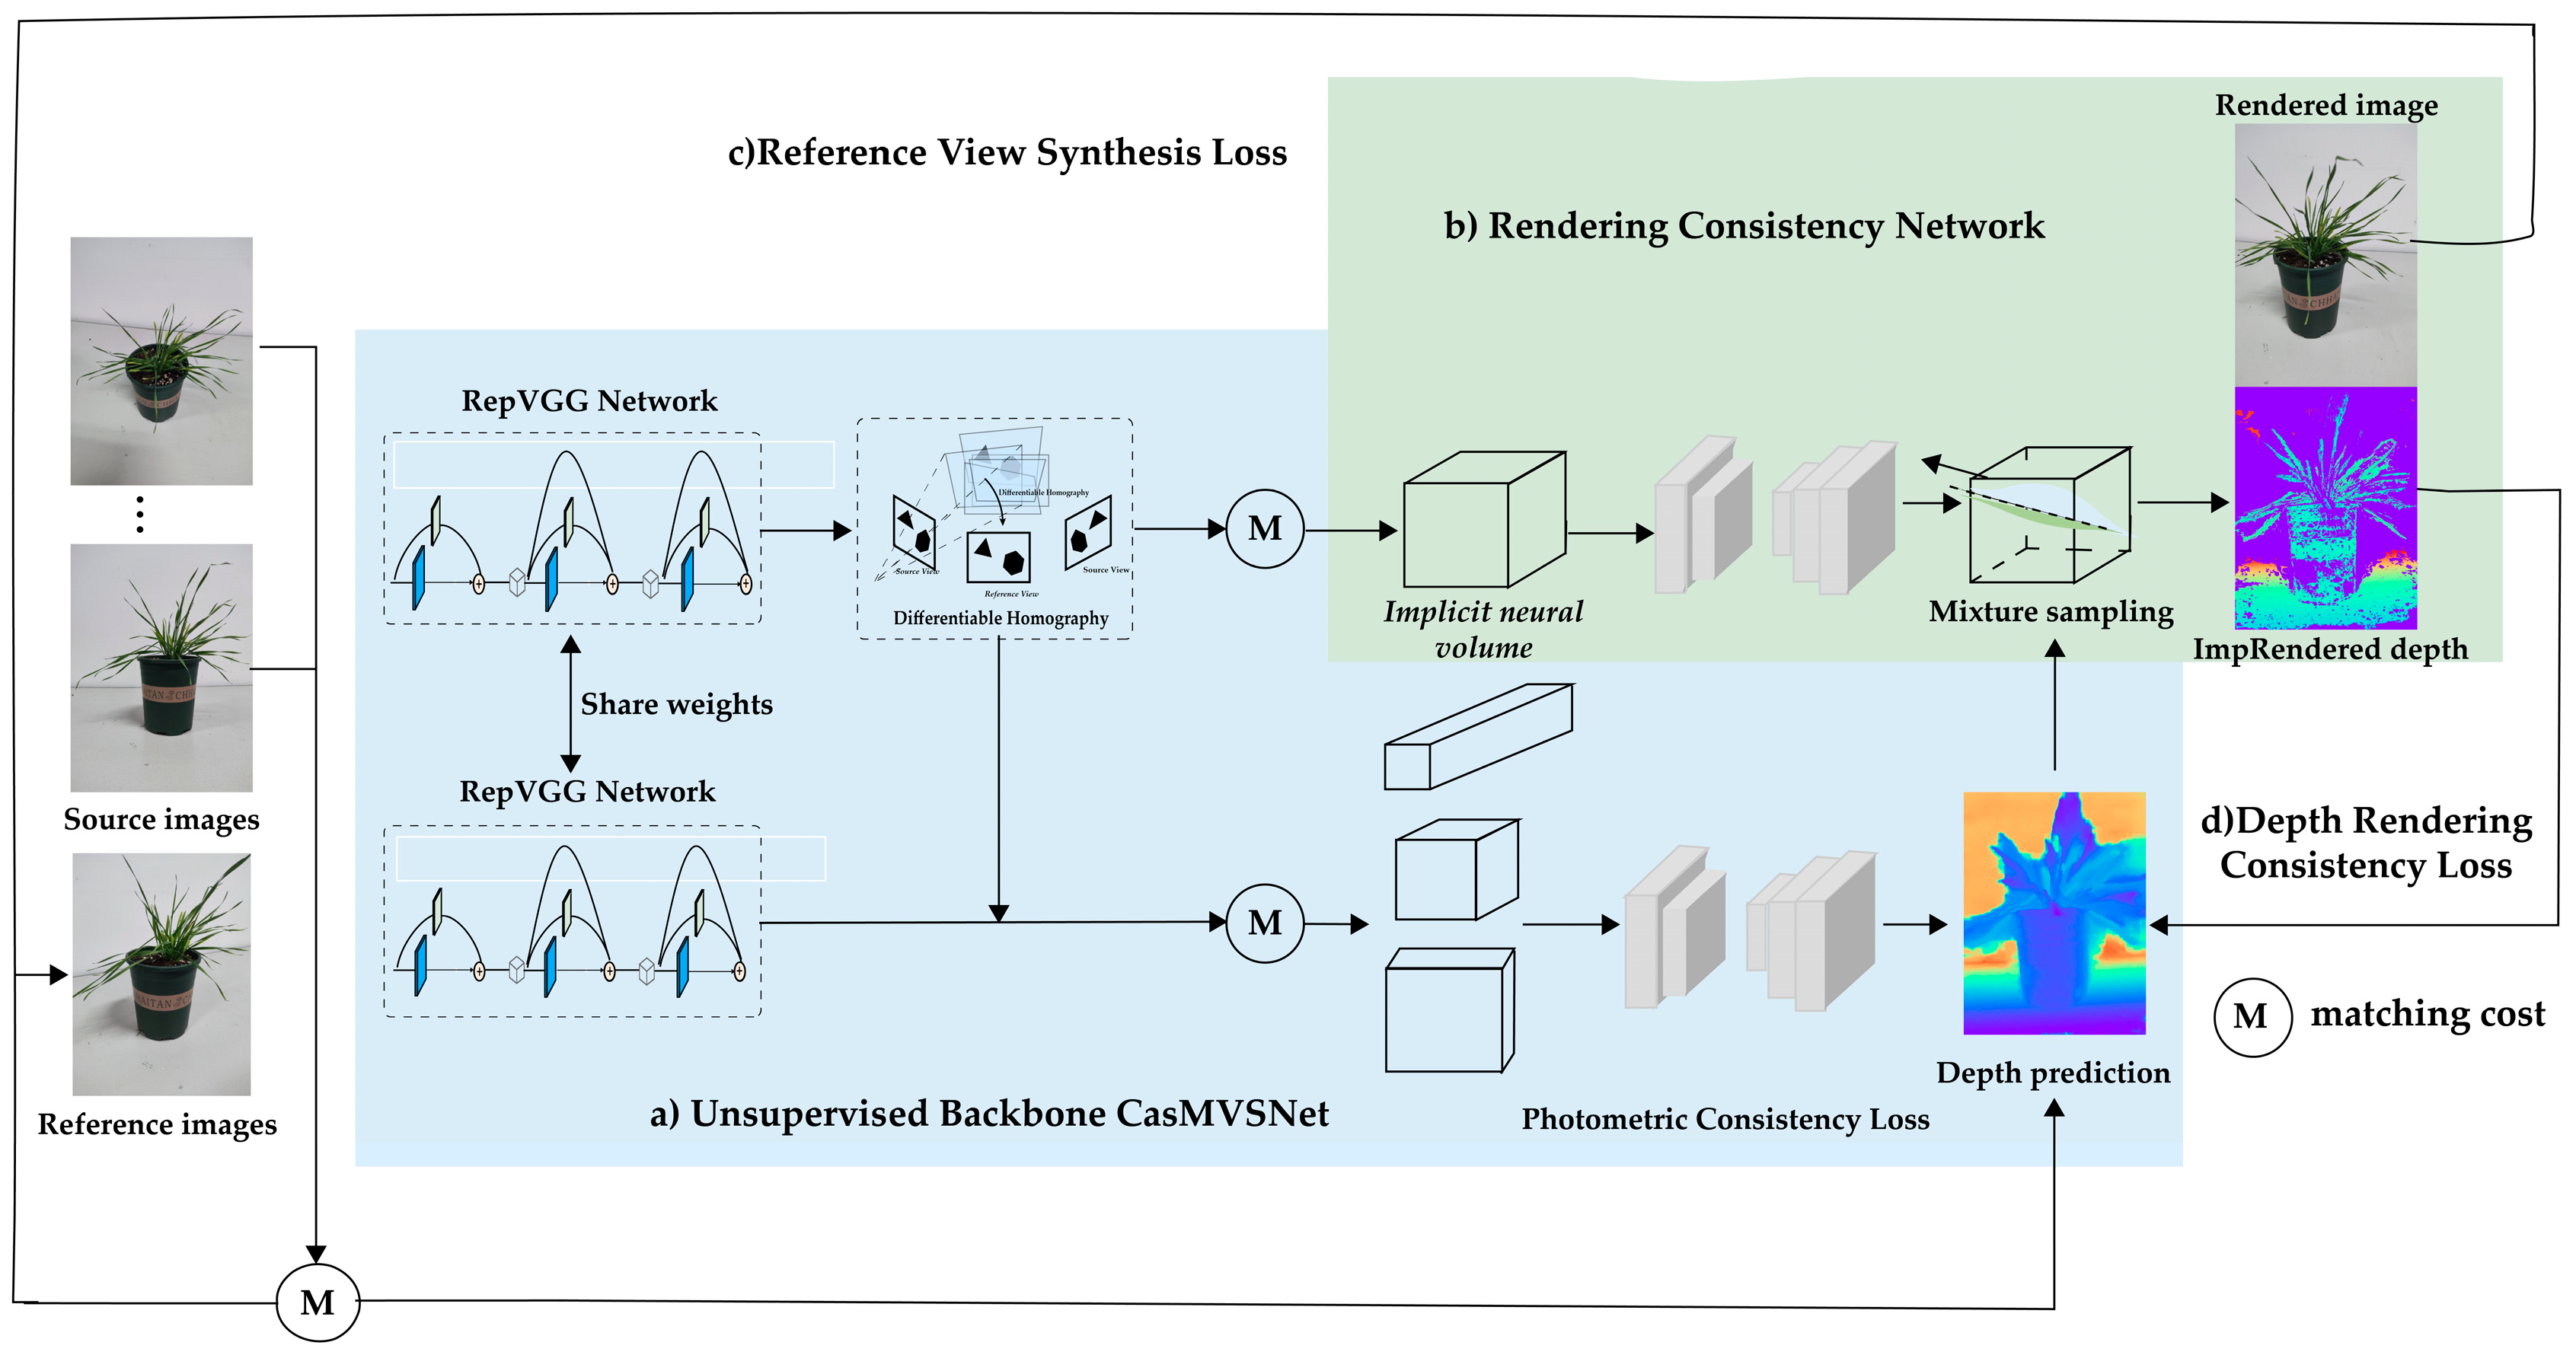
- RepC-MVSNet Network
3.2.5. Point Cloud 3D Reconstruction Scheme
4. Experiments
4.1. Experimental Details and Evaluation Indicators
4.1.1. SfM Evaluation Indicators
4.1.2. MVS Evaluation Indicators
4.2. Experimental Results
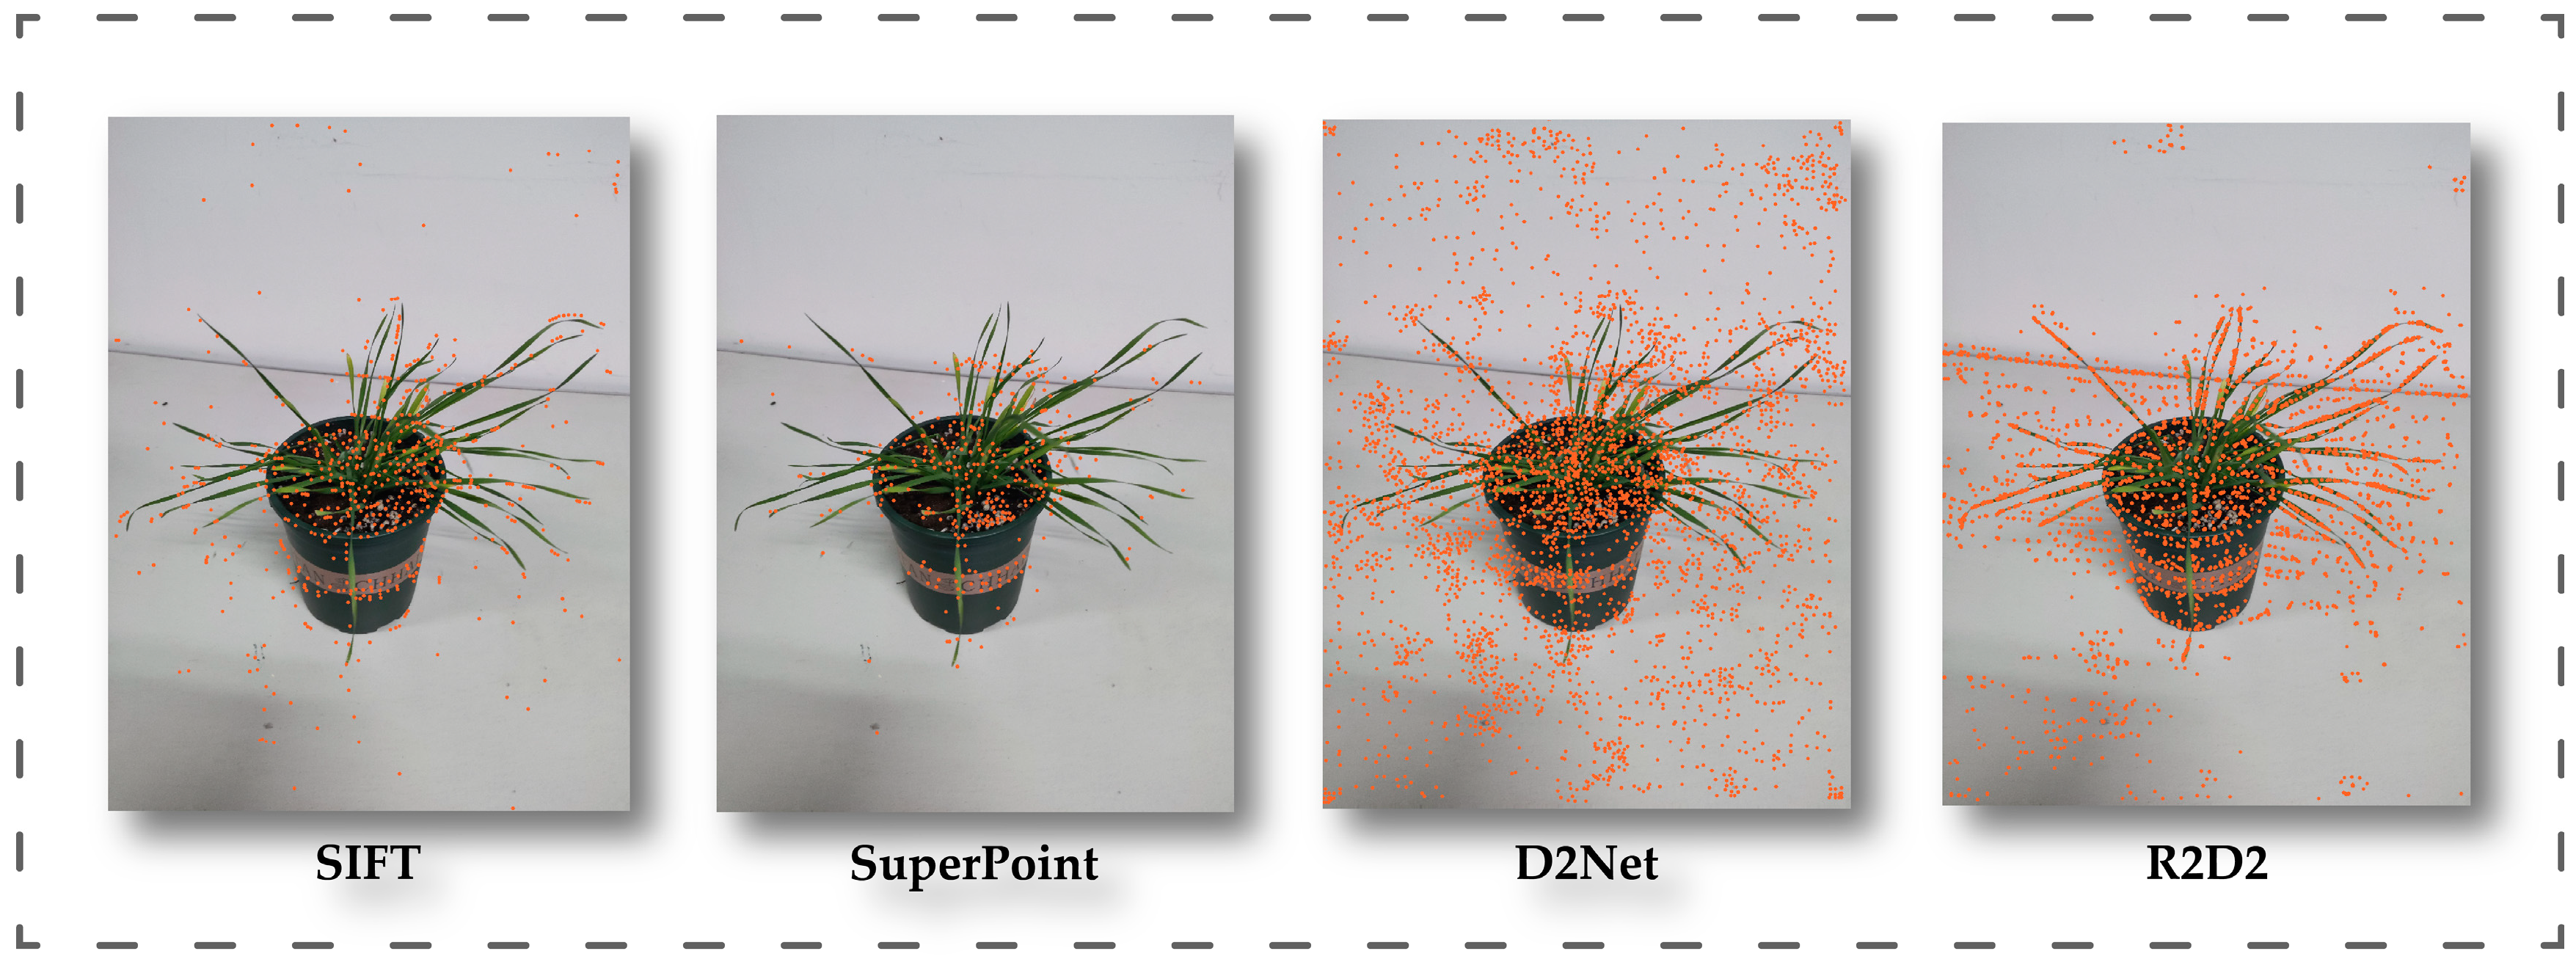
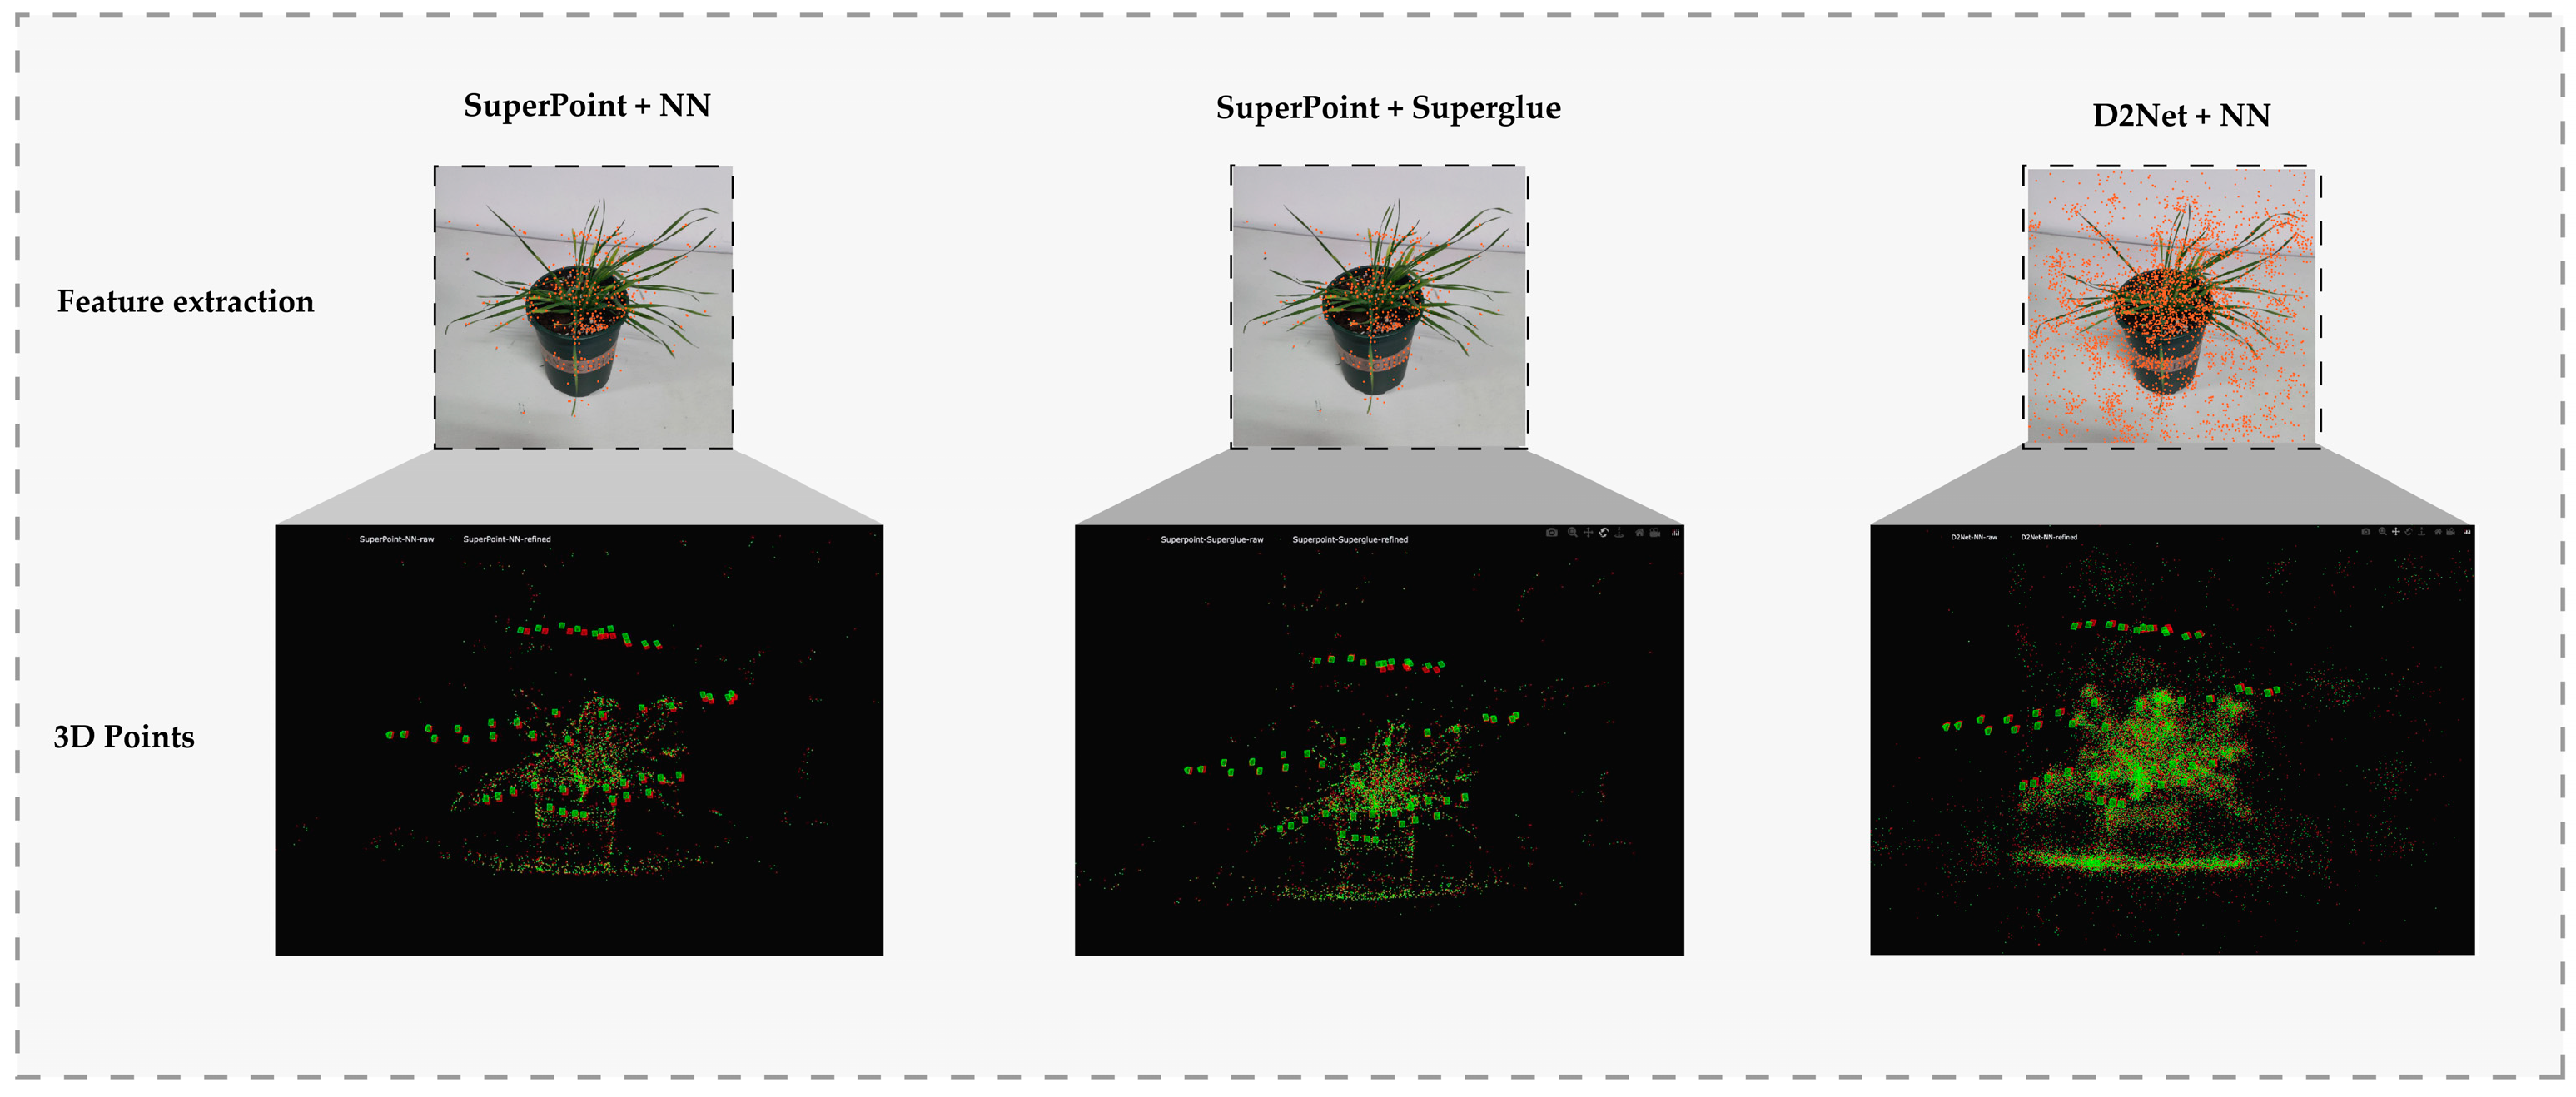
4.2.1. Feature Extraction
4.2.2. Ablation Study of SfM
4.2.3. MVS Model Evaluation
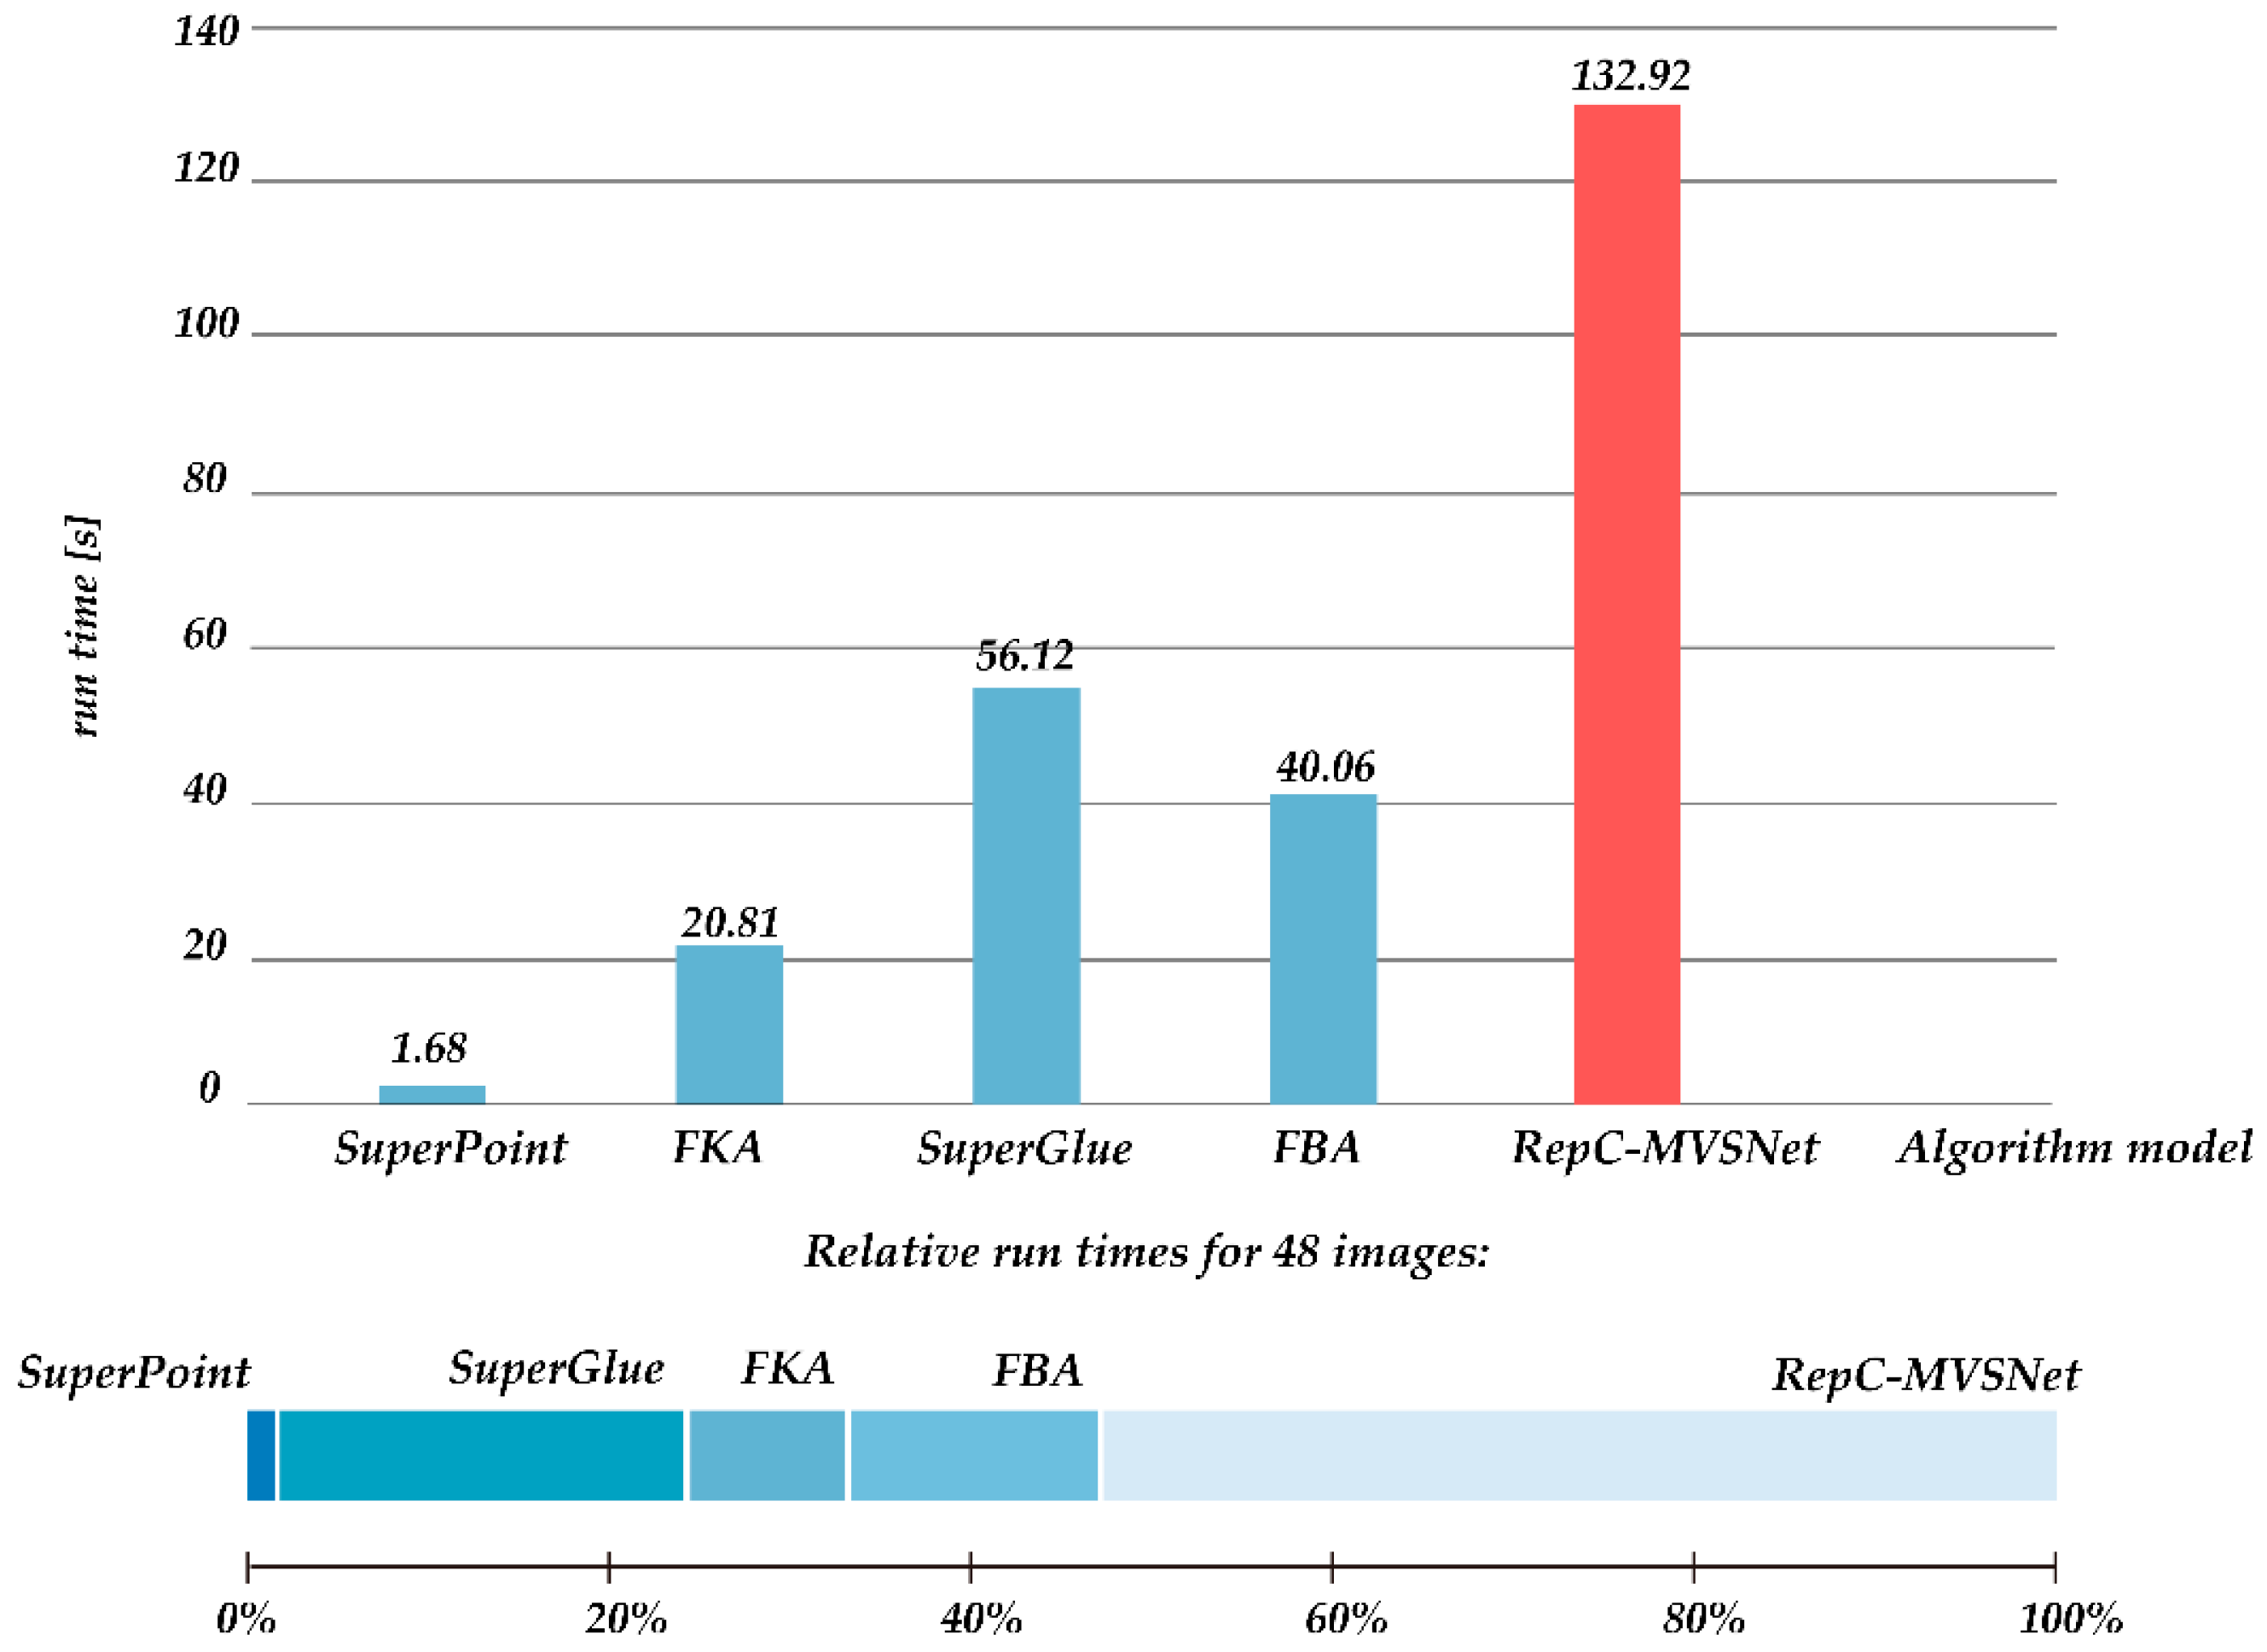
4.2.4. Time Consumption
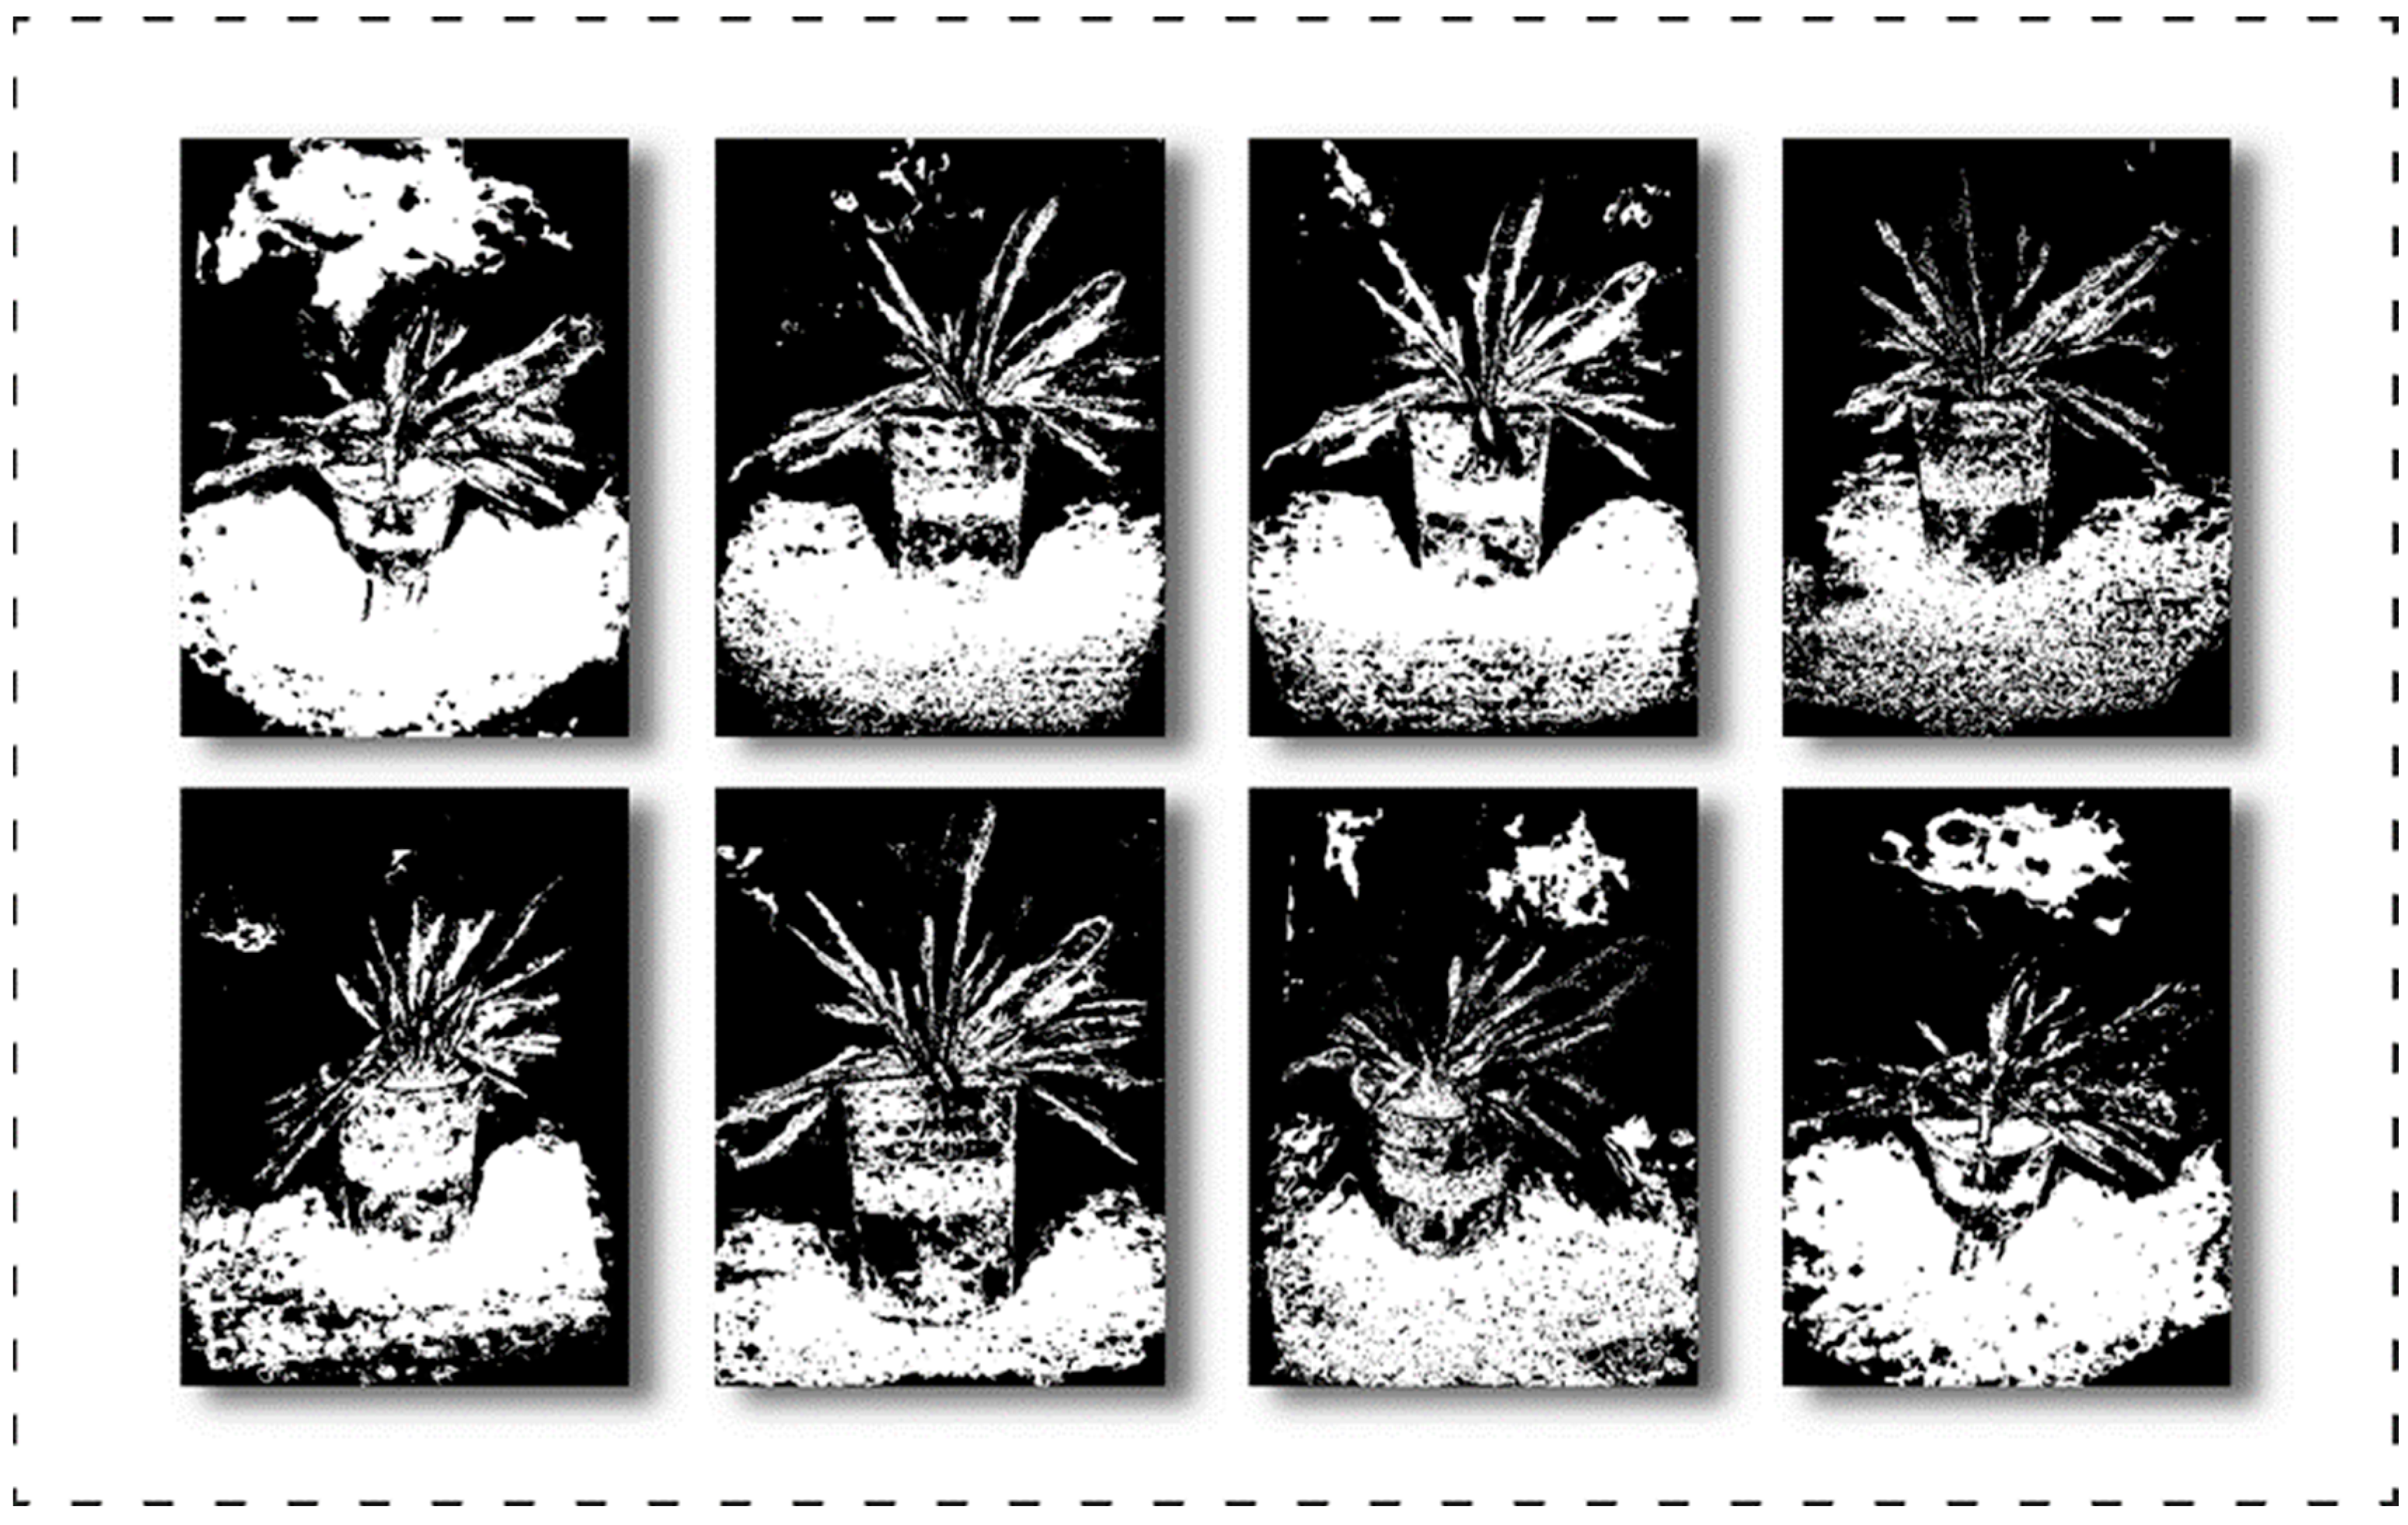
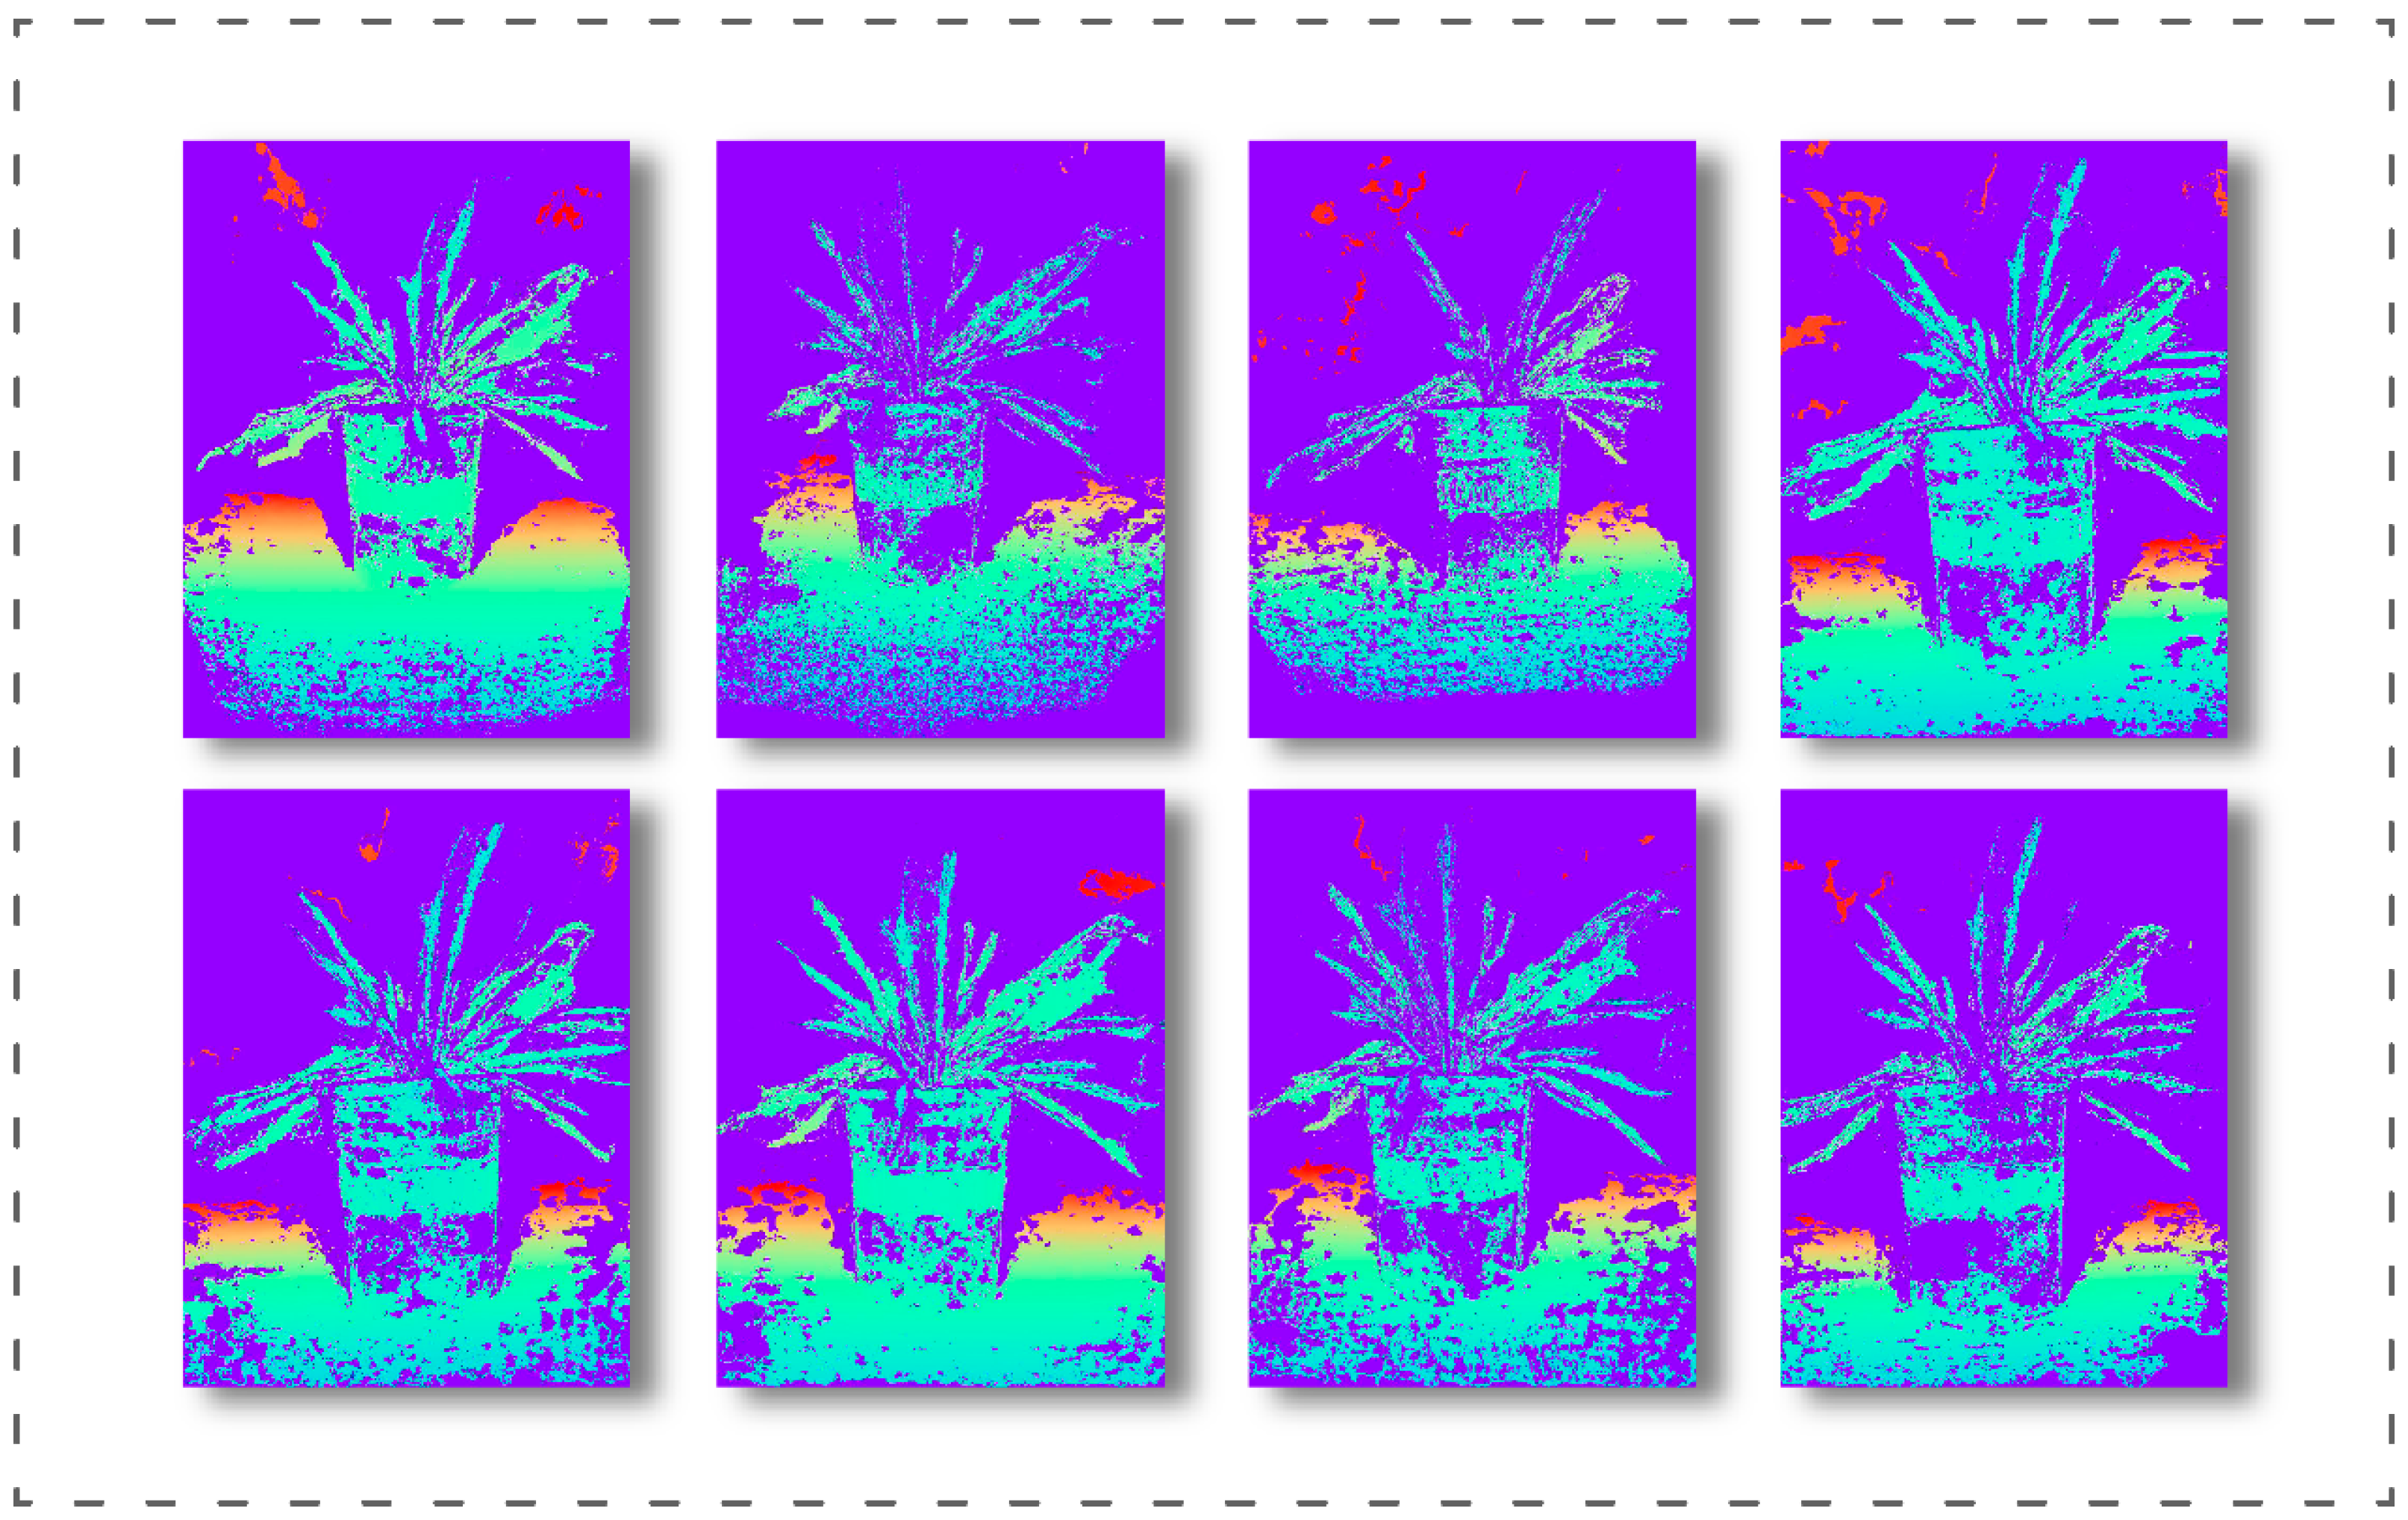
4.2.5. Depth Map for Wheat
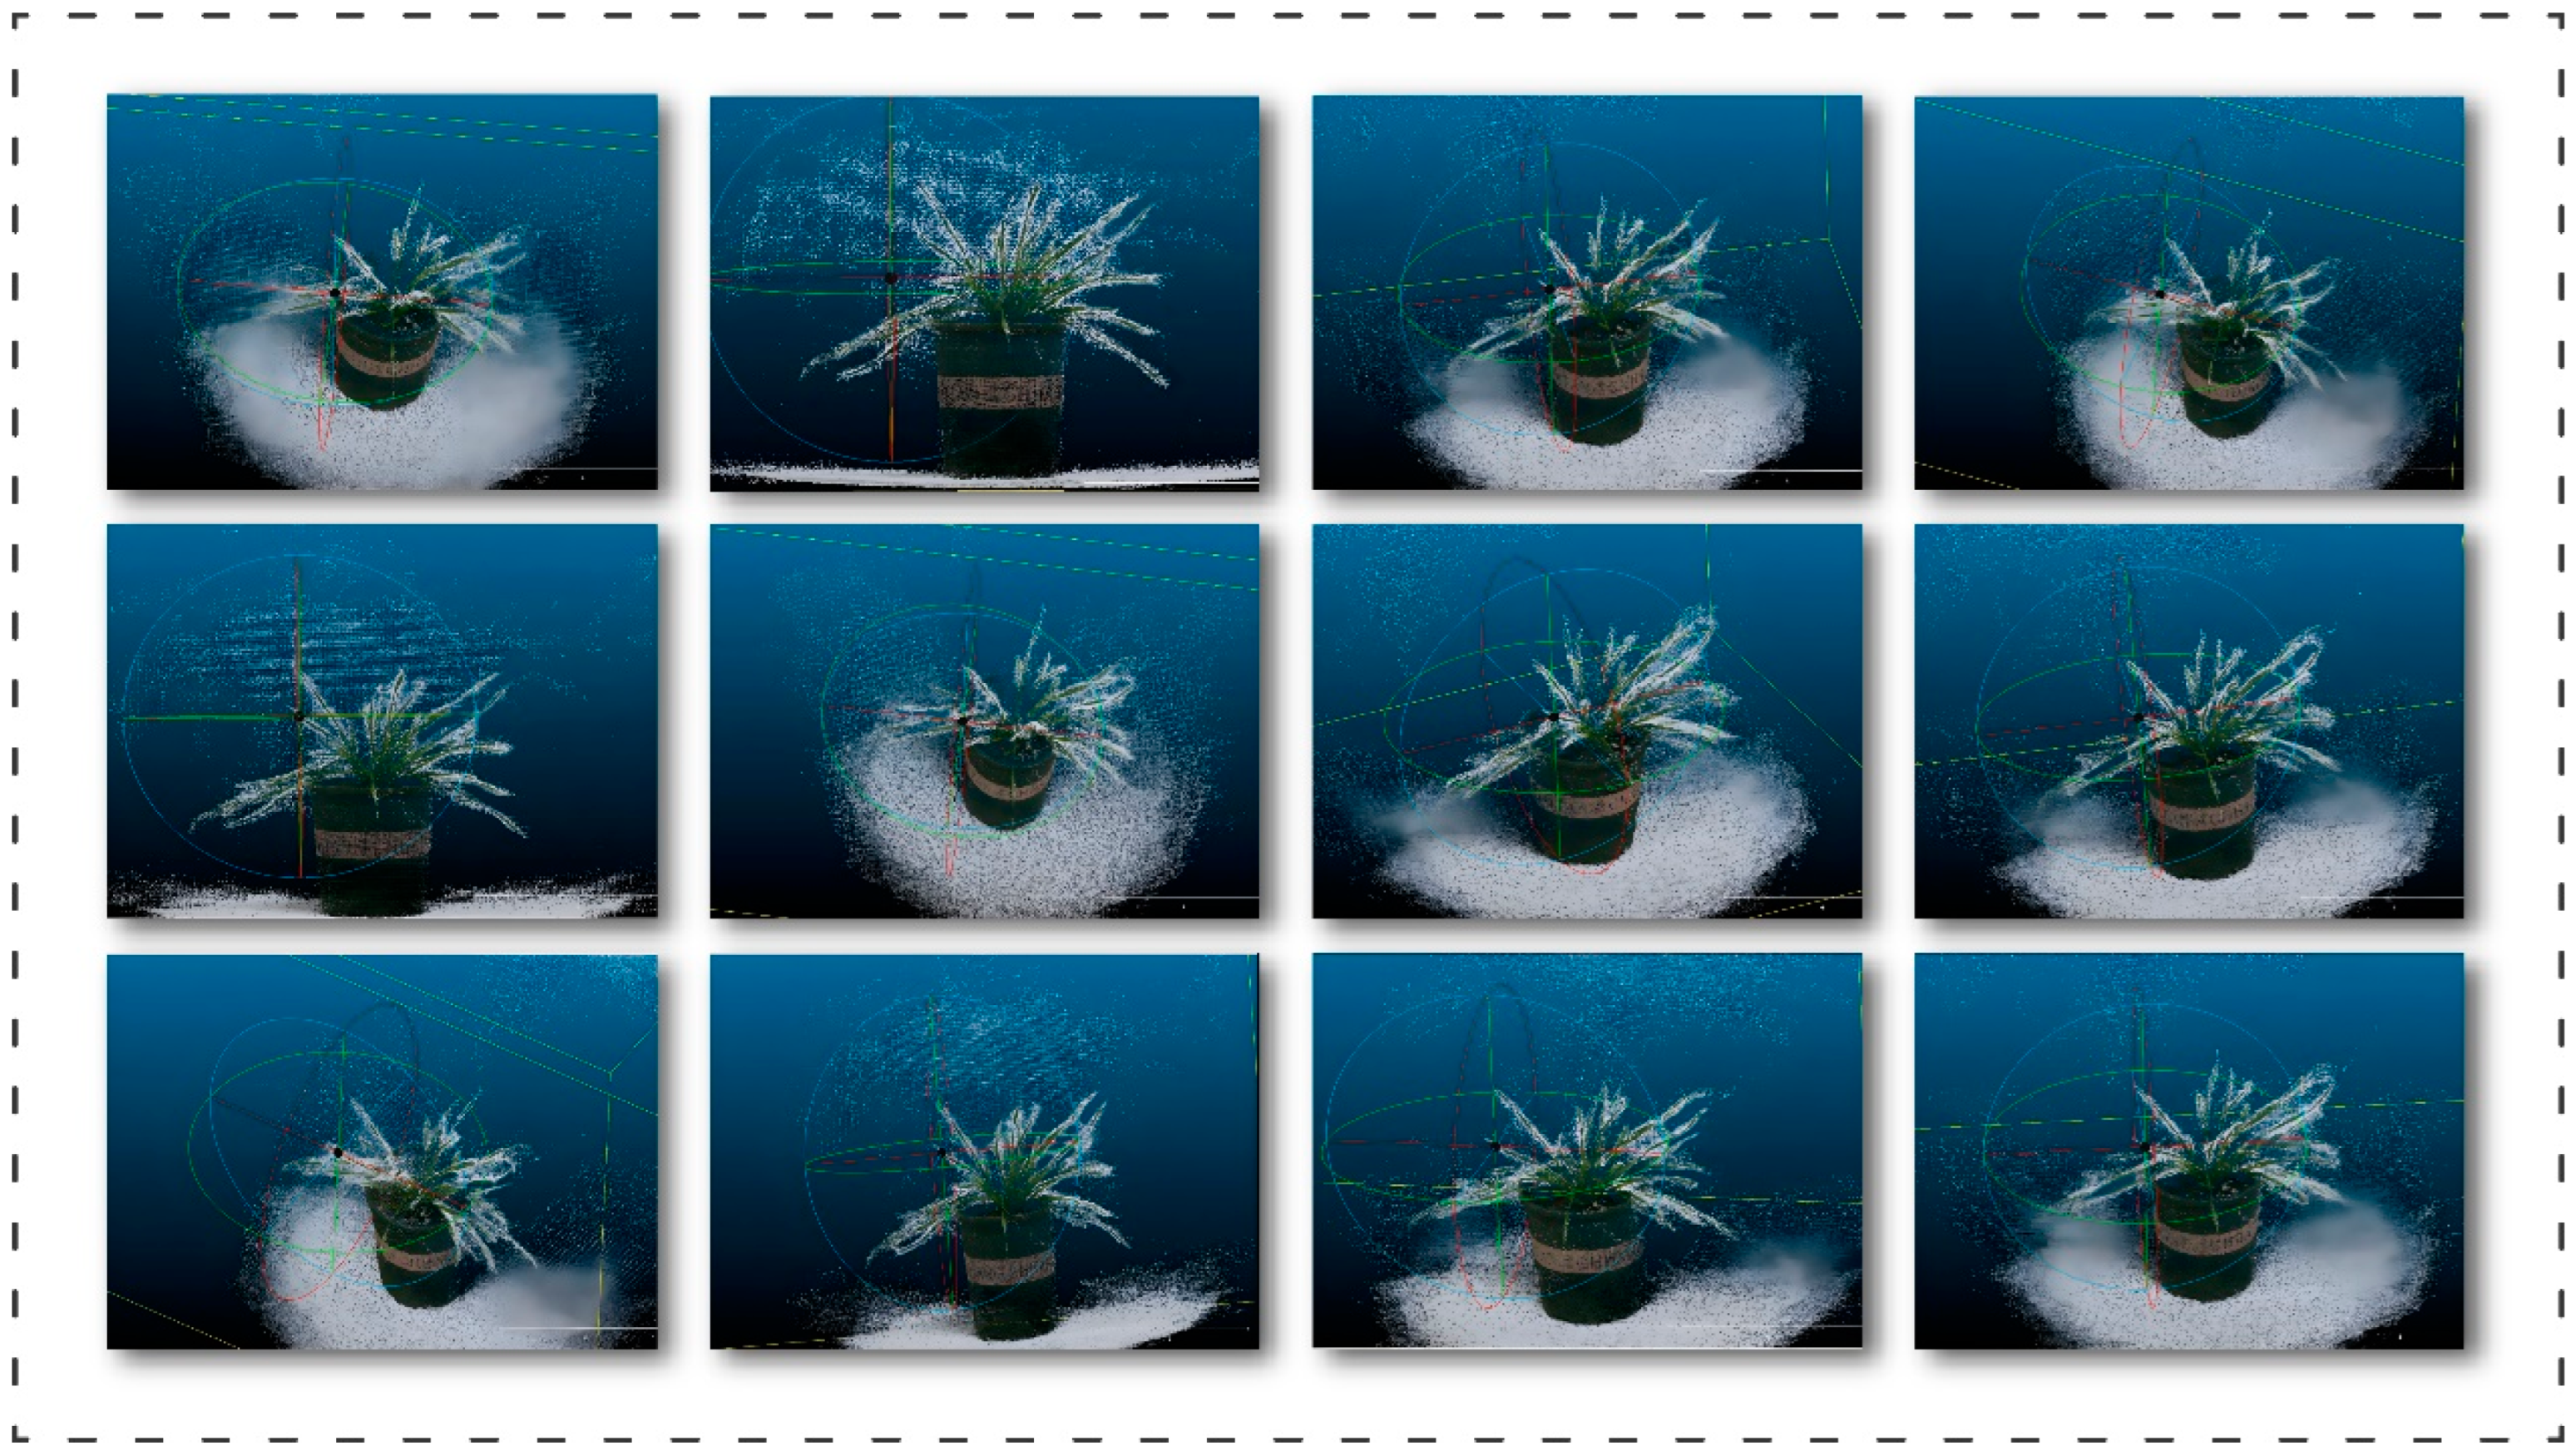
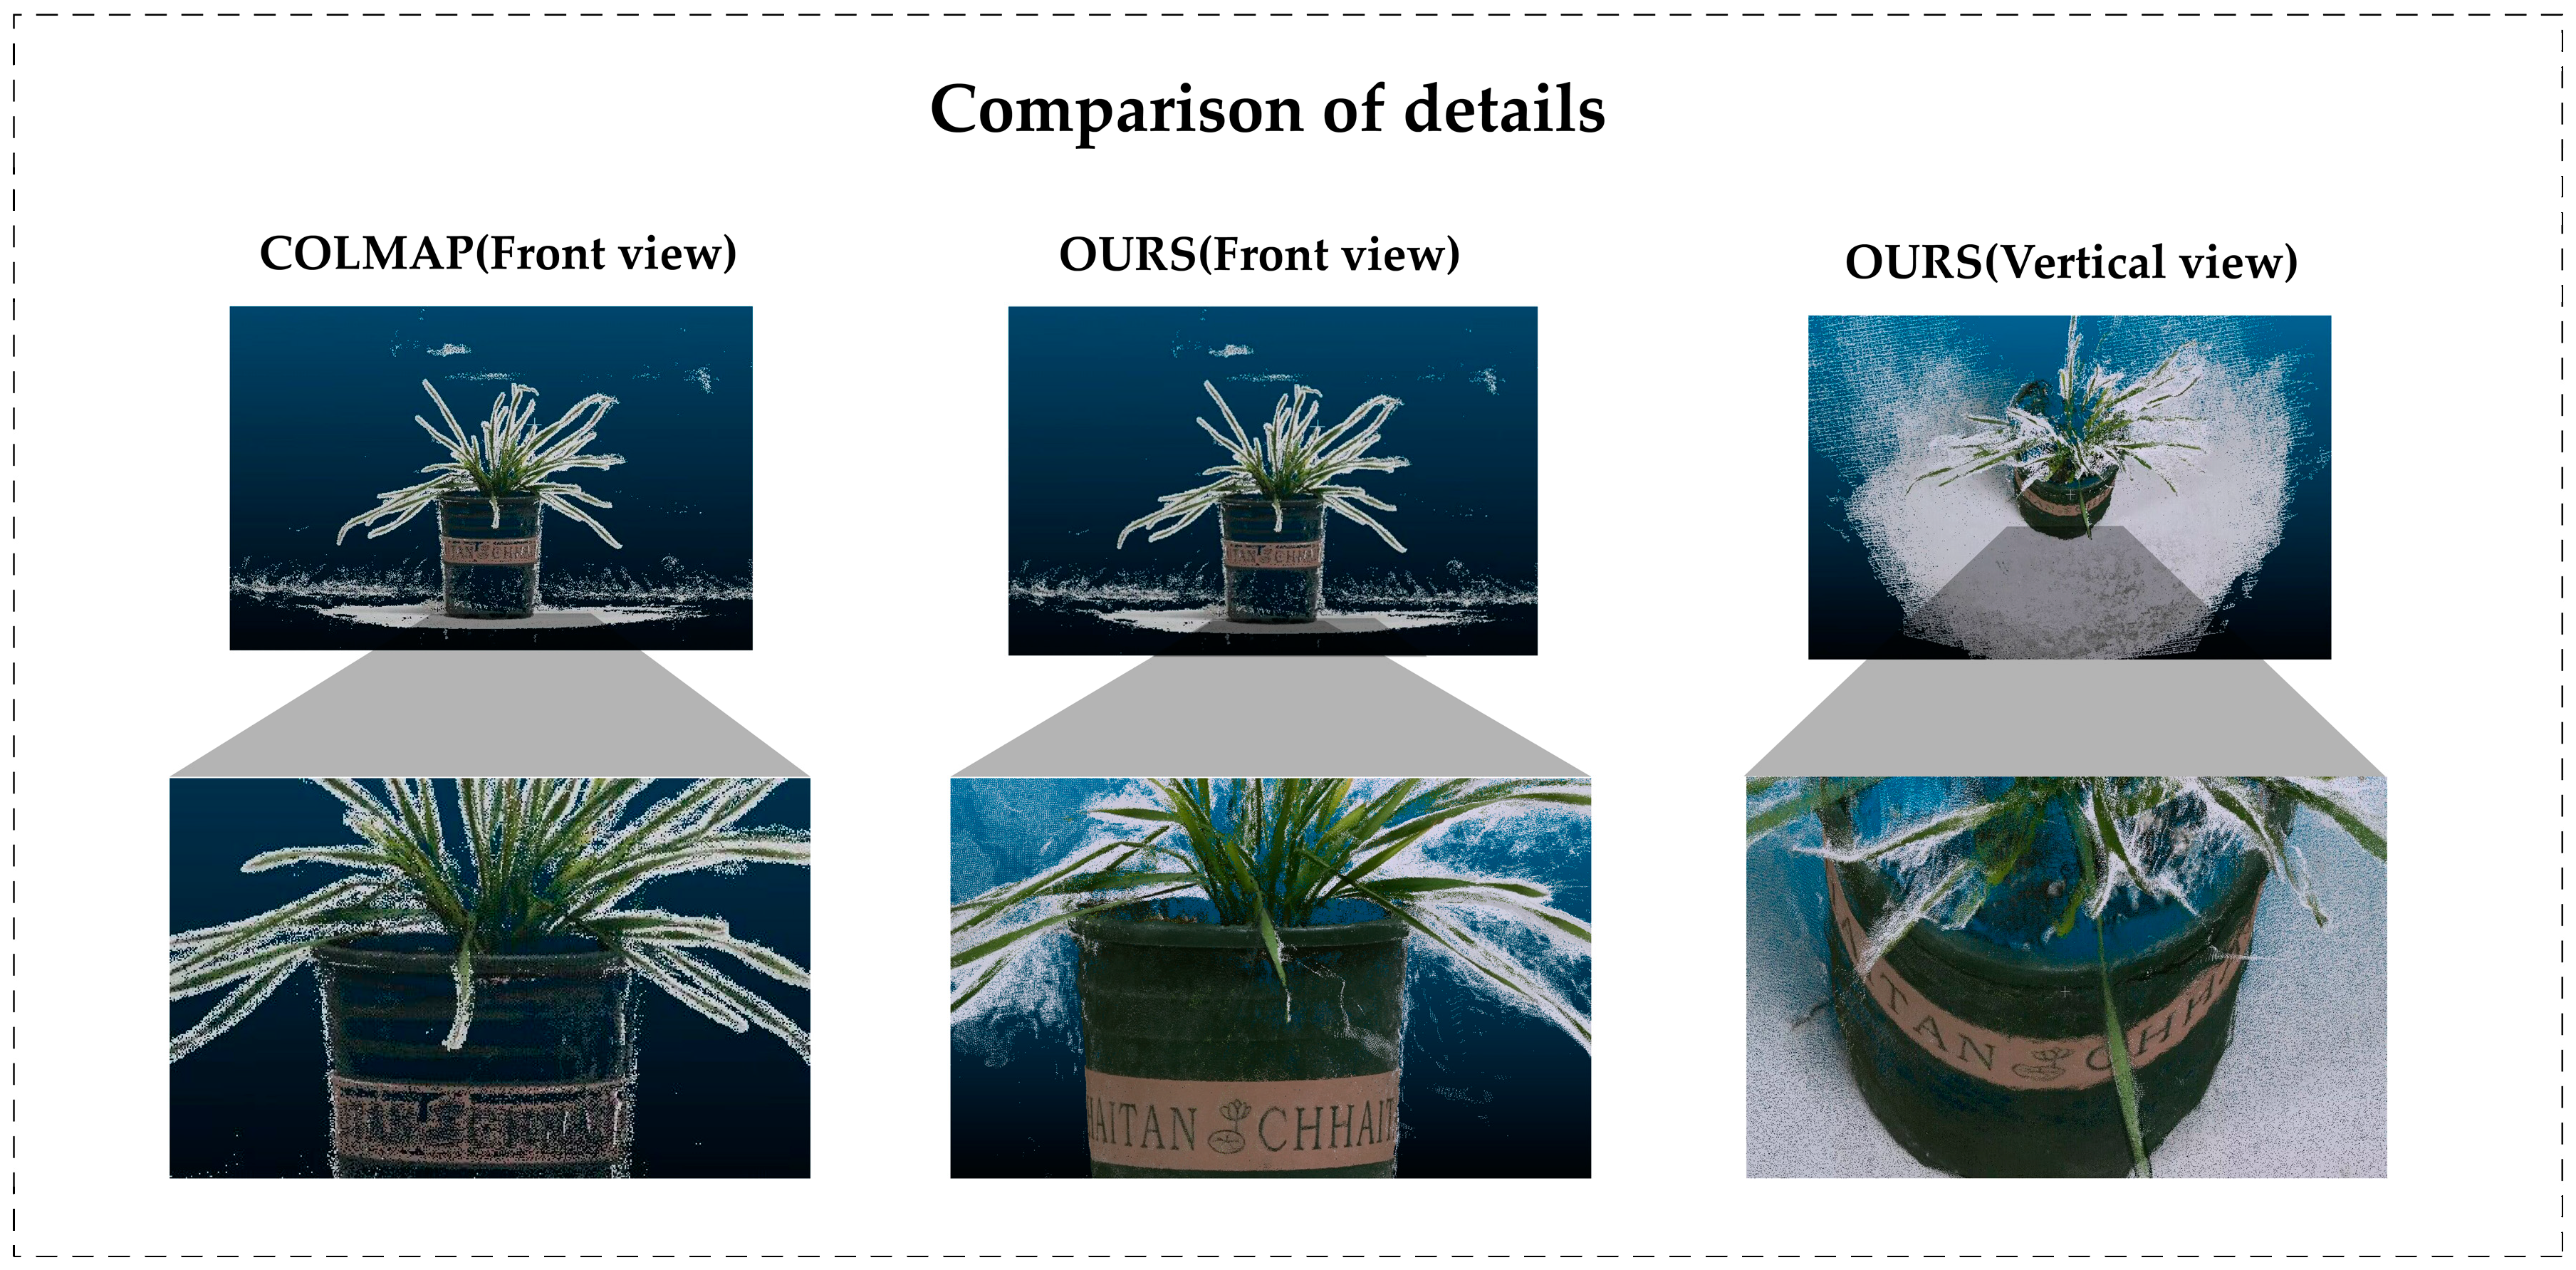
4.2.6. Result of 3D Reconstruction for Wheat
5. Discussion
5.1. Contribution to Wheat 3D Point Cloud Data Generation
5.2. Contribution to Realizing Camera Pose Repositioning
5.3. Contribution to Self-Supervised 3D Model Construction for Wheat
5.4. Contribution to Agronomy Research
6. Conclusions
Author Contributions
Funding
Data Availability Statement
Acknowledgments
Conflicts of Interest
References
- Lobos, G.A.; Camargo, A.V.; Del Pozo, A.; Araus, J.L.; Ortiz, R.; Doonan, J.H. Editorial: Plant Phenotyping and Phenomics for Plant Breeding. Front. Plant Sci. 2017, 8, 2181. [Google Scholar] [CrossRef] [PubMed]
- Paproki, A.; Sirault, X.; Berry, S.; Furbank, R.; Fripp, J. A novel mesh processing based technique for 3D plant analysis. BMC Plant Biol. 2012, 12, 63. [Google Scholar] [CrossRef] [PubMed]
- Wang, B.; Lin, C.; Xiong, S. Wheat Phenotype Extraction via Adaptive Supervoxel Segmentation. In Proceedings of the 2020 IEEE International Conference on Bioinformatics and Biomedicine (BIBM), Seoul, Republic of Korea, 16–19 December 2020; pp. 807–814. [Google Scholar]
- Toda, Y.; Okura, F.; Ito, J.; Okada, S.; Kinoshita, T.; Tsuji, H.; Saisho, D. Training instance segmentation neural network with synthetic datasets for crop seed phenotyping. Commun. Biol. 2020, 3, 173. [Google Scholar] [CrossRef]
- Lakshmi, S.; Sivakumar, R. Plant Phenotyping Through Image Analysis Using Nature Inspired Optimization Techniques; Intelligent Systems Reference Library; Springer: Cham, Switzerland, 2018. [Google Scholar]
- Su, J.; Yi, D.; Su, B.; Mi, Z.; Liu, C.; Hu, X.; Xu, X.-m.; Guo, L.; Chen, W.H. Aerial Visual Perception in Smart Farming: Field Study of Wheat Yellow Rust Monitoring. IEEE Trans. Ind. Inform. 2021, 17, 2242–2249. [Google Scholar] [CrossRef]
- Zhao, J.; Zhang, X.; Yan, J.; Qiu, X.; Yao, X.; Tian, Y.; Zhu, Y.; Cao, W. A Wheat Spike Detection Method in UAV Images Based on Improved YOLOv5. Remote Sens. 2021, 13, 3095. [Google Scholar] [CrossRef]
- Mi, Z.; Zhang, X.; Su, J.; Han, D.; Su, B. Wheat Stripe Rust Grading by Deep Learning With Attention Mechanism and Images From Mobile Devices. Front. Plant Sci. 2020, 11, 558126. [Google Scholar] [CrossRef]
- Gong, B.; Ergu, D.; Cai, Y.; Ma, B. Real-Time Detection for Wheat Head Applying Deep Neural Network. Sensors 2020, 21, 191. [Google Scholar] [CrossRef]
- Hu, G.; Qian, L.; Liang, D.; Wang, M. Self-adversarial Training and Attention for Multi-task Wheat Phenotyping. Appl. Eng. Agric. 2019, 35, 1009–1014. [Google Scholar] [CrossRef]
- Sandhu, K.S.; Lozada, D.N.; Zhang, Z.; Pumphrey, M.O.; Carter, A.H. Deep Learning for Predicting Complex Traits in Spring Wheat Breeding Program. Front. Plant Sci. 2021, 11, 613325. [Google Scholar] [CrossRef]
- Kempthorne, D.M.; Turner, I.W.; Belward, J.A.; McCue, S.W.; Barry, M.D.; Young, J.; Dorr, G.J.; Hanan, J.; Zabkiewicz, J.A. Surface reconstruction of wheat leaf morphology from three-dimensional scanned data. Funct. Plant Biol. FPB 2015, 42, 444–451. [Google Scholar] [CrossRef]
- Zhang, H.; Wang, Q.; Zhang, H.; Ji, Y.; Ma, X.; Xi, L. Wheat Three-Dimensional Reconstruction and Visualization System. Appl. Mech. Mater. 2012, 195–196, 1300–1307. [Google Scholar]
- Chebrolu, N.; Läbe, T.; Stachniss, C. Spatio-Temporal Non-Rigid Registration of 3D Point Clouds of Plants. In Proceedings of the 2020 IEEE International Conference on Robotics and Automation (ICRA), Paris, France, 31 May–31 August 2020; pp. 3112–3118. [Google Scholar]
- McElrone, A.J.; Choat, B.; Parkinson, D.Y.; MacDowell, A.A.; Brodersen, C.R. Using high resolution computed tomography to visualize the three dimensional structure and function of plant vasculature. J. Vis. Exp. JoVE 2013, 74, e50162. [Google Scholar]
- Verboven, P.; Herremans, E.; Helfen, L.; Ho, Q.T.; Abera, M.K.; Baumbach, T.; Wevers, M.; Nicolaï, B.M. Synchrotron X-ray computed laminography of the three-dimensional anatomy of tomato leaves. Plant J. Cell Mol. Biol. 2015, 81, 169–182. [Google Scholar] [CrossRef]
- Di Gennaro, S.F.; Matese, A. Evaluation of novel precision viticulture tool for canopy biomass estimation and missing plant detection based on 2.5D and 3D approaches using RGB images acquired by UAV platform. Plant Methods 2020, 16, 91. [Google Scholar] [CrossRef] [PubMed]
- Fang, W.; Feng, H.; Yang, W.; Yang, W.; Duan, L.; Chen, G.; Xiong, L.; Liu, Q. High-throughput volumetric reconstruction for 3D wheat plant architecture studies. J. Innov. Opt. Health Sci. 2016, 9, 1650037. [Google Scholar] [CrossRef]
- Qi, C.; Su, H.; Mo, K.; Guibas, L.J. PointNet: Deep Learning on Point Sets for 3D Classification and Segmentation. In Proceedings of the 2017 IEEE Conference on Computer Vision and Pattern Recognition (CVPR), Honolulu, HI, USA, 21–26 July 2016; pp. 77–85. [Google Scholar]
- Qi, C.; Yi, L.; Su, H.; Guibas, L.J. PointNet++: Deep Hierarchical Feature Learning on Point Sets in a Metric Space. arXiv 2017, arXiv:1706.02413. [Google Scholar]
- Fan, H.; Su, H.; Guibas, L.J. A Point Set Generation Network for 3D Object Reconstruction from a Single Image. In Proceedings of the 2017 IEEE Conference on Computer Vision and Pattern Recognition (CVPR), Honolulu, HI, USA, 21–26 July 2016; pp. 2463–2471. [Google Scholar]
- Yang, Y.; Zhang, J.; Wu, K.; Zhang, X.; Sun, J.; Peng, S.; Li, J.; Wang, M. 3D Point Cloud on Semantic Information for Wheat Reconstruction. Agriculture 2021, 11, 450. [Google Scholar] [CrossRef]
- Yao, Y.; Luo, Z.; Li, S.; Fang, T.; Quan, L. MVSNet: Depth Inference for Unstructured Multi-view Stereo. In Proceedings of the European Conference on Computer Vision, Munich, Germany, 8–14 September 2018. [Google Scholar]
- Yao, Y.; Luo, Z.; Li, S.; Shen, T.; Fang, T.; Quan, L. Recurrent MVSNet for High-Resolution Multi-View Stereo Depth Inference. In Proceedings of the 2019 IEEE/CVF Conference on Computer Vision and Pattern Recognition (CVPR), Long Beach, CA, USA, 15–20 June 2019; pp. 5520–5529. [Google Scholar]
- Chen, R.; Han, S.; Xu, J.; Su, H. Point-Based Multi-View Stereo Network. In Proceedings of the 2019 IEEE/CVF International Conference on Computer Vision (ICCV), Seoul, Republic of Korea, 27 October–2 November 2019; pp. 1538–1547. [Google Scholar]
- Luo, K.; Guan, T.; Ju, L.; Huang, H.; Luo, Y. P-MVSNet: Learning Patch-Wise Matching Confidence Aggregation for Multi-View Stereo. In Proceedings of the 2019 IEEE/CVF International Conference on Computer Vision (ICCV), Seoul, Republic of Korea, 27 October–2 November 2019; pp. 10451–10460. [Google Scholar]
- Gu, X.; Fan, Z.; Zhu, S.; Dai, Z.; Tan, F.; Tan, P. Cascade Cost Volume for High-Resolution Multi-View Stereo and Stereo Matching. In Proceedings of the 2020 IEEE/CVF Conference on Computer Vision and Pattern Recognition (CVPR), Seattle, WA, USA, 14–19 June 2020; pp. 2492–2501. [Google Scholar]
- Yang, J.; Mao, W.; Álvarez, J.M.; Liu, M. Cost Volume Pyramid Based Depth Inference for Multi-View Stereo. In Proceedings of the 2020 IEEE/CVF Conference on Computer Vision and Pattern Recognition (CVPR), Seattle, WA, USA, 14–19 June 2020; pp. 4876–4885. [Google Scholar]
- Xu, H.; Zhou, Z.; Qiao, Y.; Kang, W.; Wu, Q. Self-supervised Multi-view Stereo via Effective Co-Segmentation and Data-Augmentation. arXiv 2021, arXiv:2104.05374. [Google Scholar] [CrossRef]
- Chang, D.; Bozic, A.; Zhang, T.; Yan, Q.; Chen, Y.; Süsstrunk, S.; Nießner, M. RC-MVSNet: Unsupervised Multi-View Stereo with Neural Rendering. In European Conference on Computer Vision; Springer Nature: Cham, Switzerland, 2022. [Google Scholar]
- Huang, B.; Huang, C.; He, Y.; Liu, J.; Liu, X. M3VSNET: Unsupervised Multi-Metric Multi-View Stereo Network. In Proceedings of the 2021 IEEE International Conference on Image Processing (ICIP), Anchorage, AK, USA, 19–22 September 2021; pp. 3163–3167. [Google Scholar]
- Lindenberger, P.; Sarlin, P.-E.; Larsson, V.; Pollefeys, M. Pixel-Perfect Structure-from-Motion with Featuremetric Refinement. In Proceedings of the 2021 IEEE/CVF International Conference on Computer Vision (ICCV), Montreal, BC, Canada, 11–17 October 2021; pp. 5967–5977. [Google Scholar]
- Chum, O.; Matas, J.; Kittler, J. Locally Optimized RANSAC. In Pattern Recognition. DAGM 2003. Lecture Notes in Computer Science; Michaelis, B., Krell, G., Eds.; Springer: Berlin/Heidelberg, Germany, 2003; Volume 2781. [Google Scholar] [CrossRef]
- LoweDavid, G. Distinctive Image Features from Scale-Invariant Keypoints. Int. J. Comput. Vis. 2004, 60, 91–110. [Google Scholar]
- DeTone, D.; Malisiewicz, T.; Rabinovich, A. SuperPoint: Self-Supervised Interest Point Detection and Description. In Proceedings of the IEEE/CVF Conference on Computer Vision and Pattern Recognition Workshops (CVPRW), Salt Lake City, UT, USA, 18–22 June 2018; Volume 726, pp. 337–33712. [Google Scholar]
- Dusmanu, M.; Rocco, I.; Pajdla, T.; Pollefeys, M.; Sivic, J.; Torii, A.; Sattler, T. D2-Net: A Trainable CNN for Joint Detection and Description of Local Features. arXiv 2019, arXiv:1905.03561. [Google Scholar]
- Revaud, J.; Weinzaepfel, P.; Souza, C.R.d.; Pion, N.e.; Csurka, G.; Cabon, Y.; Humenberger, M. R2D2: Repeatable and Reliable Detector and Descriptor. arXiv 2019, arXiv:1906.06195. [Google Scholar]
- Schönberger, J.L.; Frahm, J.-M. Structure-from-Motion Revisited. In Proceedings of the 2016 IEEE Conference on Computer Vision and Pattern Recognition (CVPR), Las Vegas, NV, USA, 27–30 June 2016; pp. 4104–4113. [Google Scholar]


| Method | Evaluation Metrics | |
|---|---|---|
| Numbers of Inliers | Numbers of Outliers | |
| SIFT | 548 | 89 |
| SuperPoint | 338 | 13 |
| R2D2 | 1244 | 898 |
| D2Net | 2309 | 1796 |
| Number | Feature Extraction | Feature Matching | Adjustment Strategies | 3D Point | Average Track Length | Minimum Reprojection Error | |||
|---|---|---|---|---|---|---|---|---|---|
| SuperPoint | D2Net | SuperGlue | NN | FKA | FBA | ||||
| 01 | √ | √ | 4521 | 7.2245 | 1.2785 | ||||
| 02 | √ | √ | √ | 4564 | 7.1422 | 1.1892 | |||
| 03 | √ | √ | √ | 4545 | 7.2033 | 1.2734 | |||
| 04 | √ | √ | √ | √ | 4570 | 7.1271 | 1.1791 | ||
| 05 | √ | √ | 3834 | 6.3560 | 1.1614 | ||||
| 06 | √ | √ | √ | 3804 | 6.4189 | 1.0632 | |||
| 07 | √ | √ | √ | 3803 | 6.3986 | 1.1693 | |||
| 08 | √ | √ | √ | √ | 3804 | 6.4180 | 1.0619 | ||
| 09 | √ | √ | 22,011 | 4.5455 | 1.4426 | ||||
| 10 | √ | √ | √ | 21,996 | 4.5247 | 1.3865 | |||
| 11 | √ | √ | √ | 21,981 | 4.5526 | 1.4414 | |||
| 12 | √ | √ | √ | √ | 22,088 | 4.5186 | 1.3947 | ||
| Method | Evaluation Metrics (DTU Dataset) | ||
|---|---|---|---|
| Acc. | Comp. | Overall | |
| JDACS | 0.419 | 0.257 | 0.338 |
| RC-MVSNet | 0.368 | 0.284 | 0.326 |
| RepC-MVSNet (ours) | 0.259 | 0.312 | 0.285 |
Disclaimer/Publisher’s Note: The statements, opinions and data contained in all publications are solely those of the individual author(s) and contributor(s) and not of MDPI and/or the editor(s). MDPI and/or the editor(s) disclaim responsibility for any injury to people or property resulting from any ideas, methods, instructions or products referred to in the content. |
© 2023 by the authors. Licensee MDPI, Basel, Switzerland. This article is an open access article distributed under the terms and conditions of the Creative Commons Attribution (CC BY) license (https://creativecommons.org/licenses/by/4.0/).
Share and Cite
Liu, H.; Xin, C.; Lai, M.; He, H.; Wang, Y.; Wang, M.; Li, J. RepC-MVSNet: A Reparameterized Self-Supervised 3D Reconstruction Algorithm for Wheat 3D Reconstruction. Agronomy 2023, 13, 1975. https://doi.org/10.3390/agronomy13081975
Liu H, Xin C, Lai M, He H, Wang Y, Wang M, Li J. RepC-MVSNet: A Reparameterized Self-Supervised 3D Reconstruction Algorithm for Wheat 3D Reconstruction. Agronomy. 2023; 13(8):1975. https://doi.org/10.3390/agronomy13081975
Chicago/Turabian StyleLiu, Hui, Cheng Xin, Mengzhen Lai, Hangfei He, Yongzhao Wang, Mantao Wang, and Jun Li. 2023. "RepC-MVSNet: A Reparameterized Self-Supervised 3D Reconstruction Algorithm for Wheat 3D Reconstruction" Agronomy 13, no. 8: 1975. https://doi.org/10.3390/agronomy13081975
APA StyleLiu, H., Xin, C., Lai, M., He, H., Wang, Y., Wang, M., & Li, J. (2023). RepC-MVSNet: A Reparameterized Self-Supervised 3D Reconstruction Algorithm for Wheat 3D Reconstruction. Agronomy, 13(8), 1975. https://doi.org/10.3390/agronomy13081975