Abstract
This study aims to improve the Agaricus bisporus detection efficiency and performance of harvesting robots in the complex environment of the mushroom growing house. Based on deep learning networks, an improved YOLOv5s algorithm was proposed for accurate A. bisporus detection. First, A. bisporus images collected in situ from the mushroom growing house were preprocessed and augmented to construct a dataset containing 810 images, which were divided into the training and test sets in the ratio of 8:2. Then, by introducing the Convolutional Block Attention Module (CBAM) into the backbone network of YOLOv5s and adopting the Mosaic image augmentation technique in training, the detection accuracy and robustness of the algorithm were improved. The experimental results showed that the improved algorithm had a recognition accuracy of 98%, a single-image processing time of 18 ms, an A. bisporus center point locating error of 0.40%, and a diameter measuring error of 1.08%. Compared with YOLOv5s and YOLOv7, the YOLOv5s-CBAM has better performance in recognition accuracy, center positioning, and diameter measurement. Therefore, the proposed algorithm is capable of accurate A. bisporus detection in the complex environment of the mushroom growing house.
1. Introduction
Agaricus bisporus is one of the most produced and consumed edible mushrooms in the world [1]. Factory cultivating can greatly increase the yield of A. bisporus compared to traditional cultivating methods. However, current industrialized cultivation still relies heavily on human labor, especially in the monitoring and harvesting of A. bisporus. This leads to three problems:
- (1)
- Labor shortages inflate labor costs, which usually account for 15% to 30% of the total production costs [2].
- (2)
- Manual observation of A. bisporus growth status is inefficient, with accuracy highly dependent on human knowledge.
- (3)
- Manual harvesting of A. bisporus is labor-intensive and inefficient, and the size of the harvested mushrooms is inconsistent. Mushrooms harvested manually usually need to be sorted.
Compared to traditional manual methods, machine vision algorithms based on image processing and deep learning offer significant advantages and potential in terms of target detection and production process monitoring speed and accuracy. Therefore, the objective of this paper is to develop an A. bisporus detection algorithm using machine vision techniques, which can achieve mushroom recognition, precise positioning, and diameter measurement.
Many methods based on traditional image processing algorithms have been proposed in the research of A. bisporus detection. For example, based on the gray-level distribution properties of A. bisporus images, Yu et al. [3] scanned the threshold images twice using the region labeling technique of the sequence scanning algorithm to achieve A. bisporus segmentation. Ji et al. [4] proposed a “submersion method”, which incorporated the depth information to effectively segment the adherent mushroom clusters and used the circle Hough Transform to measure the diameter of A. bisporus, achieving a recognition success rate of 92.37% and a diameter measurement error of 4.94%. Chen et al. [5] proposed an A. bisporus segmentation recognition algorithm combining morphology and iterative marker-controlled watershed transformation, which achieved a high recognition success rate of 95.7% and a diameter measurement error of only 1.43%. Although the above algorithms have solved the A. bisporus detection problem to a certain extent, they rely on manual feature extraction and scene information. In addition, those algorithms are time-consuming, and their robustness, real-time performance, and generalization capability are not ideal. Therefore, those methods still cannot meet the needs of practical growth monitoring and automated harvesting.
Compared with traditional image processing algorithms, deep-learning-based target detection algorithms can extract multilevel features from images through unsupervised or weakly supervised learning, and their powerful learning capability and highly hierarchical structure significantly improve the target detection performance [6]. Deep-learning-based target detection methods are divided into two main categories. One category is detection methods based on region proposal networks, including region-based Convolutional Neural Networks (R-CNN) and Faster R-CNN, which first generate region proposals and then classify these regions. For example, Lee et al. [7] used a depth camera to obtain the 3D point cloud of A. bisporus and used the Faster R-CNN model to segment overlapping and adhering mushroom clusters and identify individual mushrooms, reaching an accuracy of 70.93%. Yang et al. [8] proposed an A. bisporus identification and localization algorithm based on Mask R-CNN, with an accuracy of 95.61%. Despite the higher detection accuracy, this category of algorithms is computationally intensive and slower in detection. Another category is regression-based target detection methods, including You Only Look Once (YOLO) [9] and Single Shot MultiBox Detector (SSD) [10], which normalize the images and feed them directly into a convolutional neural network for detection. Among them, YOLO has a fast detection speed, low false detection rate, good generalization performance, and more improved versions, earning it wide applications in agriculture [11,12,13,14]. Cong et al. [15] proposed a lightweight Lentinula edodes detection model based on YOLOv3, Mushroom-YOLO, which had a mean average precision (mAP) of 97.03% and a detection speed of 19.78 ms, achieving excellent timeliness and detection ability. Yin et al. [16] proposed an algorithm for high-precision estimation of Oudemansiella raphanipies mushroom cap diameter based on YOLOv4 and Distance Filter, with an estimated mean absolute error (MAE) of 0.77 mm and a root mean square error of 0.96 mm.
Among the YOLO series models, YOLOv5 has shown significant advantages in both detection accuracy and speed, and adaptive anchor frame calculation enables multiscale detection [17,18]. Its simplified version, YOLOv5s, is suitable for operation and implementation on mobile devices due to the low model complexity [19]. For example, Chen et al. [20] introduced the K-means++ clustering algorithm into the YOLOv5s framework to detect Camellia oleifera fruits concealed by leaves, reaching an mAP of 94.1% with a model of 27.1 M. Based on the channel pruned YOLOv5s, Wang et al. [21] proposed a channel pruned YOLOv5s method for the accurate detection of small apple fruits, which achieved a 95.8% accuracy with a model of only 1.4 M in size. Li et al. [22] proposed an improved lightweight algorithm based on YOLOv5s to detect the flat jujube in a complex natural environment. They used the bidirectional feature pyramid network to enhance multiscale feature fusion, and introduced dual coordinate attention modules to improve the feature extraction capability. The Convolutional Block Attention Module (CBAM) [23], an approach to enhance representation power of CNN networks, is often used to improve the recognition rate of networks. Li et al. [24] presented a fast and lightweight detection algorithm of passion fruit pests, with a CBAM module added to the YOLOv5s neck network to make the CNN focus on the target adaptively. Sun et al. [25] proposed an upgraded lightweight apple detection method YOLOv5-Prediction for the rapid detection of apple yield in an orchard environment, with CBAM attention mechanisms used to improve the detection accuracy of the algorithm.
In the growing environment of A. bisporus, the mushrooms may be overlapping, under insufficient light, and adhering to each other, which poses challenges for improving A. bisporus detection accuracy and identification speed. To address these needs, the YOLOv5s model was selected in this study for the detection and diameter measurement of A. bisporus targets. However, the original algorithm tends to lose small object target information during the training process, and the detection performance is less satisfactory in environments with complex target backgrounds. Therefore, we propose a target detection method based on improved YOLOv5s. The proposed method improves the detection accuracy and robustness of the model by introducing the CBAM attention module into the YOLOv5s backbone network and by employing the Mosaic image augmentation technique during training. In the meantime, we use the bounding box to calculate the center coordinates and measure the mushroom sizes, and the obtained results can provide target information for the automatic harvesting equipment, help monitor mushroom growth, predict the maturation time, and serve as a basis for optimal adjustment of the mushroom growing house control system.
2. A. bisporus Image Preprocessing and Dataset Preparation
2.1. Image Acquisition
In this study, we selected A. bisporus grown in a factory greenhouse as the research object and collected 200 high-resolution images (4032 × 3024). The acquired data included images of A. bisporus under various lighting conditions, at different fruit densities, of different sizes, and under different adhesion and overlapping conditions to ensure the robustness and detection accuracy of the trained model for A. bisporus images in the mushroom growing house environment. Unlike other fruits, dense overlapping is common in A. bisporus at naturally growing states (as shown in Figure 1).
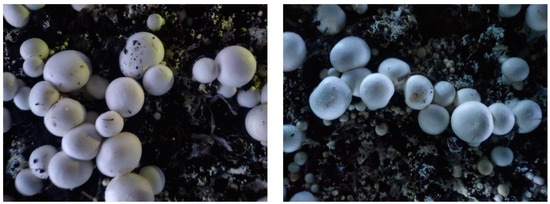
Figure 1.
Dense overlapping of A. bisporus at naturally growing states.
2.2. Image Preprocessing and Augmentation
Considering the characteristics of A. bisporus grown in the mushroom growing house, the quality of manually collected images may differ. Therefore, we screened out clear images and excluded blurred ones due to the loss of focus before image annotation. To improve the robustness and detection accuracy of the model, we purposely kept some images of densely growing and heavily adhered A. bisporus under various light conditions. Doing so helped the model to better learn and understand the detailed features of A. bisporus during the training process, thus improving its detection accuracy and robustness. After the screening, we finally acquired 162 high-quality images.
We used the Labelimg software for image annotation, with the image path, save path, and annotation type set in advance. By annotating the A. bisporus targets, we obtained the annotated images containing the class, x, y, w, and h information of the A. bisporus targets. Among them, class represents the numerical class label, x and y represent the ratios of the center point coordinate value of the target annotation box to the image width and height, respectively, and w and h represent the ratios of the width and height of the target annotation box to the image width and height, respectively.
Due to the small number of images taken, overfitting may occur during the training process. Thus, we performed image data augmentation, a data-space solution to the problem of limited data [26]. Data augmentation is a collection of techniques that can be used to extend the dataset size and improve the quality of images in the dataset by a required amount [27]. It can increase the number of training samples, effectively prevent overfitting, improve the generalization ability of the model, and, thus, improve the prediction accuracy and enhance the robustness of the model [28]. Manipulations, such as cropping, panning, changing height, adding noise, rotating, and mirroring, were adopted for data augmentation. Each original image was augmented into 5, resulting in a total of 810 high-quality images.
2.3. Dataset Preparation and Data Enhancement
2.3.1. Dataset Preparation
Through image preprocessing and image augmentation, we acquired 810 images as the dataset. Based on the ratio of 8:2, the images were divided into a training set and a test set containing 650 and 160 images, respectively. The sample images in the dataset covered almost all growth conditions of A. bisporus in the natural environment. Figure 2 shows the annotated images.
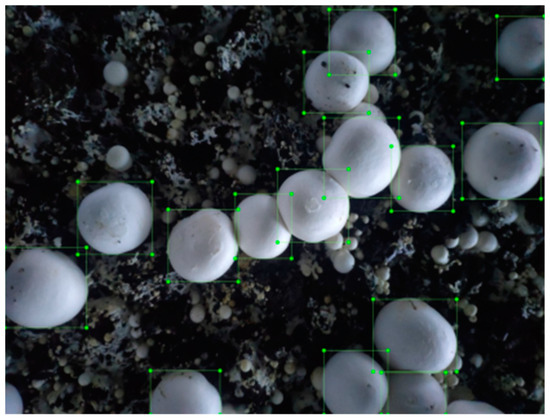
Figure 2.
Annotated A. bisporus images.
2.3.2. Data Augmentation
Mosaic data augmentation was used on the dataset during training [29,30], which merged four images randomly input into the network into one by randomly scaling, cropping, and arranging and inputting it into the network again. The advantage of this technique is the enrichment of target object backgrounds and the representation of small targets, which enhances the robustness of the model. During the calculation, data from four images can be processed simultaneously each time, thus reducing the minimum step size requirement and lowering GPU VRAM usage. Good detection performance can be achieved by training with one single GPU. The effect of data augmentation is shown in Figure 3.
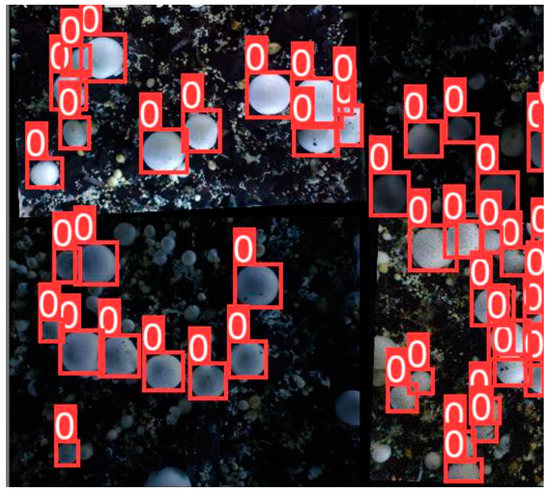
Figure 3.
Effect of Mosaic image data augmentation.
3. Design of the A. bisporus Detection Model Based on Improved YOLOv5s
3.1. Experimental Platform
Model training and testing in this study were conducted on the same platform, which was equipped with an Intel(R) Core(TM) i5-10400 hexa-core processor CPU @ 2.90GHz, 16 GB of RAM, and an NVIDIA GeForce GTX 1050 Ti GPU with 11.9 GB VRAM. The platform ran a 64-bit Windows 11 OS, with Pycharm as the program editor and Pytorch as the deep learning framework.
3.2. A. bisporus Detection Model Design
Given that A. bisporus was the only detection target in this study, we improved the backbone network (Backbone) structure in the YOLOv5s algorithm to enhance feature representation and improve model detection performance.
As the lightest model of the YOLO series, YOLOv5s mainly comprises the Backbone and Head, where the Backbone contains the Conv, C3, and SPPF (Spatial Pyramid Pooling-Fast) modules [31]. Conv is the convolution module in the Backbone, which is mainly used to perform convolution operations on the input feature maps. The C3 module is mainly used to extract feature information from the image, including more target location information and detail information but less semantic information. The SPPF module is mainly used to fuse local and global features. The Head includes Conv, Upsample, Concat, and C3 modules. Upsample is the upsampling module, and Concat is the feature fusion module.
By processing small targets in the images through multiple C3 modules in Backbone, the acquired information on location and feature is usually coarse and easily lost, which may lead to false detection and missed detection of small targets. To improve the accuracy of small target detection, we introduced the CBAM module into the Backbone. The CBAM module consists of the Channel Attention Module (CAM) and the Spatial Attention Module (SAM). CAM and SAM enhance the focus on the channel and spatial effective features of the target, enhance the key features, and reduce redundant features, thus improving the discriminative power of the feature network on the target object. This improvement can decrease the number of computational parameters and save computational power. In this study, the CBAM module was placed after the C3 module, thus effectively increasing the weight of small targets in the whole feature map for easier learning by the network. The flow chart of the CBAM algorithm is shown in Figure 4.
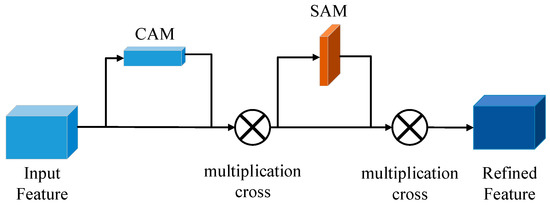
Figure 4.
CBAM algorithm flow chart.
The CBAM module focuses on both spatial and channel information. When the feature map is input into CAM, it goes through the maximum pooling layer and the average pooling layer [23]. The size of the feature map is reduced from C × H × W to C × 1 × 1, forming two weight vectors of [C,1,1], which are mapped into weights for each channel by the same fully connected neural network. The merged result is obtained by Concat operation, which is output after normalization by the sigmoid function. At this time, the high-level characteristics obtained are more comprehensive and richer. The output of CAM is merged with the initial input feature map as the input to SAM. Thus, the resulting feature map is able to highlight the location information of the key targets.
3.3. CBAM Module Fusion Position Effect Comparison
In the YOLOv5s model, the Backbone is the key network for feature extraction and is responsible for the easily neglected small target feature information. The CBAM module can perform attention feature reconstruction on the feature information to highlight its importance [18]. Considering the importance of the C3 module in feature information extraction from the feature map, we placed the CBAM module after the C3 module.
We compared the following two different fusion approaches: One is to place the CBAM module after the last C3 module of the Backbone, i.e., attention mechanism processing is added to the final feature map obtained after filtering through multiple layers of C3 modules. The other is to place CBAM modules after each C3 module in the Backbone, i.e., each feature map processed by a C3 module is processed by a CBAM module. These two different fusion approaches yielded two new network models based on the YOLOv5s algorithm: YOLOv5s-CBAM and YOLOv5s-CBAMS. Figure 5 shows the specific positions where the CBAM modules are integrated into the network. Figure 6 shows the network structure diagram of the YOLOv5s-CBAM algorithm.
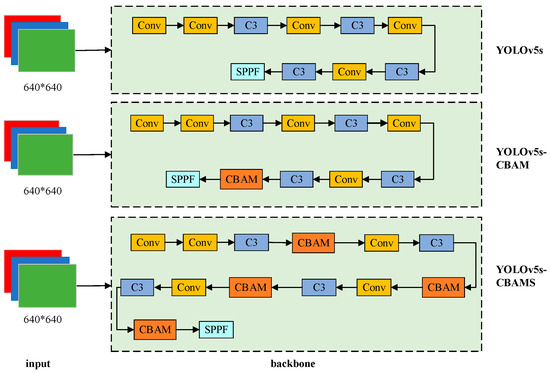
Figure 5.
The specific positions of the CBAM modules within the Backbone structure.
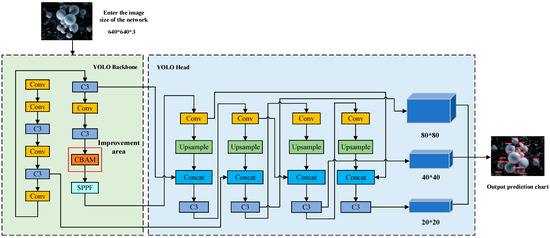
Figure 6.
Network structure diagram of the YOLOv5s-CBAM algorithm.
From Figure 6, the image is initially compressed to a size of 640 × 640 × 3, representing the width, height, and RGB channels of the image. This compressed image is then input into the backbone network of YOLO, where it first undergoes preprocessing using a Conv module. The purpose of this preprocessing is to preserve most of the coarse target information in the image, thus reducing the computational and parameter load of the model. Next, the image is sequentially processed through four sets of Conv modules and C3 modules of different sizes. The objective is to alter the size of the feature map and extract target feature information of different sizes. This process further enhances the key feature information of targets with different sizes in the feature map, while also reducing the computational and parameter load of the model, consequently improving feature extraction efficiency. Subsequently, the feature map is fed into the CBAM module to enhance the extraction of crucial feature information for small targets, thereby preventing the loss of such information. Then, the SPPF module is employed, where the SPPF structure performs pooling operations of different scales on the input feature map. The pooling results of different scales are then merged through convolution operations, resulting in an output of the merged feature map. This enhances the expressive and perceptive capabilities of the model’s features. The feature map processed by the SPPF module is finally fed into the head network for object detection. By applying a set of convolutions and fully connected layers on each feature layer, the position and category of the target are predicted. Each feature layer generates a set of bounding boxes along with their corresponding confidence scores. The nonmaximum suppression (NMS) algorithm is subsequently utilized to filter out overlapping bounding boxes and choose the one with the highest confidence score as the final detection result, thereby producing the final image result.
3.3.1. Model Training
The dataset contains about 12,000 targets of uneven sizes distributed in various positions of the images. The dataset basically covers the various possible sizes of A. bisporus and their possible locations in the images, which helps to improve the detection accuracy and robustness of the model. This study uses accuracy Precision, mean average precision mAP, and recall rate Recall to measure the detection effectiveness of the model [32,33]. Precision is the percentage of positive outputs that have been correctly classified, Recall is the percentage of positive samples that have been correctly identified, and mAP is the mean value of the average precision (AP) values over all classes. They are defined as follows:
where TP denotes the number of true positive samples, FP denotes the number of false positive samples, FN denotes the number of false negative samples, C denotes the total number of categories, and APi denotes the AP value of the ith category. During the training of the network model, the input image size is set to 640 × 640, the iteration batch size is set to 4, the total number of iterations is set to 200, and the initial learning rate is set to 0.001. To further illustrate the advantages of the proposed YOLOv5s-CBAM, we also compare it with the YOLOv7 model [34].
3.3.2. Training Result Analysis
After training for 200 iterations, we obtained the training parameters of the four models, and the Precision, mAP, and Recall values of the training parameters of these models are shown in Figure 7.
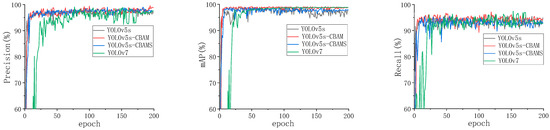
Figure 7.
The Precision, mAP, and Recall values for the training parameters of the four models.
From Figure 7, the variations of Precision, mAP, and Recall for the four models were observed as the epochs increased. It is evident that the YOLOv5s-CBAM model achieved a relatively high level of Precision, mAP, and Recall at a lower epoch, followed by YOLOv5s and YOLOv5s-CBAMS. Conversely, the YOLOv7 model showed high performance from an epoch value of 25. YOLOv7 has more network layers and feature pyramids, resulting in a larger number of parameters and, thus, longer parameter optimization time. Figure 7 suggests that the YOLOv5s-CBAM model has stronger detection capabilities in the early stages compared to the other three models. As the epoch value increases, YOLOv5s-CBAM outperforms the other three models, showing less fluctuation, stronger stability, and generalization capabilities.
The training results are shown in Table 1. The YOLOv5s-CBAM model has a clear advantage in terms of Precision, mAP, and Recall compared to the other models. The Precision, mAP, and Recall values of the YOLOv5s-CBAM model have increased by 2.4%, 1.5%, and 1.6%, respectively, compared to the original YOLOv5s model. This indicates that incorporating the CBAM module into the backbone can effectively improve the small-target detection performance. The YOLOv5s-CBAMS model performs better than YOLOv5s but worse than the YOLOv5s-CBAM model. This may be due to the possibility that multiple CBAM modules may generate overlapping or conflicting adaptation behaviors on the same feature map, resulting in the inability of the model to accurately capture the key information. The Precision and mAP values of YOLOv7 are higher than those of YOLOv5, but the Recall value is lower. This is because YOLOv7 has a more conservative and cautious approach towards its detection tasks, which leads to some targets not being detected with lower confidence, ultimately resulting in a slightly lower recall value.

Table 1.
Training results of four models.
To more intuitively compare the detection performance of the YOLOv5s-CBAM, YOLOv5s, and YOLOv7 models, we randomly selected one image of A. bisporus for the three model algorithms to detect. The output results are shown in Figure 8. Figure 8 shows that the improved YOLOv5s-CBAM model successfully detected all target mushrooms, while the YOLOv5s and YOLOv7 models missed some small targets. This demonstrates that the YOLOv5s-CBAM has better detection performance for small-target mushrooms.
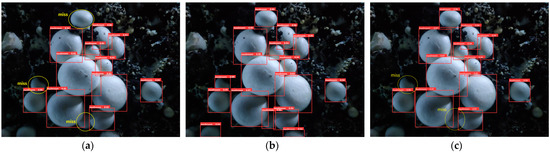
Figure 8.
Algorithm recognition effect comparison: (a) YOLOv5, three targets missed; (b) YOLOv5s-CBAM, no target missed; (c) YOLOv7, two targets missed.
3.3.3. Cross-Validation Experiment: Effect of Dataset Division on Model Performance Improvement
To mitigate the influence of randomness caused by randomly dividing the dataset in an 8:2 ratio and to more effectively assess the reliability of the improved model’s performance, we conducted a fivefold cross-validation experiment on the YOLOv5s-CBAM model. First, we divided the prepared dataset into five mutually exclusive subsets of equal size, namely A_set, B_set, C_set, D_set, and E_set. In each iteration, one subset was selected as the test set while the remaining four subsets were used as the training sets to train the corresponding model. The resulting models were labeled as A, B, C, D, and E, respectively. Model A is obtained specifically using A_set as the test set, while the remaining models are similarly named. The training process of each model was repeated for 200 iterations, and the training results are illustrated in the Figure 9. As shown in the figure, the training results of all five models exhibit a consistent and stable pattern. This suggests that the 8:2 division of the dataset has little effect on the performance of the model, indicating the stability and reliability of the model’s performance indicators. Consequently, we can assert that the experimental outcomes of this study are reliable.
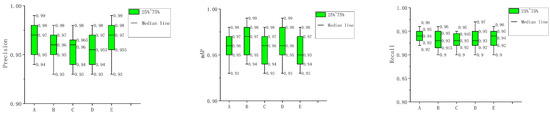
Figure 9.
The box-plot of fivefold cross-validations.
4. Experimental Result Analysis
This section evaluates the detection accuracy, detection time, center positioning error, and diameter measurement error of the algorithm. Specifically, ten images randomly selected from the dataset were used in the experiments on detection accuracy and detection time, while the A. bisporus image in Figure 8 was used for experiments on center positioning error and diameter measurement error.
4.1. Analysis of the Detection Experiment Results
To verify the effectiveness of the improved YOLOv5s-CBAM algorithm, ten images were randomly selected from the dataset for comparison experiments with YOLOv5s and YOLOv7. The experimental results are shown in Table 2, Table 3 and Table 4.
Table 2.
Experimental results of the original YOLOv5s.
Table 3.
Experimental results of the improved YOLOv5s-CBAM.
Table 4.
Experimental results of the YOLOv7.
Table 3 shows that the YOLOv5s-CBAM has an average accuracy of 98%, a 2% miss rate, and an average detection time of 17.6 ms on the ten images. Compared with the YOLOv5s, the mean average accuracy of the improved algorithm is 3.4% higher, and the miss rate is 3.4% lower, while the average detection time is only 1.1 ms longer. The YOLOv7 also performs slightly better than the original YOLOv5, but it takes a much longer time. The experimental results indicate that the YOLOv5s-CBAM algorithm can meet the requirements for real-time detection of A. bisporus in complex environments.
4.2. Analysis of Center Positioning Experiment Results
We will compare the positioning and diameter measurement accuracy of each algorithm using the 14 complete mushrooms depicted in Figure 8. Since the predicted bounding box in the YOLO algorithm is generated based on the center position of the target, the algorithm considers the center of the predicted bounding box as the center of the target. We can calculate the center coordinates of the predicted bounding box by obtaining the coordinates of its four vertices, which is the center coordinate of the A. bisporus derived by the algorithm. Then, by comparing this coordinate with the manually labeled center coordinate of the A. bisporus, we can calculate the error and determine whether the center positioning requirement is satisfied. To more accurately evaluate the deviation of the calculated A. bisporus center, we introduce the two-dimensional coordinate deviation rate (CDR) as follows [35]:
where cm and rm represent the longitudinal and horizontal coordinates of the manually determined center position of A. bisporus, ca and ra represent the longitudinal and horizontal coordinates of the algorithm-calculated center position of A. bisporus, and w = 860 and h = 640 represent the width and height of the compressed image of Figure 8. An example of CDR calculation is shown in Table 5, and the CDR results of the original YOLOv5s, improved YOLOv5s-CBAM, and YOLOv7 are shown in Table 6, Table 7 and Table 8, respectively.
Table 5.
Example of coordinate deviation rate (CDR) calculation.
Table 6.
Coordinate deviation rate (CDR) results of the YOLOv5s (three targets missed).
Table 7.
Coordinate deviation rate (CDR) results of the YOLOv5s-CBAM (no target missed).
Table 8.
Coordinate deviation rate (CDR) results of the YOLOv7 (two targets missed).
As can be seen in Table 6, Table 7 and Table 8, the YOLOv5s-CBAM model has the lowest average CDR (0.40%, in bold, same as below), the lowest maximum CDR (0.66%), and the lowest minimum CDR (0.16%) among the three models. The smaller the CDR value, the higher the center positioning accuracy of A. bisporus. If the CDR is below 3%, the center point coordinates of the A. bisporus are considered to be measured successfully [35]. The results indicate that all three models have the capability to accurately locate the detected mushrooms, with YOLOv5 exhibiting the highest positioning accuracy.
4.3. Analysis of Diameter Measurement Experiment Results
In this experiment, we considered the greater value between the height and the width of the predicted bounding box in the image of Figure 8 as the diameter (in pixels) of the A. bisporus. The spatial resolution [11] was used to calculate the actual diameter (in mm) of the A. bisporus. The spatial resolution indicates the number of independent pixels per millimeter, which is 3 pixels/mm in this study. The relative error of the measurement results is calculated as follows:
where ME is the measurement error, AV is the actual diameter, and EV is the algorithm-derived diameter. The results of the original YOLOv5s, improved YOLOv5s-CBAM, and YOLOv7 are shown in Table 9, Table 10 and Table 11, respectively.
Table 9.
Diameter measurement error results of the original YOLOv5s (three targets missed).
Table 10.
Diameter measurement error results of the YOLOv5s-CBAM (no target missed).
Table 11.
Diameter measurement error results of the YOLOv7 (two targets missed).
As shown in Table 10, the maximum measurement error of the improved algorithm is 2.83%, and the average measurement error is 1.08%. The results show that the improved YOLOv5s-CBAM achieved the smallest average measurement error (ME), suggesting more accurate diameter measurements compared to the other two models. Therefore, our algorithm demonstrates the ability to accurately estimate the diameter of A. bisporus, which meets the requirements of practical engineering applications.
4.4. Comparison of Different Algorithms for A. Bisporus Detection
We conducted a comparative analysis to evaluate the recognition performance of the proposed YOLOv5s-CBAM algorithm against several other algorithms for A. bisporus recognition, including the Submersion Method [4], Circle Hough Transform (CHT) [5], Marker-Controlled Watershed Transform (MCWT) [5], and Improved Segmentation Recognition Algorithm (ISRA) [35]. The comparison results are shown in Table 12.
Table 12.
Comparison of the results with different algorithms.
According to Table 12, the proposed YOLOv5s-CBAM algorithm has the highest recognition rate of 98% among the five algorithms. In addition, it shows the lowest average CDR of 0.4% and the lowest average diameter measurement error of 1.08%. These results indicate that, in complex factory environments of A. bisporus, the proposed algorithm effectively mitigates the influences of mycelia, weeds, uneven lighting, and other factors. As a result, it enables accurate detection and localization of both independent and adherent mushrooms, as well as accurate measurement of cap diameter. Importantly, this algorithm requires only 17.6 ms to process each image, which is significantly faster than the processing time of other algorithms. This capability satisfactorily meets the real-time requirements of A. bisporus detection. In conclusion, the comparative results further demonstrate the effectiveness of the proposed algorithm for A. bisporus detection and measurement.
5. Conclusions
This study proposed a method for A. bisporus detection based on an improved YOLOv5s model. Aiming to improve the algorithm’s ability to extract target feature information and solve the A. bisporus recognition problem in complex environments, the proposed method incorporated the CBAM module into the original YOLOv5s and introduced Mosaic image augmentation into the training process. The training results showed that the improved YOLOv5s-CBAM had a detection accuracy of 98.8% and a detection time of only 18 ms for a single image. To verify the superiority of the improved algorithm, we conducted A. bisporus detection experiments using detection accuracy, detection time, center positioning error, and diameter measurement error as evaluation indicators and compared the results with the original YOLOv5s and YOLOv7. The experimental results showed that the detection accuracy of the improved algorithm was 98%, the center positioning error was 0.40%, and the diameter measurement error was 1.08%, all of which were significantly better than the YOLOv5s and YOLOv7. The experiments proved that the improved algorithm proposed in this study could achieve accurate real-time detection, center positioning, and diameter measurement of A. bisporus. In the future, the proposed algorithm can be loaded into harvesting robots for the automatic harvesting of A. bisporus or into greenhouse control systems to optimize mushroom growing conditions.
Author Contributions
Conceptualization, C.C. and F.W.; methodology, C.C. and F.W.; software, F.W., S.Y. and Y.C.; validation, F.W., S.Y. and Y.C.; investigation, F.W. and B.Z.; writing—original draft preparation, C.C and F.W.; writing—review and editing, C.C.; visualization, F.W.; supervision, C.C.; project administration, C.C. and B.Z.; funding acquisition, C.C. and B.Z. All authors have read and agreed to the published version of the manuscript.
Funding
This research was funded by the Jiangsu Agricultural Science and Technology innovation Fund (grant No. CX(21)3150 and No. CX(22)3098) and the Lvyangjinfeng Talent Program of Yangzhou (grant No.YZLYJF2020PHD048).
Data Availability Statement
The proposed model files have been uploaded to the GitHub public repository at the following link: https://github.com/wangfeng123321/yolov5-mushroom.git (accessed on 2 July 2023).
Acknowledgments
We would also like to thank all reviewers for their valuable comments.
Conflicts of Interest
The authors declare no conflict of interest.
References
- Ramos, M.; Burgos, N.; Barnard, A.; Evans, G.; Preece, J.; Graz, M.; Ruthes, A.C.; Jiménez-Quero, A.; Martínez-Abad, A.; Vilaplana, F.; et al. Agaricus bisporus and its by-products as a source of valuable extracts and bioactive compounds. Food Chem. 2019, 292, 176–187. [Google Scholar] [CrossRef]
- Zied, D.C.; Pardo-Giménez, A. Edible and Medicinal Mushrooms: Technology and Applications; John Wiley & Sons: Chichester, UK, 2017. [Google Scholar]
- Yu, G.; Luo, J.; Zhao, Y. Region marking technique based on sequential scan and segmentation method of mushroom images. Trans. Chin. Soc. Agric. Eng. 2006, 22, 139–142. [Google Scholar] [CrossRef]
- Ji, J.; Sun, J.; Jin, X.; Ma, H.; Zhu, X. Measuring the Cap Diameter of White Button Mushrooms (Agaricus bisporus) by Using Depth Image Processing. Appl. Eng. Agric. 2021, 37, 623–633. [Google Scholar] [CrossRef]
- Chen, C.; Yi, S.; Mao, J.; Wang, F.; Zhang, B.; Du, F. A Novel Segmentation Recognition Algorithm of Agaricus bisporus Based on Morphology and Iterative Marker-Controlled Watershed Transform. Agronomy 2023, 13, 347. [Google Scholar] [CrossRef]
- Yan, B.; Fan, P.; Lei, X.; Liu, Z.; Yang, F. A Real-Time Apple Targets Detection Method for Picking Robot Based on Improved YOLOv5. Remote Sens. 2021, 13, 1619. [Google Scholar] [CrossRef]
- Lee, C.-H.; Choi, D.; Pecchia, J.; He, L.; Heinemann, P. Development of A Mushroom Harvesting Assistance System using Computer Vision. In Proceedings of the 2019 ASABE Annual International Meeting, St. Joseph, MI, USA, 7 July 2019. [Google Scholar]
- Yang, S.; Huang, J.; Yu, X.; Yu, T. Research on a Segmentation and Location Algorithm Based on Mask RCNN for Agaricus Bisporus. In Proceedings of the 2022 2nd International Conference on Computer Science, Electronic Information Engineering and Intelligent Control Technology (CEI), Fuzhou, China, 23–25 September 2022; pp. 717–721. [Google Scholar]
- Redmon, J.; Divvala, S.; Girshick, R.; Farhadi, A. You only look once: Unified, real-time object detection. In Proceedings of the IEEE Conference on Computer Vision and Pattern Recognition, Las Vegas, NV, USA, 26 June–1 July 2016; pp. 779–788. [Google Scholar]
- Liu, W.; Anguelov, D.; Erhan, D.; Szegedy, C.; Reed, S.; Fu, C.-Y.; Berg, A.C. SSD: Single shot multibox detector. In Proceedings of the European Conference on Computer Vision (ECCV), Amsterdam, The Netherlands, 11–14 October 2016; pp. 21–37. [Google Scholar]
- Lu, C.-P.; Liaw, J.-J. A novel image measurement algorithm for common mushroom caps based on convolutional neural network. Compu. Electron. Agric. 2020, 171, 105336. [Google Scholar] [CrossRef]
- Gai, R.; Chen, N.; Yuan, H. A detection algorithm for cherry fruits based on the improved YOLO-v4 model. Neural Comput. Appl. 2023, 35, 13895–13906. [Google Scholar] [CrossRef]
- Tian, Y.; Yang, G.; Wang, Z.; Wang, H.; Li, E.; Liang, Z. Apple detection during different growth stages in orchards using the improved YOLO-V3 model. Compu. Electron. Agric. 2019, 157, 417–426. [Google Scholar] [CrossRef]
- Mirhaji, H.; Soleymani, M.; Asakereh, A.; Abdanan Mehdizadeh, S. Fruit detection and load estimation of an orange orchard using the YOLO models through simple approaches in different imaging and illumination conditions. Compu. Electron. Agric. 2021, 191, 106533. [Google Scholar] [CrossRef]
- Cong, P.C.; Feng, H.; Lv, K.F.; Zhou, J.C.; Li, S.D. MYOLO: A Lightweight Fresh Shiitake Mushroom Detection Model Based on YOLOv3. Agriculture 2023, 13, 392. [Google Scholar] [CrossRef]
- Yin, H.; Xu, J.; Wang, Y.; Hu, D.; Yi, W. A Novel Method of Situ Measurement Algorithm for Oudemansiella raphanipies Caps Based on YOLO v4 and Distance Filtering. Agronomy 2023, 13, 134. [Google Scholar] [CrossRef]
- Liu, K.; Tang, H.; He, S.; Yu, Q.; Xiong, Y.; Wang, N. Performance Validation of Yolo Variants for Object Detection. In Proceedings of the 2021 International Conference on Bioinformatics and Intelligent Computing, Harbin, China, 22–24 January 2021; pp. 239–243. [Google Scholar]
- Wu, Y.; Sun, Y.; Zhang, S.; Liu, X.; Zhou, K.; Hou, J. A Size-Grading Method of Antler Mushrooms Using YOLOv5 and PSPNet. Agronomy 2022, 12, 2601. [Google Scholar] [CrossRef]
- Yao, J.; Qi, J.; Zhang, J.; Shao, H.; Yang, J.; Li, X. A Real-Time Detection Algorithm for Kiwifruit Defects Based on YOLOv5. Electronics 2021, 10, 1711. [Google Scholar] [CrossRef]
- Chen, S.; Zou, X.; Zhou, X.; Xiang, Y.; Wu, M. Study on fusion clustering and improved YOLOv5 algorithm based on multiple occlusion of Camellia oleifera fruit. Compu. Electron. Agric. 2023, 206, 107706. [Google Scholar] [CrossRef]
- Wang, D.; He, D. Channel pruned YOLO V5s-based deep learning approach for rapid and accurate apple fruitlet detection before fruit thinning. Biosyst. Eng. 2021, 210, 271–281. [Google Scholar] [CrossRef]
- Li, S.; Zhang, S.; Xue, J.; Sun, H. Lightweight target detection for the field flat jujube based on improved YOLOv5. Compu. Electron. Agric. 2022, 202, 107391. [Google Scholar] [CrossRef]
- Woo, S.; Park, J.; Lee, J.-Y.; Kweon, I.S. CBAM: Convolutional block attention module. In Proceedings of the European conference on computer vision (ECCV), Munich, Germany, 8–14 September 2018; pp. 3–19. [Google Scholar]
- Li, K.; Wang, J.; Jalil, H.; Wang, H. A fast and lightweight detection algorithm for passion fruit pests based on improved YOLOv5. Compu. Electron. Agric. 2023, 204, 107534. [Google Scholar] [CrossRef]
- Sun, L.; Hu, G.; Chen, C.; Cai, H.; Li, C.; Zhang, S.; Chen, J. Lightweight Apple Detection in Complex Orchards Using YOLOV5-PRE. Horticulturae 2022, 8, 1169. [Google Scholar] [CrossRef]
- Shorten, C.; Khoshgoftaar, T.M. A survey on image data augmentation for deep learning. J. Big Data 2019, 6, 60. [Google Scholar] [CrossRef]
- Kaur, P.; Khehra, B.S.; Mavi, E.B.S. Data Augmentation for Object Detection: A Review. In Proceedings of the 2021 IEEE International Midwest Symposium on Circuits and Systems (MWSCAS), East Lansing, MI, USA, 9–11 August 2021; pp. 537–543. [Google Scholar]
- Min, W.; Wenzhong, Y.; Liejun, W.; Danny, C.; Fuyuan, W.; HaiLaTi, K.; Yuanyuan, L. FE-YOLOv5: Feature enhancement network based on YOLOv5 for small object detection. J. Vis. Commun. Image R. 2023, 90, 103752. [Google Scholar]
- Bochkovskiy, A.; Wang, C.-Y.; Liao, H.-Y.M. Yolov4: Optimal speed and accuracy of object detection. arXiv 2020, arXiv:2004.10934. [Google Scholar]
- Weiwei, H.; Zenghong, M.; Bingliang, Y.; Gaohong, Y.; Tao, T.; Mingfeng, Z. Detection of Green Asparagus in Complex Environments Based on the Improved YOLOv5 Algorithm. Sensors 2023, 23, 1562. [Google Scholar]
- WenXin, H.; JunTao, X.; JunHao, L.; ZhiMing, X.; ZhiYu, L.; QiYin, H.; ZhenGang, Y. A method of citrus epidermis defects detection based on an improved YOLOv5. Biosyst. Eng. 2023, 227, 19–35. [Google Scholar]
- Sabzi, S.; Pourdarbani, R.; Rohban, M.H.; Garcia-Mateos, G.; Paliwal, J.; Molina-Martinez, J.M. Early Detection of Excess Nitrogen Consumption in Cucumber Plants Using Hyperspectral Imaging Based on Hybrid Neural Networks and the Imperialist Competitive Algorithm. Agronomy 2021, 11, 575. [Google Scholar] [CrossRef]
- Dewi, C.; Chen, R.-C.; Jiang, X.; Yu, H. Deep convolutional neural network for enhancing traffic sign recognition developed on Yolo V4. Multimed. Tools Appl. 2022, 81, 37821–37845. [Google Scholar] [CrossRef]
- Wang, C.-Y.; Bochkovskiy, A.; Liao, H.-Y.M. YOLOv7: Trainable bag-of-freebies sets new state-of-the-art for real-time object detectors. In Proceedings of the IEEE/CVF Conference on Computer Vision and Pattern Recognition, Vancouver, BC, Canada, 18–22 June 2023; pp. 7464–7475. [Google Scholar]
- Yang, S.; Ni, B.; Du, W.; Yu, T. Research on an Improved Segmentation Recognition Algorithm of Overlapping Agaricus bisporus. Sensors 2022, 22, 3946. [Google Scholar] [CrossRef]


Disclaimer/Publisher’s Note: The statements, opinions and data contained in all publications are solely those of the individual author(s) and contributor(s) and not of MDPI and/or the editor(s). MDPI and/or the editor(s) disclaim responsibility for any injury to people or property resulting from any ideas, methods, instructions or products referred to in the content. |
© 2023 by the authors. Licensee MDPI, Basel, Switzerland. This article is an open access article distributed under the terms and conditions of the Creative Commons Attribution (CC BY) license (https://creativecommons.org/licenses/by/4.0/).