Article

A Novel Approach for Predicting Heavy Metal Contamination Based on Adaptive Neuro-Fuzzy Inference System and GIS in an Arid Ecosystem

by
Elsayed Said Mohamed
1,
Mohamed E. M. Jalhoum
1,
Abdelaziz A. Belal
1,
Ehab Hendawy
1,
Yara F. A. Azab
1,
Dmitry E. Kucher
2,
Mohamed. S. Shokr
3,*,
Radwa A. El Behairy
3 and
Hasnaa M. El Arwash
4
1
National Authority for Remote Sensing and Space Sciences, Cairo 1564, Egypt
2
Department of Environmental Management, Institute of Environmental Engineering, RUDN University, 6 Miklukho-Maklaya St., 117198 Moscow, Russia
3
Soil and Water Department, Faculty of Agriculture, Tanta University, Tanta 31527, Egypt
4
Mechatronics Engineering Department, Alexandria Higher Institute of Engineering & Technology (AIET), Alexandria 21544, Egypt
*
Author to whom correspondence should be addressed.
Agronomy 2023, 13(7), 1873; https://doi.org/10.3390/agronomy13071873
Submission received: 19 June 2023 / Revised: 10 July 2023 / Accepted: 13 July 2023 / Published: 15 July 2023

Abstract

:
The issue of agricultural soil pollution is especially important as it directly affects the quality of food and the lives of humans and animals. Soil pollution is linked to human activities and agricultural practices. The main objective of this study is to assess and predict soil contamination by heavy metals utilizing an innovative method based on the adaptive neuro-fuzzy inference system (ANFIS), an effective artificial intelligence technology, and GIS in a semiarid and dry environment. A total of 150 soil samples were randomly collected in the neighboring area of the Bahr El-Baqar drain. Ordinary kriging (OK) was employed to generate spatial pattern maps for the following heavy metals: chromium (Cr), iron (Fe), cadmium (Cd), and nickel (Ni). The adaptive neuro-fuzzy inference system (ANFIS), known as one of the most effective applications of artificial intelligence (AI), was utilized to predict soil contamination by the selected heavy metals (Cr, Fe, Cd, and Ni). In total 150 samples were used, 136 soil samples were used for training and 14 for testing. The ANFIS predicting results were compared with the experimental results; this comparison proved its effectiveness, as a root mean square error (RMSE) was 0.048594 in training, and 0.0687 in testing, which is an acceptable result. The results showed that both the exponential and spherical models were quite suitable for Cr, Fe, and Ni. The correlation values (R2) were close to one in training and test; however, the stable model performed well with Cd. The high concentration of heavy metals was the most prevalent, encompassing approximately 51.6% of the study area. Furthermore, the average concentration of heavy metals in this degree was 82.86 ± 15.59 mg kg−1 for Cr, 20,963.84 ± 4447.83 mg kg−1 for Fe, 1.46 ± 0.42 mg kg−1 for Cd, and 48.71 ± 11.88 mg kg−1 for Ni. The comparison clearly demonstrates that utilizing the ANFIS model is a superior option for predicting the level of soil pollution. Ultimately, these findings can serve as a foundation for decision-makers to develop acceptable measures for mitigating heavy metal contamination.

1. Introduction

In recent decades, the amount of heavy metal contamination in soil and water has significantly increased as a result of human activity and natural sources [1,2,3]. They consist of smelting, manufacturing, and nonpoint sources such as car exhaust, metal-enriched goods, chemical fertilizers, plant manures, sewage sludge, and drainage of wastewater [4]. One of the main drains in the Eastern Nile Delta area gathers many kinds of contaminated wastewater (such as domestic, industrial, and agricultural) in the Bahr El-Baqar drain [5]. Bahr El-Baqar combines fresh water with sewage for agriculture, although doing so puts the public’s health in danger [6]. According to reports, the Bahr El-Baqar drain’s whole water supply is derived from drainage water sources: agricultural 58%, industrial 2%, and domestic and commercial 40% [5,7]. A total of 119.20 km2 of the adjacent agricultural areas are irrigated by the drain, which receives roughly 300 million m3/year of treated and untreated sewage from Cairo [5,8]. Industrial processes, including metal fabrication, food processing, disinfectants and soap production, paper and textile manufacturing, and municipal outflow, are the main sources of contamination for the Bahr El-Baqar drain [9]. It is extremely hazardous for the environment when contaminated water from drain outfalls is used in fish farms and agricultural areas. This affects the soil, groundwater, and other living things [10]. GIS is effective for mapping soil and irrigation water contamination evaluation studies to achieve agricultural sustainability in arid ecosystems [11,12]. One of the driest countries in the world is Egypt [13]. Due to ongoing drought and rising overexploitation, arid areas, including semiarid regions, are among the most fragile lands in the world. These nations have many issues, including a lack of development plans, soil, water, and air pollution, and the desertification of millions of hectares [14].
Mapping soil contamination using GIS techniques such as ordinary kriging (OK) and inverse distance weighting (IDW) in the Nile Valley and Delta is very important for understanding spatial distribution as well as identifying the most influencing types of elements [15,16,17,18]. According to [19], the average contamination of heavy metals in the area adjacent to the Bahr El-Baqar drain was in the following order: Cd > Cr > Co > Ni > Cu > Pb > Zn > Mn > Fe. These results are consistent with the findings of [20], who emphasized the spatial distribution of certain pollutants. The results indicated that the areas adjacent to the Bahr al-Baqar drain are characterized by high concentrations of chromium and manganese due to irrigation with wastewater [21]. Ordinary kriging (OK) was Utilized to analyze the spatial distribution of heavy elements near the El-Moheet drainage in Upper Egypt. The results of their investigation showed that cadmium displayed the highest pollution factor, indicating it had the greatest level of contamination.
Recently, there has been immense importance and high benefit of predicting soil contamination in protecting plants and humans from food toxicity [22]. So, artificial intelligence applications have recently gained popularity in agriculture, particularly in predicting soil pollution [23]. To carry out a task, the decision-maker requires the assistance of an information system expert who will prepare the input data from the database into the correct structure. In addition to their requirements, an operational research expert should be assigned to set appropriate functions for aggregation, implication, accumulation, and defuzzification, such as the fuzzy inference system (FIS). However, FIS tools typically provide a wide range of functions, and the fuzzy model may become unreliable if improper functions are selected [24]. The adaptive neuro fuzzy inference system (ANFIS) is one of the prominent neuro-fuzzy systems, which can be considered the next generation of the marriage of neural network learning and fuzzy logic knowledge representation. This combination has overcome the shortcomings of neural network incapability to explain decisions (denial of visibility) and learning limitations in fuzzy logic in fields of prediction and forecasting [25,26]. On the other hand, ANFIS limitations can be concluded as the membership function type, number, membership function location, and the curse of dimensionality. Furthermore, the trade-off between interpretability and accuracy is regarded as a critical problem [27]. Many agricultural researchers used ANFIS in the prediction of soil contamination. Furthermore, it was used to predict particle size distribution [28]. The ANFIS was trained and tested using data from this study’s field experiments. The conclusions demonstrated that the structured ANFIS was capable of accurately predicting sand, silt, and clay content. According to the effective results of the testing data and the estimated coefficient of correlation between both testing and training, the model’s prediction accuracy, predictive ability, and correlation coefficient were all satisfactory. An ANFIS was used to evaluate the performance of estimating the soil’s sodium absorption ratio (SAR) that was assessed in this study. There were 153 soil samples collected from the literature and actual laboratory analysis. Five soil parameters were used as inputs, including EC, pH, sand, silt, and clay percentages, and soil SAR was used as output [29]. The ANFIS model was improved to forecast (Cd) concentrations in the Filo River in Turkey. The observed and modeled Cd concentrations had a stronger correlation (R2 = 0.91) [30]. The research goal is to estimate specific parameters using ANN and ANFIS models, determine water resource quality, and develop methods to reduce the number of analyzed parameters [31]. The ANN and ANFIS were used to simulate the results of studies on the minerals Cu, Fe, Zn, Mn, Ni, and Pb. Throughout the testing period, the proposed ANFIS model R2 value was greater than 0.80, which is considered to be acceptable [32]. Another model of adsorption behavior using an ANN, ANFIS, and multiple linear regression (MLR) was proposed. The study used eleven different training algorithms, and eight MF types were compared and statistically evaluated in terms of estimation errors, which are mean absolute error (MAE), root mean squared error (RMSE), and symmetrical mean absolute percentage error (SMAPE) [33]. According to [34], a hybrid soft computing model for predicting soil nutrients is proposed by combining the benefits of ANN and fuzzy logic (FL) with the use of an ANFIS. For the analysis, the model was evaluated using standard statistical methods and found to be effective in providing accurate soil nutrient levels (R2 of 94%). The root mean square error (RMSE) from an ANFIS simulation is very low (0.000162), indicating that the model is significant and effective for prediction.
This article’s major goal is to assess and predict soil contamination by heavy metals using a unique strategy based on the neuro-fuzzy inference system (ANFIS), an effective artificial intelligence method, and GIS in a semiarid. The ANFIS model will be upgraded for this investigation. In this work, an improved ANFIS model will be employed in MATLAB applications to predict the overall pollution degree in soils adjacent to the Bahr El-Baqar drain, which will contain four elements: Cr, Fe, Cd, and Ni. The root mean square error coefficient (RMSE) during training and testing will be utilized to assess this effectiveness. The results of the proposed prediction model will be compared with the analytical results to ensure its efficacy. Previous studies have demonstrated that the results will be more accurate the closer this coefficient is to the right one. This shows that the model’s ability to forecast the amount of contamination with these solid components in the soil is accurate, steady, and dependable.

2. Materials and Methods

2.1. Experimental Zone

The study area is located in the soil around Bahr El-Baqar’s main drain. It is delimited by the longitudes 31°22′25.03″ E to 31°24′33.84″ and the latitudes 30°18′47.05″ N to 30°20′0.64″, as shown in Figure 1. Its total area is 294.67 hectares. Wastewater from two minor drains, Belbeis and Qalubiya, in the Sharqia Governorate, is collected in the Bahr El-Baqar main drain. A high-resolution Sentinel-2A satellite image (October 2022) was utilized as a location map displaying different land use/cover elements in the study region (Figure 1).

2.2. Field Survey Sample Collection

The current region includes the following crops: vegetables, strawberries, wheat, alfalfa, and other economic crops. To investigate the level of soil contamination, 150 random soil sample locales close to the Bahr El-Baqar drain were chosen (Figure 1). Each location’s coordinates have been preserved via GPS.

2.3. Sample Preparation and Laboratory Analysis

Soil samples were air-dried, crushed to pass through a 2 mm sieve, and stored in plastic bags at a temperature of about 4 °C. Seven mL of concentrated nitric acid and three mL of hydrofluoric acid were used to decompose soil samples [35]. In total, 0.25 g of mixed soil was added into an appropriate vessel, then 6 ± 0.1 mL concentrated HNO3, 3 ± 0.1 mL concentrated HCl, and 2 ± 0.1 mL HF were added to the vessel. The temperature of each sample should rise to 160–190 °C in approximately 12 min and remain at 160–190 °C for 5 min. At the end of the microwave program, the vessels were allowed to cool to room temperature, and then the sample was transferred to a 25 mL volumetric flask. The inner walls were rinsed with nitric acid; the sample solution was transferred to the volumetric flask and then diluted with ultrapure water to the mark. Finally, the processed samples were analyzed on an inductively coupled plasma mass spectrometry (ICP-MS Employing inductively coupled plasma mass spectrometry (Thermo ICP-MS type iCAP-RQ) at 200 °C in the ETHOS UP microwave digester unit.

2.4. Heavy Metal Properties’ Spatial Variability Maps

In ArcGIS software 10.4, the geostatistical studies were achieved using the kriging interpolation method [36]. Semivariogram models were used with ordinary kriging (OK) as follows:
γ h = 1 2 N ( H ) α = 1 N ( h ) Z ( X α + h ) 2
γ h -represents the semivariance at a given lag distance h, N(h) represents the number of sample pairs at that lag distance, Z ( X α ) represents the value at a specific sample location, and Z ( X α + h ) represents the value at a sample location that is a distance h away from the original location.
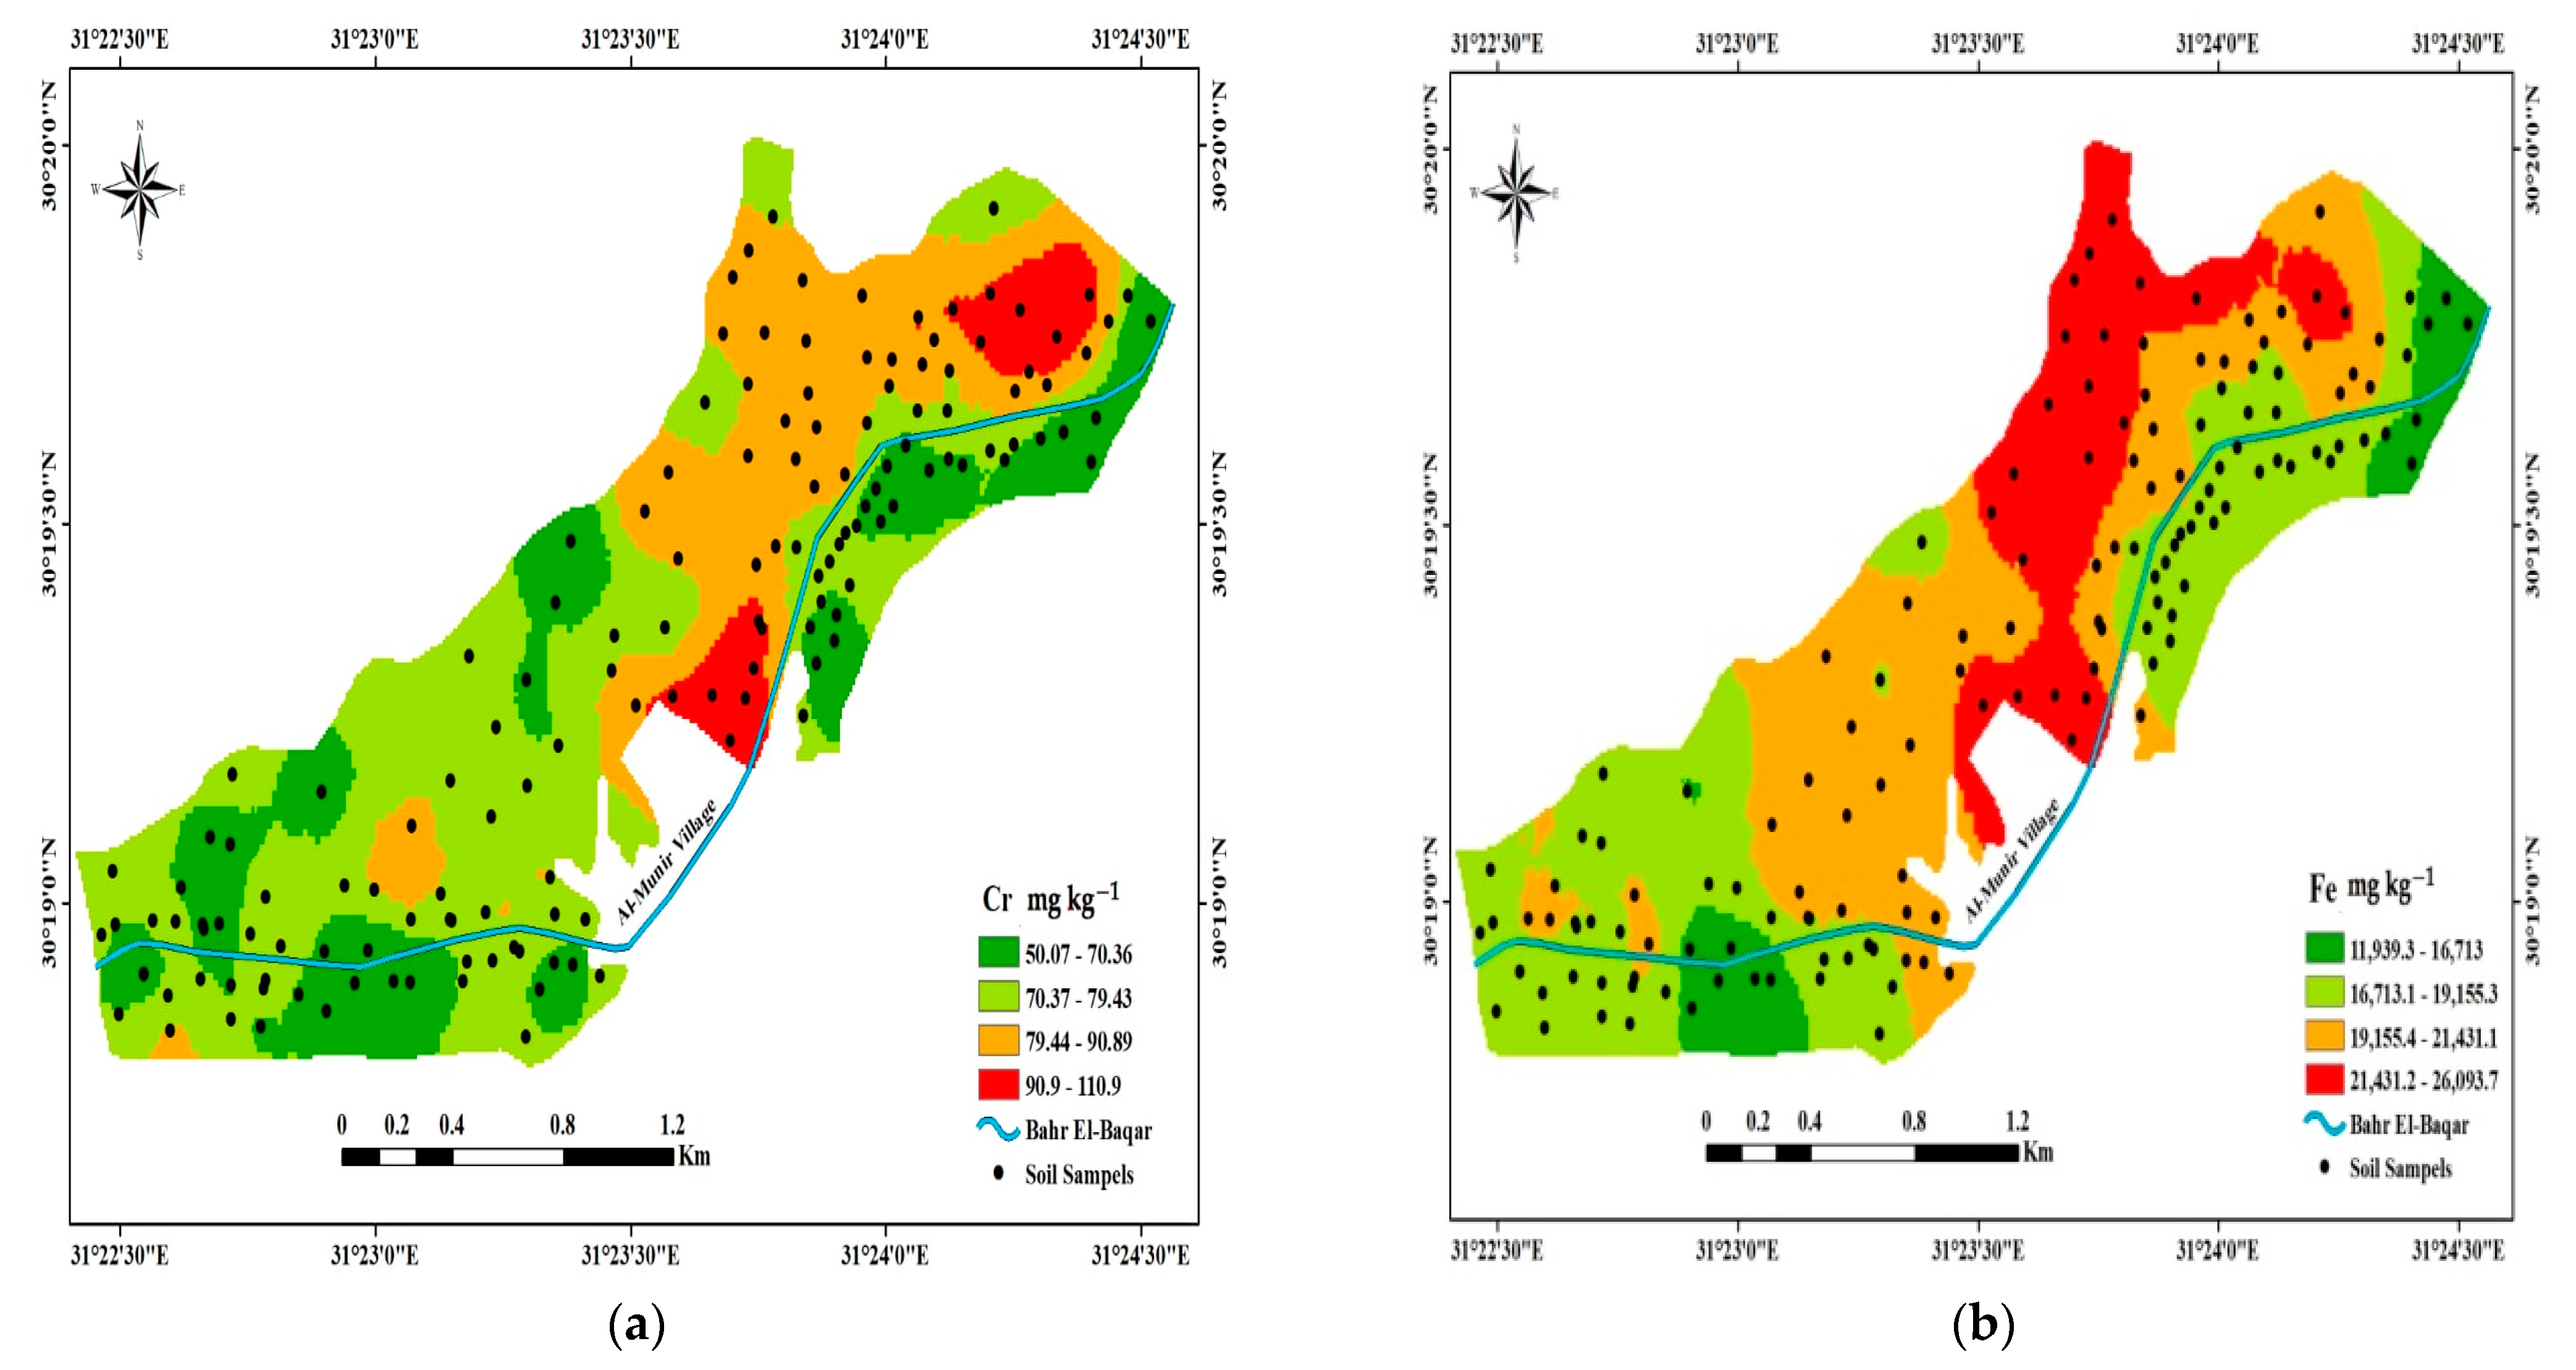
In the current investigation, the best-fitted model for the heavy metals was determined by the following models (exponential, stable, and spherical) among semivariogram models. The spatial distribution maps of soil parameters were created to determine the distinct patterns of some selected soil heavy metals (Cr, Fe, Cd, and Ni). For Cd, the values of skewness and kurtosis were high, and this indicated that it does not subject to the normal distribution; therefore, the data were transformed using the log method according to [37]. According to [38], the mean standardized error (MSE) and root mean square error (RMSE) have all been used to assess the correctness of the various models. RMSSE values that were closest to one suggested that the model was more accurate [39].
According to [40], the strength of spatial dependence in a variable, as measured by the nugget (C0)-to-sill ratio (C0 + C ratio), can be classified as follows: A nugget-to-sill ratio less than 0.25 indicates a strong spatial dependence, primarily attributed to intrinsic factors. If the nugget-to-sill ratio falls between 0.25 and 0.75, it suggests a moderate spatial dependence. Extrinsic factors refer to external influences on the variable. When the nugget-to-sill ratio exceeds 0.75, it signifies a weak spatial dependence, mainly driven by extrinsic factors.

2.5. Soil Contamination Predication Using ANFIS

2.5.1. Modified Degree of Contamination (mCd)

The comprehensive contamination of various heavy metals in each soil sample was assessed using the modified degree of contamination (mCd) devised by [41,42]. The following formulae can be used to determine mCd:
m C d = C F n
  • CF is contamination factor;
  • n is number of samples.
By dividing the total concentration of each heavy metal measured by the background value, the contamination factor (CF) for each metal in the study was calculated. The geochemical background concentration, as seen in the typical shale of the upper crust’s heavy metal element, follows [43]. The focus is on the relationship between the concentration reached and the concentration of elements in the crust in this case, since soil is a part of the Earth’s crust and has a chemical composition that is similar to that of the crust [44].

2.5.2. ANFIS Modeling

The ANFIS algorithm, as many authors have documented, is an integration of the strong features of fuzzy logic reasoning and a multilayered neural network that predicts the output of experimental data via an input–output relationship [45,46]. Moreover, they stated that the ANFIS model’s strength lies in its ability to integrate fuzzy logic reasoning and neural network modeling, yielding a unified predictive model. During the ANFIS modeling, the experimental data were trained using the Sugeno fuzzy model (FIS), where a rule R k   can be represented as follows:
R k   :   I F   μ A i ( x )   A N D   μ B i ( y )   T H E N   f = p k x + q k y + r k  
where
  • k: The number of rules;
  • Ai and Bi: The n fuzzy membership function denoted by µ in the antecedent part of the rule Rk;
  • pk, qk, and rk: The linear parameters of the consequent part of the kth rule.
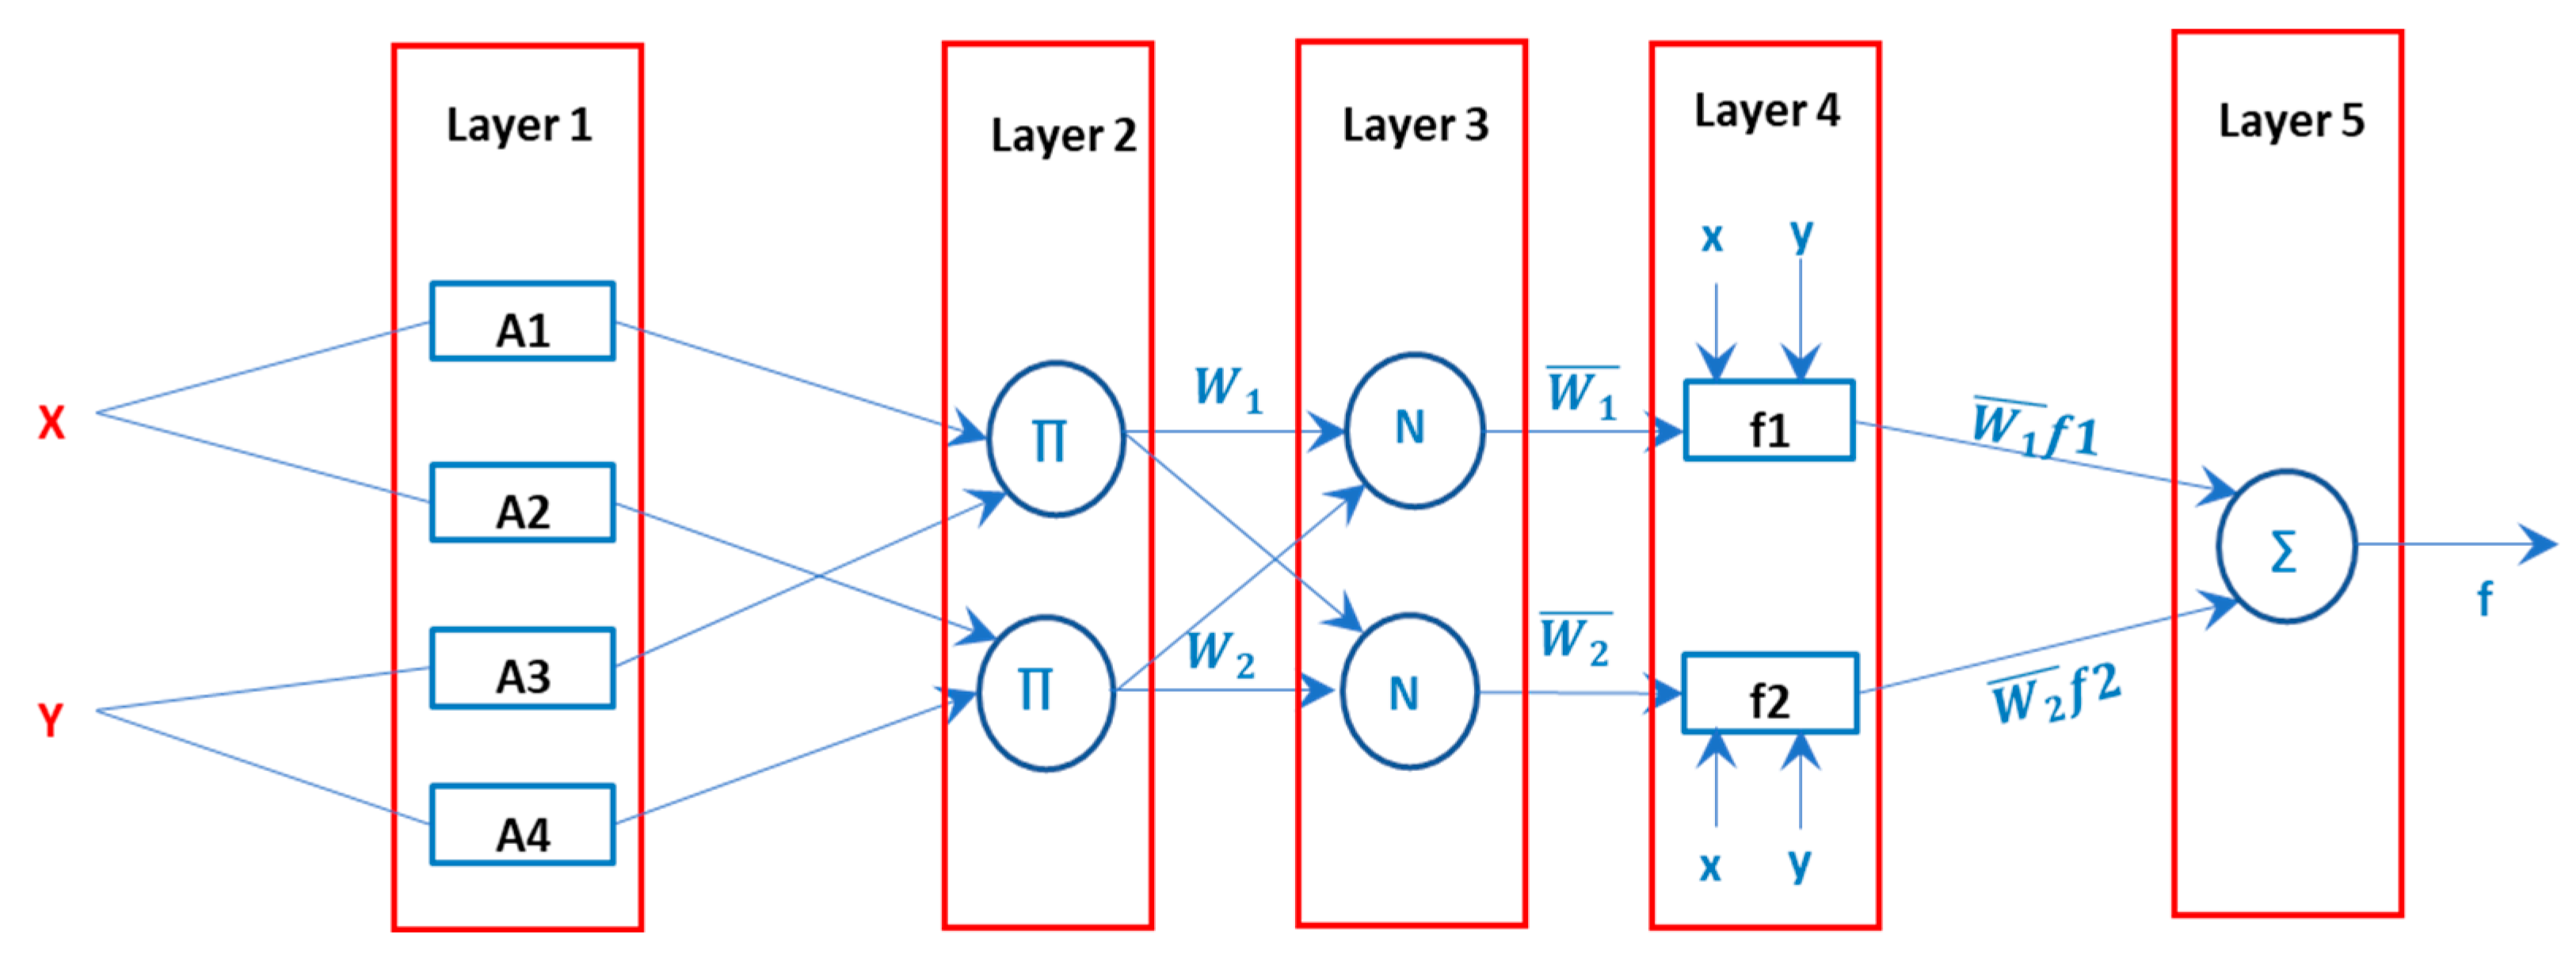
The ANFIS’s five-layer architecture includes two types of nodes: fixed and adaptable. Figure 2 shows the five ANFIS layers that will be discussed briefly.
-
First layer: Fuzzification; in this layer, each node “ i ” is a node on which the membership function of the next node is most dependent. So, it is called an adaptive node:
O i 1 = μ A i   ( x ) ,   i = 1 ,   2 ,  
O i 1 = μ B i   ( y ) ,   i = 1 ,   2 ,  
There are many fuzzy membership functions, i.e., Gaussian, triangular, trapezoidal, etc., that can be used; in this work, trapezoidal shape MF was used.
-
Second layer: Product layer calculates the rule firing strength via product ∏ operation.
O i 2 = μ A i   ( x ) × μ B i   ( y ) ,   i = 1 ,   2 ,  
-
Third layer: Normalized; in this layer, the normalized release force of a previous layer’s base is computed as follows:
O i 3 = w i ¯ = w i w i ,   i = 1 ,   2 ,  
-
Fourth layer: Defuzzification; each node indicates a distinct component of the fuzzy rule. The linear coefficients resulting from the rule are trainable.
O i 4 = w i ¯   f i = w i ¯ ( p k x + q k y + r k ) ,   i = 1 ,   2 ,  
where pk, qk, and rk are the linear parameters.
-
Fifth layer: Output layer; Layer 5 nodes defuzzified the consequent part of the rules by summing the outputs of all the rules.
O i 5 = i = 1 n w i ¯   f i = i = 1 n w i ¯ ( p k x + q k y + r k )
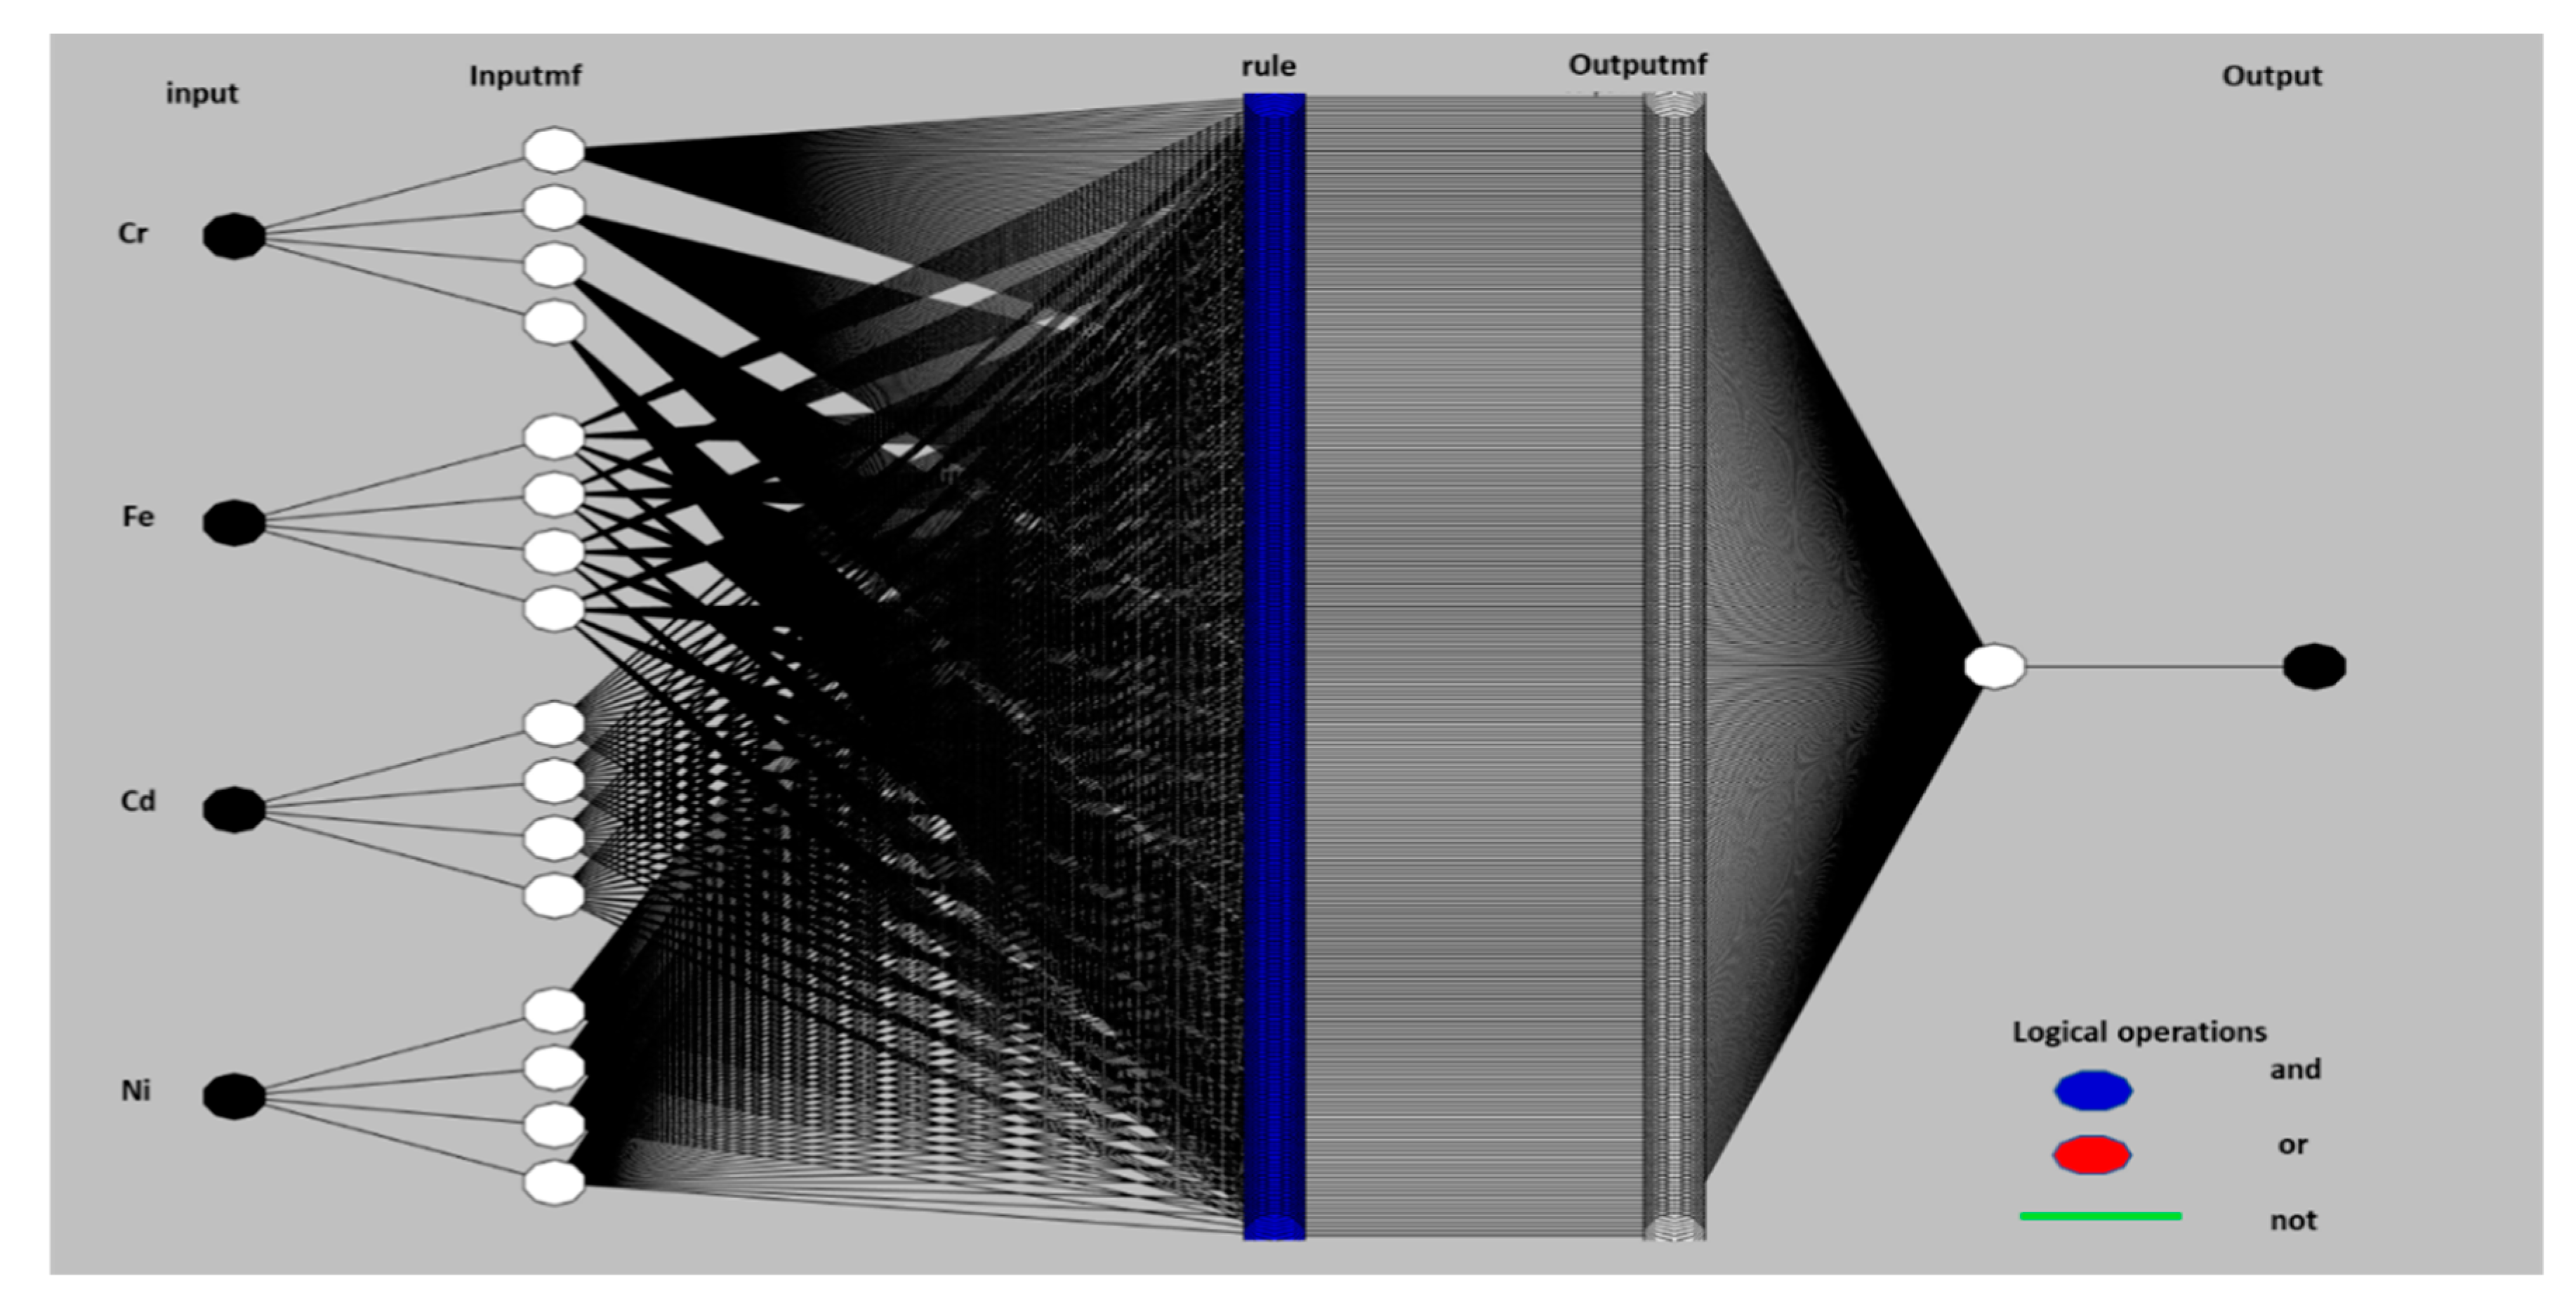
The hybrid optimization protocol was chosen by the FIS. For maximum training, the epoch was set to 1000, and error tolerance levels were programmed to be a part of 10,000. The structure of the ANFIS model consists of four inputs, one output, and a trapezoidal membership function (Trap. mf). FIS mechanisms use IF-THEN rules for connecting input and output data through fuzzy logic reasoning. Four input variable quantities (Cr, Fe, Cd, and Ni concentration) are described in Equations (10) to (12); each input contains four membership functions. According to [34], the FIS is a component of the ANFIS that is expressed as IF-THEN rules and can be applied to forecast system response.
Rule (1) for Equation (10).
IF x1 = a1 and y1 is b1 and z1 is c1 and g1 is d1 THEN f1 = w1x1 + w2y1 + w3z1 + w4g1 + r1
Rule (2) for Equation (11).
IF x2 = a2 and y2 is b2 and z2 is c2 and g2 is d2 THEN f2 = w1x2 + w2y2 + w3z2 + w4g2 + r2
Rule (3) for Equation (12).
IF x3 = a3 and y3 is b3 and z3 is c3 and g3 is d3 THEN f3 = w1x3 + w2y3 + w3z3 + w4g3 + r3
where x, y, z, and g are input parameters, z is the output parameters, a1 b1 c1 d1 to a4 b4 c4 d4 are the fuzzy logic sets, and w1 w2 w3 w4 r1 to w1 w2 w3 w4 r4 are the four input designed parameters figured out during the training [47]. The schematic representation of the ANFIS structure with four levels of membership functions is shown in Figure 3.

2.5.3. Model Performance

To validate the effectiveness of the proposed ANFIS approach, the statistical indices, MSE, RMSE, MAE, and R2 are used as indicated in Equations (13)–(16).
The root mean square error (RMSE) value is the mean distance between each data point and the regression line that was fitting [47,48], and it can be calculated using the following equation:
R M S E = 1 n i = 1 n Y i y ^ i 2
The value of the mean square error (MSE) calculates the variance between the actual and the predicted response, and it can be calculated using the equation below.
M S E = 1 n i = 1 n Y i y ^ i 2
The SSE is the sum of squared error; it measures the mean squared variance among the estimated and actual responses [48,49] and can be calculated using Equation (15).
S S E = 1 n i = 1 n Y i y i ¯ 2
So, the correlation coefficient (R2) can be calculated as represented in Equation (16):
R 2 = 1   i = 1 n Y i y ^ i 2 i = 1 n Y i y i ¯ 2
where n denotes the number of experimental data sets, and y ^ i and Y i denote the actual and predicted contamination response, respectively.

3. Results and Discussion

3.1. Concentration of Heavy Metals in Investigated Area

The soil that relies on the Bahr El-Baqar drain for irrigation became contaminated as a result of the discharge of urban, agricultural, and industrial wastewater into this drain. According to [7], 40% of the drainage water from home and commercial sources, 2% from industrial sources, and 58% from agricultural sources make up the Bahr El-Baqar drain’s total drainage water [50]. The amount of wastewater that is dumped into the Bahr El-Baqar drain in its entirety is 2,049,030 m3 day−1 [50]. Table 1 provides descriptive data for the investigated Cr, Fe, Cd, and Ni total concentrations. The mean total chromium content was 77.29 ± 18.49 mg kg−1, with a range of 28.62 to 146.45 mg kg−1. The range of iron content was 6468, having an average of 19,565 ± 4735 mg kg−1 to 38,526 mg kg−1. Total cadmium concentrations ranged from 0.24 to 25.47 mg kg−1, with an average of 1.48 ± 2.52 mg kg−1. The average amount of nickel per kilogram is 45.39 ± 10.01 mg (Table 1). The study area’s Cr concentrations are higher than Wedepohl (1995)’s [43] typical upper earth crust values and lower than DEA values (Table 1). Chromium can be found in all environmental media and is a naturally occurring element in the crust of the Earth. The largest natural source of chromium in the atmosphere is the continental dust flux, although human activities release far greater amounts. The average of Fe in the study area is less than the average upper earth crust [43] and higher than recommended values [51] (Table 1). Due to the different types of soil and the existence of other sources, Fe concentrations can vary greatly, even within small geographic areas. Most certain soils have total Cd contents that are higher than those considered to be typical for unpolluted soils [43,51]. Due to irrigation by untreated wastewater from the Bahr EL-Baqar drain, the study region’s proximity to waste incinerations, and fugitive emissions from industrial sites in the port area and vicinity of the Cairo Ismailia Road, certain sites had higher chromium concentrations than others in agreement with [50]. Chromium levels may be lower in some areas as a result of the ongoing removal of heavy metals by the food crops cultivated there, as well as from the heavy metals leaching into the deeper layers of the soil and groundwater. Except for Cd in select regions, these soils’ inherent characteristics allow them to still hold onto excess quantities of these metals while avoiding saturation [50]. However, with poor management and agricultural activities (the constant redox conditions) with an ongoing accumulation of these hazardous metals in the environment, this region will be exposed to a true calamity [50]. Due to the use of phosphate fertilizers and irrigation using untreated effluent from the Bahr EL-Baqar drain, cadmium levels are greater in the research area. Although the nickel contents in the research area’s soil samples are higher than the average values for the upper earth crust reported by [43], they are lower than the values reported by [51]. Agriculture fertilizers, particularly phosphates, are another important source of nickel in soil, albeit it is doubtful that nickel will accumulate there over time as a result of their use [52].

3.2. Mapping and Geostatistical Analysis

The semivariogram modeling parameters are shown in Table 2. The findings demonstrated that the spherical model and the exponential model were both extremely appropriate for Cr, Fe, and Ni. The stable model worked well with Cd, whereas the RMSSE values were around one. The semivariogram’s findings revealed that the nugget values for Cr, Fe, Cd, and Ni for all models ranged from 0.03 to 0.14. All models had a nugget/sill ratio that varied between 0.23 and 0.5. Additionally, the findings demonstrated a substantial spatial dependence of Cd, while the remaining models produced intermediate predictions, as shown in Table 2. The examined heavy metals’ spatial distribution maps indicated the northern regions of the research area as having the highest quantities of those metals. These locations are close to urban areas, where irrigation channels and drainage systems are impacted by several types of pollution (Figure 4).

3.3. ANFIS Modeling

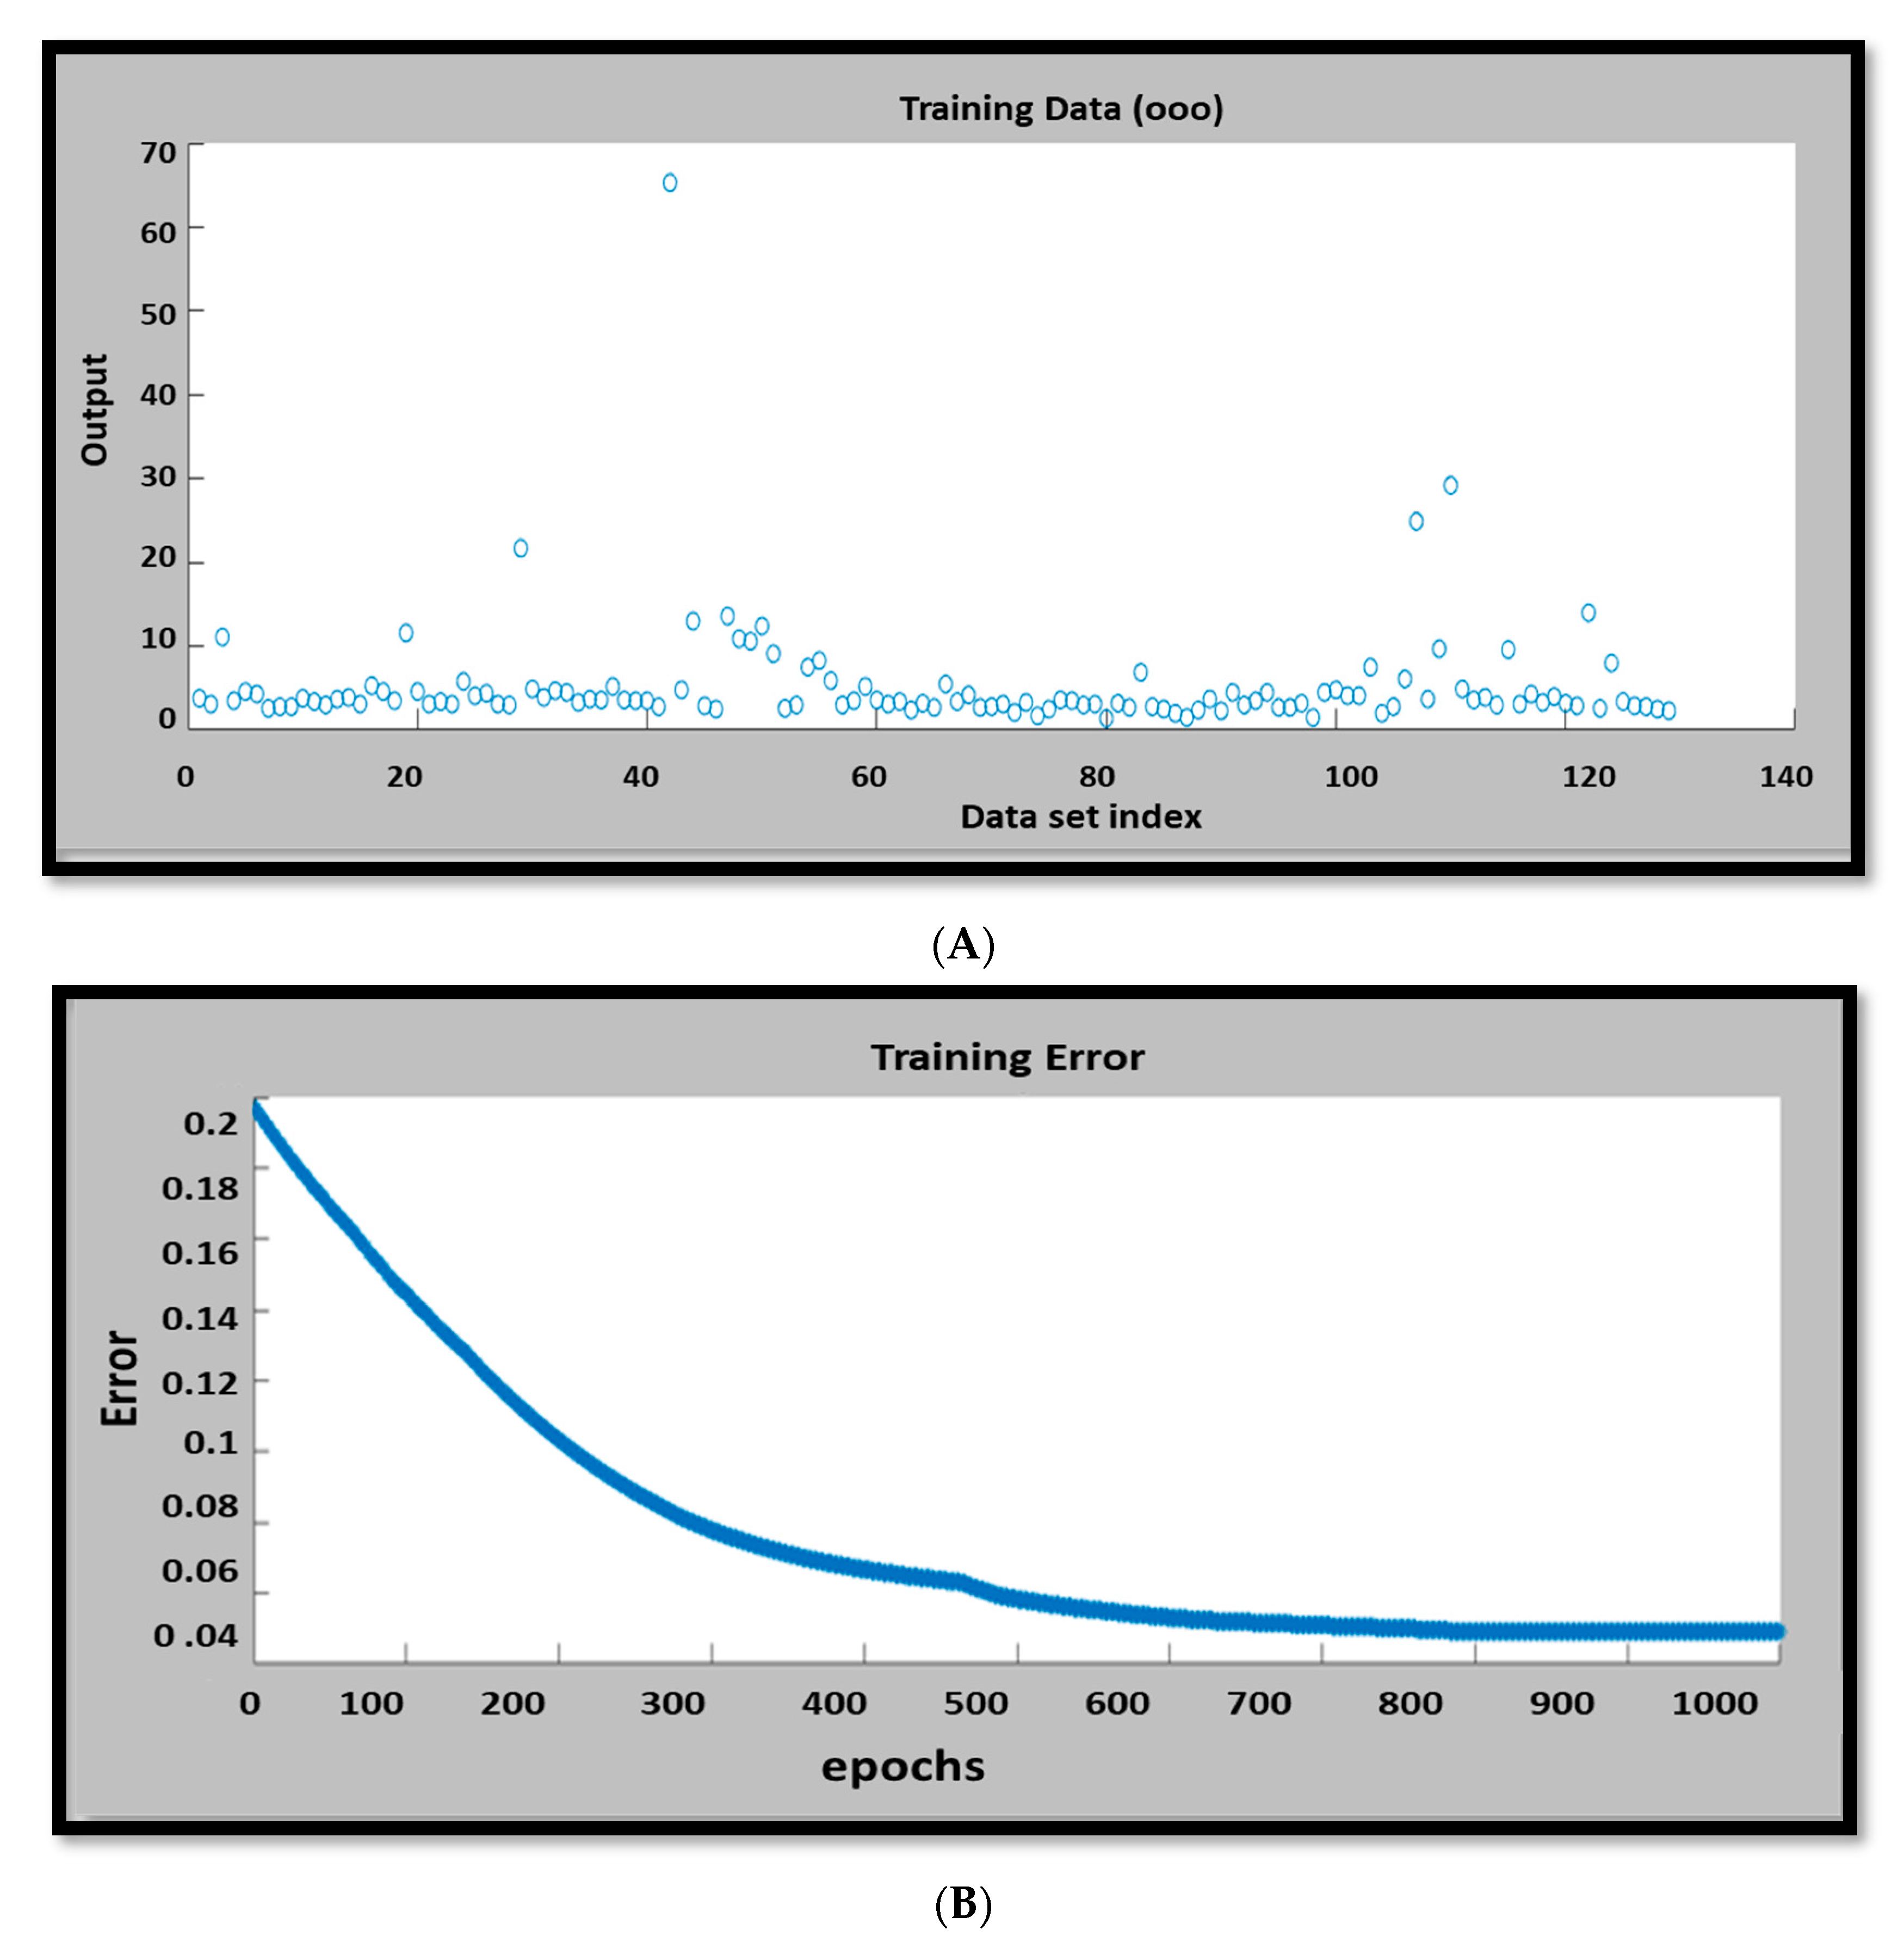
Heavy metal levels, including Cr, Fe, Cd, and Ni, were taken at the 150 position near the Bahr El-Baqar drain. In MATLAB R2019b software, the ANFIS modeling integrates fuzzy logic reasoning and neural network modeling to optimize the fuzzy inference system, allowing it to predict the likely outcomes of an existing complex real-world issue [53]. The predictive capability of the ANFIS was used to predict heavy metal concentrations in soils around the Bahr El-Baqar drain. Table 3 depicts the ANFIS structure, with parameters that indicate the lowest possible error. Due to the limited number of input variables, for data sorting and optimization, the grid partition was selected. Nevertheless, according to [54], the grid partition should not be used for substantial input parameters because it may cause variable calculation difficulties. In ANFIS modeling, the observed dataset stages were training, testing, and validation. Trapmf was used to characterize the input parameters in this paper, and the linear membership function was used to describe the output. The majority of the training dataset ensures a strong connection between the linear and nonlinear parameters, allowing the ANFIS algorithm to learn from it via a fuzzy simulation process [55]. Figure 5A depicts the training dataset output pattern. As shown in Figure 5B, the training average error value was 0.04969 with 1000 epochs.

3.4. Predictive Model

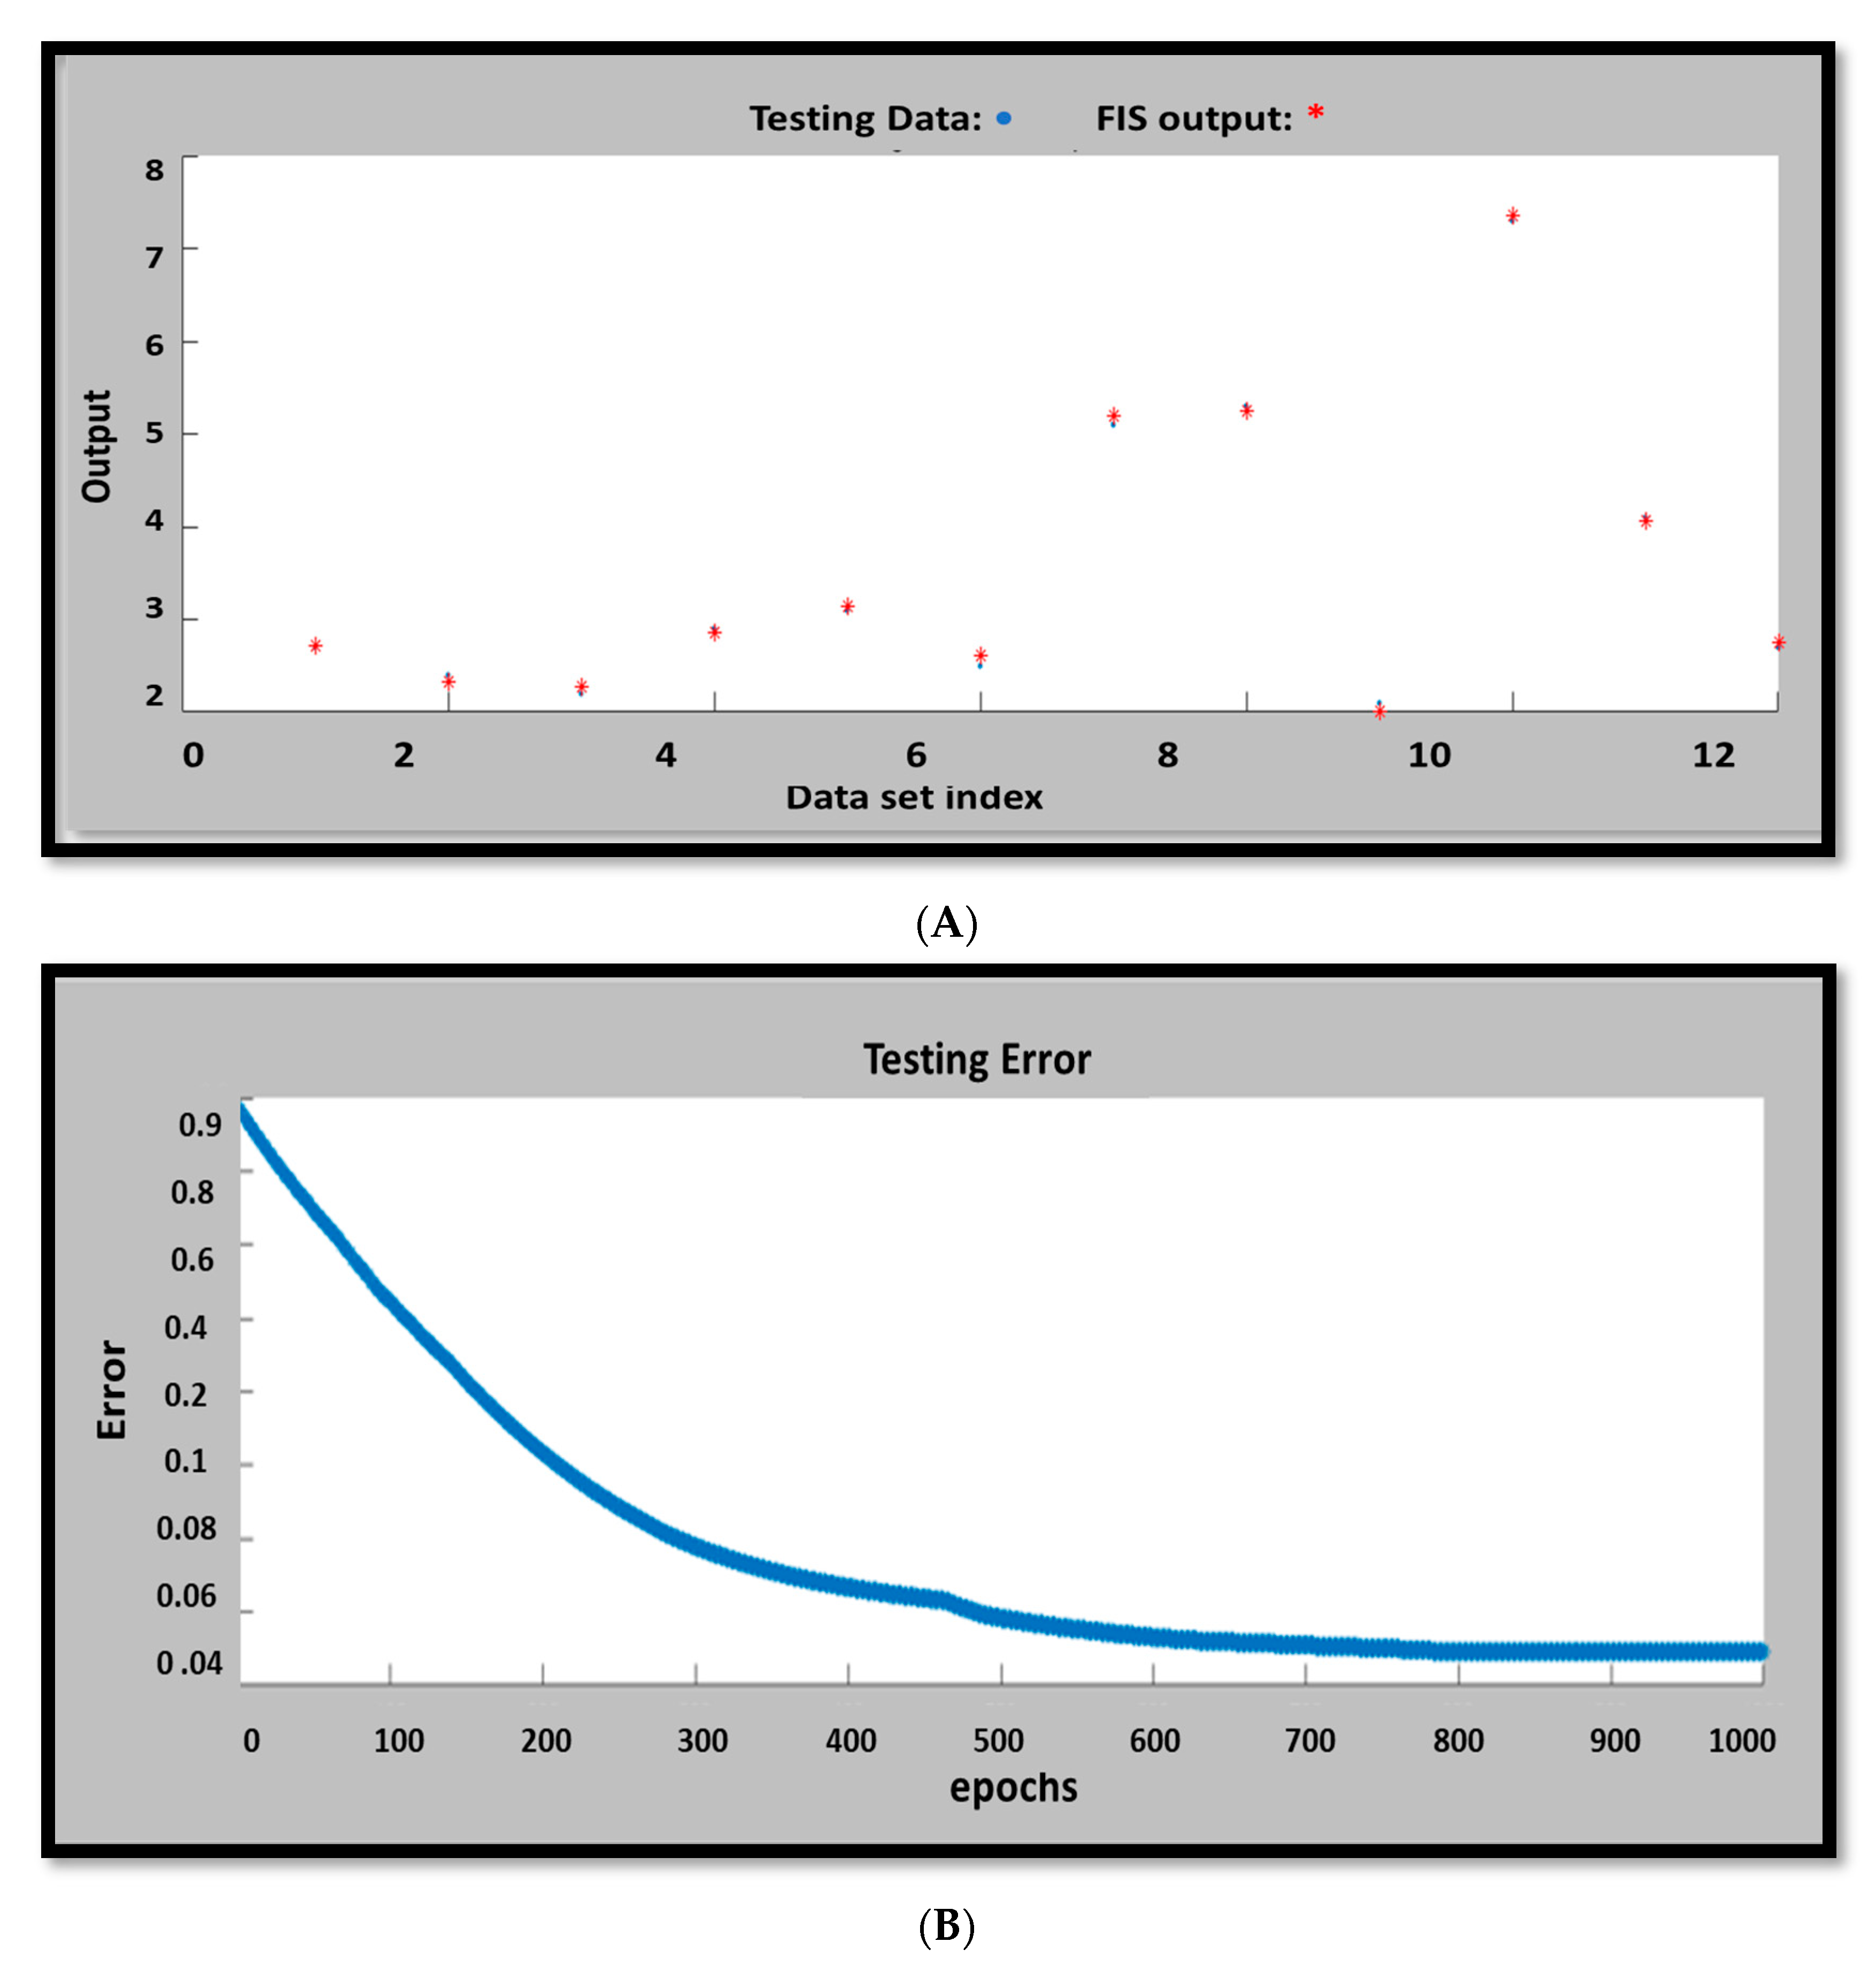
Figure 6 depicts the input and output variable’s interdependence using 256 rules. To determine the model’s efficacy, the model’s results had to be evaluated and compared to the results of laboratory analyses. According to [56], acceptable agreement among experimental and expected data from the ANFIS model when considering its performance indicators is prioritized. As a result, the trained ANFIS models were evaluated using RMSE, MSE, SSE, and R2. Table 4 and Figure 7A,B display the models’ test performances.
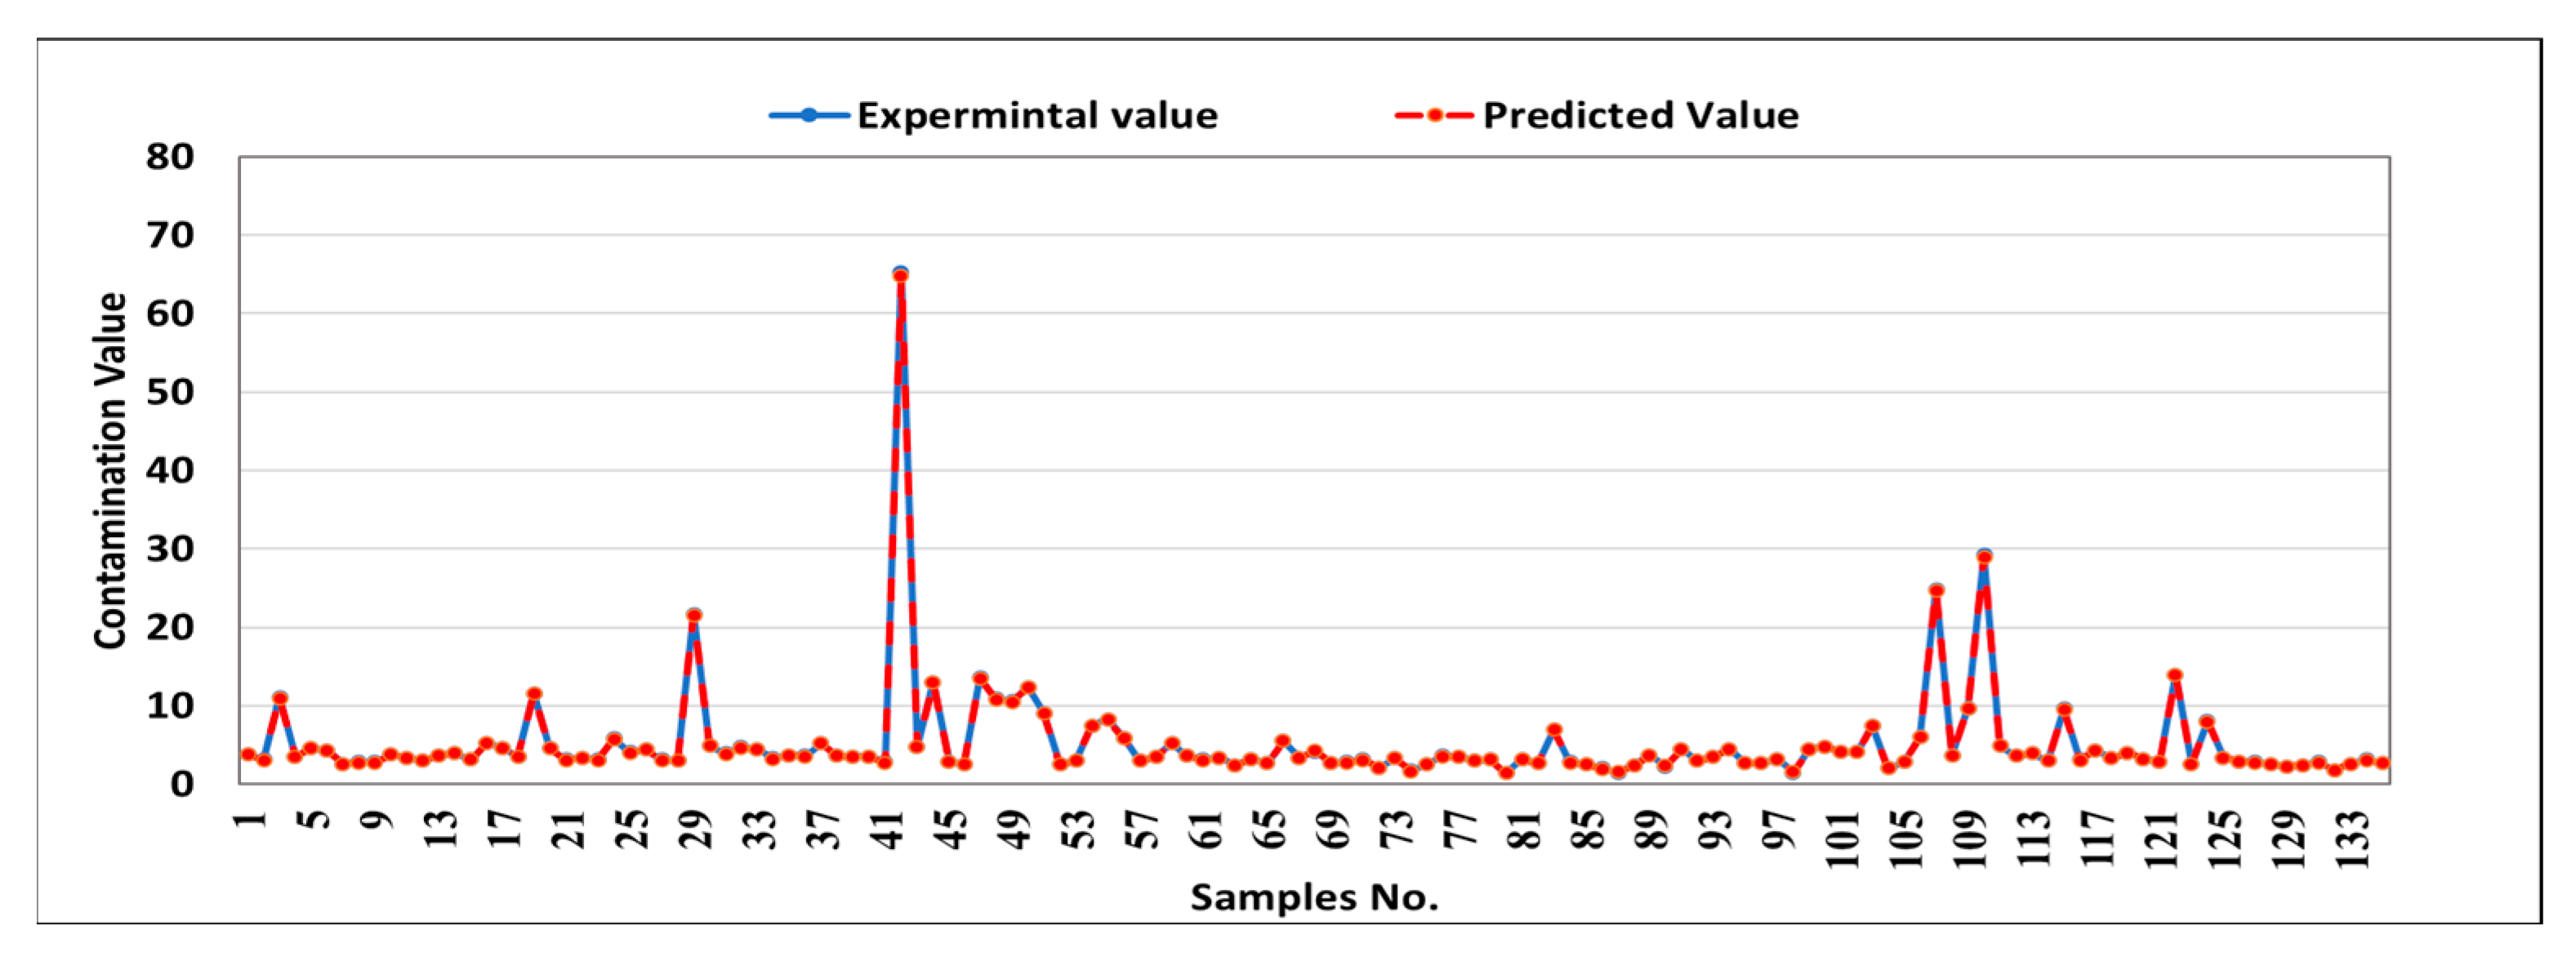
As shown in Table 4, the ANFIS model was developed with a high R2 for training and testing, with values of 0.99254 and 0.92857, respectively. The higher the determined correlation factor, the more ANFIS models were eliminated using various membership functions for various parameters [57]. To validate the efficiency of the ANFIS, the obtained ANFIS predictive results must be compared with the experimental results for training and testing samples. The overall samples are 150 in this study: 136 samples are chosen for training and 14 for the testing process, as mentioned before. Figure 8 and Figure 9 demonstrate the comparison between the experimental results and the obtained ANFIS predicted one for training and testing, respectively.
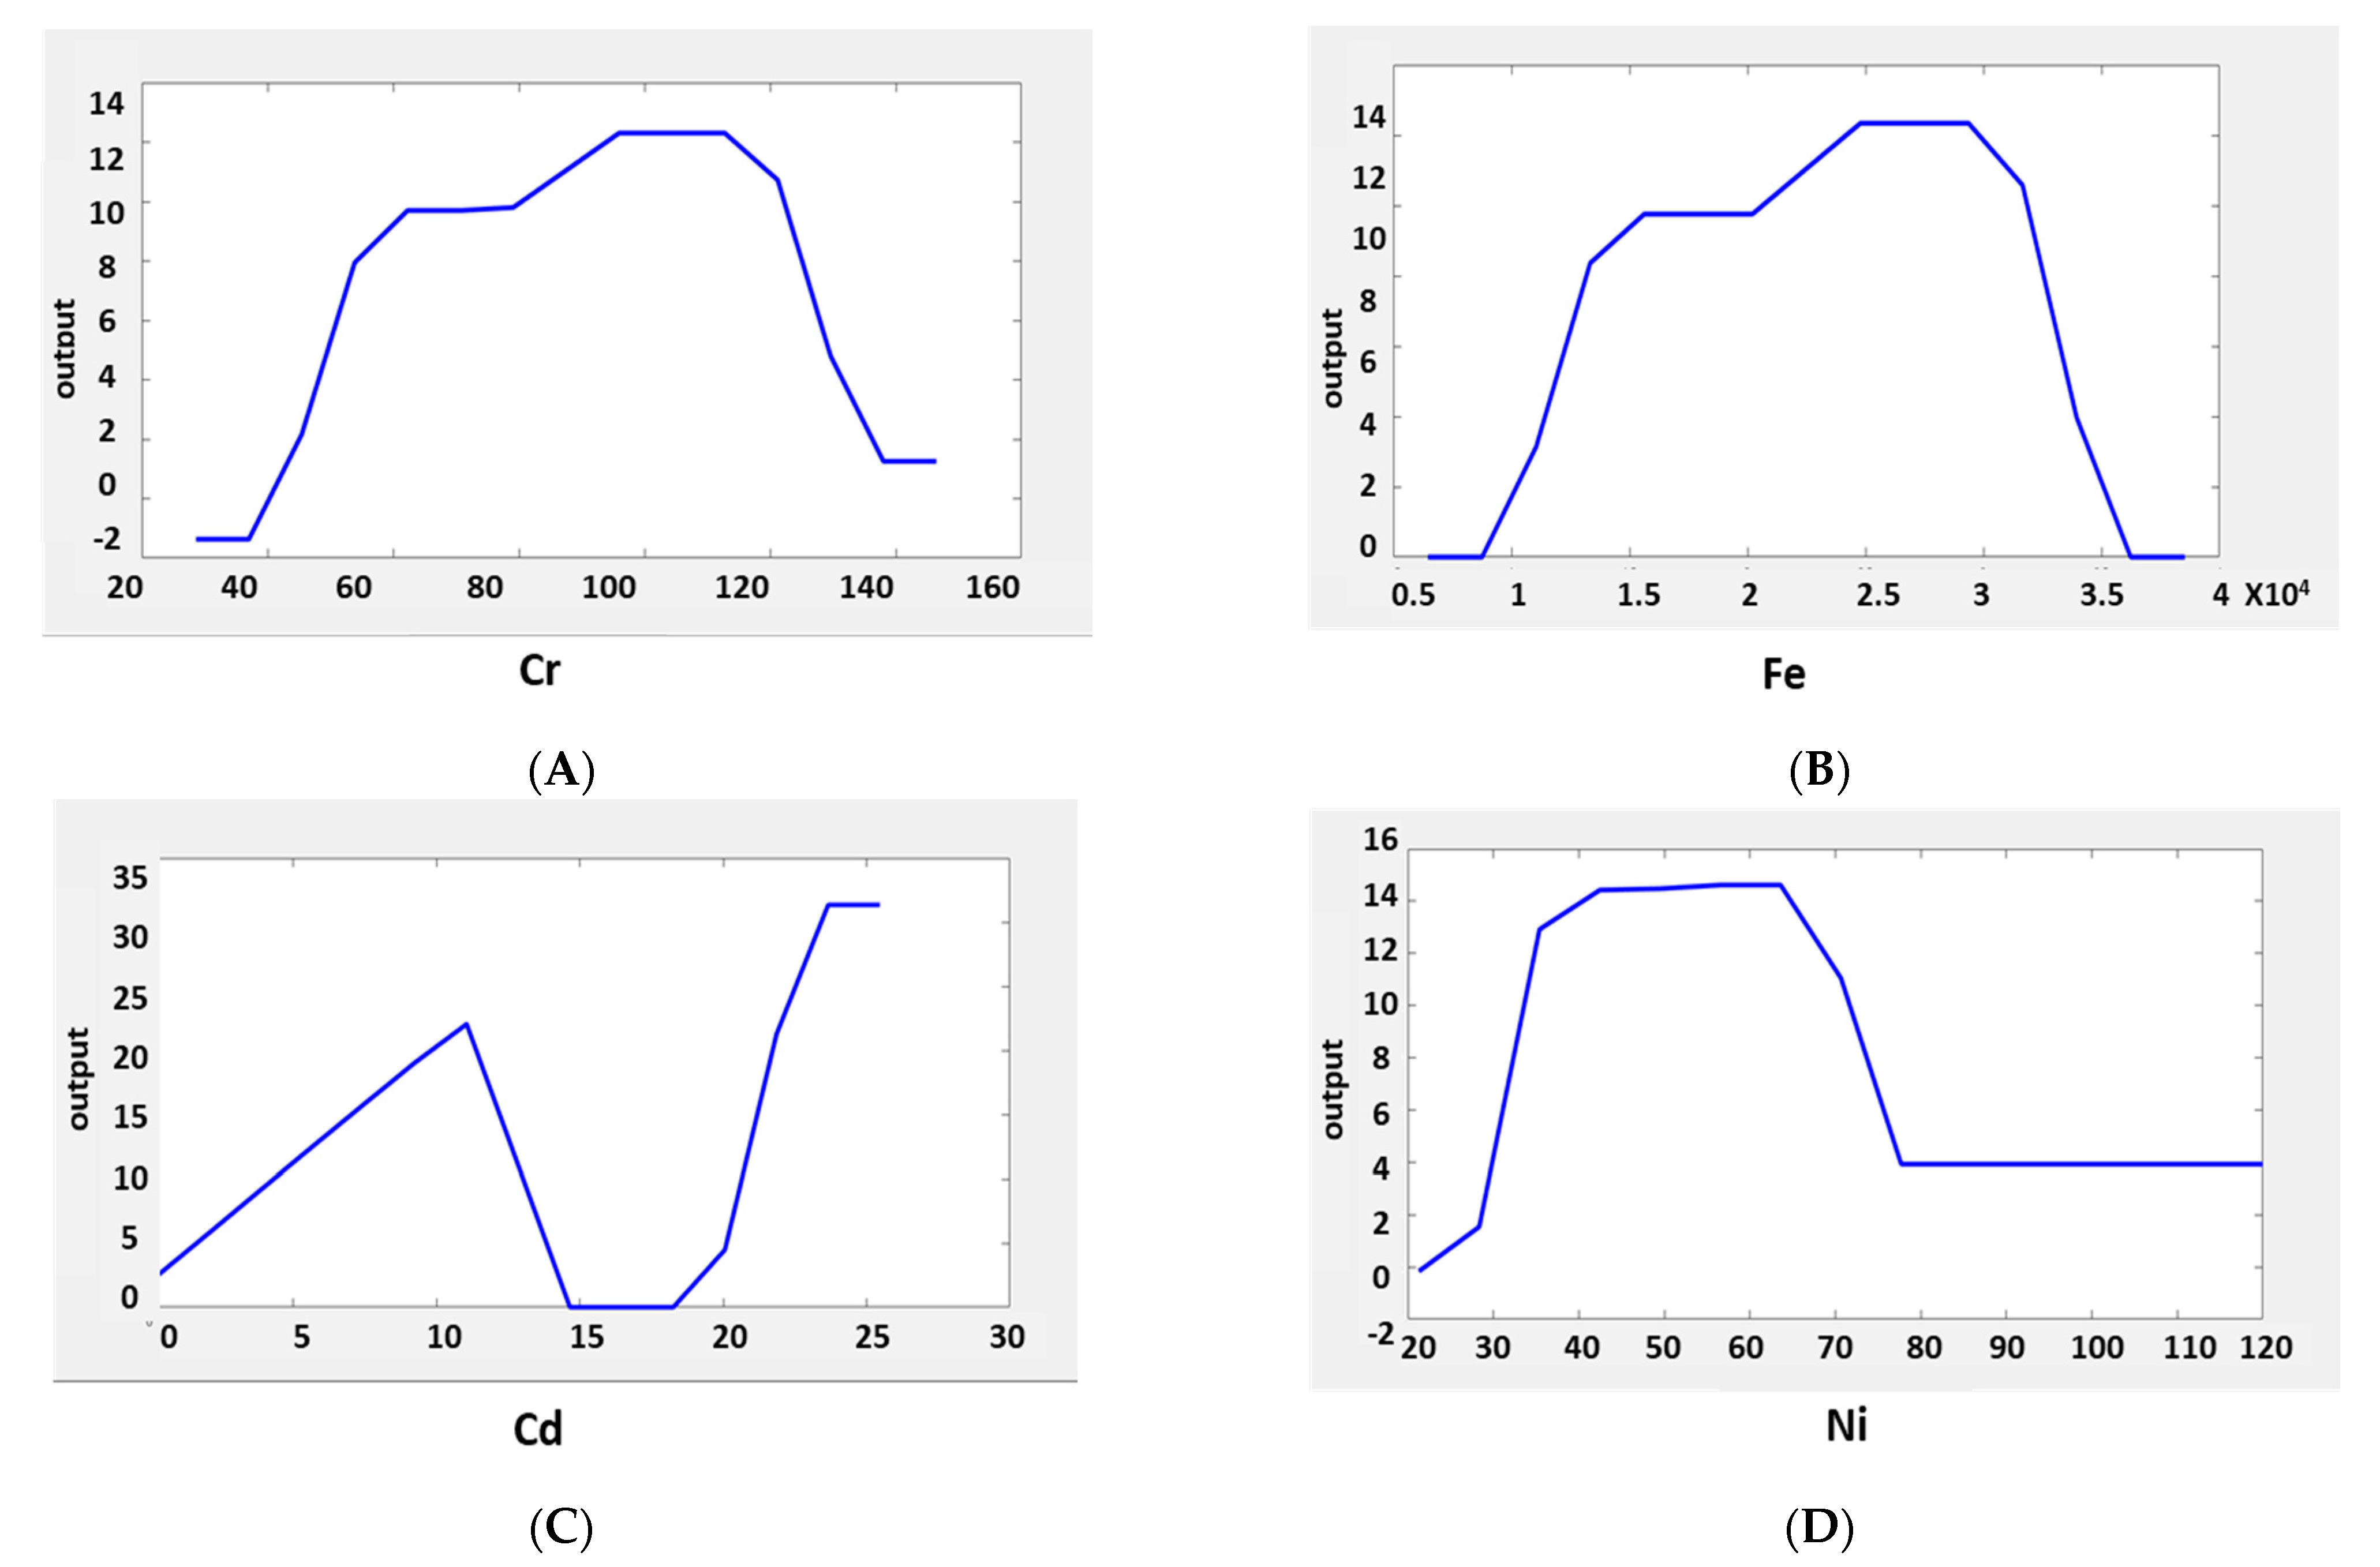
The obtained study results of heavy metals, Cr, Fe, Cd, and Ni concentrations about the total contamination level are shown in figures from Figure 10A–D, respectively. It can be noticed that the chromium concentration value ranges between 25 and 145 ppm, as demonstrated in Figure 10A, while Figure 10B shows that iron concentration ranges from 5000 to 40,000 ppm. Moreover, it depicts from Figure 10C that the cadmium ranges between 0 level to 25 ppm. As shown in Figure 10D, nickel ranges from 20 to 120.
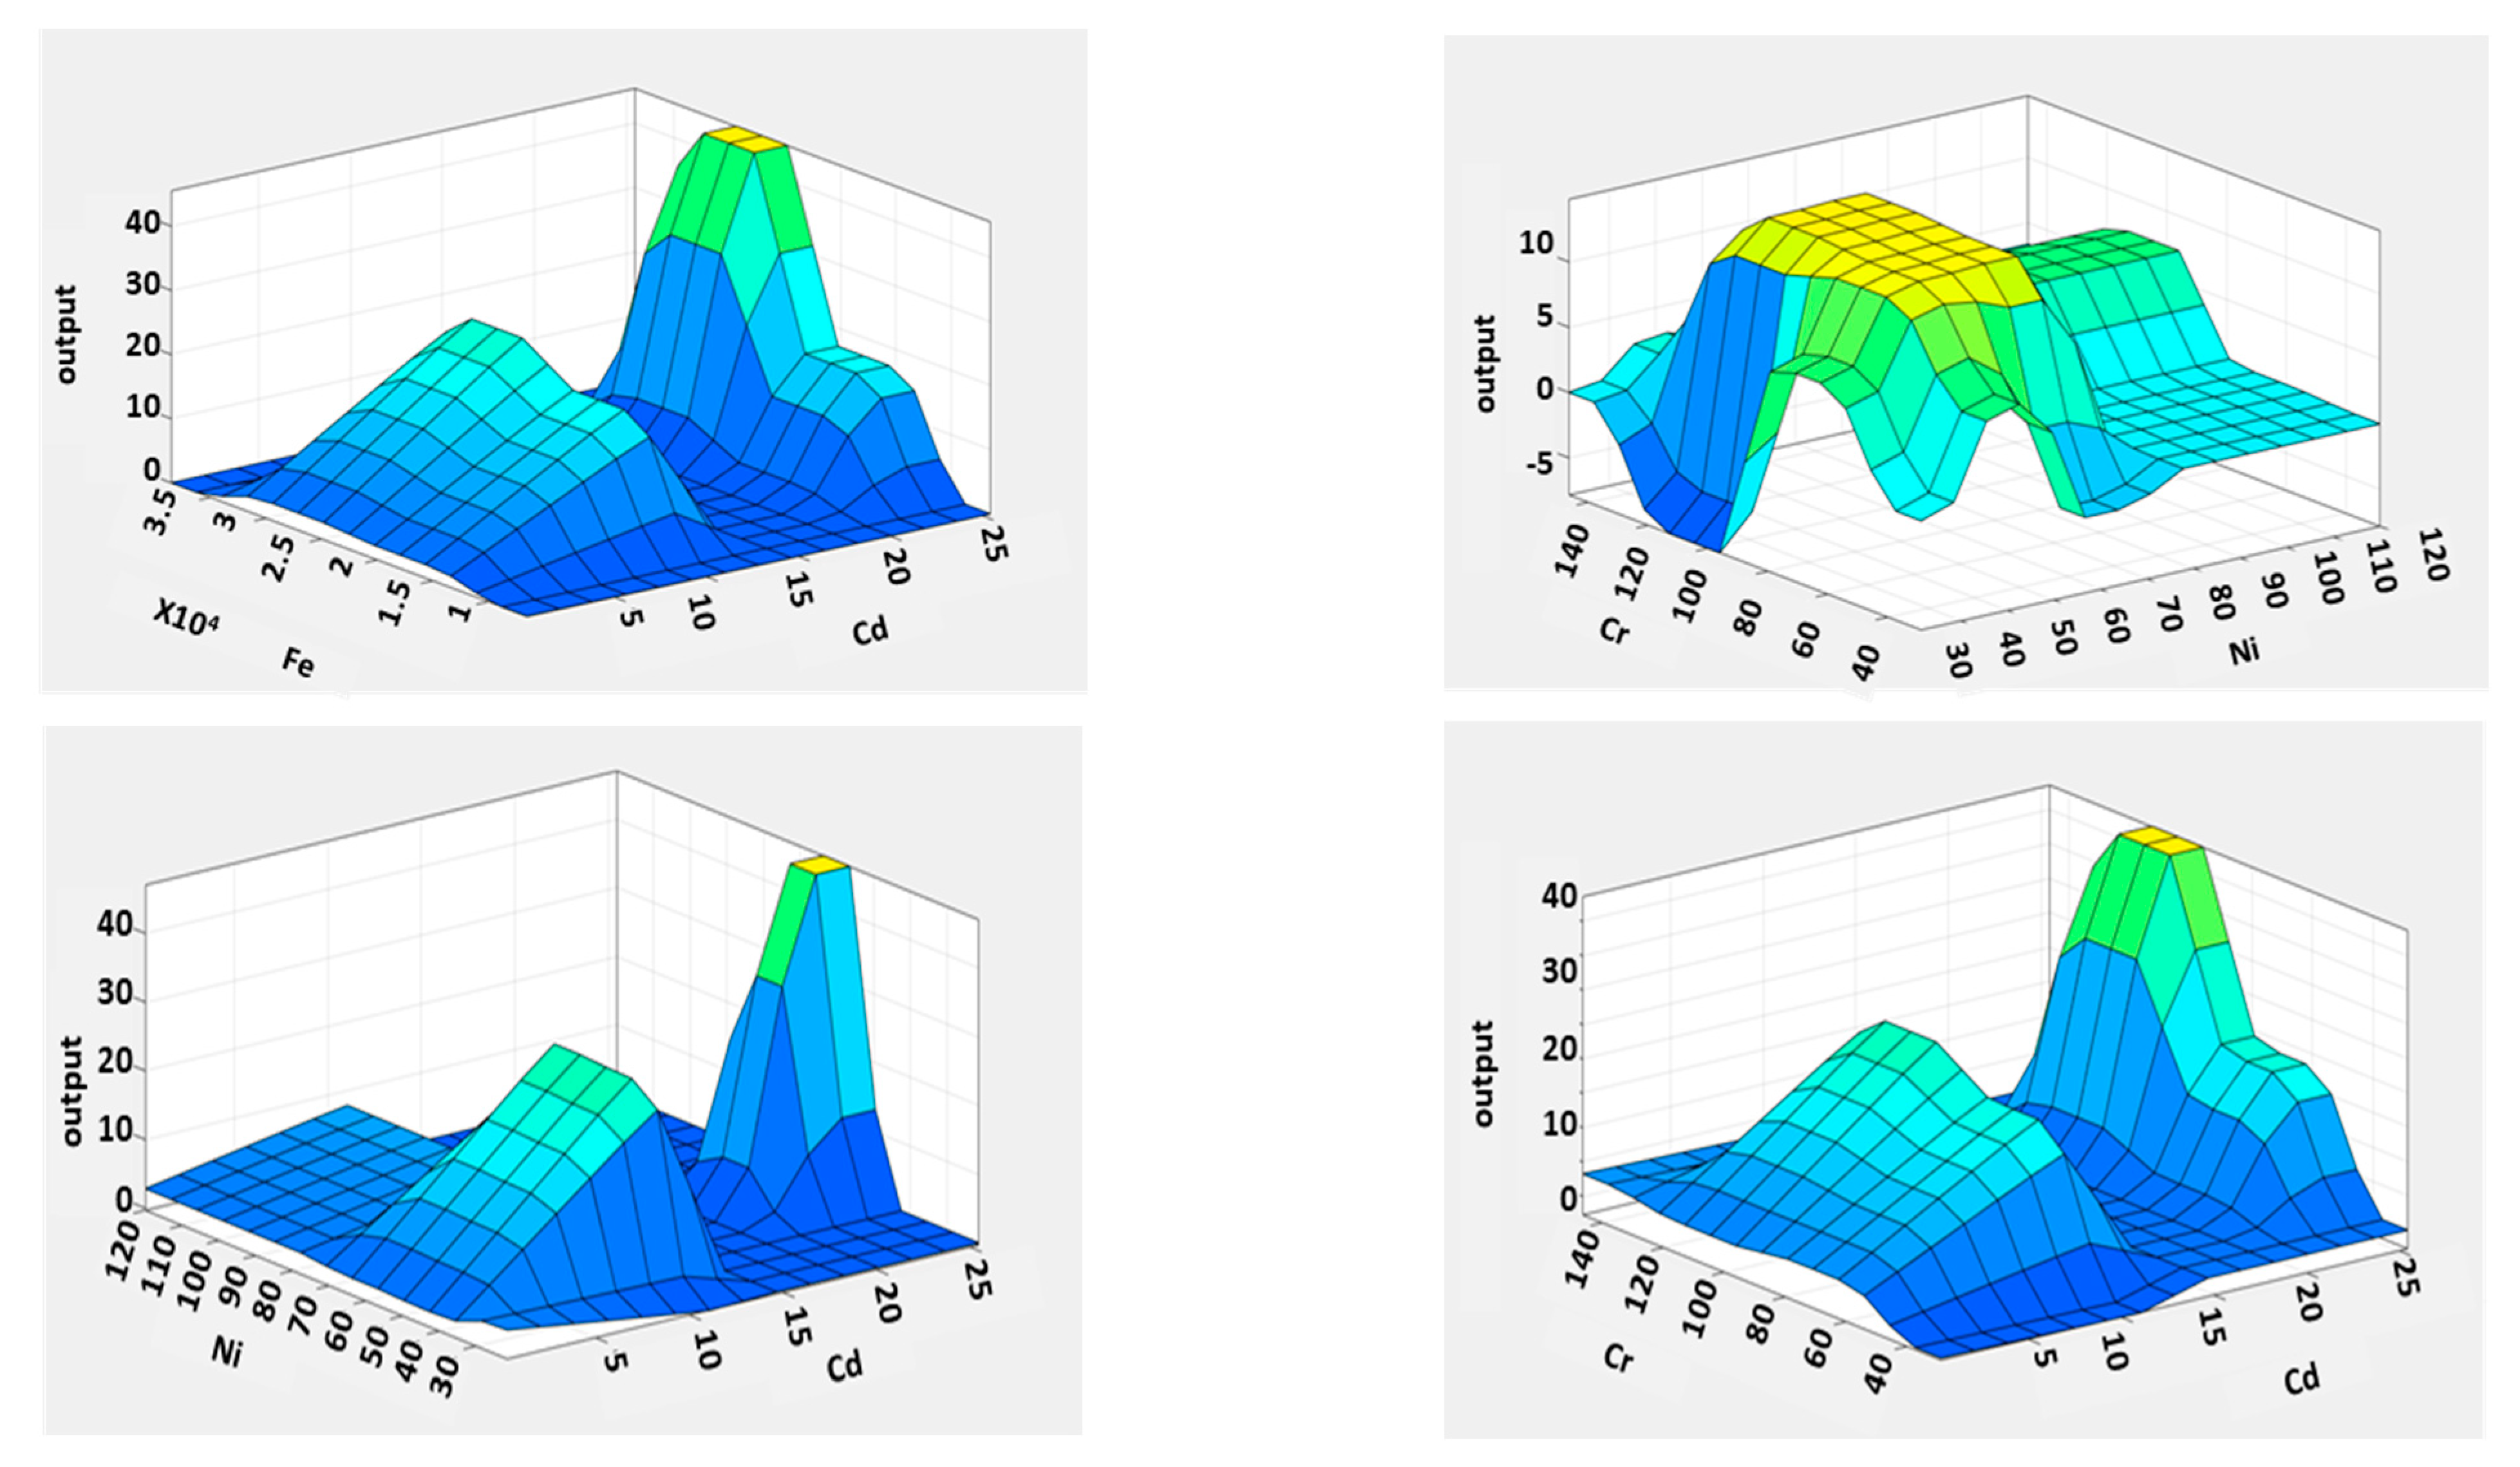
The predicted fuzzy rules’ surface view plots are shown in Figure 11. These three-dimensional plots depict the input and output parameters’ relationships. A higher correlation factor between observed and modeled Cd levels could be attributed to the study’s investigation with smaller input parameters. The ANFIS has an adaptive background and generates a fuzzy inference system using training data. As a result, the ANFIS was chosen for the study. The study’s findings can be compared to those of related studies discussed in this paper. The results proved the effectiveness of the proposed ANFIS models for Cr, Fe, Cd, and Ni concentration prediction in soils adjacent to the Bahr El-Baqar drain.

3.5. Modified Degree of Contamination (mCd)

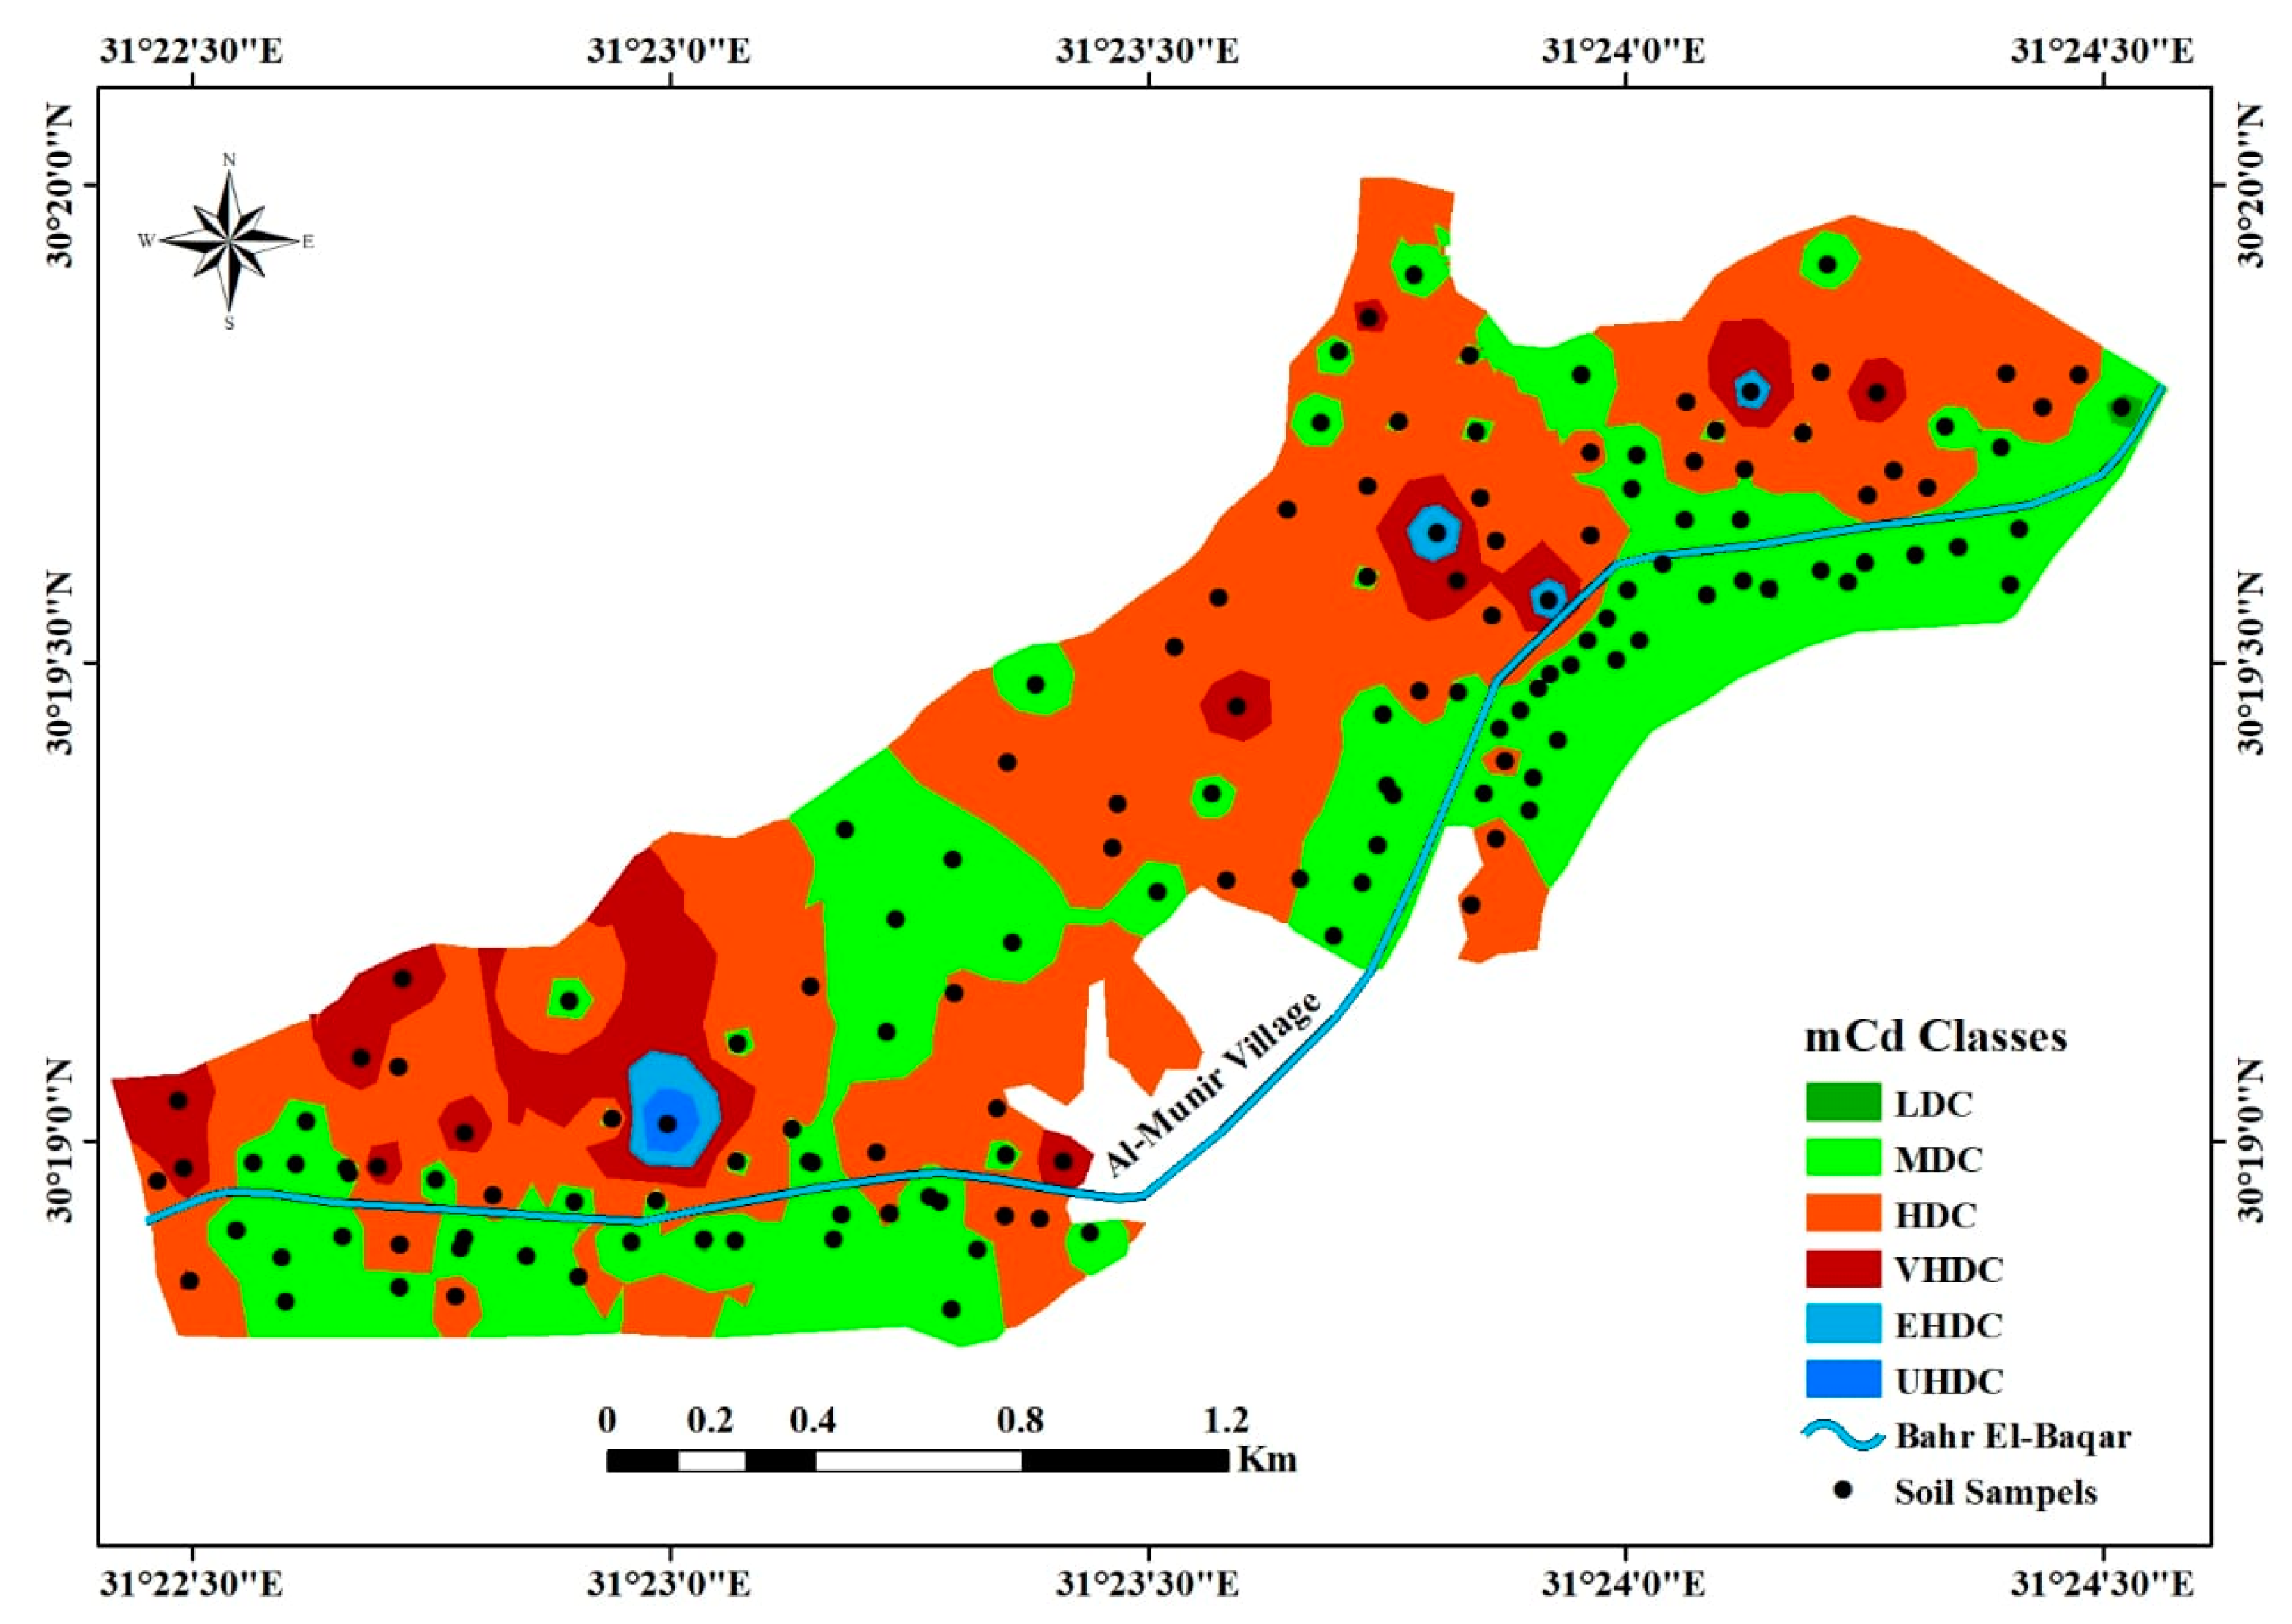
Six levels of contamination were present in the research region, as shown in Table 5 and Figure 12. The majority of the region under investigation (51.6%), where the average concentration of heavy metals to this degree was 82.86 ± 15.59, 20,963.84 ± 4447.83, 1.46 ± 0.42, and 48.71 ± 11.88 mg kg−1 for Cr, Fe, Cd, and Ni, respectively, was considered to be highly contaminated. In this area of the study, there are many types of pollution caused by human activity during agricultural management and contamination from irrigation water sources. However, the lowest degree only takes up roughly 0.02 percent of the entire area.

4. Conclusions

The assessment of soil pollution by heavy metals in the vicinity of the Bahr El-Baqar drain, which is regarded as one of the most significant barriers to sustainable development and food security, is highlighted in the current study. The discharge of municipal, agricultural, and industrial wastewater into this drain harmed the soils that are irrigated by the Bahr El-Baqar drain. In this study, semivariogram models were successfully applied to predict the maps of the spatial distribution of heavy metals in the studied area.
The ANFIS technique was applied to predict the degree of contamination by Cd, Fe, Cr, and Ni elements. The outcomes of the study demonstrated that the ANFIS approach produced very successful results and was capable of predicting the degree of contamination in soil. The findings demonstrated that Cr, Fe, and Ni were well-represented by both the exponential and spherical models. Although the RMSSE values were nearly one, Cd and the stable model worked well together. The area with the highest concentration of heavy metals made up about 51.6% of the research area. In addition, this degree’s average heavy metal content was 1.46 mg kg−1 for Cd, 48.71 mg kg−1 for Ni, 20,963.84 mg kg−1 for Fe, and 82.86 mg kg−1 for Cr.
The ANFIS model was discovered to be a reliable technique for predicting the levels of heavy metal in soil with an exceptionally high level of robustness and accuracy. For an ambiguous system with no experience with data behavior, the use of an ANFIS is critical. Through simulation and prediction, the findings of this study contribute to our understanding of heavy metal concentrations in soil. ANFIS models can be utilized as useful tools for forecasting the distribution of heavy metals in untested soils, eliminating the need for costly, time-consuming, and labor-intensive field or laboratory experiments. In the future, it is intended to continue working on it and propose an enhanced mechanism for predicting and forecasting the data at an early stage for many agriculture issues.

Author Contributions

Conceptualization, E.S.M., A.A.B., M.S.S. and H.M.E.A.; methodology, M.E.M.J., M.S.S., R.A.E.B. and H.M.E.A.; software, M.E.M.J., E.H., Y.F.A.A., M.S.S., R.A.E.B. and H.M.E.A.; validation, M.E.M.J., E.H., Y.F.A.A., M.S.S., R.A.E.B. and H.M.E.A.; formal analysis, M.E.M.J., E.H., Y.F.A.A., M.S.S., R.A.E.B. and H.M.E.A.; investigation; M.E.M.J., E.H., Y.F.A.A., M.S.S., R.A.E.B. and H.M.E.A. resources; E.S.M., M.E.M.J. and M.S.S. data curation; E.S.M., M.E.M.J., A.A.B., M.S.S. and H.M.E.A.; writing—original draft preparation, E.S.M., M.S.S., R.A.E.B., M.S.S. and H.M.E.A.; writing—review and editing, E.S.M., A.A.B., M.S.S., R.A.E.B., M.S.S. and H.M.E.A.; supervision, E.S.M., A.A.B. and D.E.K.; project administration, E.S.M. and A.A.B. All authors have read and agreed to the published version of the manuscript.

Funding

This research received no external funding.

Data Availability Statement

All data are included in the manuscript.

Acknowledgments

This paper was supported by the RUDN University Strategic Academic Leadership Program.

Conflicts of Interest

The authors declare no conflict of interest.

References

  1. Ismail, A.; Hettiarachchi, H. Environmental damage caused by wastewater discharge into the Lake Manzala in Egypt. Am. J. Biosci. Bioeng. 2017, 5, 141–150. [Google Scholar] [CrossRef]
  2. Aitta, A.; El-Ramady, H.; Alshaal, T.; El-Henawy, A.; Shams, M.; Talha, N.; Elbehiry, F.; Brevik, E.C. Seasonal and spatial distribution of soil trace elements around Kitchener drain in the northern Nile Delta, Egypt. Agriculture 2019, 9, 152. [Google Scholar] [CrossRef] [Green Version]
  3. Abd-Elaty, I.; Pugliese, L.; Zelenakova, M.; Mesaros, P.; Shinawi, A.E. Simulation-based solutions reducing soil and groundwater contamination from fertilizers in arid and semi-arid regions: Case study the Eastern Nile Delta, Egypt. Int. J. Environ. Res. Public Health 2020, 17, 9373. [Google Scholar] [CrossRef]
  4. He, Z.L.; Yang, X.E.; Stoffella, P.J. Trace elements in agroecosystems and impacts on the environment. J. Trace Elem. Med. Biol. 2005, 19, 125–140. [Google Scholar] [CrossRef]
  5. Abd-Elaty, I.; Zelenakova, M.; Straface, S.; Vranayová, Z.; Abu-hashim, M. Integrated modelling for groundwater contamination from polluted streams using new protection process techniques. Water 2019, 11, 2321. [Google Scholar] [CrossRef] [Green Version]
  6. Abdel-Shafy, H.I.; Aly, R.O. Water issue in Egypt: Resources, pollution and protection endeavors. Cent. Eur. J. Occup. Environ. Med. 2002, 8, 3–21. [Google Scholar]
  7. Saad, A. Environmental Hydrogeologic Impacts of Ground Water Withdrawal in the Eastern Nile Delta Region with Emphasis on Ground-Water Pollution Potential. Ph.D. Thesis, Ain Shams University, Cairo, Egypt, 1997. [Google Scholar]
  8. Zahran, M.A.E.-K.; El-Amier, Y.A.; Elnaggar, A.A.; Mohamed, H.A.E.-A.; El-Alfy, M.A.E.-H. Assessment and distribution of heavy metals pollutants in Manzala Lake, Egypt. J. Geosci. Environ. Prot. 2015, 3, 107. [Google Scholar] [CrossRef] [Green Version]
  9. Omran, E.; Abd El Razek, A.A. Mapping and screening risk assessment of heavy metals concentrations in soils of the Bahr El-Baker Region, Egypt. J Soil Sci Env. Manag. 2012, 6, 182–195. [Google Scholar]
  10. Soliman, R.M.; Othman, B.A.; Shoman, S.A.; Gado, M.M.; Azzam, M.I. Assessment of Bahr El-Baqar Drain and its Environmental Impact on Manzala Lake in Egypt. J. Ecol. Nat. Resour. 2022, 6, 2578–4994. [Google Scholar]
  11. El Behairy, R.A.; El Baroudy, A.A.; Ibrahim, M.M.; Kheir, A.M.; Shokr, M.S. Modelling and assessment of irrigation water quality index using GIS in semi-arid region for sustainable agriculture. Water Air Soil Pollut. 2021, 232, 352. [Google Scholar] [CrossRef]
  12. El Behairy, R.A.; El Baroudy, A.A.; Ibrahim, M.M.; Mohamed, E.S.; Kucher, D.E.; Shokr, M.S. Assessment of soil capability and crop suitability using integrated multivariate and GIS approaches toward agricultural sustainability. Land 2022, 11, 1027. [Google Scholar] [CrossRef]
  13. Galil Hussein, I.A.E. Desertification process in Egypt. In Coping with Global Environmental Change, Disasters and Security: Threats, Challenges, Vulnerabilities and Risks; Springer: Berlin/Heidelberg, Germany, 2011; pp. 863–874. [Google Scholar]
  14. Abdelhak, M. Soil improvement in arid and semiarid regions for sustainable development. In Natural Resources Conservation and Advances for Sustainability; Elsevier: Amsterdam, The Netherlands, 2022; pp. 73–90. [Google Scholar]
  15. Hendawy, E.; Belal, A.; Mohamed, E.; Elfadaly, A.; Murgante, B.; Aldosari, A.A.; Lasaponara, R. The prediction and assessment of the impacts of soil sealing on agricultural land in the North Nile Delta (Egypt) using satellite data and GIS modeling. Sustainability 2019, 11, 4662. [Google Scholar] [CrossRef] [Green Version]
  16. El Behairy, R.A.; El Baroudy, A.A.; Ibrahim, M.M.; Mohamed, E.S.; Rebouh, N.Y.; Shokr, M.S. Combination of GIS and Multivariate Analysis to Assess the Soil Heavy Metal Contamination in Some Arid Zones. Agronomy 2022, 12, 2871. [Google Scholar] [CrossRef]
  17. Shokr, M.S.; Abdellatif, M.A.; El Behairy, R.A.; Abdelhameed, H.H.; El Baroudy, A.A.; Mohamed, E.S.; Rebouh, N.Y.; Ding, Z.; Abuzaid, A.S. Assessment of Potential Heavy Metal Contamination Hazards Based on GIS and Multivariate Analysis in Some Mediterranean Zones. Agronomy 2022, 12, 3220. [Google Scholar] [CrossRef]
  18. Abuzaid, A.S.; Jahin, H.S.; Shokr, M.S.; El Baroudy, A.A.; Mohamed, E.S.; Rebouh, N.Y.; Bassouny, M.A. A Novel Regional-Scale Assessment of Soil Metal Pollution in Arid Agroecosystems. Agronomy 2023, 13, 161. [Google Scholar] [CrossRef]
  19. Omran, E.-S.E. Environmental modelling of heavy metals using pollution indices and multivariate techniques in the soils of Bahr El Baqar, Egypt. Model. Earth Syst. Environ. 2016, 2, 119. [Google Scholar] [CrossRef] [Green Version]
  20. Mohamed, E.; Ali, A.; El Shirbeny, M.; Abd El Razek, A.A.; Savin, I.Y. Near infrared spectroscopy techniques for soil contamination assessment in the Nile Delta. Eurasian Soil Sci. 2016, 49, 632–639. [Google Scholar] [CrossRef]
  21. Hammam, A.A.; Mohamed, W.S.; Sayed, S.E.-E.; Kucher, D.E.; Mohamed, E.S. Assessment of soil contamination using gis and multi-variate analysis: A case study in El-Minia Governorate, Egypt. Agronomy 2022, 12, 1197. [Google Scholar] [CrossRef]
  22. Uchimiya, M.; Bannon, D.; Nakanishi, H.; McBride, M.B.; Williams, M.A.; Yoshihara, T. Chemical speciation, plant uptake, and toxicity of heavy metals in agricultural soils. J. Agric. Food Chem. 2020, 68, 12856–12869. [Google Scholar] [CrossRef]
  23. Gautam, K.; Sharma, P.; Dwivedi, S.; Singh, A.; Gaur, V.K.; Varjani, S.; Srivastava, J.K.; Pandey, A.; Chang, J.-S.; Ngo, H.H. A review on control and abatement of soil pollution by heavy metals: Emphasis on artificial intelligence in recovery of contaminated soil. Environ. Res. 2023, 225, 115592. [Google Scholar] [CrossRef]
  24. El Behairy, R.A.; El Arwash, H.M.; El Baroudy, A.A.; Ibrahim, M.M.; Mohamed, E.S.; Rebouh, N.Y.; Shokr, M.S. Artificial Intelligence Integrated GIS for Land Suitability Assessment of Wheat Crop Growth in Arid Zones to Sustain Food Security. Agronomy 2023, 13, 1281. [Google Scholar] [CrossRef]
  25. Jang, J. ANFIS: Adaptive-Network Based Fuzzy Inference Systems. IEEE Trans Syst. Man Cybern. 1993, 23, 665–685. [Google Scholar] [CrossRef]
  26. Hooda, N.; Malik, M. Review on neuro-fuzzy system. In Available at SSRN 4033495; Elsevier: Amsterdam, The Netherlands, 2022. [Google Scholar]
  27. Salleh, M.N.M.; Talpur, N.; Hussain, K. Adaptive neuro-fuzzy inference system: Overview, strengths, limitations, and solutions. In Proceedings of the Data Mining and Big Data: Second International Conference, DMBD 2017, Fukuoka, Japan, 27 July–1 August 2017; pp. 527–535. [Google Scholar]
  28. Al-Hamed, S.; Wahby, M.; Al-Sulaiman, M.; Aboukarima, A. Prediction of soil fractions (sand, silt and clay) in surface layer based on natural radionuclides concentration in the soil using adaptive neuro fuzzy inference system. Open J. Soil Sci. 2014, 4, 215. [Google Scholar] [CrossRef] [Green Version]
  29. Aboukarima, A.; El-Marazky, M.; Ghoneim, A.; Ebid, A. Modelling of Sodium Adsorption Ratio of the Soil Using Adaptive Neuro Fuzzy Inference System. J. Exp. Agric. Int. 2016, 14, 1–12. [Google Scholar] [CrossRef]
  30. Sonmez, A.Y.; Kale, S.; Ozdemir, R.C.; Kadak, A.E. An adaptive neuro-fuzzy inference system (ANFIS) to predict of cadmium (Cd) concentrations in the Filyos River, Turkey. Turk. J. Fish. Aquat. Sci. 2018, 18, 1333–1343. [Google Scholar] [CrossRef] [PubMed]
  31. Rezaei, A.; Hassani, H.; Fard Mousavi, S.B.; Hassani, S.; Jabbari, N. Assessment of heavy metals contamination in surface soils in Meiduk copper mine area, SE Iran. Earth Sci. Malays. 2019, 3, 01–08. [Google Scholar] [CrossRef]
  32. Ucun Ozel, H.; Gemici, B.T.; Gemici, E.; Ozel, H.B.; Cetin, M.; Sevik, H. Application of artificial neural networks to predict the heavy metal contamination in the Bartin River. Environ. Sci. Pollut. Res. 2020, 27, 42495–42512. [Google Scholar] [CrossRef]
  33. Wong, Y.J.; Arumugasamy, S.K.; Chung, C.H.; Selvarajoo, A.; Sethu, V. Comparative study of artificial neural network (ANN), adaptive neuro-fuzzy inference system (ANFIS) and multiple linear regression (MLR) for modeling of Cu (II) adsorption from aqueous solution using biochar derived from rambutan (Nephelium lappaceum) peel. Environ. Monit. Assess. 2020, 192, 439. [Google Scholar] [CrossRef]
  34. Agbaogun, B.K.; Olu-Owolabi, B.I.; Buddenbaum, H.; Fischer, K. Adaptive neuro-fuzzy inference system (ANFIS) and multiple linear regression (MLR) modelling of Cu, Cd, and Pb adsorption onto tropical soils. Environ. Sci. Pollut. Res. 2023, 30, 31085–31101. [Google Scholar] [CrossRef]
  35. Page, A.; Miller, R.; Keeney, D. Methods of soil analysis. Part 2. American Society of Agronomy. Soil Sci. Soc. Am. Madison WI USA 1982, 4, 167–179. [Google Scholar]
  36. Isaaks, E.H.; Srivastava, R.M. Applied Geostatistics; Oxford University Press: New York, NY, USA, 1989; Volume 561. [Google Scholar]
  37. Templeton, G.F. A two-step approach for transforming continuous variables to normal: Implications and recommendations for IS research. Commun. Assoc. Inf. Syst. 2011, 28, 4. [Google Scholar] [CrossRef] [Green Version]
  38. Johnston, K.; Ver Hoef, J.M.; Krivoruchko, K.; Lucas, N. Using ArcGIS Geostatistical Analyst; Esri Redlands: Redlands, CA, USA, 2001; Volume 380. [Google Scholar]
  39. Gundogdu, K.S.; Guney, I. Spatial analyses of groundwater levels using universal kriging. J. Earth Syst. Sci. 2007, 116, 49–55. [Google Scholar] [CrossRef] [Green Version]
  40. Cambardella, C.; Elliott, E. Carbon and nitrogen dynamics of soil organic matter fractions from cultivated grassland soils. Soil Sci. Soc. Am. J. 1994, 58, 123–130. [Google Scholar] [CrossRef]
  41. Abrahim, G.; Parker, R. Assessment of heavy metal enrichment factors and the degree of contamination in marine sediments from Tamaki Estuary, Auckland, New Zealand. Environ. Monit. Assess. 2008, 136, 227–238. [Google Scholar] [CrossRef]
  42. Cheng, Q.; Wang, R.; Huang, W.; Wang, W.; Li, X. Assessment of heavy metal contamination in the sediments from the Yellow River Wetland National Nature Reserve (the Sanmenxia section), China. Environ. Sci. Pollut. Res. 2015, 22, 8586–8593. [Google Scholar] [CrossRef]
  43. Wedepohl, K.H. The composition of the continental crust. Geochim. Cosmochim. Acta 1995, 59, 1217–1232. [Google Scholar] [CrossRef]
  44. Rahman, S.H.; Khanam, D.; Adyel, T.M.; Islam, M.S.; Ahsan, M.A.; Akbor, M.A. Assessment of heavy metal contamination of agricultural soil around Dhaka Export Processing Zone (DEPZ), Bangladesh: Implication of seasonal variation and indices. Appl. Sci. 2012, 2, 584–601. [Google Scholar] [CrossRef] [Green Version]
  45. Soroush, E.; Mesbah, M.; Hajilary, N.; Rezakazemi, M. ANFIS modeling for prediction of CO2 solubility in potassium and sodium based amino acid Salt solutions. J. Environ. Chem. Eng. 2019, 7, 102925. [Google Scholar] [CrossRef]
  46. Najafi, B.; Ardabili, S.F. Application of ANFIS, ANN, and logistic methods in estimating biogas production from spent mushroom compost (SMC). Resour. Conserv. Recycl. 2018, 133, 169–178. [Google Scholar] [CrossRef]
  47. Hesami, M.; Naderi, R.; Tohidfar, M.; Yoosefzadeh-Najafabadi, M. Application of adaptive neuro-fuzzy inference system-non-dominated sorting genetic Algorithm-II (ANFIS-NSGAII) for modeling and optimizing somatic embryogenesis of Chrysanthemum. Front. Plant Sci. 2019, 10, 869. [Google Scholar] [CrossRef]
  48. Ani, K.A.; Agu, C.M.; Menkiti, M.C. Preliminary investigation and neural network modeling of palm oil mill effluent as a potential bio-stimulating organic co-substrate in hydrocarbon degradation. Environ. Chall. 2021, 5, 100216. [Google Scholar] [CrossRef]
  49. Sislian, R.; da Silva, F.V.; Coghi, M.A.; Gedraite, R. Neuro-fuzzy model-based simulation of a laboratory scale clean-in-place system: A study of the rinsing process. Environ. Chall. 2021, 4, 100098. [Google Scholar] [CrossRef]
  50. El-Bady, M.S. Spatial distribution of some important heavy metals in the soils south of Manzala Lake in Bahr El-Baqar region, Egypt. Nova J. Eng. Appl. Sci. 2014, 3, 1–12. [Google Scholar]
  51. Department of Environmental Affairs. National Norms and Standards for the Remediation of Contaminated Land and Soil Quality in the Republic of South Africa; Department of Environmental Affairs (DEA), National Environmental Management: Pretoria, South Africa, 2013.
  52. Alloway, B. Soil processes and the behaviour of metals. Heavy Met. Soils 1995, 13, 3488. [Google Scholar]
  53. Janardhana, K.; Sridhar, S.; Dixit, C.K.; Deivakani, M.; Tamilselvi, S.; Kaladgi, A.R.; Afzal, A.; Baig, M.A.A. ANFIS modeling of biodiesels’ physical and engine characteristics: A review. Heat Transf. 2021, 50, 8052–8079. [Google Scholar] [CrossRef]
  54. Noori, R.; Hoshyaripour, G.; Ashrafi, K.; Araabi, B.N. Uncertainty analysis of developed ANN and ANFIS models in prediction of carbon monoxide daily concentration. Atmos. Environ. 2010, 44, 476–482. [Google Scholar] [CrossRef]
  55. Perendeci, A.; Arslan, S.; Çelebi, S.S.; Tanyolaç, A. Prediction of effluent quality of an anaerobic treatment plant under unsteady state through ANFIS modeling with on-line input variables. Chem. Eng. J. 2008, 145, 78–85. [Google Scholar] [CrossRef]
  56. Amirkhani, S.; Nasirivatan, S.; Kasaeian, A.; Hajinezhad, A. ANN and ANFIS models to predict the performance of solar chimney power plants. Renew. Energy 2015, 83, 597–607. [Google Scholar] [CrossRef]
  57. Sayyad Amin, J.; Rajabi Kuyakhi, H.; Kashiwao, T.; Bahadori, A. Development of ANFIS models for polycyclic aromatic hydrocarbons (PAHs) formation in sea sediment. Pet. Sci. Technol. 2019, 37, 679–686. [Google Scholar] [CrossRef]
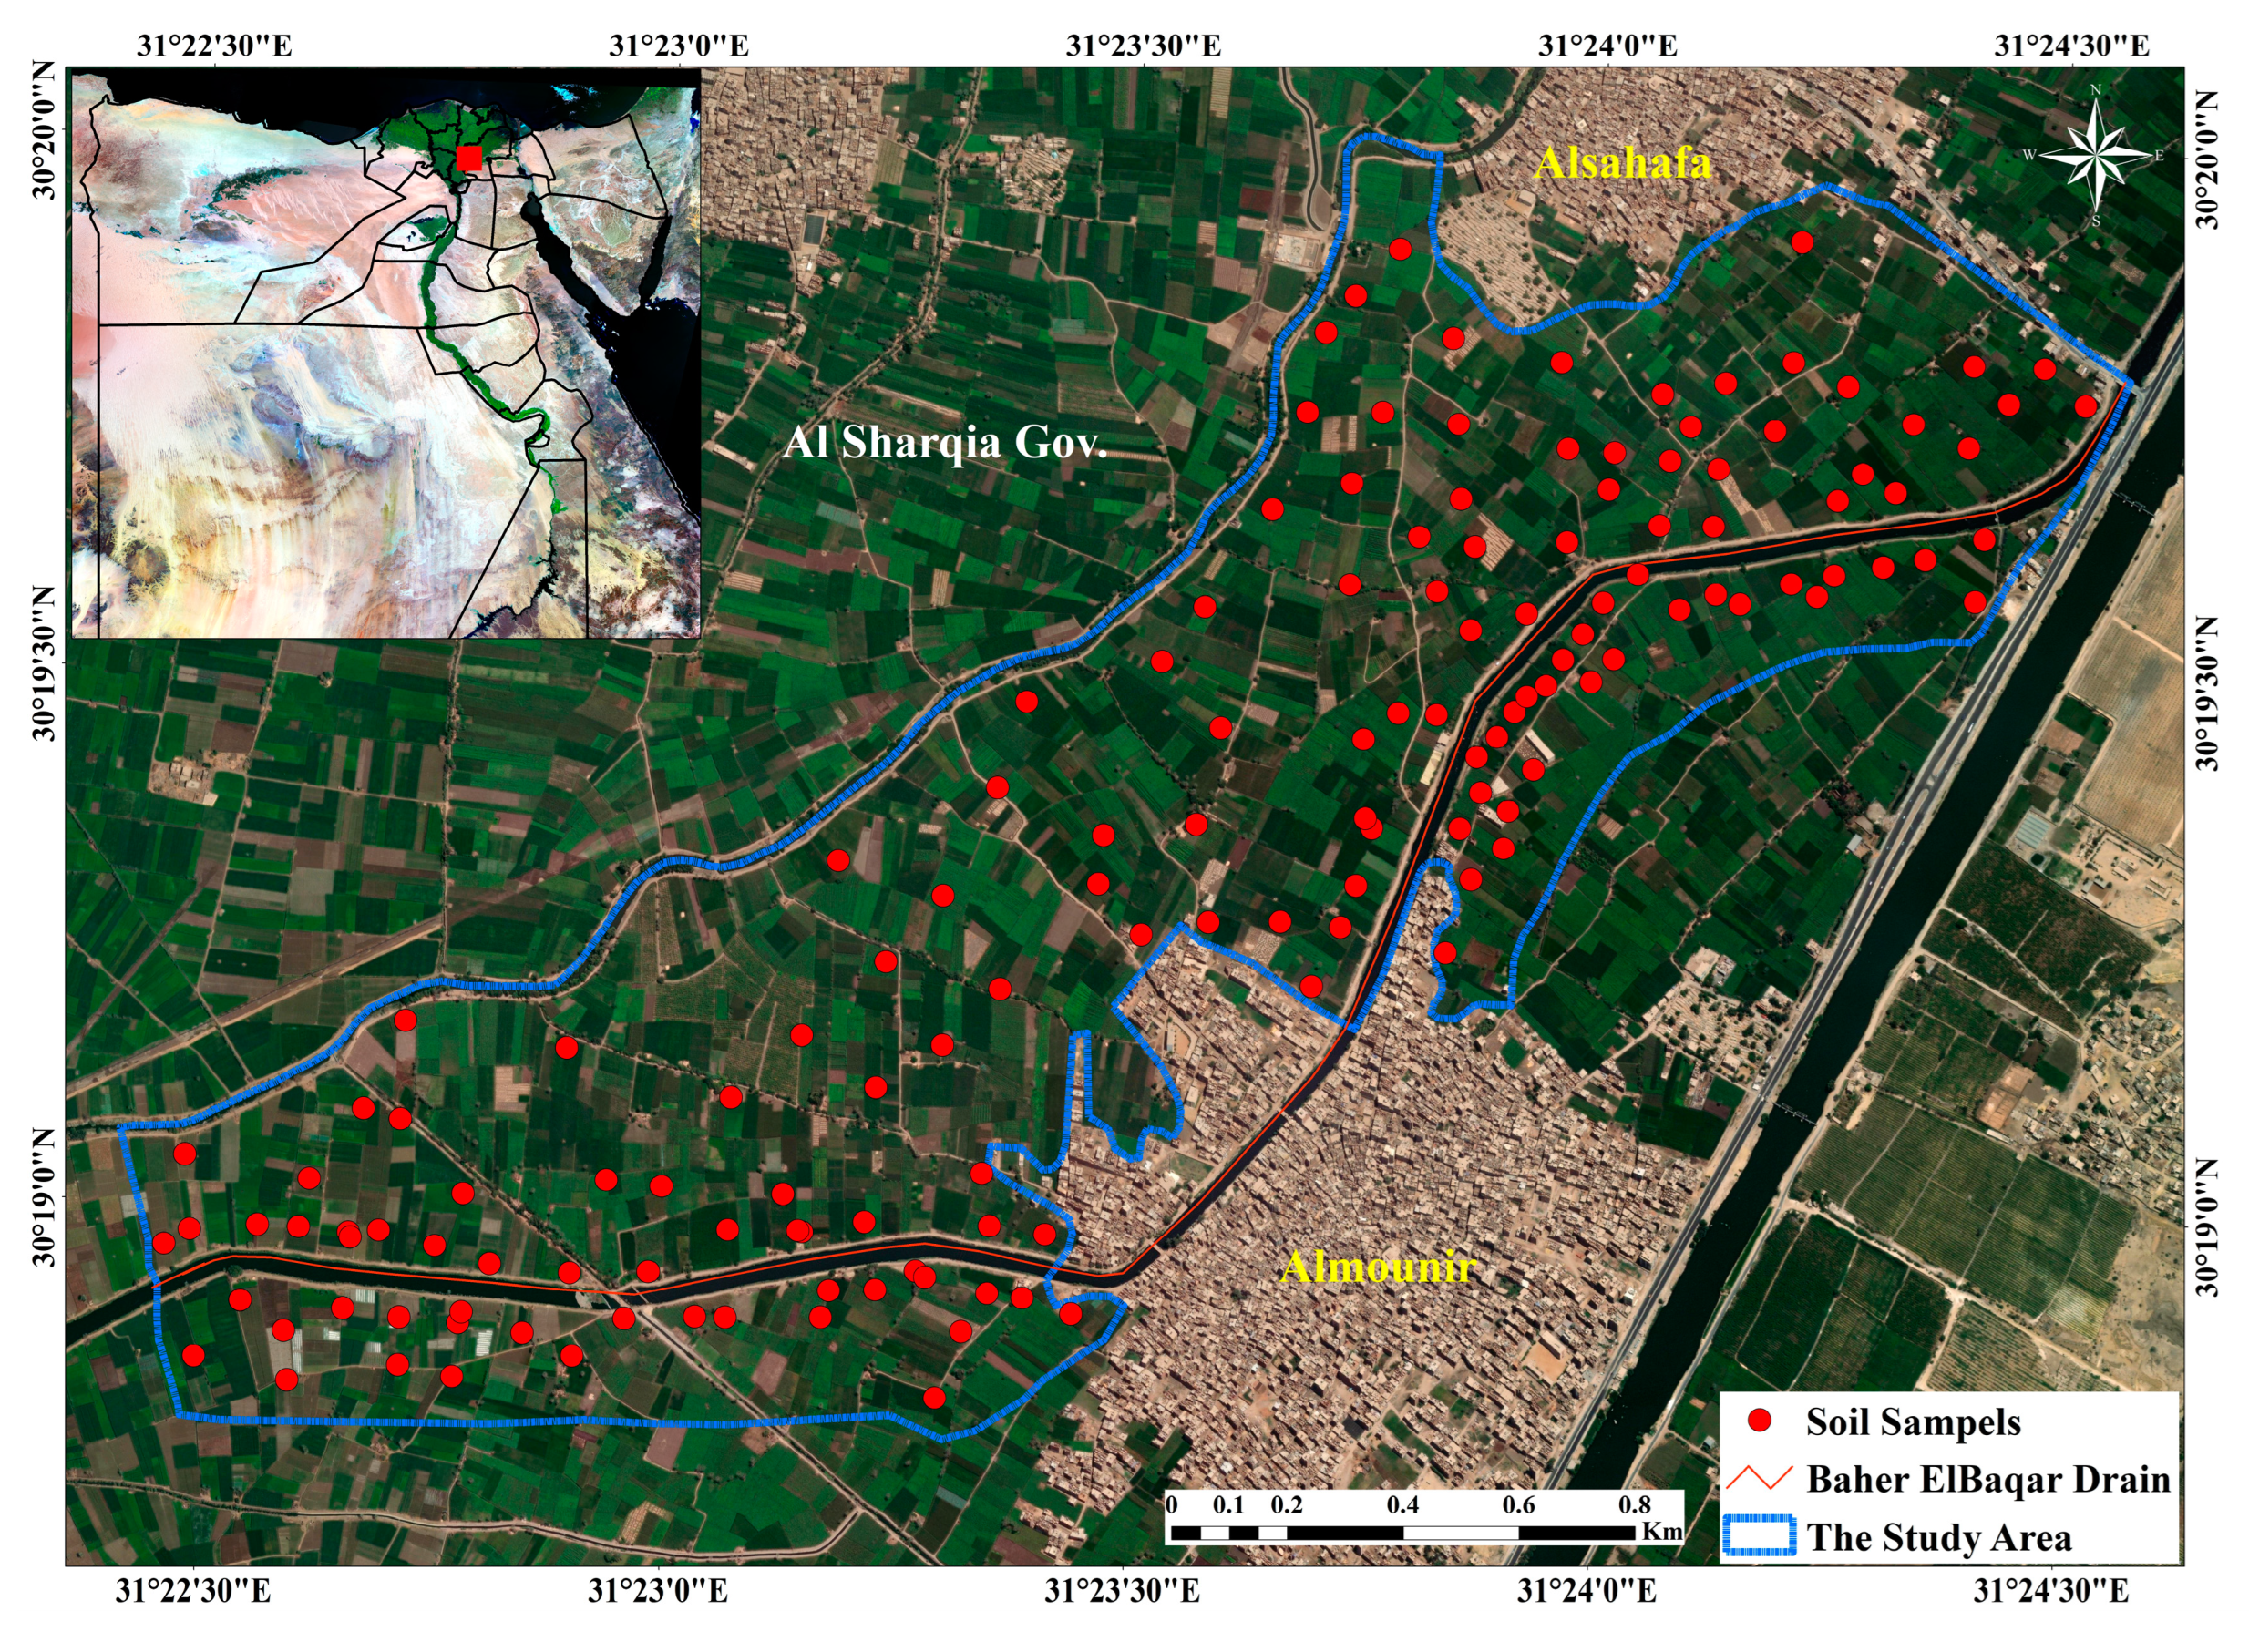
Figure 1. Distribution of samples over investigated area.
Agronomy 13 01873 g001
Figure 2. ANFIS layers’ architecture.
Agronomy 13 01873 g002
Figure 3. The schematic representation of the ANFIS structure with four levels of membership functions.
Agronomy 13 01873 g003
Figure 4. Ordinary kriging maps of selected heavy metals; (a) is spatial distribution of Cr (mg kg−1), (b) is spatial distribution of Fe (mg kg−1), (c) is spatial distribution of Cd (mg kg−1), and (d) is spatial distribution of Ni (mg kg−1).
Agronomy 13 01873 g004aAgronomy 13 01873 g004b
Figure 5. (A) Output versus ANFIS training data set. (B) Training error in relation to epoch.
Agronomy 13 01873 g005
Figure 6. Some of 256 rules depicts Input and output variable relationships.
Agronomy 13 01873 g006
Figure 7. (A) ANFIS testing data set versus output and (B) testing error versus epoch.
Agronomy 13 01873 g007
Figure 8. Comparison between the training experimental and the ANFIS predicted results.
Agronomy 13 01873 g008
Figure 9. Comparison between the testing experimental and the ANFIS predicted results.
Agronomy 13 01873 g009
Figure 10. Cr (A), Fe (B), Cd (C), and Ni (D) concentrations in relation to the total contamination output. Large distributed areas and heterogeneous characteristics of soil contamination.
Agronomy 13 01873 g010
Figure 11. A graphical representation of the relationships between input and output variables.
Agronomy 13 01873 g011aAgronomy 13 01873 g011b
Figure 12. Modified degree of contamination (mCd) within study area.
Agronomy 13 01873 g012
Table 1. Descriptive statistical analysis of soil heavy metals.
VariableMinMaxMeanSDSkewnessKurtosis
Cr (mg kg−1)28.62146.4577.2918.490.460.98
Fe (mg kg−1)6468.1738,526.619,565.154735.400.481.37
Cd (mg kg−1)0.2425.471.482.526.7958.31
Ni (mg kg−1)21.3082.1445.3910.010.881.46
Table 2. Semivariogram of selected heavy metals of the study area.
VariableModelNuggetPartialSillNugget/SillSDCMSEASERMSSEASE
(C0)Sill(C0 + C)
Cr (mg kg−1)Spherical0.0280.030.0250.48Moderate0.0140.0050.9750.45
Fe (mg kg−1)Exponential0.0350.0340.0690.5Moderate0.0260.0091.040.47
Cd (mg kg−1)Stable0.140.460.600.23strong0.0240.0210.990.52
Ni (mg kg−1)Exponential0.0280.0260.540.48Moderate0.0210.021.070.59
Table 3. ANFIS modeling parameters.
ParametersDescription/Values
FIS typeSugeno
Generated FISGrid partition
Membership Function typeTrapezoidal (Trapmf)
O/p Membership Functionlinear
I/Ps No.4
O/Ps No.1
Nodes No.551
Linear parameters No.256
Nonlinear parameters No.64
Training data pairs No.136
Parameters total No.320
Checking data pairs No.2
Testing data pairs No.14
Fuzzy rules No.256
Table 4. Evaluations of modeling error parameters.
ParametersTrainingTest
Network type optimizationHybridHybrid
RMSE0.048590.06450
MSE0.002360.00416
SSE0.316370.05824
R20.992540.92857
Table 5. Average contamination levels of heavy metals for each study area.
mCd ClassesCrFeCdNiAcer%Significantly of Different Classes
LDC50.46 ± 13.212,991.58 ± 48840.31 ± 0.0530.43 ± 6.791.280.2F
MDC76.03 ± 17.919,205.25 ± 4471.80.69 ± 0.1744.86 ± 8.57273.0537.5E
HDC82.86 ± 15.520,963.84 ± 4447.81.46 ± 0.4248.71 ± 11.88375.4551.6D
VHDC82.41 ± 22.9619,604.31 ± 3735.73.91 ± 0.8349.4 ± 21.2268.279.3C
EHDC84.72 ± 34.7022,286.91 ± 7490.57.23 ± 4.5856.26 ± 8.217.761.1B
UHDC90.623,464.725.4658.122.310.3A
Note: Different letters denote a substantial difference between metal concentrations. LDC = low degree of contamination, MDC = moderate degree of contamination, HDC = high degree of contamination, VHDC = very high degree of contamination, EHDC = extremely high degree of contamination, and UHDC = ultra-high degree of contamination. Positive values show pairs of means that are significantly different.
Disclaimer/Publisher’s Note: The statements, opinions and data contained in all publications are solely those of the individual author(s) and contributor(s) and not of MDPI and/or the editor(s). MDPI and/or the editor(s) disclaim responsibility for any injury to people or property resulting from any ideas, methods, instructions or products referred to in the content.