Abstract
The fruits of kiwifruit are well known for their abundant nutritional value and health benefits, but kiwifruit vines are susceptible to environmental factors such as drought or waterlogging. Optimum substrate moisture content (SMC) can decrease cultivation costs and improve the quality of seedlings in soilless cultivation. To quantify the water requirements of kiwifruit seedlings, a greenhouse study was conducted to investigate the growth, antioxidant defense, and photosynthetic parameters of seedlings of Actinidia valvata Dunn at six levels of SMC (20%, 40%, 60%, 80%, 100%, and 120%). Results showed that shoot and root dry matter accumulation increased gradually with the increase in SMC from 20% to 100% and was lower at 120% SMC than at 100% SMC. Electrolyte leakage and malondialdehyde content were the lowest at 80% and 100% SMC. Antioxidant enzyme activities, including superoxide dismutase, peroxidase, and catalase, chlorophyll content, net photosynthetic rate, maximal quantum yield of PSII photochemistry, photosynthetic electron transfer rate, and actual quantum yield were the highest at 80% and 100% SMC, but there was no significant difference in these parameters between the two treatments (80% and 100% SMC). However, the shoot and root dry weights of seedlings at 100% SMC were 13.20% and 33.02% higher than those at 80% SMC, respectively. In summary, 100% SMC provided optimal water supply for the photosynthetic efficiency and dry matter accumulation of shoots and roots. The results are expected to be useful for the mass production of high-quality kiwifruit seedlings in greenhouse or nursery containers, with the potential to save water.
1. Introduction
Kiwifruit (Actinidia sp.) is a perennial deciduous vine and its fruits are popular worldwide owing to their unique flavor and high nutritional value, especially for their high vitamin C content [1,2]. Kiwifruit are cultivated all over China, and the orchard area of 184,554 ha and fruit production of more than 2.23 million tons by 2020 were the highest in the world [3]. However, the yield per unit area lags other countries because of poor cultivation and management technologies [4]. Soilless cultivation is considered as a priority alternative for rapid propagation of high-class kiwifruit seedlings. The main advantages of soilless culture are better control of soil-borne diseases, fertilization, and irrigation, which improves the yield and quality of seedlings [5,6]. Currently, soilless substrate has been successfully used for cultivation of various fruit tree seedlings, including blueberries (Vaccinium. sp. L.) [7,8,9] and fig trees (Ficus carica L.), with better growth compared to traditional cultivation in soil [10,11]. Our previous studies also showed that the growth and quality of kiwifruit seedlings cultivated in soilless substrate were higher than those cultivated in soil. An appropriate water supply is essential for the growth and quality of seedlings in a soilless cultivation system. Efficient irrigation practice improves the water use efficiency of plants and reduces leaching and runoff of water and nutrients, thereby decreasing cultivation costs [12]. In addition, an appropriate water content in soilless culture systems could effectively reduce the occurrence and development of root diseases [13]. However, knowledge on the optimal range of substrate moisture content (SMC) for soilless cultivation is limited, and the range varies with different soilless culture substrates and species.
Water availability around the root system directly affects the physiological responses of above-ground parts. Estimating crop water requirements by measuring the physiological responses of plants has been proposed as an effective way to minimize or prevent over-irrigation and leaching [14,15,16]. Photosynthesis is closely related to stomatal conductance, and both are extremely sensitive to water restriction [14,17,18,19]. Irrigation schedules based on the relationship between photosynthesis and SMC in container nurseries have received considerable attention [12,15,20,21,22,23]. For example, when the irrigation requirements of landscape roses were determined according to growth and photosynthetic responses to SMC, the shoot and root dry matter, net photosynthetic rate (Pn), stomatal conductance (gs), and transpiration rate (Tr) were highest at 30% to 40% SMC [12]. Similar results were found in cultivating Crepidiastrum denticulatum at 20% to 60% SMC, which showed that the photosynthetic and antioxidant capacity first increased and then decreased, and the plants grew best and the antioxidant capacity was highest at 45% SMC [20]. In addition, water stress disrupts the balance of the cellular redox state, resulting in the accumulation of reactive oxygen species (ROS), which can cause severe damage by oxidizing membrane lipids and the photosynthetic apparatus [24,25]. Chlorophyll (Chl) fluorescence indicating the photochemical efficiency of photosystem II (PSII) has been widely applied to assess water stress-induced damage to the photosynthetic apparatus, including water deficit and waterlogging [26,27].
In view of the scarce information about the response of kiwifruit seedlings to water stress and the need for sustainability in nursery production, the objective of this experiment was (i) to evaluate the growth and physiological responses of kiwifruit seedlings to different levels of SMC, and (ii) to define the optimum SMC for soilless cultivation of kiwifruit seedlings based on comprehensive analyses of root and shoot growth, antioxidant defense, photosynthesis, and chlorophyll fluorescence parameters. The results could provide a practical reference for high-quality kiwifruit seedling production in soilless cultivation system.
2. Materials and Methods
2.1. Plant Materials and Culture Conditions
Six-month-old tissue-cultured kiwifruit seedlings (A. valvata Dunn) were used, and the experiment was carried out in a greenhouse at the Zunjiu Kiwi orchard of Sichuan Huasheng Agriculture Co., Ltd. in Mianzhu, Sichuan, China (104°7′ E, 31°23′ N). The mean temperature was 29.18 °C, the relative humidity was 66.28%, and the light source was natural sunlight. Cylindrical plastic containers with a diameter of 30 cm and a height of 30 cm were filled with a mixture of coconut coir (Global Substrates, Inc., Sri Lanka, India), peat (Jiffy, Inc., Pärnu, Estonia), and perlite (Yunnan Hongchou Agricultural Technology Co., Ltd., Kunming, China) in a 1:2:2 volume ratio. The physicochemical properties of the mixture were as follows: pH 5.42, electrical conductivity (EC) 0.72 ms·cm−1, bulk density 0.15 g∙cm−3, total porosity 69.95%, aeration porosity 19.97%, water-holding porosity 49.99%, and void ratio 0.40. The mixture was composed of 0.51% total N, 47.12% organic matter, 1049.54 mg·kg−1 alkali-hydrolyzed nitrogen, 239.61 mg·kg−1 available phosphorus, and 2194.16 mg·kg−1 available potassium.
2.2. Substrate Moisture Content, Irrigation, and Plant Growth
The SMC was calculated as [weight of the water-saturated substrate − dry weight of substrate]/dry weight of substrate × 100%. Uniform kiwifruit seedlings (13.03 g per plant) were transplanted to the containers with one seedling per container on 20 May 2022. All substrate in the containers was maintained at saturation capacity for one week for root establishment, after which the plants were divided into 20%, 40%, 60%, 80%, 100%, and 120% SMC treatments with five replicate containers per treatment. Substrate moisture was measured based on the difference between the predetermined SMC value and the weight of the container every day at 17:00 [28]. Irrigation was started when the SMC dropped below the SMC of a treatment: the 100% and 120% SMC treatments were initiated on 27 May, 80% SMC on 13 June, 60% SMC on 22 June, 40% SMC on 1 July, and 20% SMC on 29 July. The volume of water and the number of irrigation events needed to maintain the SMC level were recorded. On 28 August, the plants were harvested, and the dry weights of roots and shoots were determined by oven-drying to constant weight at 70 °C.
2.3. Measurement of Chlorophyll Content and Photosynthetic Parameters
To determine the leaf Chl content, 0.2 g of fresh tissue was extracted in 95% (v/v) ethanol for 24 h in the dark. The absorbance values of the solution were measured at 649 and 665 nm using an ultraviolet spectrophotometer (Shimadzu UV-1800, Japan) [29]. Photosynthetic parameters in leaves were measured using a LI-6800 portable photosynthetic analyzer (Li-Cor, Inc., Lincoln, NE, USA). Measurements were taken on sunny days between 9:00 and 12:00. Five consecutive leaves in the middle of the stem (the 25th leaf from the root) were selected from each container for measurements of Pn, gs, Tr, and intercellular CO2 concentration (Ci). A fully expanded leaf was placed in the leaf chamber (25 °C, 400 μL L−1 CO2, and 1000 μmol photon m−2 photosynthetic photon flux). The instantaneous carboxylation efficiency (ICE) and water use efficiency (WUE) were calculated using the following respective formulas: ICE = Pn/Ci and WUE = Pn/Tr. The same fully expanded leaves were subjected to darkness for 20 min at 12:00, and the dark-adapted leaves were used to determine the Chl fluorescence parameters, including maximal quantum yield of PSII photochemistry (Fv/Fm), variable fluorescence out of minimal fluorescence yield under dark-adapted state (Fv/F0), photochemical quenching (qp), non-photochemical quenching (NPQ), actual quantum yield (Y(II)), and photosynthetic electron transfer rate (ETR) using a portable Chl fluorescence meter (MINI-PAM-II, Walz, Germany).
2.4. Measurement of Leaf Relative Water Content and Cell Membrane Stability
For measurement of leaf relative water content (RWC), the fresh weight (FW) of a leaf sample was recorded, the leaves were immersed in deionized water for 24 h, and the saturated weight (SW) was measured. Dry weight (DW) was subsequently determined after over-drying at 70 °C for 48 h to constant weight. RWC was calculated using the equation of Barrs and Weatherley [30]: RWC (%) = (FW − DW)/(SW − DW) × 100. For determination of electrolyte leakage (EL), 0.2 g of fresh leaves was rinsed with distilled water and then immersed in deionized water for 24 h, and the initial conductivity (Ci) was measured using a conductivity meter (YSI Model 32, Yellow Springs, OH, USA). Leaf samples were boiled at 100 °C for 30 min, and the terminal conductance was measured as maximum conductivity (Cm) after being cooled to room temperature. EL was calculated as the percentage of Ci to Cm [31].
2.5. Measurement of Antioxidant Enzyme Activity and Lipid Peroxidation
To analyze the malondialdehyde (MDA) content and antioxidant enzyme activities, including superoxide dismutase (SOD), peroxidase (POD), and catalase (CAT), 0.2 g of fresh leaf samples was ground in 4 mL of phosphoric acid buffer (50 mM, pH 7.6), and the supernatant was collected after centrifugation at 4 °C for 30 min at 12,000 × g. MDA content was measured by incubating 0.5 mL of supernatant with 1 mL of 20% (w/v) trichloroacetic acid (TCA) containing 0.5% (w/v) thiobarbituric acid (TBA) at 95 °C for 15 min, centrifuging at 8000× g for 10 min, and measuring the absorbance values of the supernatant at 532 and 600 nm using a spectrophotometer (Shimadzu UV-1800, Japan) [32]. SOD activity was measured by adding 50 μL of supernatant to a 1.5 mL reaction solution containing 195 mM methionine, 3 μM EDTA, 1.125 mM NBT, 60 μM riboflavin, and 50 mM PBS buffer (pH 7.8), and measuring the absorbance value at 560 nm [33]. POD and CAT activities were determined using the method of Chance and Maehly [34], and the absorbance values of the reaction solution were measured at 470 and 240 nm, respectively.
2.6. Date Analysis and Statistics
A completely randomized design was implemented for the experiment with five replicates per treatment. Differences were tested using one-way analysis of variance (ANOVA) and Tukey’s multiple comparisons test with SPSS Statistics 26 (IBM, Armonk, NY, USA). Differences between treatments were considered statistically significant at p < 0.05.
3. Results
3.1. Total Irrigation Volume and Irrigation Frequency
The irrigation frequency increased with increasing SMC up to 100% SMC, and the total irrigation volume increased up to 120% SMC (Figure 1). The irrigation volume increased linearly from 20% to 100% SMC (R2 = 0.983; p = 0.001; range 4.94 to 62.91 L), whereas at 120% SMC, the irrigation volume was 2.33 times higher than that at 100% SMC. During the experimental period, the irrigation frequency or total amount of water applied for each treatment was 31, 59, 68, 77, 94, and 94 times or 4.94, 25.18, 38.19, 49.31, 62.91, and 146.86 L per container at 20%, 40%, 60%, 80%, 100%, and 120% SMC, respectively.
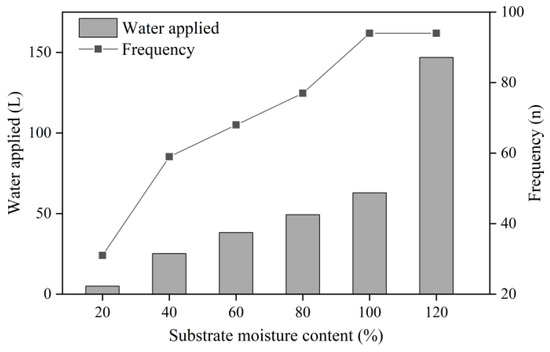
Figure 1.
Total amount of water applied and irrigation frequency of kiwifruit seedlings at substrate moisture contents (SMCs) from 20% to 120% SMC.
3.2. Plant Growth Parameters
Shoot and root dry weights increased gradually with the increase in SMC from 20% to 100% and were lower at 120% SMC than at 100% SMC (p < 0.05) (Figure 2A,B). Compared to that at 100% SMC, shoot dry weight was reduced by 91.04%, 59.95%, 21.00%, 11.66%, and 45.44%, and root dry weight was reduced by 91.68%, 56.68%, 44.40%, 24.82%, and 12.15% at 20%, 40%, 60%, 80%, and 120% SMC, respectively. The root systems were clearly different at different SMCs (Figure 2C).
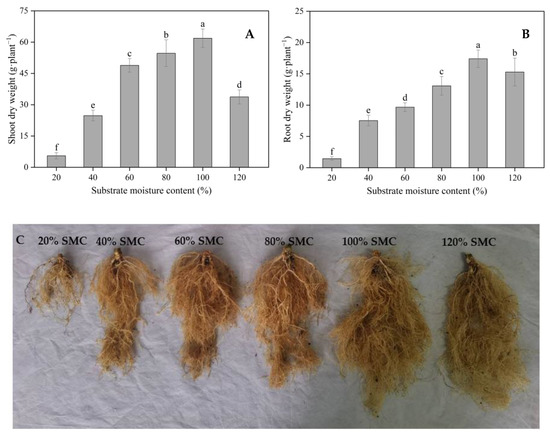
Figure 2.
The impact of different SMCs on the shoot dry weight, root dry weight, and root morphology. Shoot and root dry weight (A,B) and morphology of the roots (C) of kiwifruit seedlings at SMCs from 20% to 120% SMC. Data are mean ± standard error (n = 5). Different letters above columns indicate statistically significant differences in the Tukey’s multiple comparisons test (p < 0.05).
3.3. Cell Membrane Stability and Antioxidant Enzyme Activities
EL and MDA content were the lowest at 80% and 100% SMC. A 19.69%, 49.21%, 70.08%, 71.09%, or 57.52% decline in EL and 23.08%, 56.52%, 84.07%, 82.58%, or 50.82% decrease in MDA content were observed at 40%, 60%, 80%, 100%, and 120% SMC compared to that at 20% SMC, respectively (Figure 3). SOD, POD, and CAT activities were maintained at the highest levels at 80% and 100% SMC and declined with a gradual decrease in SMC (p < 0.05). The 120% SMC treatment also resulted in significant decreases in SOD, POD, and CAT activities compared to those at 80% and 100% SMC (p < 0.05) (Figure 4). The SOD activity at 100% SMC was 23.24%, 14.17%, 9.53%, 2.27%, and 15.63% higher than that at 20%, 40%, 60%, 80%, and 120% SMC, respectively. Changes in POD and CAT activities were similar to those in SOD activity at different SMCs.
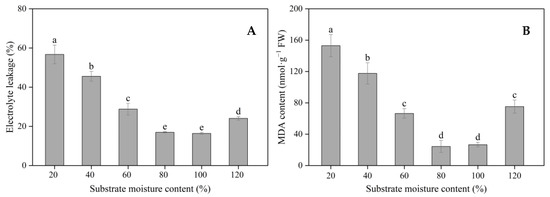
Figure 3.
The impact of different SMCs on leaf EL and MDA content. EL (A) and MDA content (B) in kiwifruit seedlings at SMCs from 20% to 120% SMC. Data are mean ± standard error (n = 5). Different letters above columns indicate statistically significant differences in the Tukey’s multiple comparisons test (p < 0.05).
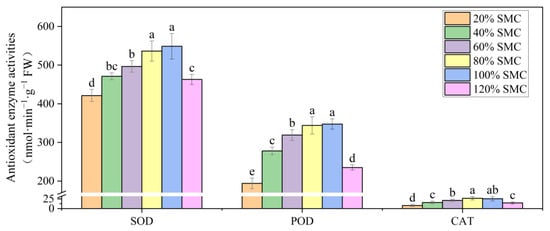
Figure 4.
The impact of different SMCs on leaf SOD, POD, and CAT activities in kiwifruit seedlings at SMCs from 20% to 120% SMC. Data are mean ± standard error (n = 5). Different letters above columns indicate statistically significant differences in the Tukey’s multiple comparisons test (p < 0.05).
3.4. Leaf Water Status and Chlorophyll Content
Leaf RWC increased with the increase in SMC from 20% to 80% and was the highest at 80%, 100%, and 120% SMC (p < 0.05) (Figure 5). Total Chl, Chl a, and Chl b contents increased with the increase in SMC from 20% to 80% and were lower at 120% SMC than at 80% and 100% SMC (p < 0.05) (Figure 6). Chl (a + b) content was 20.31%, 86.16%, 119.96%, 128.55%, and 65.06% higher, Chl a content was 20.21%, 120.97%, 156.89%, 156.98%, and 97.32% higher, and Chl b content was 9.10%, 48.19%, 74.01%, 80.55%, and 29.88% higher at 40%, 60%, 80%, 100%, and 120% SMC than at 20% SMC, respectively.
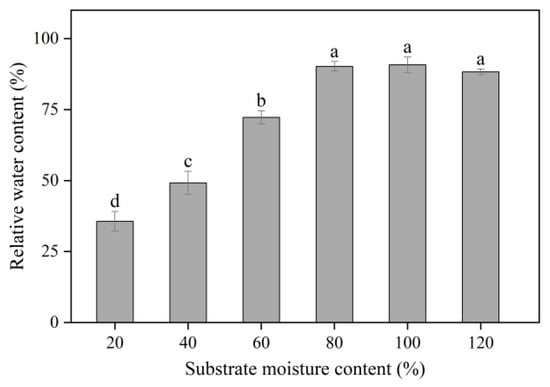
Figure 5.
The impact of different SMCs on leaf RWC in kiwifruit seedlings at SMCs from 20% to 120% SMC. Data are mean ± standard error (n = 5). Different letters above columns indicate statistically significant differences in the Tukey’s multiple comparisons test (p < 0.05).
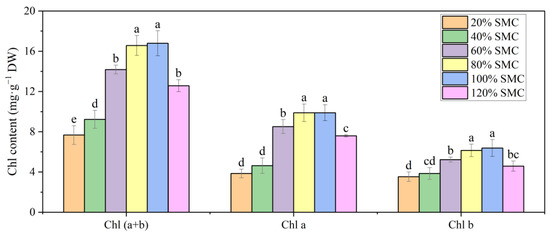
Figure 6.
The impact of different SMCs on leaf (Chl (a + b), Chl a, and Chl b contents in kiwifruit seedlings at SMCs from 20% to 120% SMC. Data are mean ± standard error (n = 5). Different letters above columns indicate statistically significant differences in the Tukey’s multiple comparisons test (p < 0.05).
3.5. Photosynthetic Parameters
The photosynthetic parameters of the seedling leaves were significantly affected by different SMC treatments. Pn increased with the increase in SMC from 20% to 80% and was lower at 120% SMC than at 80% and 100% SMC (p < 0.05) (Figure 7A). gs and ICE increased with the increase in SMC from 20% to 100% (p < 0.05) (Figure 7B,E). Ci was the lowest at 80% and 100% SMC (p < 0.05) (Figure 7C). Tr increased with the increase in SMC from 20% to 100% (p < 0.05) and was at the same level at 100% and 120% SMC (Figure 7D). Leaf WUE was the highest at 60% and 80% SMC and the lowest at 20% SMC (p < 0.05); it was reduced by 64.27%, 53.87%, 0.31%, 21.61%, and 55.10% at 20%, 40%, 80%, 100%, and 120% SMC compared to that at 60% SMC, respectively (Figure 7F).
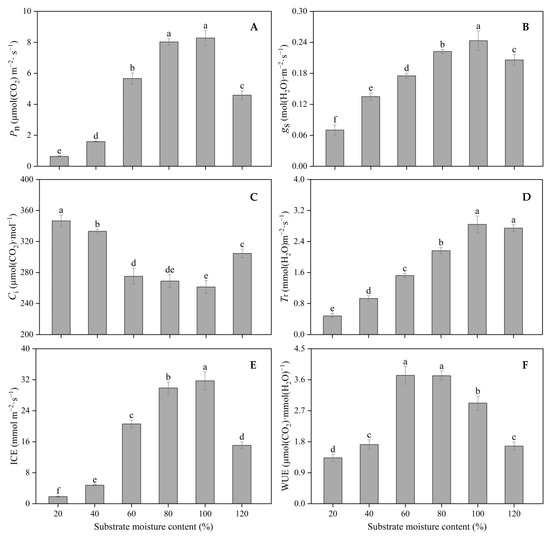
Figure 7.
The impact of different SMCs on leaf photosynthetic parameters: Pn (A), gs (B), Ci (C), Tr (D), ICE (E), and WUE (F) in kiwifruit seedlings at SMCs from 20% to 120% SMC. Data are mean ± standard error (n = 25). Different letters above columns indicate statistically significant differences in the Tukey’s multiple comparisons test (p < 0.05).
Fv/Fm, ETR, and Y(II) were higher at 60% to 100% SMC than at other SMC treatments (p < 0.05). Fv/F0 increased with the increase in SMC from 20% to 80% and was lower at 120% SMC than at 80% and 100% SMC (p < 0.05). qP was higher at 80% SMC than at 20%, 40%, and 120% SMC (p < 0.05). NPQ was the highest at 20% and 40% SMC (p < 0.05) and decreased gradually from 20% to 100% SMC (Table 1).

Table 1.
The impact of different SMCs on leaf chlorophyll fluorescence parameters of kiwifruit seedlings at SMCs from 20% to 120% SMC.
4. Discussion
Optimum SMC can decrease cultivation costs and improve the quality of seedlings in soilless cultivation. Similar to studies on the irrigation of petunias (Petunia × hybrida) in which no irrigation water leached out of containers [35], the total irrigation volume increased linearly with SMC up to 100% SMC. In agreement with the results of Burnett and van Iersel [36], who reported that substantially more water was needed as a result of leaching due to an SMC close to or higher than the water-holding capacity of the substrate, the total irrigation volume was 2.33 times higher at 120% than at 100% SMC. Thus, exceeding the SMC resulted in earlier irrigation implementation with higher frequency and a larger amount of water consumed (Figure 1).
When plants are subjected to water stress, such as water deficit or waterlogging, their physiological and metabolic processes are disrupted leading to growth retardation [37,38]. Drought stress restricts the transport of water and nutrients from roots to leaves [39,40]. Drought-induced dehydration stimulates the biosynthesis of phytohormones such as abscisic acid (ABA) in the root system, which can be transferred to leaf guard cells via xylem transport to regulate stomatal closure, thus resulting in a decrease in transpiration and water loss from leaves [18,41,42]. Excessive water in soils leads to an oxygen-deficient environment around the roots, which suppresses root aerobic respiration and causes an energy shortage [20]. In addition, waterlogging also induces the accumulation of ROS and toxic metabolites such as ethanol and lactic acid, which inhibit plant growth and may even result in death of the root system [18,43]. In our study, the lower shoot and root biomass at up to 60% SMC as well as at 120% SMC indicated that the inhibition of shoot and root growth could be caused by drought or waterlogging stress, suggesting that 80% and 100% SMC were appropriate for soilless cultivation of kiwifruit seedlings (Figure 2A,B). Interestingly, our findings indicated that the waterlogging-induced negative effect on root growth was less than that induced by water deficit (Figure 2C). A previous study by Li et al. [44] also found that A. valvata vines could endure long-term waterlogging stress by sacrificing most of the main root system.
Under normal water conditions, the production and elimination of ROS in plants are in dynamic equilibrium. Water stress disturbs homeostasis by limiting the photosynthetic process, resulting in an increase in ROS production [45,46]. It is well documented that drought and waterlogging stress induce the activation of the antioxidant defense system to avoid oxidative damage in plants. SOD, CAT, and POD are the primary antioxidant enzymes involved in the antioxidant defense system, in which SOD catalyzes the conversion of O−2 into H2O2, and POD and CAT catalyze the reduction of H2O2 to H2O and O2 [47]. In general, plants increase the activities of various antioxidant enzymes to cope with water stress [48,49,50]. In our study, higher MDA content and EL levels at up to 60% SMC and at 120% SMC suggested that both water deficit and waterlogging stress accelerated membrane lipid peroxidation and damaged cell membrane stability (Figure 3), which agreed with previous findings indicating that prolonged drought or waterlogging stress disturbed antioxidant metabolism and ROS homeostasis [51,52,53,54]. Significantly lower phenolic content and antioxidant capacity per shoot in Crepidiastrum denticulatum were observed under drought and flooding stress [20]. In the present study, the reduced SOD, POD, and CAT activities in leaves of A. valvata Dunn when subjected to water deficit or waterlogging indicated that the antioxidant capacity of kiwifruit was weakened by water stress, and the overaccumulation of ROS could not be scavenged (Figure 4).
One of the major strategies employed by plants to respond to water stress is to reduce transpiration by closing stomata, which leads to a reduction in the leaf photosynthetic rate due to reduced gas interchange [21,55,56]. An et al. [23] reported that the net CO2 assimilation rate, gs, and Tr in cymbidium (Cymbidium spp.) increased with the increase in substrate volumetric water content. Our data showed that Pn and gs of A. valvata Dunn leaves decreased at up to 60% and at 120% SMC. However, Ci was not limited by gs but increased markedly in response to water deficit (20% and 40% SMC) and waterlogging (120% SMC) stress (Figure 7), indicating that the decrease in Pn was not related to the reduction in gs. This was consistent with previous studies showing that the negative effect of severe drought or waterlogging stress on photosynthesis was mainly caused by nonstomatal factors [57,58]. Nonstomatal limitations such as stress-induced Chl degradation, damage to the photosynthetic apparatus, and a reduction in photosynthetic enzymatic activity contribute to the decline in photosynthetic CO2 assimilation and Pn [18,59]. ICE has been widely used to estimate the activity of RuBisCO, which is a key enzyme involved in CO2 assimilation [60]. Silva et al. [56] found that water stress significantly decreased ICE of sugarcane (Saccharum spp.). These results further confirmed that the decreases in Chl content and photosynthetic enzyme activity due to long-term drought and waterlogging stress inhibit photosynthesis. In addition, nitrogen deficiency caused by leaching under waterlogging stress could further promote the decrease in photosynthetic capacity [59]. Plants tend to adapt to water deficit stress by increasing WUE [61]. In line with that, WUE of A. valvata Dunn was the highest at 60% and 80% SMC and the lowest at 120% SMC.
The health status of PSII and the photosynthetic electron transport chain can be evaluated by analyzing the induction curve of Chl fluorescence in plants, since Chl fluorescence reflects the intrinsic properties of the photosynthetic system [26,62]. Chl fluorescence kinetics have been widely used in studying water stress physiology [63,64]. Leaf Fv/Fm indicates the maximum photochemical efficiency of PSII, which has been proven to be a good physiological reference for diagnosing the integrity of plant photosynthetic systems under stressful conditions [26,56,65]. Similar to previous studies in which water stress decreased photochemical efficiency [56,66], leaf Fv/Fm and Fv/F0 were lower at 20%, 40%, and 120% SMC than under normal conditions (80% and 100% SMC). In addition, qp provides insight into the proportion of open reaction centers in PSII, and its increase is positively correlated with electron transport activity [26]. Zhang et al. [21] found that qp decreased markedly in response to drought and waterlogging stress, accompanied by reductions in ETR and Y(II). Bañón et al. [22] also reported that ETR of Hebe andersonii decreased with the decrease in substrate volumetric water content, while NPQ was the highest under more severe water-deficit conditions. Higher values of NQP were observed under water stress as a result of energy dissipation [26,67]. Similar results were demonstrated in the current study, indicating that both water deficit and waterlogging stress could be harmful to the photochemical system of A. valvata Dunn seedlings.
5. Conclusions
Kiwifruit seedlings showed significant differences in growth and physiological parameters under different SMCs. The main results were as follows: (i) shoot and root dry weights of seedings increased with the increase in SMC from 20% to 100% but were lower at 120% SMC than at 100% SMC; (ii) seedlings at lower SMC (20%, 40%, and 60% SMC) as well as at 120% SMC exhibited significant lower activities of SOD, POD, and CAT and higher EL and MDA accumulation than seedlings at 80% and 100% SMC; (iii) Higher Pn, gs, ICE, and chlorophyll fluorescence parameters, including Fv/Fm, Fv/F0, ETR, and Y(II), were observed at 80% and 100% SMC. Combined with the growth and physiological changes, the biomass could be used as a main evaluation parameter for selection of the optimal substrate moisture content for the growth of kiwifruit seedlings since most of physiological parameters were not significantly different between 80% and 100% SMC, but seedling achieved the highest biomass at 100% SMC. Therefore, 100% SMC provided the optimal water supply for photosynthetic efficiency and dry matter accumulation of shoots and roots. The results are expected to be useful for the mass production of high-quality kiwifruit seedlings in greenhouse or nursery containers, with the potential to save water.
Author Contributions
Conceptualization, Y.-X.C. and K.-W.X.; investigation, D.-G.C., H.-Y.Y. and R.Y.; data curation, D.-G.C., D.-D.P. and R.Y.; formal analysis, D.-G.C. and D.-D.P.; supervision, Y.-X.C., D.-D.P. and H.-P.L.; project administration, Y.-X.C. and K.-W.X.; funding acquisition, Y.-X.C. and H.-P.L.; writing—original draft, D.-D.P. and D.-G.C.; writing—review and editing, P.P. and K.-W.X. All authors have read and agreed to the published version of the manuscript.
Funding
This research was funded by the Sichuan Key Research and Development Project (2021YFN0026) and Sichuan Science and Technology Project (2022ZHXC0007, 2023NSFSC0138).
Data Availability Statement
Data sharing is not applicable.
Conflicts of Interest
The authors declare no conflict of interest.
Abbreviations
SMC, substrate moisture content; Pn, net photosynthetic rate; gs, stomatal conductance; Tr, transpiration rate; Ci, intercellular CO2 concentration; PSII, photosystem II; Chl, chlorophyll; WUE, water use efficiency; ICE, instantaneous carboxylation efficiency; Fv/Fm, maximal quantum yield of PSII photochemistry; Fv/F0, variable fluorescence out of minimal fluorescence yield under dark-adapted state; qp, photochemical quenching; NPQ, non-photochemical quenching; Y(II), actual quantum yield; ETR; photosynthetic electron transfer rate; RWC, relative water content; EL, electrolyte leakage; MDA, malondialdehyde; SOD, superoxide dismutase; POD, peroxidase; CAT, catalase; ROS, reactive oxygen species.
References
- Richardson, D.P.; Ansell, J.; Drummond, L.N. The nutritional and health attributes of kiwifruit: A review. Eur. J. Nutr. 2018, 57, 2659–2676. [Google Scholar] [CrossRef] [PubMed]
- Satpal, D.; Kaur, J.; Bhadariya, V.; Sharma, K. Actinidia deliciosa (Kiwi fruit): A comprehensive review on the nutritional composition, health benefits, traditional utilization, and commercialization. J. Food Process Preserv. 2021, 45, e15588. [Google Scholar] [CrossRef]
- Gao, Y.B.; Jiang, Z.Y.; Shi, M.Q.; Zhou, Y.F.; Huo, L.Q.; Li, X.L.; Xu, K. Comparative transcriptome provides insight into responding mechanism of waterlogging stress in Actinidia valvata Dunn. Gene 2022, 845, 146843. [Google Scholar] [CrossRef] [PubMed]
- Abid, M.; Gu, S.C.; Zhang, Y.J.; Sun, S.H.; Li, Z.; Bai, D.F.; Sun, L.M.; Qi, X.J.; Zhong, Y.P.; Fang, J.B. Comparative transcriptome and metabolome analysis reveal key regulatory defense networks and genes involved in enhanced salt tolerance of Actinidia (kiwifruit). Hortic. Res. 2022, 9, uhac189. [Google Scholar] [CrossRef]
- Barrett, G.E.; Alexander, P.D.; Robinson, J.S.; Bragg, N.C. Achieving environmentally sustainable growing media for soilless plant cultivation systems–A review. Sci. Hortic. 2016, 212, 220–234. [Google Scholar] [CrossRef]
- Valenzano, V.; Parente, A.; Serio, F.; Santamaria, P. Effect of growing system and cultivar on yield and water-use efficiency of greenhouse-grown tomato. J. Hortic. Sci. Biotech. 2008, 83, 71–75. [Google Scholar] [CrossRef]
- Heller, C.R.; Nunez, G.H. Preplant fertilization increases substrate microbial respiration but does not affect southern highbush blueberry establishment in a coconut coir-based substrate. HortScience 2022, 57, 17–21. [Google Scholar] [CrossRef]
- Ortiz-Delvasto, N.; Garcia-Ibañez, P.; Olmos-Ruiz, R.; Bárzana, G.; Carvajal, M. Substrate composition affects growth and physiological parameters of blueberry. Sci. Hortic. 2023, 308, 111528. [Google Scholar] [CrossRef]
- Yang, H.Y.; Wu, Y.Q.; Duan, Y.K.; Zhang, C.H.; Huang, Z.J.; Wu, W.L.; Lyu, L.F.; Li, W.L. Metabolomics combined with physiological and transcriptomic analyses reveal regulatory features associated with blueberry growth in different soilless substrates. Sci. Hortic. 2022, 302, 111145. [Google Scholar] [CrossRef]
- Kilinc, S.S.; Ertan, E.; Seferoglu, S. Effects of different nutrient solution formulations on morphological and biochemical characteristics of nursery fig trees grown in substrate culture. Sci. Hortic. 2007, 113, 20–27. [Google Scholar] [CrossRef]
- Şirin, U.; Ertan, E.; Ertan, B. Growth substrates and fig nursery tree production. Sci. Agric. 2010, 67, 633–638. [Google Scholar] [CrossRef]
- Cai, X.Y.; Starman, T.; Niu, G.H.; Hall, C. The effect of substrate moisture content on growth and physiological responses of two landscape roses (Rosa hybrida L.). HortScience 2014, 49, 741–745. [Google Scholar] [CrossRef]
- Xia, P.G.; Guo, H.B.; Zhao, H.G.; Jiao, J.; Deyholos, M.K.; Yan, X.J.; Liu, Y.; Liang, Z.S. Optimal fertilizer application for Panax notoginseng and effect of soil water on root rot disease and saponin contents. J. Ginseng Res. 2016, 40, 38–46. [Google Scholar] [CrossRef]
- Fulcher, A.F.; Buxton, J.W.; Geneve, R.L. Developing a physiological-based, on-demand irrigation system for container production. Sci. Hortic. 2012, 138, 221–226. [Google Scholar] [CrossRef]
- Jahromi, N.B.; Fulcher, A.; Walker, F.; Altland, J. Photosynthesis, growth, and water use of Hydrangea paniculata ‘Silver Dollar’ using a physiological-based or a substrate physical properties-based irrigation schedule and a biochar substrate amendment. Irrig. Sci. 2020, 38, 263–274. [Google Scholar] [CrossRef]
- Cifre, J.; Bota, J.; Escalona, J.M.; Medrano, H.; Flexas, J. Physiological tools for irrigation scheduling in grapevine (Vitis vinifera L.): An open gate to improve water-use efficiency? Agric. Ecosyst. Environ. 2005, 106, 159–170. [Google Scholar] [CrossRef]
- Nadal, M.; Flexas, J. Variation in photosynthetic characteristics with growth form in a water-limited scenario: Implications for assimilation rates and water use efficiency in crops. Agric. Water Manag. 2019, 216, 457–472. [Google Scholar] [CrossRef]
- Wu, J.J.; Wang, J.Y.; Hui, W.K.; Zhao, F.Y.; Wang, P.Y.; Su, C.Y.; Gong, W. Physiology of plant responses to water stress and related genes: A Review. Forests 2022, 13, 324. [Google Scholar] [CrossRef]
- Zou, J.N.; Jin, X.J.; Zhang, Y.X.; Ren, C.Y.; Zhang, M.C.; Wang, M.X. Effects of melatonin on photosynthesis and soybean seed growth during grain filling under drought stress. Photosynthetica 2019, 57, 512–520. [Google Scholar] [CrossRef]
- Park, S.Y.; Kim, J.; Oh, M.M. Determination of adequate substrate water content for mass production of a high value-added medicinal plant, Crepidiastrum denticulatum (Houtt.) Pak & Kawano. Agronomy 2020, 10, 388. [Google Scholar] [CrossRef]
- Zhang, F.; Zhu, K.; Wang, Y.Q.; Zhang, Z.P.; Lu, F.; Yu, H.Q.; Zou, J.Q. Changes in photosynthetic and chlorophyll fluorescence characteristics of sorghum under drought and waterlogging stress. Photosynthetica 2019, 57, 1156–1164. [Google Scholar] [CrossRef]
- Bañón, D.; Lorente, B.; Bañón, S.; Ortuño, M.F.; Sánchez-Blanco, M.J.; Alarcón, J.J. Control of substrate water availability using soil sensors and effects of water deficit on the morphology and physiology of Potted Hebe andersonii. Agronomy 2022, 12, 206. [Google Scholar] [CrossRef]
- An, S.K.; Lee, H.B.; Kim, J.; Kim, K.S. Efficient water management for Cymbidium grown in coir dust using a soil moisture sensor-based automated irrigation system. Agronomy 2021, 11, 41. [Google Scholar] [CrossRef]
- Ozkur, O.; Ozdemir, F.; Bor, M.; Turkan, I. Physiochemical and antioxidant responses of the perennial xerophyte Capparis ovata Desf. to drought. Environ. Exp. Bot. 2009, 66, 487–492. [Google Scholar] [CrossRef]
- Jia, L.T.; Qin, X.; Lyu, D.G.; Qin, S.J.; Zhang, P. ROS production and scavenging in three cherry rootstocks under short-term waterlogging conditions. Sci. Hortic. 2019, 257, 108647. [Google Scholar] [CrossRef]
- Maxwell, K.; Johnson, G.N. Chlorophyll fluorescence—a practical guide. J. Exp. Bot. 2000, 51, 659–668. [Google Scholar] [CrossRef]
- Shin, Y.K.; Bhandari, S.R.; Jo, J.S.; Song, J.W.; Lee, J.G. Effect of drought stress on chlorophyll fluorescence parameters, phytochemical contents, and antioxidant activities in lettuce seedlings. Horticulturae 2021, 7, 238. [Google Scholar] [CrossRef]
- Qiu, S.F.; Yang, L.Q.; Zhao, H.; Huang, D.F.; Tang, D.Q. Effects of water holding capacity in substrate on growth characters and comprehensive quality of Brassica campestris L. ssp. Chinensis cv. Ziyoucai. Acta Agric. Zhejiangensis 2016, 28, 195–199. [Google Scholar]
- González-Vega, R.I.; Cárdenas-López, J.L.; López-Elías, J.A.; Ruiz-Cruz, S.; Reyes-Díaz, A.; Perez-Perez, L.M.; Cinco-Moroyoqui, F.J.; Robles-Zepeda, R.E.; Borboa-Flores, J.; Del-Toro-Sánchez, C.L. Optimization of growing conditions for pigments production from microalga Navicula incerta using response surface methodology and its antioxidant capacity. Saudi J. Biol. Sci. 2021, 28, 1401–1416. [Google Scholar] [CrossRef]
- Barrs, H.D.; Weatherley, P.E. A re-examination of the relative turgidity technique for estimating water deficits in leaves. Aust. J. Biol. Sci. 1962, 15, 413–428. [Google Scholar] [CrossRef]
- Blum, A.; Ebercon, A. Cell membrane stability as a measure of drought and heat tolerance in wheat. Crop Sci. 1981, 21, 43–47. [Google Scholar] [CrossRef]
- Dhindsa, R.S.; Plumb-Dhindsa, P.; Thorpe, T.A. Leaf senescence: Correlated with increased levels of membrane permeability and lipid peroxidation, and decreased levels of superoxide dismutase and catalase. J. Exp. Bot. 1981, 32, 93–101. [Google Scholar] [CrossRef]
- Giannopolitis, C.N.; Ries, S.K. Superoxide dismutases: I. Occurrence in higher plants. Plant Physiol. 1977, 59, 309–314. [Google Scholar] [CrossRef]
- Chance, B.; Maehly, A.C. Assay of catalases and peroxidases. Methods Enzymol. 1955, 2, 764–775. [Google Scholar]
- Van Iersel, M.W.; Dove, S.; Kang, J.G.; Burnett, S.E. Growth and water use of petunia as affected by substrate water content and daily light integral. Hortscience 2010, 45, 277–282. [Google Scholar] [CrossRef]
- Burnett, S.E.; van Iersel, M.W. Morphology and irrigation efficiency of Gaura lindheimeri grown with capacitance sensor-controlled irrigation. Hortscience 2008, 43, 1555–1560. [Google Scholar] [CrossRef]
- Bohnert, H.J.; Jensen, N.R.G. Adaptations to Environmental Stresses. Plant Cell 1995, 7, 1099–1111. [Google Scholar] [CrossRef]
- Khaleghi, A.; Naderi, R.; Brunetti, C.; Maserti, B.E.; Salami, S.A.; Babalar, M. Morphological, physiochemical and antioxidant responses of Maclura pomifera to drought stress. Sci. Rep. 2019, 9, 19250. [Google Scholar] [CrossRef]
- Jiao, P.P.; Wu, Z.H.; Wang, X.; Jiang, Z.B.; Wang, Y.Q.; Liu, H.; Qin, R.; Li, Z.J. Short-term transcriptomic responses of Populus euphratica roots and leaves to drought stress. J. For. Res. 2021, 32, 841–853. [Google Scholar] [CrossRef]
- Zhao, Q.Z.; Guo, J.; Shu, M.; Wang, P.; Hu, S.J. Impacts of drought and nitrogen enrichment on leaf nutrient resorption and root nutrient allocation in four Tibetan plant species. Sci. Total Environ. 2020, 723, 138106. [Google Scholar] [CrossRef]
- Goodger, J.Q.D.; Sharp, R.E.; Marsh, E.L.; Schachtman, D.P. Relationships between xylem sap constituents and leaf conductance of well-watered and water-stressed maize across three xylem sap sampling techniques. J. Exp. Bot. 2005, 56, 2389–2400. [Google Scholar] [CrossRef] [PubMed]
- Schachtman, D.P.; Goodger, J.Q.D. Chemical root to shoot signaling under drought. Trends Plant Sci. 2008, 13, 281–287. [Google Scholar] [CrossRef] [PubMed]
- Kreuzwieser, J.; Rennenberg, H. Molecular and physiological responses of trees to waterlogging stress. Plant Cell Environ. 2014, 37, 2245–2259. [Google Scholar] [CrossRef] [PubMed]
- Li, Z.; Zhong, Y.P.; Bai, D.F.; Lin, M.M.; Qi, X.J.; Fang, J.B. Comparative analysis of physiological traits of three Actinidia valvata Dunn genotypes during waterlogging and post-waterlogging recovery. Hortic. Environ. Biotechnol. 2020, 61, 825–836. [Google Scholar] [CrossRef]
- Arbona, V.; Manzi, M.; de Ollas, C.; Gómez-Cadenas, A. Metabolomics as a tool to investigate abiotic stress tolerance in plants. Int. J. Mol. Sci. 2013, 14, 4885–4911. [Google Scholar] [CrossRef]
- Bettaieb, I.; Hamrouni-Sellami, I.; Bourgou, S.; Limam, F.; Marzouk, B. Drought effects on polyphenol composition and antioxidant activities in aerial parts of Salvia officinalis L. Acta Physiol. Plant. 2011, 33, 1103–1111. [Google Scholar] [CrossRef]
- Bowler, C.; Montagu, M.V.; Inzé, D. Superoxide dismutase and stress tolerance. Annu. Rev. Plant Physiol. Plant Mol. Biol. 1992, 43, 83–116. [Google Scholar] [CrossRef]
- Jiang, M.Y.; Zhang, J.H. Water stress-induced abscisic acid accumulation triggers the increased generation of reactive oxygen species and up-regulates the activities of antioxidant enzymes in maize leaves. J. Exp. Bot. 2002, 53, 2401–2410. [Google Scholar] [CrossRef]
- Li, Z.; Shi, P.; Peng, Y. Improved drought tolerance through drought preconditioning associated with changes in antioxidant enzyme activities, gene expression and osmoregulatory solutes accumulation in White clover (Trifolium repens L.). Plant Omics. 2013, 6, 481–489. [Google Scholar]
- Zheng, J.W.; Fang, C.Y.; Ru, L.; Sun, N.; Liu, Y.Y.; Huang, Y.P.; Wang, Y.H.; Zhu, Z.J.; He, Y. Role of glutathione-ascorbate cycle and photosynthetic electronic transfer in alternative oxidase-manipulated waterlogging tolerance in watermelon seedlings. Horticulturae 2021, 7, 130. [Google Scholar] [CrossRef]
- DaCosta, M.; Huang, B.R. Changes in antioxidant enzyme activities and lipid peroxidation for bentgrass species in response to drought stress. J. Am. Soc. Hortic. Sci. 2007, 132(30, 319–326. [Google Scholar] [CrossRef]
- Irfan, M.; Hayat, S.; Hayat, Q.; Afroz, S.; Ahmad, A. Physiological and biochemical changes in plants under waterlogging. Protoplasma 2010, 241, 3–17. [Google Scholar] [CrossRef]
- Puyang, X.H.; An, M.Y.; Xu, L.X.; Han, L.B.; Zhang, X.Z. Antioxidant responses to waterlogging stress and subsequent recovery in two Kentucky bluegrass (Poa pratensis L.) cultivars. Acta Physiol. Plant. 2015, 37, 197. [Google Scholar] [CrossRef]
- Vaseva, I.; Akiscan, Y.; Simova-Stoilova, L.; Kostadinova, A.; Nenkova, R.; Anders, I.; Feller, U.; Demirevska, K. Antioxidant response to drought in red and white clover. Acta Physiol. Plant. 2012, 34, 1689–1699. [Google Scholar] [CrossRef]
- Rood, S.B.; Nielsen, J.L.; Shenton, L.; Gill, K.M.; Letts, M.G. Effects of flooding on leaf development, transpiration, and photosynthesis in narrowleaf cottonwood, a willow-like poplar. Photosynth. Res. 2010, 104, 31–39. [Google Scholar] [CrossRef] [PubMed]
- Silva, M.d.A.; Jifon, J.L.; dos Santos, C.M.; Jadoski, C.J.; da Silva, J.A.G. Photosynthetic capacity and water use efficiency in sugarcane genotypes subject to water deficit during early growth phase. Braz. Arch. Biol. Technol. 2013, 56, 735–748. [Google Scholar] [CrossRef]
- Liu, B.B.; Li, M.; Li, Q.M.; Cui, Q.Q.; Zhang, W.D.; Ai, X.Z.; Bi, H.G. Combined effects of elevated CO2 concentration and drought stress on photosynthetic performance and leaf structure of cucumber (Cucumis sativus L.) seedlings. Photosynthetica 2018, 56, 942–952. [Google Scholar] [CrossRef]
- Tian, L.X.; Li, J.; Bi, W.S.; Zuo, S.Y.; Li, L.J.; Li, W.L.; Sun, L. Effects of waterlogging stress at different growth stages on the photosynthetic characteristics and grain yield of spring maize (Zea mays L.) Under field conditions. Agric. Water Manag. 2019, 218, 250–258. [Google Scholar] [CrossRef]
- Herzog, M.; Striker, G.G.; Colmer, T.D.; Pedersen, O. Mechanisms of waterlogging tolerance in wheat—A review of root and shoot physiology. Plant Cell Environ. 2016, 39, 1068–1086. [Google Scholar] [CrossRef]
- Niinemets, Ü.; Díaz-Espejo, A.; Flexas, J.; Galmés, J.; Warren, C.R. Importance of mesophyll diffusion conductance in estimation of plant photosynthesis in the field. J. Exp. Bot. 2009, 60, 2271–2282. [Google Scholar] [CrossRef]
- Xia, J.B.; Zhao, Z.G.; Sun, J.K.; Liu, J.T.; Zhao, Y.Y. Response of stem sap flow and leaf photosynthesis in Tamarix chinensis to soil moisture in the Yellow River Delta, China. Photosynthetica 2017, 55, 368–377. [Google Scholar] [CrossRef]
- Kalaji, H.M.; Jajoo, A.; Oukarroum, A.; Brestic, M.; Zivcak, M.; Samborska, I.A.; Cetner, M.D.; Łukasik, I.; Goltsev, V.; Ladle, R.J. Chlorophyll a fluorescence as a tool to monitor physiological status of plants under abiotic stress conditions. Acta Physiol. Plant 2016, 38, 102. [Google Scholar] [CrossRef]
- Jedmowski, C.; Ashoub, A.; Brüeggemann, W. Reactions of Egyptian landraces of Hordeum vulgare and Sorghum bicolor to drought stress, evaluated by the OJIP fluorescence transient analysis. Acta Physiol. Plant 2013, 35, 345–354. [Google Scholar] [CrossRef]
- Oukarroum, A.; Madidi, S.E.; Schansker, G.; Strasser, R.J. Probing the responses of barley cultivars (Hordeum vulgare L.) by chlorophyll a fluorescence OLKJIP under drought stress and re-watering. Environ. Exp. Bot. 2007, 60, 438–446. [Google Scholar] [CrossRef]
- Silva, M.d.A.; Jifon, J.L.; Sharma, V.; da Silva, J.A.G.; Caputo, M.M.; Damaj, M.B.; Guimarães, E.R.; Ferro, M.I.T. Use of physiological parameters in screening drought tolerance in sugarcane genotypes. Sugar Tech 2011, 13, 191–197. [Google Scholar] [CrossRef]
- Murata, N.; Takahashi, S.; Nishiyama, Y.; Allakhverdiev, S.I. Photoinhibition of photosystem II under environmental stress. Biochim. Biophys. Acta Bioenerg. 2007, 1767, 414–421. [Google Scholar] [CrossRef]
- Cai, Y.F.; Zhang, S.B.; Hu, H.; Li, S.Y. Photosynthetic performance and acclimation of Incarvillea delavayi to water stress. Biol. Plant. 2010, 54, 89–96. [Google Scholar] [CrossRef]


Disclaimer/Publisher’s Note: The statements, opinions and data contained in all publications are solely those of the individual author(s) and contributor(s) and not of MDPI and/or the editor(s). MDPI and/or the editor(s) disclaim responsibility for any injury to people or property resulting from any ideas, methods, instructions or products referred to in the content. |
© 2023 by the authors. Licensee MDPI, Basel, Switzerland. This article is an open access article distributed under the terms and conditions of the Creative Commons Attribution (CC BY) license (https://creativecommons.org/licenses/by/4.0/).