Article

Impact of Soil-Applied Humic Ameliorative Amendment on the Ligno-Cellulose Quality and Calorific Value of Switchgrass Panicum virgatum L.

NPPC, National Agricultural and Food Centre—Research Institute of Agroecology, Špitálska 1273, 071 01 Michalovce, Slovakia
*
Author to whom correspondence should be addressed.
Agronomy 2023, 13(7), 1854; https://doi.org/10.3390/agronomy13071854
Submission received: 19 June 2023 / Revised: 3 July 2023 / Accepted: 10 July 2023 / Published: 13 July 2023

Abstract

:
The main objective of the paper was to determine the ligno-cellulose quality and calorific value of switchgrass Panicum virgatum L. The impact of nutrition treatments (pre-sowing soil humic amendment HA and/or NPK, with annual dose of N on both the treatments, and untreated control UC) and years were evaluated as main effects within a pilot experiment with seven cultivars tested during 2018–2022. Two data sets of acid detergent fiber (ADF), acid detergent lignin (ADL), crude cellulose (CE), hemicellulose (HEM), neutral detergent fiber (NDF), and high heating value (HHV) were evaluated, the primary one in terms of quality content and the secondary one in terms of quality yield. The average ADF content of the switchgrass was 43.94% (range 30.15–50.91), while the average contents of ADL, CE, HEM, NDF, and HHV were 9.21% (6.02–12.41), 34.73% (17.98–40.08), 30.49% (21.34–38.41), 74.43% (59.20–81.15%), and 17.206 kJ g−1 (16.579–17.799), respectively. An adequate value of ADF yield was 4.17 Mg ha−1 (0.01–29.31), while for ADL, CE, HEM, NDF and HHV this was 0.79 Mg ha−1 (0.00–5.39), 3.37 Mg ha−1 (0.01–23.92), 2.79 Mg ha−1 (0.01–17.66), 6.96 Mg ha−1 (0.01–46.93), and 1.466 hGJ ha−1 (0.003–10.603), respectively. In terms of the both quality sets the cultivar was confirmed to be the most important factor followed by the year, with nutrition having the least impact. This impact order of the main effects was valid for each of the parameters. Moreover, in terms of quality yield the formation of homogeneity groups corresponded with dry matter yield and therefore with the order of cultivars (EG 1101 ˃ BO Master ˃ EG 1102 ˃ Kanlow ˃ Alamo ˃ Carthage ˃ NJ Ecotype), the years (2021 ˃ 2020 ˃ 2022 ˃ 2019 ˃ 2018), and the treatments (HA ˃ NPK ˃ UC).

1. Introduction

Biomass for energy production continues to be one of the main sources of renewable energy in the EU, with a share of almost 60% [1]. Bioenergy production has become an acceptable alternative to the use of fossil fuels, and plants grown for energy use have thus penetrated agricultural land, especially marginal soils.
Switchgrass (Panicum virgatum L.) is a crop that can be used for bioenergy production. Switchgrass is a forage and energy crop that belongs to C4 crops, as it has low nutritional requirements and creates a high biomass yield, even on infertile and marginal land [2,3,4,5]. It follows that production of switchgrass biomass will not compete with food production in terms of cultivable land use, because switchgrass is grown on marginal lands. The traditional use of this plant was related to soil conservation and forage production [6]. Marginal lands are characterized as having little or no agricultural importance with poor soil qualities, making them unsuitable for food production. Therefore, switchgrass is important as an energy source on account of its characteristic superiorities of high yield, strong adaptability, and no direct competition with food crops [7].
Cellulose and hemicellulose are the major polysaccharides of plant cell walls. Lignin comprises a substantial portion of the grass secondary cell wall and essentially fills the pores between the polysaccharides [8]. As plants mature, the wall composition shifts from almost no lignin to 20–30% lignin. High content of lignin is especially undesirable in the biomass used as bioenergy feedstock for methane and lignocellulosic bioethanol production [9]. Since 1991 this grass has also been used in Canada for thermal conversion (electricity and heat) and ethanol and paper pulp production [10]. Many reasons justify the use of this plant as an energy crop, such as its high biomass productivity, low nutrient requirement, low production costs, high water-use efficiency, large range of geographic adaptations, and high potential for carbon sequestration in soil [11]. Studies conducted by [12] showed an enhancement of germination of four switchgrass populations by the application of three concentrations of humic acids isolated from three different composts. Schmer et al. [11] showed that cultivated switchgrass, with respect to wild switchgrass, doubles the quantity of cellulose produced, with significant benefits in terms of biofuel and energy production.
The aim of this study was to determine the ligno-celullose quality and calorific value of switchgrass, with nutrition treatments, years, and cultivars statistically evaluated within a small-scale pilot open-field experiment conducted under continental climate conditions of Central Europe. Within the work, two equal aspects of quality were followed. The primary one was the content-basis quality and a the secondary one was the yield-basis quality.

2. Materials and Methods

2.1. Pilot Screening Trials during 2018–2022

Agronomically designed small-scale open-field pilot screening with seven cultivars of newly introduced switchgrass Panicum virgatum L. was established and carried out within the internal capabilities of NPPC-VUA in Michalovce, during 2018–2022. The site was located on the Eastern Slovakian Lowland under a moderate continental central European climate, and in a locality with heavy soil and semi-arid to semi-humid conditions.
The cultivars of EG 1101 (H1), BO Master (BO), EG 1102 (H3), Kanlow (K), Alamo (A), Carthage (C), and NJ Ecotype (NJ) were tested in the experiment, and three nutrition treatments were followed: pre-sowing (i/HA) soil humic preparation HUMAC Agro in the ameliorative dose of 1000.0 kg ha−1, (ii/NPK) basic nutrition with a dose of 220.0 kg ha−1 NPK (the annual dose of 70 kg ha-1 N was applied to both treatments (HA, NPK)), and (iii/UC) untreated control. The experimental layout was a randomized block design. The trial was established in the spring of 2018 and ran until 2022. The crop phytomass was collected and quality analyses were also performed in 2018–2022, despite the low switchgrass yield in the establishment year (2018). A more detailed description of the screening trial in terms of trial site, nutrition treatments, agronomy, weather and soil conditions, plant material, biometric parameters, and collection of plant samples is presented in a former paper [13].

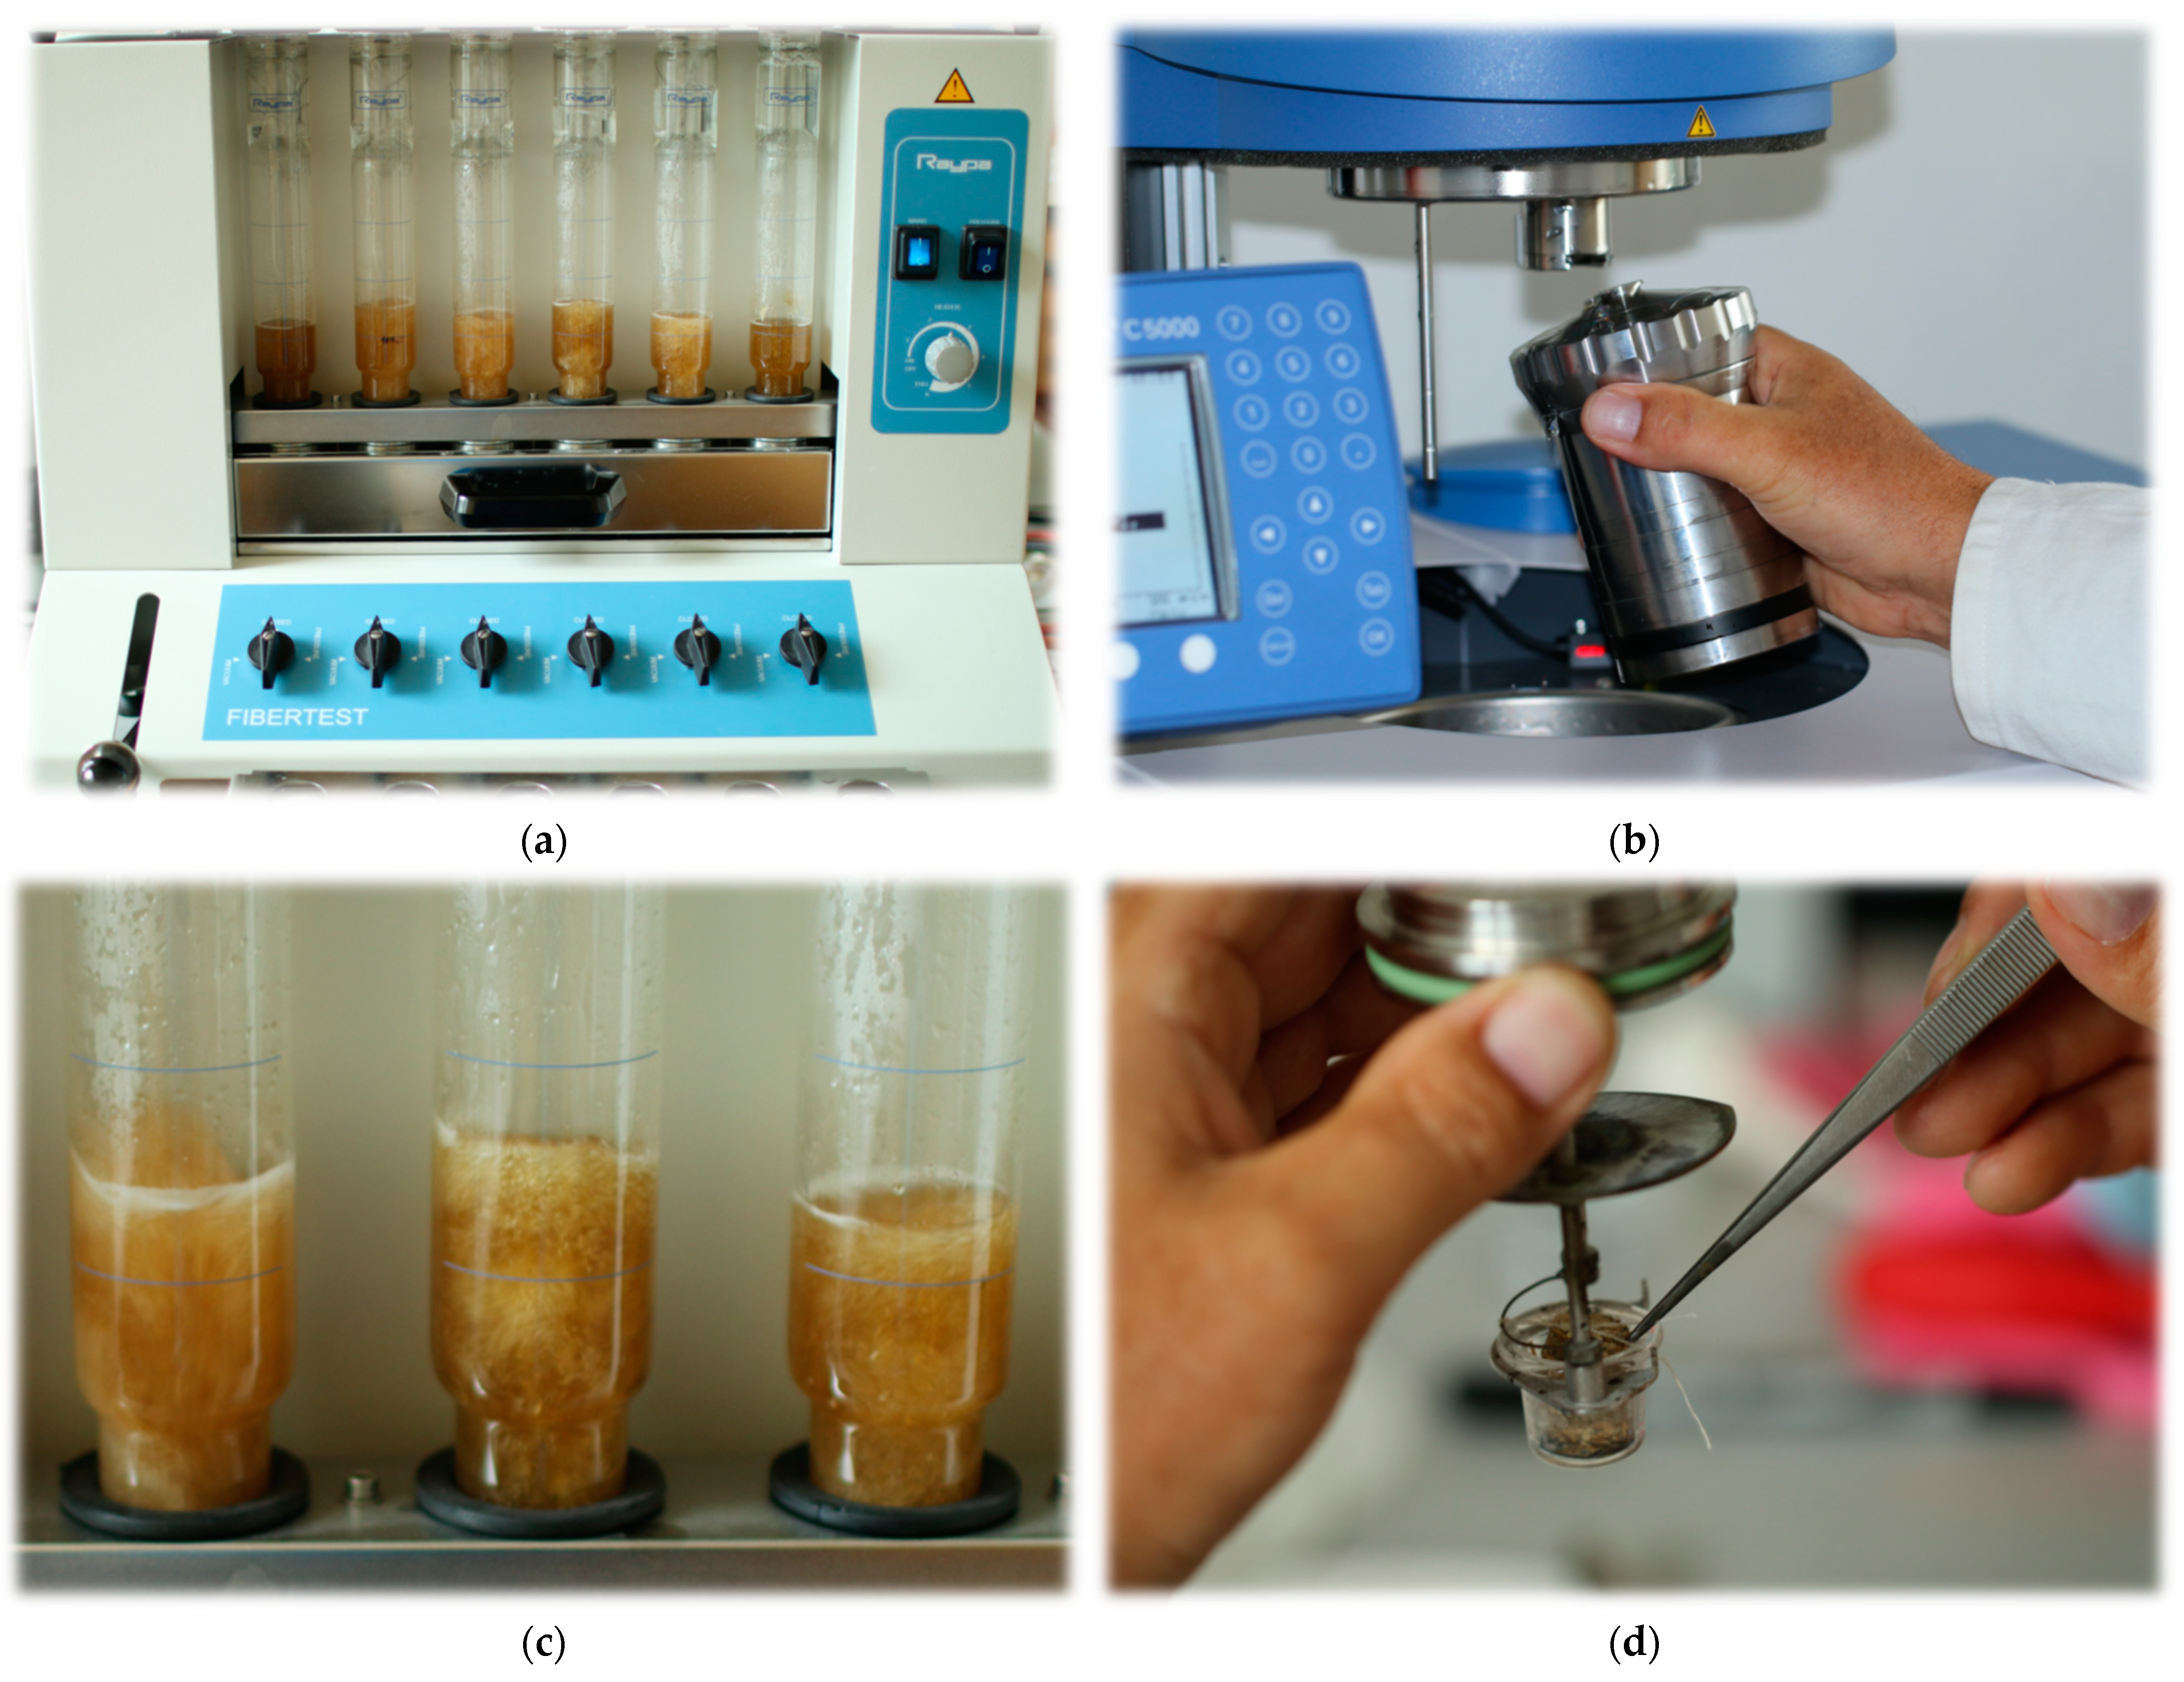
2.2. Laboratory Analyses

Collection of switchgrass green phytomass samples was timed to optimal harvest maturity in terms of crop development, and occurred regularly between 20 and 30 September, whereas the crop was not desiccated before harvest. The samples were analyzed in the laboratory of NPPC-VUA Michalovce, with standard methodology used regarding followed quality indicators: acid detergent fiber (ADF), neutral detergent fiber (NDF), and acid detergent lignin (ADL) were determined according to the European standard EN ISO 13906/2008 [14] by extraction the following systems: Fiber extractor–Fibertest, Model F-6 and Cold Extraction Unit, Model EF-6 (Figure 1a,c). Hemicellulose (HEM) was calculated as the difference between NDF and ADF concentration, crude cellulose as the difference between ADF and ADL, and lignin as ADL corrected for ash concentration. Combustion heat and high heating value (HHV) were determined by the IKA C 5000 calorimetric system (Figure 1b,d), in accordance with STN standard ISO 1928 [15].

2.3. Statistical Methods

A total of 672 original quality data were evaluated (7 cultivars × 6 parameters × 3 treatments × 2 quality terms), exactly half in terms of quality content and half in terms of quality yield. A primary data set consisted of 336 quality content data, whereas each set of the data was an average of two analytical repetitions (classical twin laboratory analyses, with 672 authentic analyses performed). A secondary set of 336 data was generated in terms of quality yield (quality profit) and a simple equation was used:
quality   yield = quality   content   ×   crop   yield
where quality content (%, or kJ g−1) concerning each of the six quality parameters and the crop yield in DM yield (Mg ha−1) were applied.
Multi-factorial ANOVA was applied to identify significant factors having influence on quality variability using Statgraphics 15.2.14, and each of the quality parameters was evaluated within both data sets.
Moreover, trend analyses were also performed. These were logarithmic in terms of quality content and linear in terms of quality yield and are presented in accordance with the higher reliability achieved. For this purpose another 315 sets of biometric data were applied as independent variables. These complementary parameters (crop yield, plant height, and dry matter content at harvest) were the subject of the former paper ([13]). Finally, the cultivar order based on the average DM yield achieved, as used in the tables, is listed in the results of the former paper.

3. Results

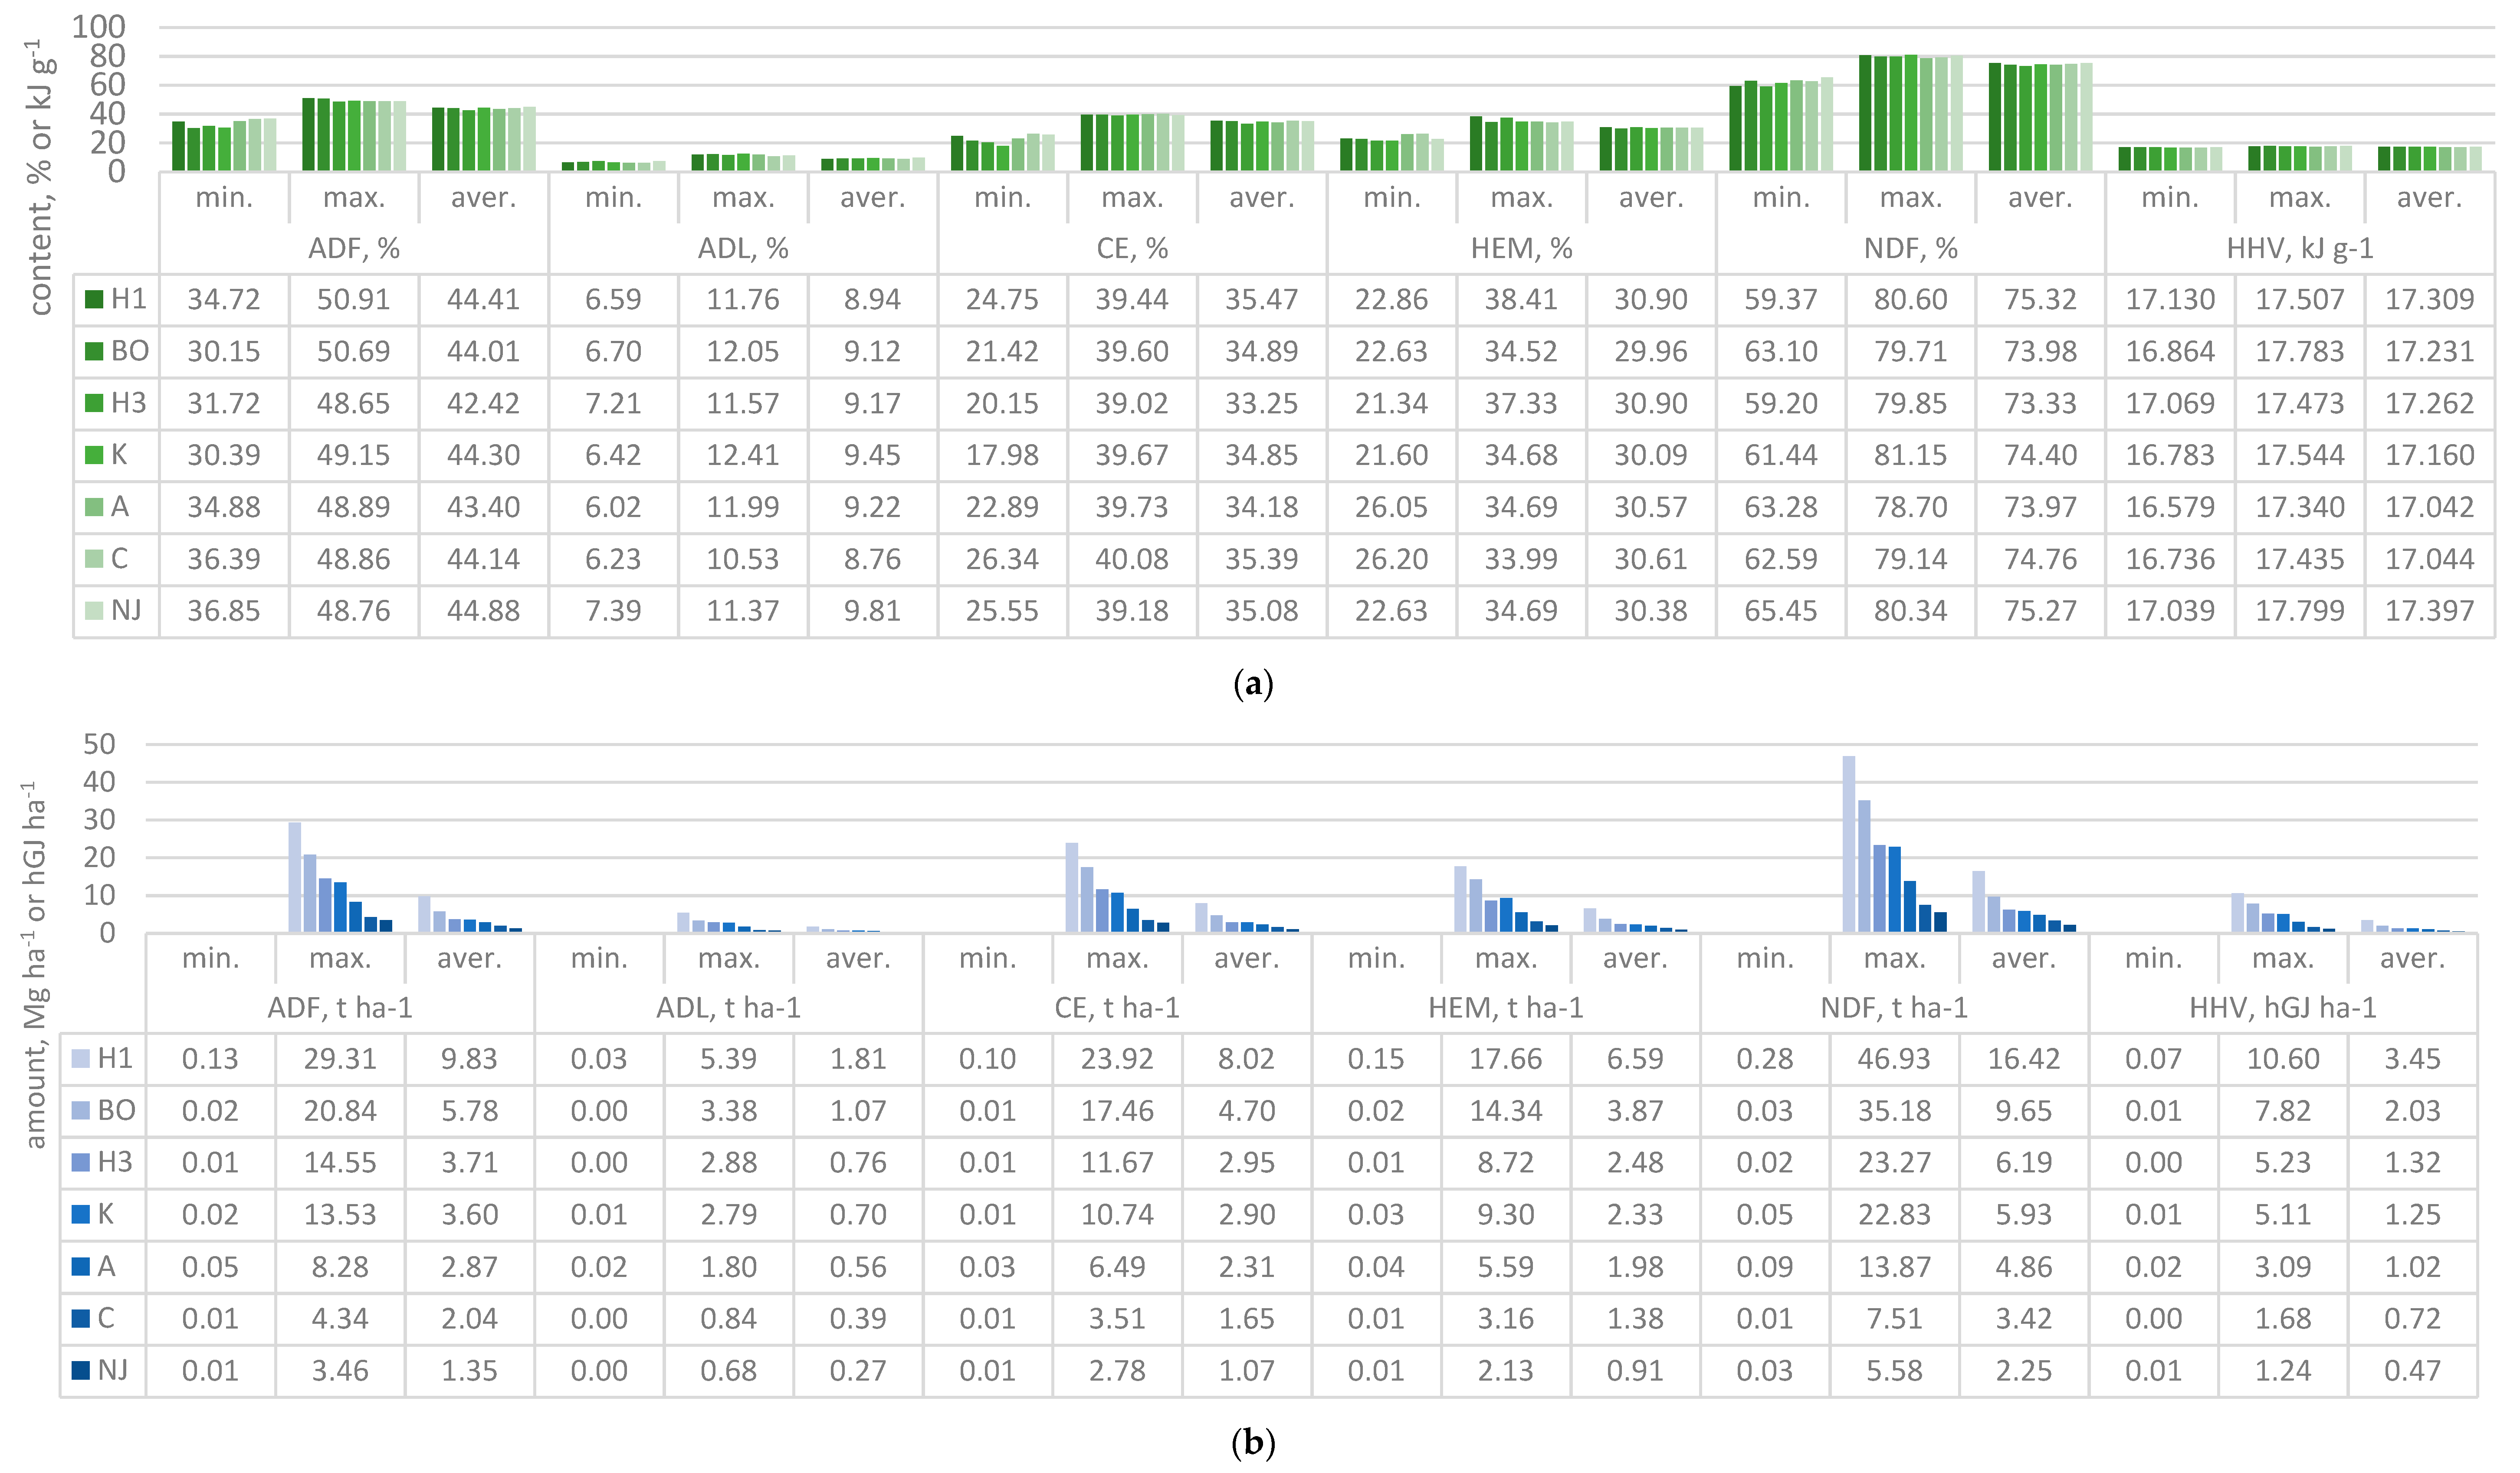
3.1. Mean Values and Main Effects

Total average ADF content of the switchgrass was 43.94%, ADL 9.21%, CE 34.73%, HEM 30.49%, NDF 74.43%, and HHV 17.206 kJ g−1, with ADF ranging from 30.15 to 50.91%, ADL from 6.02 to 12.41%, CE from 17.98 to 40.08%, HEM from 21.34 to 8.41%, NDF from 59.20 to 81.15%, and HHV from 16.579 to 17.799 kJ g−1. An adequate value of ADF yield was 4.17 Mg ha−1, ADL 0.79 Mg ha−1, CE 3.37 Mg ha−1, HEM 2.79 Mg ha−1, NDF 6.96 Mg ha−1, and HHV 1.466 hGJ ha−1, while ADF ranged from 0.01 to 29.31 Mg ha−1, ADL from 0.00 to 5.39 Mg ha−1, CE from 0.01 to 23.92 Mg ha−1, HEM from 0.01 to 17.66 Mg ha−1, NDF from 0.01 to 46.93 Mg ha−1, and HHV from 0.003 to 10.603 hGJ ha−1 (Figure 2). In terms of quality content, the influence of the cultivars was generally the most significant effect, followed by years, and finally by nutrition, with the least impact (Table 1). The effect was similar in terms of quality yield, excluding, however, HHV yield which had the most significant effect of the nutrition (Table 2).

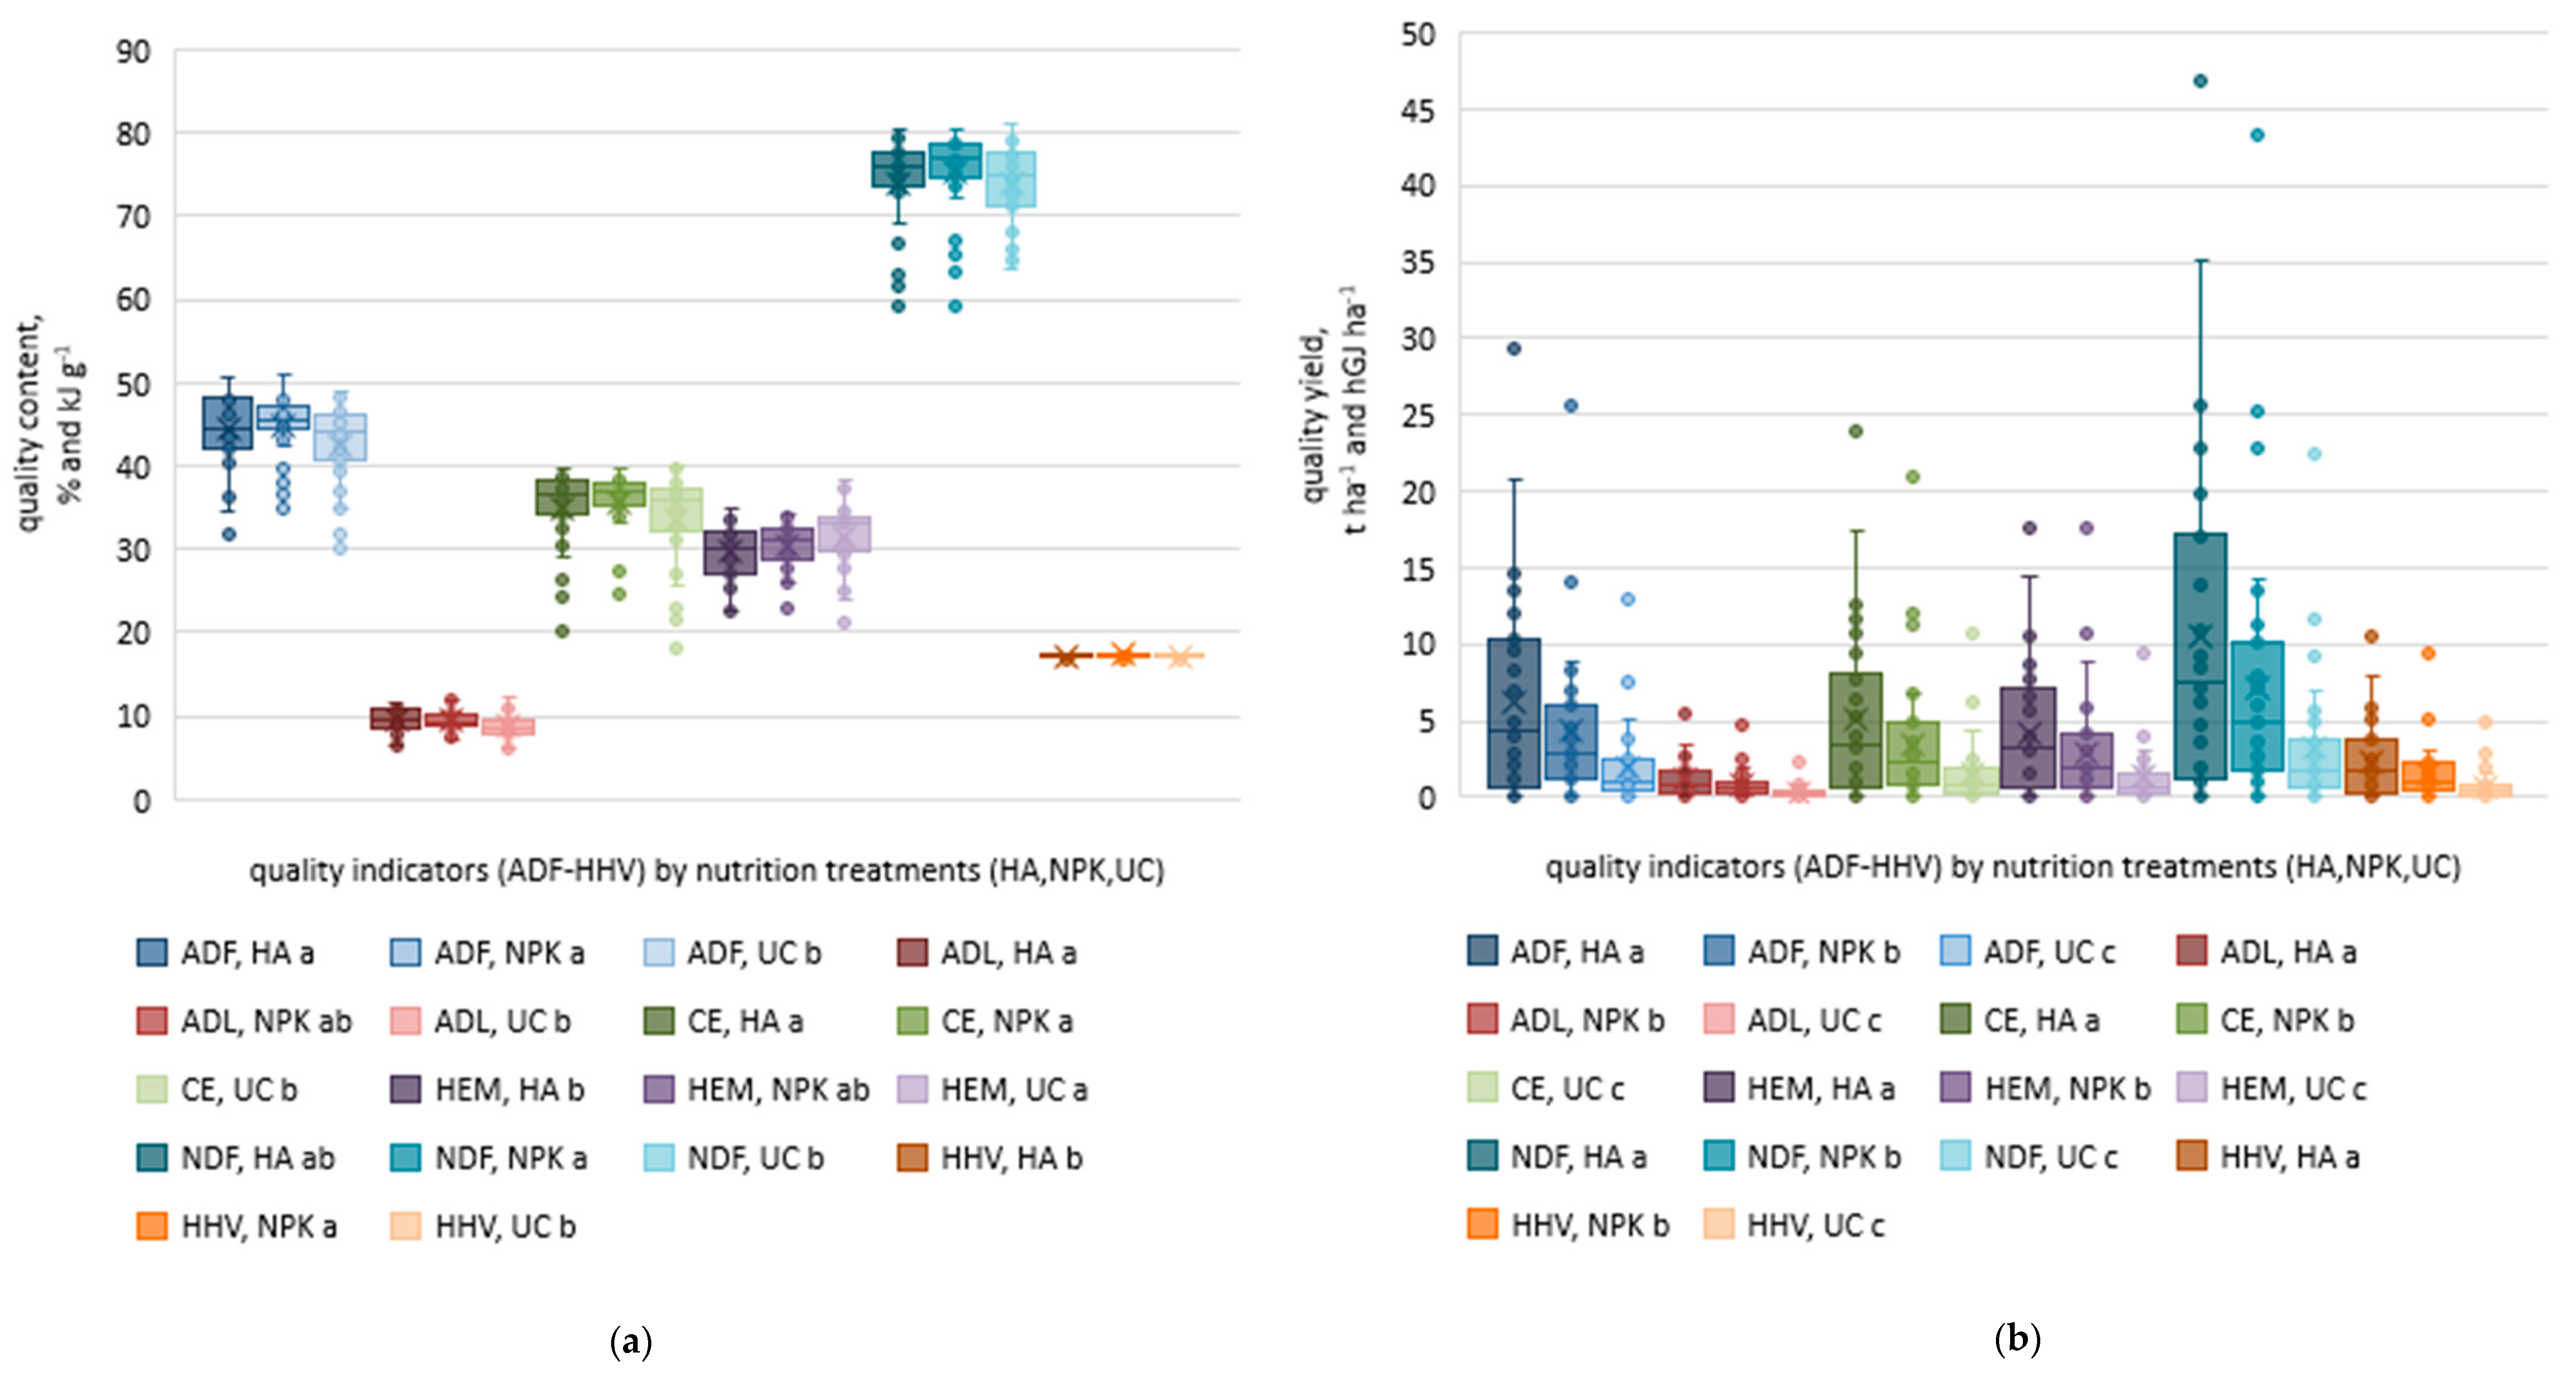
3.2. Levels of Main Effects

3.2.1. Quality Content

Statistical evaluation of levels of the main effects showed the formation of differentiated homogenous groups (Table 3, Figure 3), whereas
  • the cultivars were accompanied by the highest proportion of differentiated homogeneous groups concerning calorific indicator HHV, while to a lesser extent concerning all ligno-cellulose indicators (ADF and NDF);
  • the years were accompanied by a medium proportion of differentiated homogeneous groups, while to a lesser extent concerning HEM and NDF;
  • the nutrition was accompanied by the smallest proportion of differentiated homogeneous groups.

3.2.2. Quality Yield

Similar evaluation of the levels of the main effects on homogenous groups forming (Table 4, Figure 3) showed that
  • cultivars were accompanied by a high proportion of differentiated groups, while
    the highest average values of each indicator always belonged to EG 1101 (the cultivar with the highest DM yield);
    the lowest average values of each indicators always belonged to NJ Ecotype (the cultivar with the lowest DM yield);
    the groups followed the cultivars in DM yield order: EG 1101 ˃ BO Master ˃ EG 1102 ˃ Kanlow ˃ Alamo ˃ Carthage ˃ NJ Ecotype (21.15, 12.48, 8.14, 7.70, 6.34, 4.47, and 2.89 Mg ha-1 DM, respectively, when ranking average yield);
  • years were accompanied by the creation of four groups with a scheme identical to the crop increasing productivity in general, while
    the highest average values of each indicator were always achieved in 2021 (the year with the highest DM yield);
    the lowest average values of each indicators were always achieved in 2018 (the establishment year with the lowest DM yield);
    the groups followed the years by DM yield order: 2021 ˃ 2020 ˃ 2022 ˃ 2019 ˃ 2018 (19.13, 12.44, 7.73, 5.41, and 0.40 Mg ha−1 DM, respectively, when ranking average yield);
  • nutrition treatments were accompanied by the creation of three groups with a scheme identical to the crop increasing productivity in general, while
    the highest average values of each indicators were always achieved with HA (the treatment with the highest DM yield);
    the lowest average values of each indicators were always achieved with UC (untreated control with the lowest DM yield);
    the groups followed the nutrition treatments by DM yield order HA ˃ NPK ˃ UC (13.69, 9.19, and 4.19 Mg ha−1 DM, respectively, when ranking average yield).

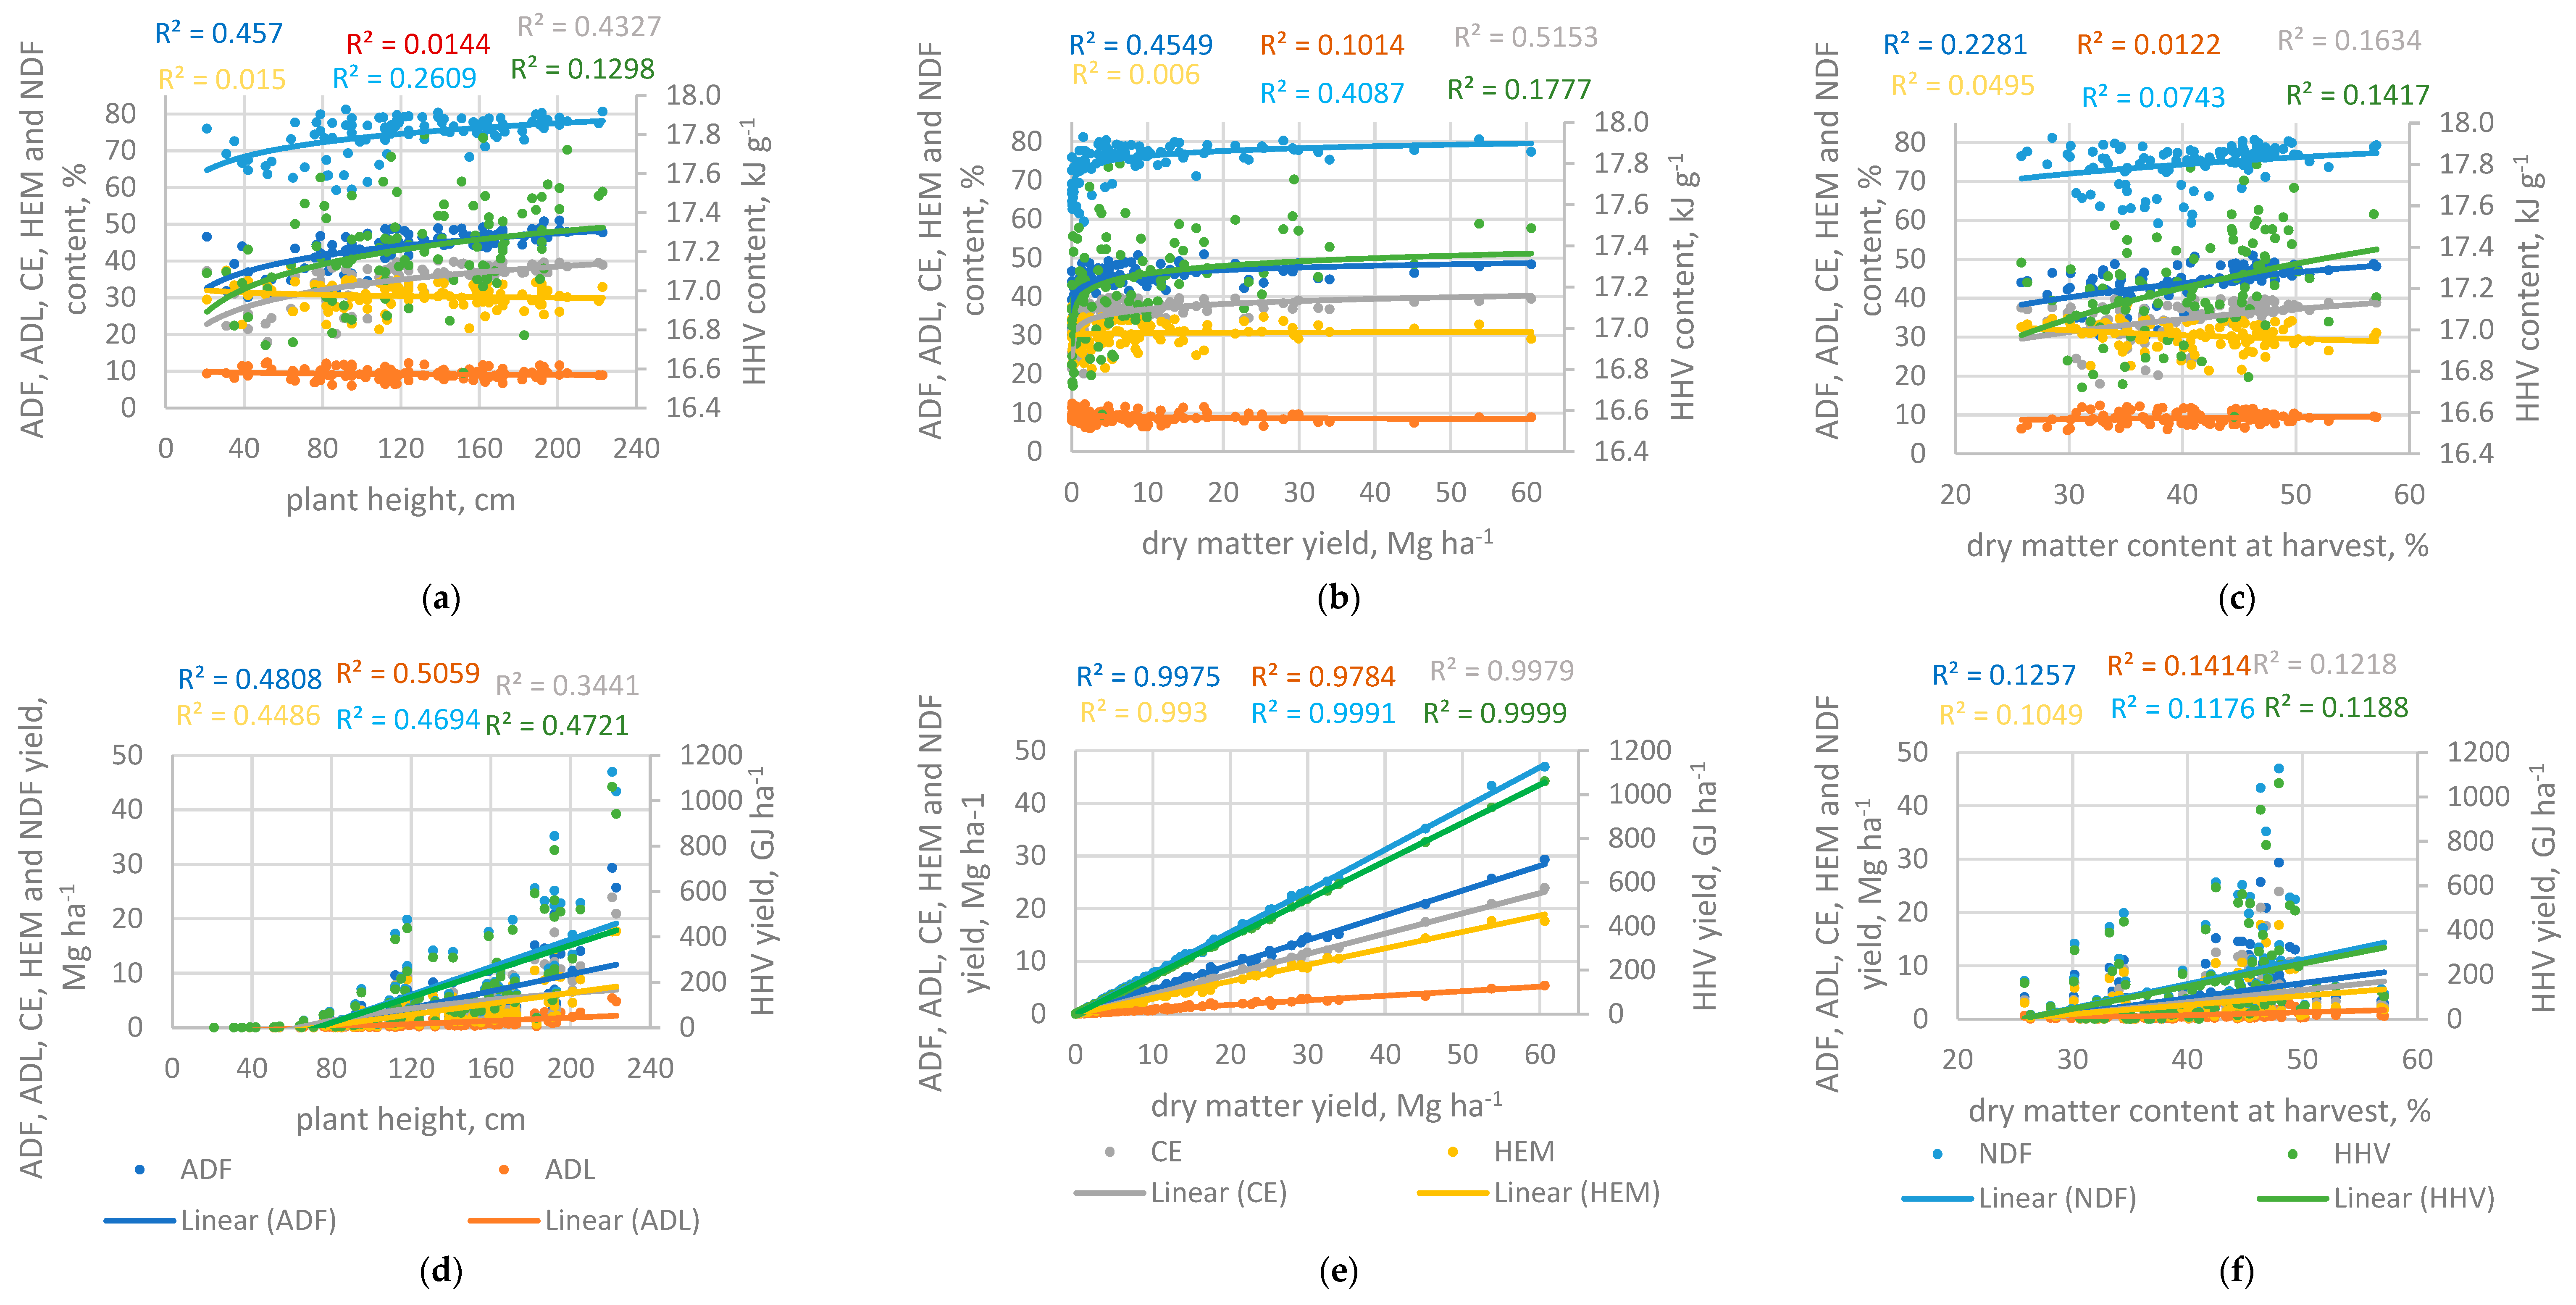
3.3. Impact of Plant Height, DM Yield and DM Content

Figure 4a–f show dependencies of quality content and yield on plant height, dry matter (DM) yield and DM content at harvest. Within the subfigures, logarithmic (a–c) or linear (d–f) trends are presented, while trends are regularly logarithmic in terms of quality content and linear in terms of quality yield. All subfigures (a–f) are optimized to show whole data cluster; the reliability index is also displayed.
In terms of quality content it was characteristic that the evaluated dependencies had a weak reliability with logarithmic courses being suitable, when
  • R2 ranged between 0.0150 and 0.2609 for the effect of ADL, HEM, NDF, and HHV on plant height;
  • R2 ranged between 0.006 and 0.1777 for the effect of ADL, HEM and HHV on DM yield;
  • R2 ranged between 0.0495 and 0.2281 for the effect of all the indicators on DM content at harvest;
with exception of the middle effects of ADF and CE on plant height, with R2 values of 0.457 and 0.4327, respectively, as well as the effects of ADF, CE, and NDF on DM yield, with the R2 values of 0.4549, 0.5153, and 0.4087, respectively. However, logarithmic courses were also suitable.
In agreement with the weak reliability of quality content, weak reliability was also achieved concerning the dependencies of quality yield on DM content at harvest, whereas R2 ranged from 0.1015 to 0.1384 when logarithmic trends were applied and ranged from 0.1049 to 0.1414 within linear trends, so both the trend courses were similar to those of adequate content logarithmic ones. In contrast to the quality content, the adequate trend courses of quality yield were typical of
  • middle reliability within the indicators’ dependence on plant height, while
    R2 ranged from 0.3311 to 0.4721 under logarithmic courses and from 0.3441to 0.5059 under linear courses;
    the highest reliability was recorded for HHV (logarithmic 0.4721, linear 0.5059);
  • strong reliability within the indicators’ dependence on DM yield with
    R2 ranging from 0.9784 to 0.9999 under linear courses, while
    middle reliability was recorded with R2 of 0.3441–0.5059 under logarithmic courses, which was, therefore, less relevant for ligno-cellulose indicators (ADF and NDF)
    there was strong reliability with R2 of 0.9999 for the calorific indicator HHV despite the logarithmic course being applied.

4. Discussion

4.1. Ligno-Cellulose Quality

The study provided data on chemical composition and calorific value of seven switchgrass cultivars, that were fertilized differently. In the trial, depending on the cultivar, nutrition, and years, the neutral detergent fiber (NDF) of switchgrass ranged from 59.20 to 81.15%, the acid detergent fiber values from 30.15 to 50.91%, the acid detergent lignin from 6.02 to 12.41%, the cellulose from 17.98 to 40.08%, and the hemicellulose from 21.34 to 38.41%. The results obtained for chemical composition of the switchgrass biomass were comparable to those reported in the literature [16,17,18,19,20,21,22,23,24,25].
The composition of carbohydrates, as well as the concentration of lignin in the biomass, depended on the switchgrass cultivars. Cultivar EG 1102 had the highest cellulose and hemicellulose content with an average of 35.469% and 30.903%, respectively, and cultivar NJ Ecotype had the highest lignin content with an average of 9.806% compared to all other cultivars analyzed in this study.
The chemical composition of different switchgrass cultivars has been assessed by many authors. Brown et al. [26] evaluated the composition of three switchgrass cultivars (Cave-in-Rock, Carthage, Shawnee) from four reclaimed sites in West Virginia. Biomass quality traits differed among cultivars. Neutral detergent fiber (NDF) ranged between 76.9 and 84.0% and acid detergent lignin (ADL) between 5.1 and 6.4%. Cave-in-Rock had the highest concentrations of NDF and ADL, while Carthage had the lowest. The switchgrass of Blackwell cultivar had higher NDF and ADF values trials conducted by Corleto et al. [27]. Authors conducted a 3-year trial at three different locations in southern Italy to assess yields and quality of 23 perennial grasses; among them was the Blackwell switchgrass cultivar. The highest NDF values in the switchgrass were 73.0% and the highest ADF values in the Sorghum almum was 4.0%, while the higher ADF values were also in the switchgrass (40%).
High values of quality parameters of switchgrass at three different localities were also recorded by Xu et al. [28]. NDF values ranged from 72.1 to 80.4%, ADL values ranged from 7.7 to 10.5%, CE values ranged from 36.6 to 42.1%, and HEM values from 28.7 to 30.7% in the second year of growth.
Serapiglia et al. [19] cultivated nine cultivars of switchgrass on one prime and two marginal sites in New Jersey. The results showed that biomass composition was affected by cultivar type and by growing location. Cultivar Timber 3 had the highest cellulose content averaging 50.5% and cultivar Cave-In-Rock 3 had the highest lignin content with an average of 14.1% compared to all other cultivars analyzed in this study. The upland cultivars, Cave-In-Rock 3, Carthage 3, and High Tide 4, had lower cellulose content and greater lignin content compared to the lowland cultivars. Hemicellulose content was significantly different by location but not by cultivar. Madakadze et al. [29], in a two-year field study carried out on a free-draining sandy clay loam, evaluated changes in biomass composition of different cultivars of switchgrass. The maximum values of ADF and NDF were 64.8% and 84.9% for Cave-in-Rock, 66.9% and 86.5% for Pathfinder, and 66.2% and 86.1% for Sunburst. These results indicate that switchgrass has potential as a good biomass crop.
Amaleviciute-Volunge et al. [23] compared the chemical composition of seven types of perennial grass. Each perennial herbaceous plant species had a different chemical composition. For switchgrass, the average value of neutral detergent fiber was 70.49%, the average value of acid detergent fiber was 39.9%, the average value of cellulose was 34.2%, the average value of hemicellulose was 30.54%, and the average value of lignin 5.7%. Results of our research are similar to these data on the chemical composition of switchgrass.
Oginni et al. [20,21] determined the chemical composition (cellulose, hemicellulose, and lignin) of the switchgrass cultivars (Bomaster and Kanlow) tested. The cellulose content was between 34.44 and 36.27%, the hemicellulose content was between 28.84 and 31.56%, and the lignin content was between 8.84 and 9.27% for the samples tested. Higher contents of monitored parameters were found in the Kanlow cultivar compared to the Bomaster cultivar.
Production of biomass for biofuel seeks to maximize lignocellulose yields. Sanderson and Wolf [30] compared lignocellulose content in two cultivars of the switchgrass grown in two localities. No differences were found in lignocellulose content of Alamo and Cave-in-Rock cultivars at Blacksburg. At Stephenville, Alamo had a greater concentration of lignocellulose than did Cave-in-Rock. Yan et al. [31] studied four cultivars of switchgrass (Alamo, GA993, GA992, and Kanlow) for differences in their chemical constituents. The results demonstrated that the lignin content in the four switchgrass cultivars was different.
Aurangzaib et al. [32] found that lowland ecotypes (Kanlow and Alamo) usually have higher cellulose and hemicellulose content, whereas upland ecotypes (Cave-in Rock, Blackwell, and Trailblazer) produce higher lignin concentrations. Many studies have reported differences among switchgrass cultivars in ligno-cellulosic composition [26,33], while others have shown similarities among cultivars [30].
Chemical composition of the biomass even depended on the plant harvest year. The concentrations of cellulose and hemicellulose in the recent harvest years were significantly higher and concentration of lignin decreased compared to the first harvest year. Butkuté et al. [9] recorded similar results. Parameters in the switchgrass in the first harvest year ranged from 32.5 to 34.7% for cellulose, from 22.8 to 28.4% for hemicellulose, and from 60.8. to 67.9% for lignin. In the second harvest year, the concentration these parameters was higher (cellulose 36.4–40.7%, hemicellulose 22.9–27.7%, and lignin 66.1–72.7%). High lignin concentration in switchgrass biomass in the second harvest year showed its great suitability for solid biofuel production.
Zhang et al. [34] evaluated chemical composition of the switchgrass (Alamo cultivar). They found a significant and positive correlation between the cellulose (CE) and acid detergent fiber (ADF) content in the switchgrass biomass (R = 0.959).

4.2. Calorific Value

In our experiments, depending on the cultivar, nutrition, and year, the calorific value of switchgrass ranged from 16.579 to 17.799 MJ kg−1. Our results are comparable to other published works on calorific values of biomass. According to Giannoulis et al. [35], the switchgrass in their eighth growing year achieved a remarkable dry biomass yield characterized of an average calorific value 17.3 MJ kg−1. Multiplying the heating value by the dry yield of switchgrass biomass produced, Giannoulis et al. [35] found that the production of energy per hectare ranged from 162.0 to 241.0 GJ ha−1.
Our results showed a significant difference in calorific values between different cultivars, different years, and the nutrition of the switchgrass. According to the treatments, the highest values of combustion heat (HHV) were found for cultivars NJ Ecotype (17.398 MJ kg−1) and EG 1101 (17.309 MJ kg−1) and the lowest for cultivars Alamo (17.042 MJ kg−1) and Carthage (17.044 MJ kg−1). At the lowest yields of the cultivar NJ Ecotype, despite the highest value HHV, the lowest yield of the quality parameter HHV was achieved (50.42 GJ ha−1). High values of HHV and yield were achieved with cultivar EG 1101 and, therefore, the yield of the quality parameter HHV (367.89 GJ ha−1) was the highest with this cultivar.
A wide range of energy yield was also recorded in the study of Hoagland et al. [36]. The thermal energy yield of switchgrass ranged from 60.0 to 230 GJ ha−1 across growing season and treatments. For both years, there was a significant effect of harvest timing on thermal energy yield, with mid-fall harvests having greater energy yield than spring harvests.
According to the study of Pilon and Lavoie [17] the switchgrass of cultivar Cave-in-Rock had an average calorific value 19.5 MJ kg−1. Amabogha et al. [37] compared the calorific value of eight types of crops (sunflower (Helianthus annuus), Indian mustard (Brassica juncea), soybean (Glycine max), willow (Salix spp.), poplar (Populus spp.), switchgrass (Panicum virgatum), buckthorn (Typha latifolia), and silver grass (Miscanthus sinensis). Sunflower and silver grass emerged as the two best candidates for bioenergy production while soybean and switchgrass had the lowest performance. Calorific value data ranged from 17.25 to 20.46 MJ kg−1. Florine et al. [38] found that heating values (HHV) in 26 grass species, including the switchgrass, ranged from 17.69 to 19.46 MJ kg−1. Mani et al. [39] found that switchgrass had a higher calorific value than wheat straw, barley straw, or corn stems.
Biomass-based energy production requires crops with a high yield output along with high biomass qualities. Optimum fertilizing of perennial crops will make it possible to achieve higher yields. In a study based on data collected from a field trial between 2002 and 2012, Iqbal et al. [40] evaluated the yield and quality performance of miscanthus and switchgrass using different nitrogen fertilization regimes (0 kg ha−1, 40 kg ha−1, and 80 kg ha−1). The authors found that dry matter production of both crops increased with increasing nitrogen dose. Hoagland et al. [36] determined the effect of different nitrogen fertilizer doses (0, 56, 112, 168, and 224 kg ha−1) and harvest timing (mid-fall, late-fall, and spring) on dry matter yield and switchgrass quality. Results showed a positive response of switchgrass to N fertilizer, with no yield gain above112 kg ha−1 of N. Energy content of switchgrass was not significantly affected by the management.
The effect of different nitrogen fertilization regimes on the yield and the qualitative composition of the switchgrass biomass was also investigated by Mulkey et al. [41], Lemus et al. [42], Mohammed et al. [43], Seepaul et al. [44], Tang et al. [45], and Lee et al. [46].
Saidur et al. [47,48] reported that the heating value correlated well with the lignin content of the lignocellulosic biomass. Higher lignin content in plants usually means higher heating value which makes lignin an important constituent of plants’ biochemical composition. They also recorded similar results to those of Amaleviciute-Volunge et al. [49] when they analyzed the relationship between the heating value and chemical composition of the biomass and found a strong correlation between the heating value and acid detergent lignin (ADL) 0.548 ** (p < 0.01).

4.3. Impact of the Humic Amendment

Small differences in HHV values were found between the fertilization variants. The highest HVV value was found with NPK fertilization (17.295 MJ kg−1) and the lowest in the untreated control (17.143 MJ kg−1). However, energy production per hectare ranged widely from 72.37 to 236.82 GJ ha−1. The yield of the qualitative parameter HHV (236.82 GJ ha−1) was the highest when the pre-sowing soil humic preparation Humac AGRO was used. Higher HHV yield in GJ ha-1 with this fertilization was related to higher switchgrass yield.
A number of studies report that compost HAs possess bioactive effects on various herbaceous plants and that plant response can differ depending on compost type and chemical and physico-chemical properties of compost HA. The use of compost as a soil amendment produces direct and indirect positive effects on soil fertility and plant growth attributable especially to the HA fraction [50,51,52]. Traversa et. al. [12] found that significant beneficial effects were produced by any HA on switchgrass germination and early growth as a function of the population tested and the HA dose. These results suggest a possible use of compost as soil amendment in areas where switchgrass grows naturally or is cultivated. This is also in accordance with our former results [53,54,55,56] where the bioactive effects of HA affected growth of dedicated crops, crop height, and dry matter yield, which, consequently, also increased the qualitative indicators. Within the experiments, the highest average values of each quality profit indicator (ADF, ADL, CE, HEM, and NDF in Mg ha−1; HHV in GJ ha−1) was always achieved always under humic treatment and had a significant impact.

5. Conclusions

Ligno-cellulose quality and calorific value of switchgrass vary with cultivar, management practices, and environmental conditions. Based on small-plot open-field stationary screening of seven selected cultivars, the impact of pre-sowing nutrition treatments (soil-applied humic ameliorative amendment, high NPK basic dose, and low-input untreated control), and years mainly affected acid detergent fiber (ADF), acid detergent lignin (ADL), crude cellulose (CE), hemicellulose (HEM), neutral detergent fiber (NDF), and high heating value (HHV). Two aspects of quality were evaluated in the study. The primary aspect was the content-basis quality (% or kJ g−1), which is considered to be a general indicator of phytomass quality, and the secondary one dealt with yield-basis quality (kg ha−1 or GJ ha−1). This is important to processors as it impacts the area required to create a sustainable supply-chain for a processing plant.
In terms of quality content, the influence of the cultivars was generally the most significant factor (valid for all indicators excluding NDF), and even with the influence of the years as factor was higher than the influence of the nutrition treatments. Similarly, in terms of quality yield the cultivars were confirmed to be the most important factor (mainly because of the great differences in phytomass yield provided by conventional and newly bred cultivars), followed by years and then by nutrition, with the least impact. That impact order was valid for each of ligno-cellulose indicators (excluding NDF), while the impact of nutrition was the most important factor concerning HHV.
Despite the fact that nutrition seemed to be the least important factor in general, differences between the nutrition treatments were significant in terms of quality yield, while the highest values of all the indicators, ligno-cellulose, and calorific value were achieved under soil-applied humic ameliorative amendment (HA ˃ NPK ˃ UC). This issue could be a subject of closer morphological study, however this result is an important one now, and is equal to the cultivar ranking of EG 1101 ˃ BO Master ˃ EG 1102 ˃ Kanlow ˃ Alamo ˃ Carthage ˃ NJ Ecotype according to the DM yield and quality yield.
Moreover, the influence of plant height, dry matter (DM) yield, and DM content at harvest on quality were also evaluated by trend analyses, mainly with logarithmic and linear courses. In terms of quality content, it was characteristic that the evaluated dependencies had a weak reliability in general, with only some exceptions of the middle ones within the impact of plant height and DM yield on ADF and CE content. Despite the weak reliability of the relationships, increased DM content at harvest seemed to have a decreasing effect on HEM content, but was neutral or positive with respect to the other quality content indicators. A weak reliability was achieved concerning dependencies in terms of quality yield on DM content at harvest, but middle to high reliability was typical within all the impacts of DM yield and plant height on the quality yield, while it was valid for all indicators of ligno-celullosic quality and calorific value. Therefore, both plant height and DM yield are good indicators of quality yield of ligno-cellulose and energy yield, while DM content at harvest appeared to be optimal at 40–50%, although this requires more data in order to be evaluated more precisely.

Author Contributions

Conceptualization, Š.T.; methodology, Š.T. and B.Š.; software, Š.T. and Š.D.; validation, Š.T. and B.Š.; formal analysis, Š.T. and B.Š.; investigation, Š.T., B.Š., P.P. and Š.D.; resources, Š.T.; data curation, Š.T. and B.Š.; writing—original draft preparation, Š.T. and B.Š.; writing—review and editing, Š.T., B.Š., Š.D. and P.P.; visualization, Š.T. and Š.D.; supervision, Š.T.; project administration, Š.T.; funding acquisition, Š.T. All authors have read and agreed to the published version of the manuscript.

Funding

This research was funded with the support of (i) HORIZON 2020/FLAGSHIP project BIOSKOH ID: 709557 BBI-FLAG Innovation Stepping Stones for a novel European Second Generation BioEconomy support and (ii) Operational Programme Integrated Infrastructure within the project INOVAFERT: Innovative fertilizers with alternative natural sources and their implementation in agrotechnical practices, ID 313011BWL7, co-financed by the European Regional Development Fund.

Data Availability Statement

The datasets generated and analyzed during this study are available from the authors upon a reasonable request.

Acknowledgments

The authors express their gratitude to the editor, the reviewers, and the language correctors for their constructive comments.

Conflicts of Interest

The authors declare no conflict of interest. The funders had no role in the design of the study; in the collection, analyses, or interpretation of the data; in the writing of the manuscript, or in the decision to publish the results.

References

  1. Scarlat, N.; Dallemand, J.; Taylor, N.; Banja, M. Brief on Biomass for Energy in the European Union; Publications Office of the European Union: Luxembourg, 2019; ISBN 978-92-79-77235-1. [Google Scholar] [CrossRef]
  2. Gordon, G.A.; Morris, C.; Lister, S.J.; Barraclough, T.; Yates, N.; Shield, I.; Donnison, I.S. Effect of nitrogen fertiliser application on cell wall composition in switchgrass and reed canary grass. Biomass Bioenergy 2012, 40, 19–26. [Google Scholar] [CrossRef]
  3. Owens, V.N.; Viands, D.R.; Mayton, H.S.; Fike, J.H.; Farris, R.; Heaton, E.; Bransby, D.I.; Hong, C.O. Nitrogen use in switchgrass grown for bioenergy across the USA. Biomass Bioenergy 2013, 58, 286–293. [Google Scholar] [CrossRef]
  4. Ameen, A.; Tang, C.; Liu, J.; Han, L.; Xie, G.H. Switchgrass as forage and biofuel feedstock: Effect of nitrogen fertilization rate on the quality of biomass harvested in late summer and early fall. Field Crops Res. 2019, 235, 154–162. [Google Scholar] [CrossRef]
  5. Nail, G.P.; Poonia, A.K.; Chaudhari, P.K. Pretreatment of lignocellulosic agricultural waste for delignification, rapid hydrolysis, and enhanced biogas production: A review. J. Ind. Chem. Soc. 2021, 98, 100147. [Google Scholar] [CrossRef]
  6. Bouton, J.H. Molecular breeding of switchgrass for use as a biofuel crop. Curr. Opin. Genet. Dev. 2007, 17, 553–558. [Google Scholar] [CrossRef]
  7. Song, Y.; Legeng, P.; Guanyi, C.; Mu, L.; Yan, B.; Li, H.; Zhou, T. Recent advancements in strategies to improve anaerobic digestion of perennial energy grasses for enhanced methane production. Sci. Total Environ. 2023, 861, 160552. [Google Scholar] [CrossRef]
  8. Vogel, J. Unique aspects of the grass cell wall. Curr. Opin. Plant Biol. 2008, 11, 301–307. [Google Scholar] [CrossRef]
  9. Butkuté, B.; Lemežiené, N.; Cesevičiené, J.; Liatukas, Ž.; Dabkevičiené, G. Carbohydrate and lignin partitioning in switchgrass (Panicum virgatum L.) biomass as a bioenergy feedstock. Zemdirb.-Agric. 2013, 100, 251–260. [Google Scholar] [CrossRef] [Green Version]
  10. Elbersen, H.W.; Christian, D.G.; El Bassem, N.; Bacher, W.; Sauerbeck, G.; Alexopoulou, E.; Sharma, N.; Piscioneri, I.; de Visser, P.; van der Berg, D. Switchgrass variety choice in Europe. Asp. Appl. Biol. 2001, 65, 21–28. [Google Scholar]
  11. Schmer, M.R.; Vogel, P.; Mitchell, R.B.; Perrin, R.K. Net energy of cellulosic ethanol from switchgrass. Proc. Natl. Acad. Sci. USA 2008, 105, 464–469. [Google Scholar] [CrossRef]
  12. Traversa, A.; Loffredo, E.; Gattullo, C.E.; Palazzo, A.J.; Bashore, T.L.; Senesi, N. Comparative evaluation of compost humic acids and their effects on the germination of switchgrass (Panicum vigatum L.). J. Soils Sedim. 2014, 14, 432–440. [Google Scholar] [CrossRef]
  13. Tóth, Š.; Dupľák, Š. Effect of a Soil-Applied Humic Ameliorative Amendment on the Yield Potential of Switchgrass Panicum virgatum L. Cultivated under Central European Continental Climate Conditions. Agronomy 2023, 13, 1095. [Google Scholar] [CrossRef]
  14. ISO 13906; Animal Feeding Stuffs–Determination of Acid Detergent Fibre (ADF) and Acid Detergent Lignin (ADL) Contents. 1st ed. International Organization for Standardization: Geneva, Switzerland, 2008; 17p.
  15. ISO 1928; Solid Mineral Fuels—Determination of Gross Calorific Value by the Bomb Calorimetric Method and Calculation of Net Calorific Value. International Organization for Standardization: Geneva, Switzerland, 2009; 62p.
  16. Lemus, R.; Brummer, E.C.; Moore, K.J.; Molstad, N.E.; Burras, C.L.; Barker, M.F. Biomass yield and quality of 20 switchgrass populations in southern Iowa, USA. Biomass Bioenergy 2002, 23, 433–442. [Google Scholar] [CrossRef]
  17. Pilon, G.; Lavoie, J.M. Biomass char production at low severity conditions under CO2 and N2 environments. Trans. Ecol. Environ. 2011, 143, 109–121. [Google Scholar] [CrossRef]
  18. Han, K.J.; Moon, Y.; Day, D.F.; Pitman, W.D. Feedstock analysis sensitivity for estimating ethanol production potential in switchgrass and energy cane biomass. Int. J. Energy Res. 2015, 40, 248–256. [Google Scholar] [CrossRef]
  19. Serapiglia, M.J.; Mullen, C.A.; Boateng, A.A.; Cortese, L.M.; Bonos, S.A.; Hoffman, L. Evaluation of the impact of compositional differences in switchgrass genotypes on pyrolysis product yield. Ind. Crops Prod. 2015, 74, 957–968. [Google Scholar] [CrossRef]
  20. Oginni, O.; Singh, K.; Zondlo, J.W. Pyrolysis of dedicated bioenergy crops grown on reclaimed mine land in West Virginia. J. Anal. Appl. Pyrol. 2017, 123, 319–329. [Google Scholar] [CrossRef] [Green Version]
  21. Oginni, O.; Singh, K. Pyrolysis characteristics of Arundo donax harvested from a reclaimed mine land. Ind. Crops Prod. 2019, 133, 44–53. [Google Scholar] [CrossRef]
  22. Kupryś-Caruk, M.; Podlaski, S.; Kotyrba, D. Influence of double-cut harvest system on biomass yield, quality and biogas production from C4 perennial grasses. Biomass Bioenergy 2019, 130, 105376. [Google Scholar] [CrossRef]
  23. Amaleviciute-Volunge, K.; Slepetiene, A.; Butkute, B. The suitability of perennial grasses for combustion as influenced by chemical composition and plant growth stage. Zemdirb.-Agric. 2020, 107, 317–322. [Google Scholar] [CrossRef]
  24. Razar, R.; Makaju, S.; Missaoui, A.M. QTL mapping of biomass and forage quality traits measured using near-infrared reflectance spectroscopy (NIRS) in switchgrass. Euphytica 2021, 217, 2021. [Google Scholar] [CrossRef]
  25. Sacristán, D.; Cifre, J.; Llompart, M.; Jaume, J.; Gulias, J. Lignocellulosic biomass production and persistence of perennial grass species grown in mediterranean marginal lands. Agronomy 2021, 11, 2060. [Google Scholar] [CrossRef]
  26. Brown, C.; Griggs, T.; Holaskova, I.; Skousen, J. Switchgrass biofuel production on reclaimed surface mines: II. Feedstock quality and theoretical ethanol production. BioEnergy Res. 2016, 9, 40–49. [Google Scholar] [CrossRef] [Green Version]
  27. Corleto, A.; Cazzato, E.; Ventricelli, P.; Cosentino, S.L.; Gresta, F.; Testa, G.; Maiorana, M.; Fornaro, F.; De Giorgio, D. Performance of perennial tropical grasses in different Mediterranean environments in southern Italy. Trop. Grassl. 2009, 43, 129–138. Available online: https://www.researchgate.net/publication/237052615_Performance_of_perennial_tropical_grasses_in_different_Mediterranean_environments_in_southern_Italy (accessed on 9 July 2023).
  28. Xu, Y.; Porter, N.; Foster, J.L.; Muir, J.P.; Schwab, P.; Burson, B.L.; Jessup, R.W. Silica production across candidate lignocellulosic biorefinery feedstocks. Agronomy 2020, 10, 82. [Google Scholar] [CrossRef] [Green Version]
  29. Madakadze, I.C.; Stewart, K.; Peterson, P.R.; Coulman, B.E.; Smith, D.L. Switchgrass biomass and chemical composition for biofuel in eastern Canada. Agron. J. 1999, 91, 696–701. [Google Scholar] [CrossRef]
  30. Sanderson, M.A.; Wolf, D.D. Switchgrass biomass composition during morphological development in diverse environments. Crop Sci. 1995, 35, 1432–1438. [Google Scholar] [CrossRef]
  31. Yan, J.; Hu, Z.; Pu, Y.; Brummer, E.C.; Ragauskas, A.J. Chemical compositions of four switchgrass populations. Biomass Bioenergy 2010, 34, 48–53. [Google Scholar] [CrossRef]
  32. Aurangzaib, M.; Moore, K.J.; Archontoulis, S.V.; Heaton, E.A.; Lenssen, A.W.; Fei, S. Compositional differences among upland and lowland switchgrass ecotypes grown as a bioenergy feedstock crop. Biomass Bioenergy 2016, 87, 169–177. [Google Scholar] [CrossRef] [Green Version]
  33. David, K.; Ragauskas, A.J. Switchgrass as an energy crop for biofuel production: A review of its ligno-cellulosic chemical properties. Energy Environ. Sci. 2010, 3, 1182–1190. [Google Scholar] [CrossRef]
  34. Zhang, H.; Wang, Q.; Liu, Y.; Cui, J.; Ma, X.; Gu, M.; Xia, M. Coupling effects of water availability and pH on switchgrass and the optimization of these variables for switchgrass productivity determined by response surface methodology. Biomass Bioenergy 2015, 83, 393–402. [Google Scholar] [CrossRef]
  35. Giannoulis, K.D.; Bartzialis, D.; Skoufogianni, E.; Charvalas, G.; Danalatos, N.G. Comparison of two perennial energy crops for biomass production at the end of their life cycle. Agron. Res. 2020, 18, 1267–1277. [Google Scholar] [CrossRef]
  36. Hoagland, K.C.; Ruark, M.D.; Renz, M.J.; Jackson, R.D. Agricultural management of switchgrass for fuel quality and thermal energy yield on highly erodible land in the driftless area of Southwest Wisconsin. Bioenergy Res. 2013, 6, 1012–1021. [Google Scholar] [CrossRef]
  37. Amabogha, O.; Garelick, H.; Jones, H.; Purchase, D. Combining phytoremediation with bioenergy production: Developing a multi-criteria decision matrix for plant species selection. Environ. Sci. Pollut. Res. 2023, 30, 40698–40711. [Google Scholar] [CrossRef] [PubMed]
  38. Florine, S.E.; Moore, K.J.; Fales, S.L.; White, T.A.; Burras, C.L. Yield and composition of herbaceous biomass harvested from naturalized grassland in southern Iowa. Biomass Bioenergy 2006, 30, 522–528. [Google Scholar] [CrossRef]
  39. Mani, S.; Tabil, L.G.; Sokhansanj, S. Grinding performance and physical properties of wheat and barley straws, corn stover and switchgrass. Biomass Bioenergy 2004, 27, 339–352. [Google Scholar] [CrossRef]
  40. Iqbal, Y.; Gauder, M.; Claupein, W.; Graeff-Hönninger, S.; Lewandowski, I. Yield and quality development comparison between miscanthus and switchgrass over a period of 10 years. Energy 2015, 89, 268–276. [Google Scholar] [CrossRef]
  41. Mulkey, V.R.; Owens, V.N.; Lee, D.K. Management of switchgrass-dominated conservation reserve program lands for biomass production in South Dakota. Crop Sci. 2006, 46, 712–720. [Google Scholar] [CrossRef]
  42. Lemus, R.; Brummer, E.C.; Burras, C.L.; Moore, K.J.; Barker, M.F.; Molstad, N.E. Effects of nitrogen fertilization on biomass yield and quality in large fields of established switchgrass in southern Iowa, USA. Biomass Bioenergy 2008, 32, 1187–1194. [Google Scholar] [CrossRef] [Green Version]
  43. Mohammed, Y.A.; Raun, W.; Kakani, G.; Zhang, H.; Taylor, R.; Desta, K.G.; Jared, C.; Mullock, J.; Bushong, J.; Sutradhar, A.; et al. Nutrient sources and harvesting frequency on quality biomass production of switchgrass (Panicum virgatum L.) for biofuel. Biomass Bioenergy 2015, 81, 242–248. [Google Scholar] [CrossRef]
  44. Seepaul, R.; Macoon, B.; Reddy, K.R.; Evans, W.B. First harvest timing and nitrogen application rate effects on chemical composition and ethanol yield of switchgrass. Crop Forage Turfgrass Manag. 2016, 2, 1–16. [Google Scholar] [CrossRef]
  45. Tang, C.C.; Han, L.P.; Xie, G.H. Response of switchgrass grown for forage and bioethanol to nitrogen, phosphorus, and potassium on semiarid marginal land. Agronomy 2020, 10, 1147. [Google Scholar] [CrossRef]
  46. Lee, M.S.; Urgun-Demirtas, M.; Shen, Y.; Zumpf, C.; Anderson, E.K.; Rayburn, A.L.; Lee, D.K. Effect of digestate and digestate supplemented with biochar on switchgrass growth and chemical composition. Biomass Bioenergy 2021, 144, 105928. [Google Scholar] [CrossRef]
  47. Saidur, R.; Atabani, A.E.; Mekhilef, S. A review on electrical and thermal energy for industries. Renew. Sustain. Energy Rev. 2011, 15, 2073–2086. [Google Scholar] [CrossRef]
  48. Saidur, R.; Abdelaziz, E.A.; Demirbas, A.; Hossain, M.S.; Mekhilef, S. A review on biomass as a fuel for boilers. Renew. Sustain. Energy Rev. 2011, 15, 2262–2289. [Google Scholar] [CrossRef]
  49. Amaleviciute, K.; Slepetiene, A.; Butkute, B. Methane yield of perennial grasses as affected by the chemical composition of their biomass. Zemdirbyste 2020, 107, 243–248. [Google Scholar] [CrossRef]
  50. Ayuso, M.; Hernández, T.; García, C.; Pascual, J.A. Stimulation of barley growth and nutrient absorption by humic substances originating from various organic materials. Bioresour. Technol. 1996, 5, 251–257. [Google Scholar] [CrossRef]
  51. Eyheraguibel, B.; Silvestre, J.; Morard, P. Effects of humic substances derived from organic waste enhancement on the growth and mineral nutrition of maize. Bioresour. Technol. 2008, 99, 4206–4212. [Google Scholar] [CrossRef] [Green Version]
  52. Loffredo, E.; Senesi, N. In vitro and in vivo assessment of the potential of compost and its humic acid fraction to protect ornamental plants from soil-borne pathogenic fungi. Sci. Hortic. 2009, 122, 432–439. [Google Scholar] [CrossRef]
  53. Tóth, Š.; Šoltysová, B.; Danilovič, M.; Kováč, L.; Hnát, A.; Kotorová, D.; Šariková, D.; Jakubová, J.; Balla, P.; Štyriak, I.; et al. The Meaning and Effect of Different Types of Soil Improvers in Conditions of Different Soil Management Practice, 1st ed.; Centrum Výskumu Rastlinnej Výroby Piešťany: Michalovce, Slovakia, 2013; p. 108. ISBN 978-80-89417-46-9. (In Slovak) [Google Scholar]
  54. Tóth, Š.; Rysak, W.; Šoltysová, B.; Karahuta, J. Effect of soil conditioner based on humic acids HUMAC Agro on soil and yield and sugar content of sugar beet in context of selected indicators of agriculture system sustainability. Listy Cukrov. Reparske 2015, 131, 53–58. [Google Scholar]
  55. Tóth, Š.; Szanyi, G.; Vančo, P.; Schubert, J.; Porvaz, P.; Bujňák, P.; Šoltysova, B.; Danielovič, I. The influence of mineral nutrition and humic acids on the intensity of photosynthesis, as well as the yield and quality of seeds, roots, and aboveground phytomass of milk thistle Silybum marianum (L.) Gaertn. in marginal growing conditions. Eur. Pharm. J. 2022, 69, 27–36. [Google Scholar] [CrossRef]
  56. Tóth, Š. Ligno-cellulose quality and calorific value of Elymus elongatus L. and the novel Secale cereanum tested under central european conditions. Agriculture 2022, 68, 155–175. [Google Scholar] [CrossRef]
Figure 1. Fiber extractor—Fibertest (a,c) and calorimetric system IKA C 5000 (b,d) captured during the analyses.
Agronomy 13 01854 g001
Figure 2. Minimum, maximum, and average values of quality indicators—quality content, in % or kJ g−1 (a), and quality yield, in Mg ha-1 or hGJ ha−1 (b); according to cultivars EG 1101 (H1), BO Master (BO), EG 1102 (H3), Kanlow (K), Alamo (A), Carthage (C), and NJ Ecotype (NJ).
Agronomy 13 01854 g002
Figure 3. Box plot for quality content (a) and quality yield (b). The ligno-cellulose indicators (ADF and NDF) and calorific value (HHV) according to treatments HA, NPK, and UC, display the minimum, first quartile, median, mean, third quartile, and maximum. The letters a b, and c indicate homogeneous groups according to the ANOVA procedure for main effects at 0.05 significance level.
Agronomy 13 01854 g003
Figure 4. Logarithmic dependence of quality content on plant height (a), dry matter yield (b), and dry matter content at harvest (c), and linear dependence of quality yield on plant height (d), dry matter yield (e) and dry matter content at harvest (f), according to ligno-cellulose (ADF and NDF) and calorific value (HHV) indicators.
Agronomy 13 01854 g004
Table 1. Parameters of statistical analyses of variance for main effects for data set of quality content.
Main SourceADFADLCEHEMNDFHHV
IOF-Ratiop-ValueIOF-Ratiop-ValueIOF-Ratiop-ValueIOF-Ratiop-ValueIOF-Ratiop-ValueIOF-Ratiop-Value
Cultivars149.630.0000117.630.0000170.540.0000110.650.000030.980.4438112.440.0000
Years28.850.000322.540.084125.510.208023.700.0265157.230.000028.340.0005
Nutrition31.480.194531.300.267231.440.000030.250.957222.550.0839310.090.0000
IO—impact order, an order based on F-ratio; ADF and HHV—indicators of ligno-cellulose quality and calorific value.
Table 2. Parameters of statistical analyses of variance for main effects for data set of quality harvested.
Main SourceADFADLCEHEMNDFHHV
IOF-Ratiop-ValueIOF-Ratiop-ValueIOF-Ratiop-ValueIOF-Ratiop-ValueIOF-Ratiop-ValueIOF-Ratiop-Value
Cultivars123.390.0000122.180.0000123.460.0000124.480.0000312.620.0000312.860.0000
Years217.050.0000218.320.0000216.590.0000217.240.0000124.010.0000217.680.0000
Nutrition312.320.0000311.500.0000312.380.0000312.800.0000217.280.0000124.130.0000
IO—impact order, an order based on F-ratio; ADF and HHV—indicators of ligno-cellulose quality and calorific value.
Table 3. Homogenous groups (H) and parameters of statistical analyses of variance for data set of quality content within levels of main effects, quality indicators in % (ADF, ADL, CE, HEM, and NDF) or in J g−1 (HHV).
Main SourceADFADLCEHEMNDFHHV
HLS MeanLS SigmaHLS MeanLS SigmaHLS MeanLS SigmaHLS MeanLS SigmaHLS MeanLS SigmaHLS MeanLS Sigma
cultivars
EG 1101a44.4110.6617b8.9410.3000a35.4690.6467a30.9030.7313a75.3150.7406ab17,30941.88
BO Masterab44.0150.6617ab9.1230.3000ab34.8910.6467a29.9640.7313a73.9780.7406bc17,23141.88
EG 1102b42.4240.6617ab9.1690.3000c32.2550.6467a30.9030.7313a73.3270.7406b17,26241.88
Kanlowa44.3030.6617ab9.4530.3000ab34.8500.6467a30.0920.7313a74.3960.7406cd17,16041.88
Alamoab43.4010.6617ab9.2170.3000ab34.1840.6467a30.5710.7313a73.9710.7406d17,04241.88
Carthageab44.1440.6617b8.7590.3000a35.3850.6467a30.6110.7313a74.7550.7406d17,04441.88
NJ Ecotypea44.8850.6617a9.8060.3000a35.0790.6467a30.3840.7313a75.2680.7406a17,39841.88
years
2018c37.0360.5759a10.4230.2535c26.5120.5466b29.3290.6181c66.3650.6259c17,04335.40
2019a46.0520.5759a10.1940.2535b35.8580.5466b29.1260.6181b75.1780.6259b17,24435.40
2020a46.1510.5759b8.9230.2535ab37.2280.5466b28.7200.6181b74.8710.6259b17,18635.40
2021a46.1620.5759bc8.5590.2535a37.6030.5466a32.0450.6181a78.2070.6259a17,38735.40
2022b44.3010.5759c7.950.2535ab36.3510.5466a33.2310.6181a77.5310.6259b17,17235.40
nutrition
HAa44.3900.4332a9.4170.1964a34.9740.4234b29.6190.4788ab74.0100.4848b17,18227.42
NPKa44.9440.4332ab9.3630.1964a35.5800.4234ab30.3790.4788a75.3230.4848a17,29527.42
UCb42.4870.4332b8.8490.1964b33.6370.4234a31.4710.4788b73.9580.4848b17,14327.42
H—homogenous group (ANOVA used to determine which means were significantly different at the statistical 95.0% confidence level, P = 0.05); HA, NPK, and UC—the nutrition treatments. The letters a b c, and d indicate homogeneous groups according to the ANOVA procedure for main effects at 0.05 significance level.
Table 4. Homogenous groups (H) and parameters of statistical analyses of variance for data set of quality yield within levels of main effects; quality indicators in Mg ha−1 (ADF, ADL, CE, HEM, and NDF) or in GJ ha−1 (HHV).
Main SourceADFADLCEHEMNDFHHV
HLS MeanLS SigmaHLS MeanLS SigmaHLS MeanLS SigmaHLS MeanLS SigmaHLS MeanLS SigmaHLS MeanLS Sigma
cultivars
EG 1101a9.8280.8171a1.8120.1503a8.0160.6676a6.5940.5366a16.4221.3474a367.8929.891
BO Masterb5.7750.8171b1.0730.1503b4.7020.6676b3.8720.5366b9.6471.3474b216.1829.891
EG 1102bc3.7070.8171bc0.7570.1503bc2.9500.6676bc2.4850.5366bc6.1911.3474bc141.0529.891
Kanlowbcd3.5980.8171bcd0.6950.1503bcd2.9030.6676cd2.3350.5366bcd5.9331.3474bcd133.4229.891
Alamocd2.8720.8171cd0.5610.1503cd2.3120.6676cd1.9830.5366cd4.8561.3474cd108.6729.891
Carthagecd2.0360.8171cd0.3890.1503cd1.6470.6676cd1.3830.5366cd3.4191.3474cd76.6229.891
NJ Ecotyped1.3460.8171d0.2720.1503d1.0740.6676d0.9070.5366d2.2531.3474d50.4229.891
years
2018d0.1450.6906d0.0430.1293d0.1010.5642d0.1090.4535d0.2541.1388d6.8425.262
2019c2.5900.6906c0.5700.1293d0.2020.5642c1.5410.4535c4.1321.1388c93.5225.262
2020b5.7060.6906b1.0880.1293b4.6180.5642b3.7220.4535b9.4281.1388b214.7125.262
2021a8.9670.6906a1.6600.1293a7.3070.5642a6.0270.4535a14.9941.1388a333.4225.262
2022c3.4220.6906c0.6090.1293c2.8130.5642bc2.5710.4535c5.9931.1388c133.1325.262
nutrition
HAa6.3140.5349a1.2080.1002a5.1060.4370a4.2090.3513a10.5240.8821a236.8219.568
NPKb4.2840.5349b0.8230.1002b3.4600.4370b2.8780.3513b7.1610.8821b159.7819.568
UCc1.9010.5349c0.3520.1002c1.5490.4370c1.2950.3513c3.1960.8821c72.3719.568
H—homogenous group (ANOVA used to determine which means were significantly different at the statistical 95.0% confidence level, P = 0.05; HA, NPK, and UC—the nutrition treatments. The letters a b c, and d indicate homogeneous groups according to the ANOVA procedure for main effects at 0.05 significance level.
Disclaimer/Publisher’s Note: The statements, opinions and data contained in all publications are solely those of the individual author(s) and contributor(s) and not of MDPI and/or the editor(s). MDPI and/or the editor(s) disclaim responsibility for any injury to people or property resulting from any ideas, methods, instructions or products referred to in the content.

