
Drought-Induced Morpho-Physiological, Biochemical, Metabolite Responses and Protein Profiling of Chickpea (Cicer arietinum L.)
 ,
,  ,
,  , ,
, , 
Abstract
1. Introduction
2. Materials and Methods
2.1. Site Description
2.2. Experimental Design and Treatments
2.3. Seed Sowing and Seedling Growth
2.4. Drought Stress Application and Management
2.5. Varieties and Drought Treatments
2.6. Sample Collection
2.7. Morphological Parameters
2.8. Physiological Parameters
2.8.1. Relative Water Content (RWC) (%)
2.8.2. Electrolyte Leakage (EL) (%)
2.8.3. Chlorophyll Content
2.9. Biochemical Parameters
2.9.1. Proline
2.9.2. Total Sugar
2.9.3. Glycine Betaine Content
2.9.4. Enzyme Assays
Superoxide Dismutase (SOD) (EC 1.15.1.1)
Catalase (CAT) (EC 1.11.1.6)
Ascorbate Peroxidase (APX) (EC 1.11.1.11)
Glutathione Reductase (GR) (EC 1.6.4.2)
2.10. Metabolite Analysis
2.10.1. Lipid Peroxidation
2.10.2. Total Anthocyanin
2.10.3. Phenolic Content
2.10.4. Flavanoid Content
2.10.5. Carotenoid Content
2.11. Protein Profiling
SDS-PAGE
2.12. Statistical Analysis
3. Results
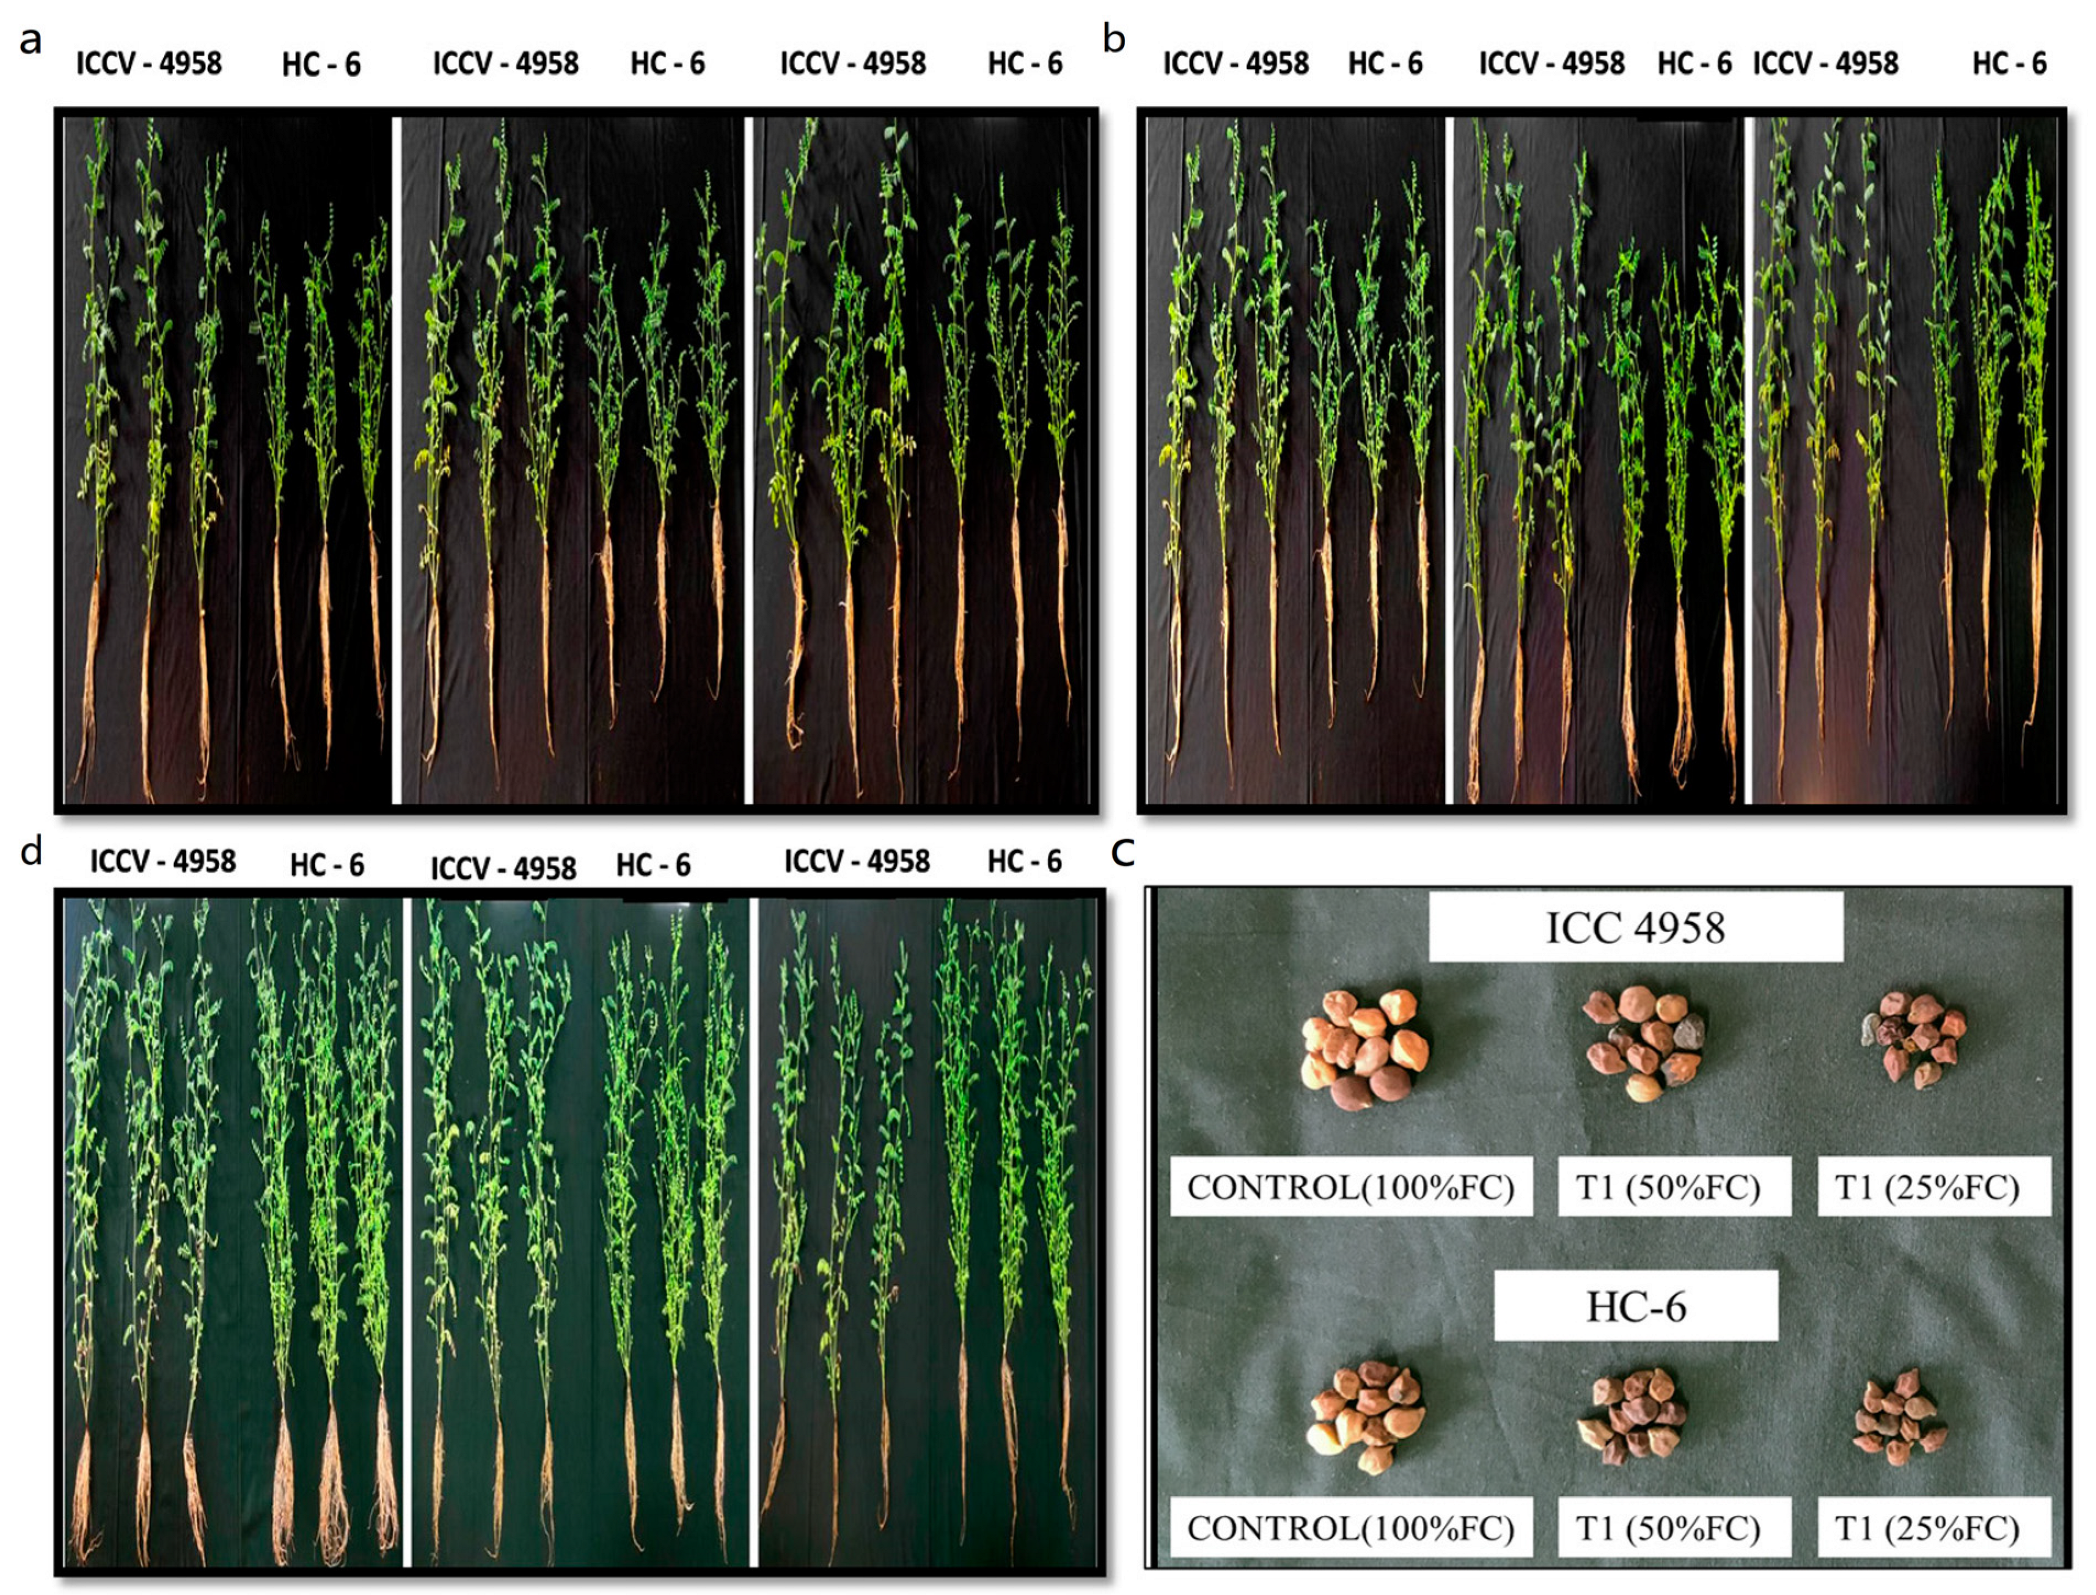
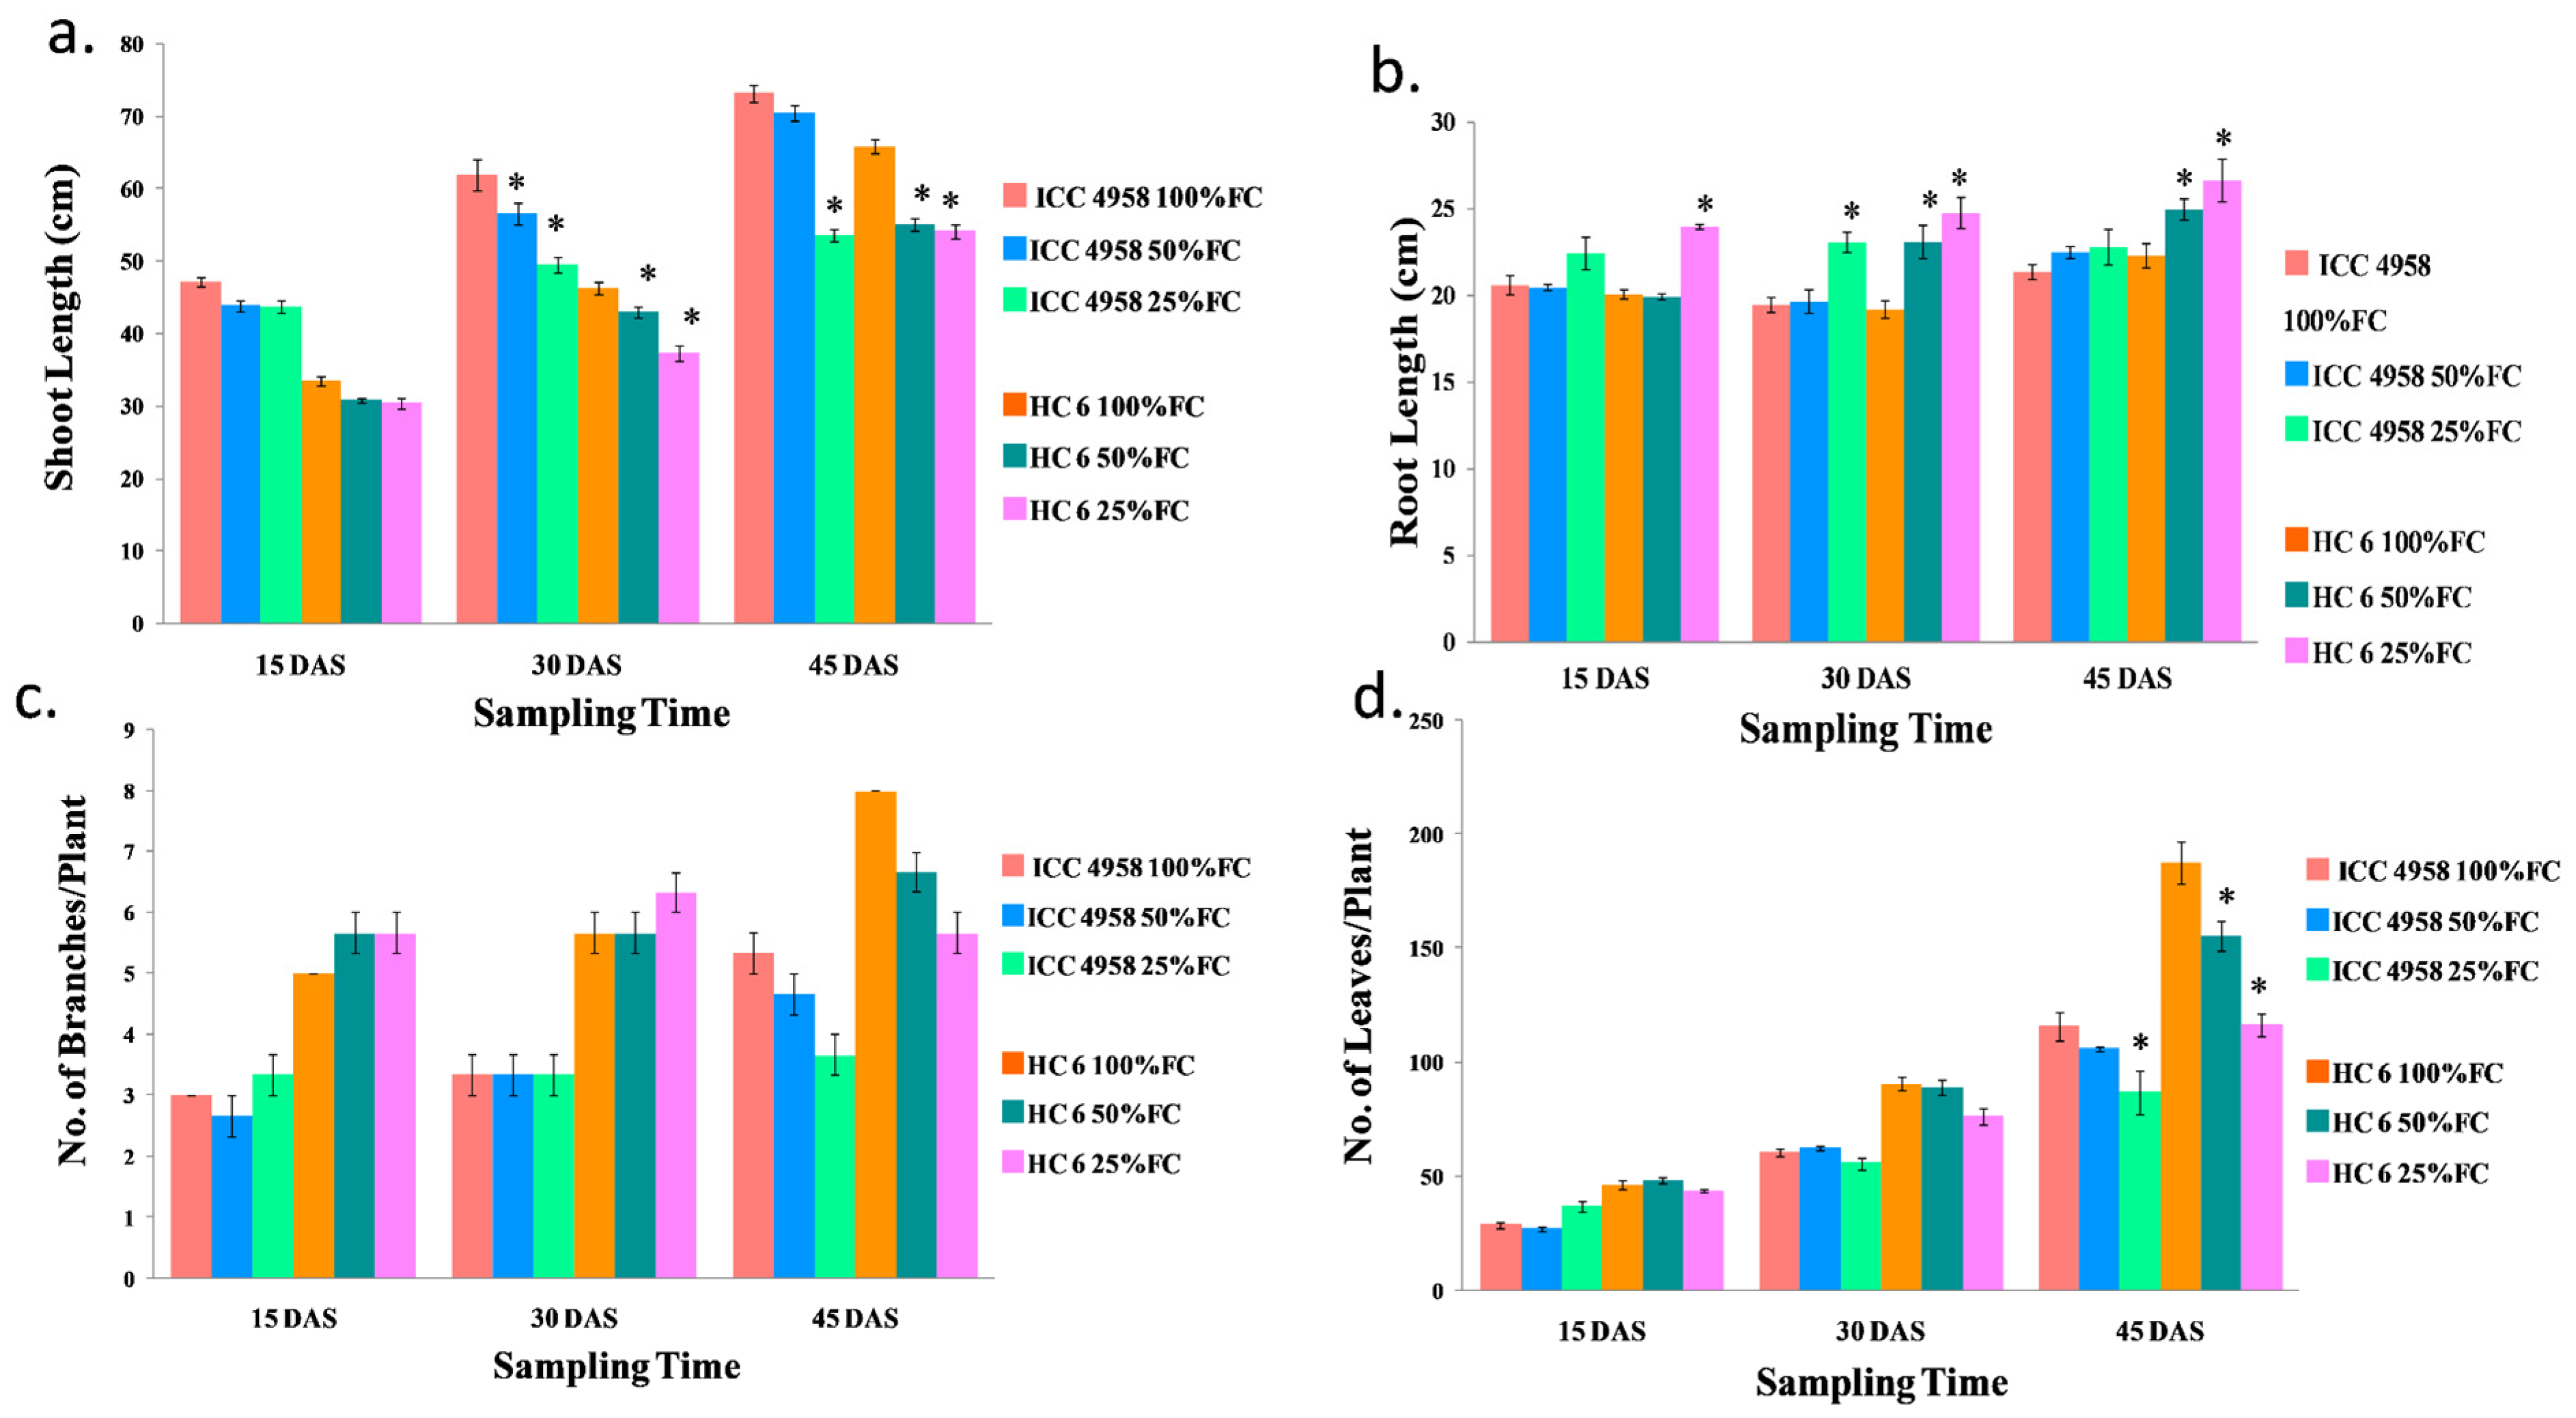
3.1. Morphological Parameters
3.1.1. Shoot Length
3.1.2. Root Length
3.1.3. Number of Branches/Plant
3.1.4. Number of Leaves/Plant
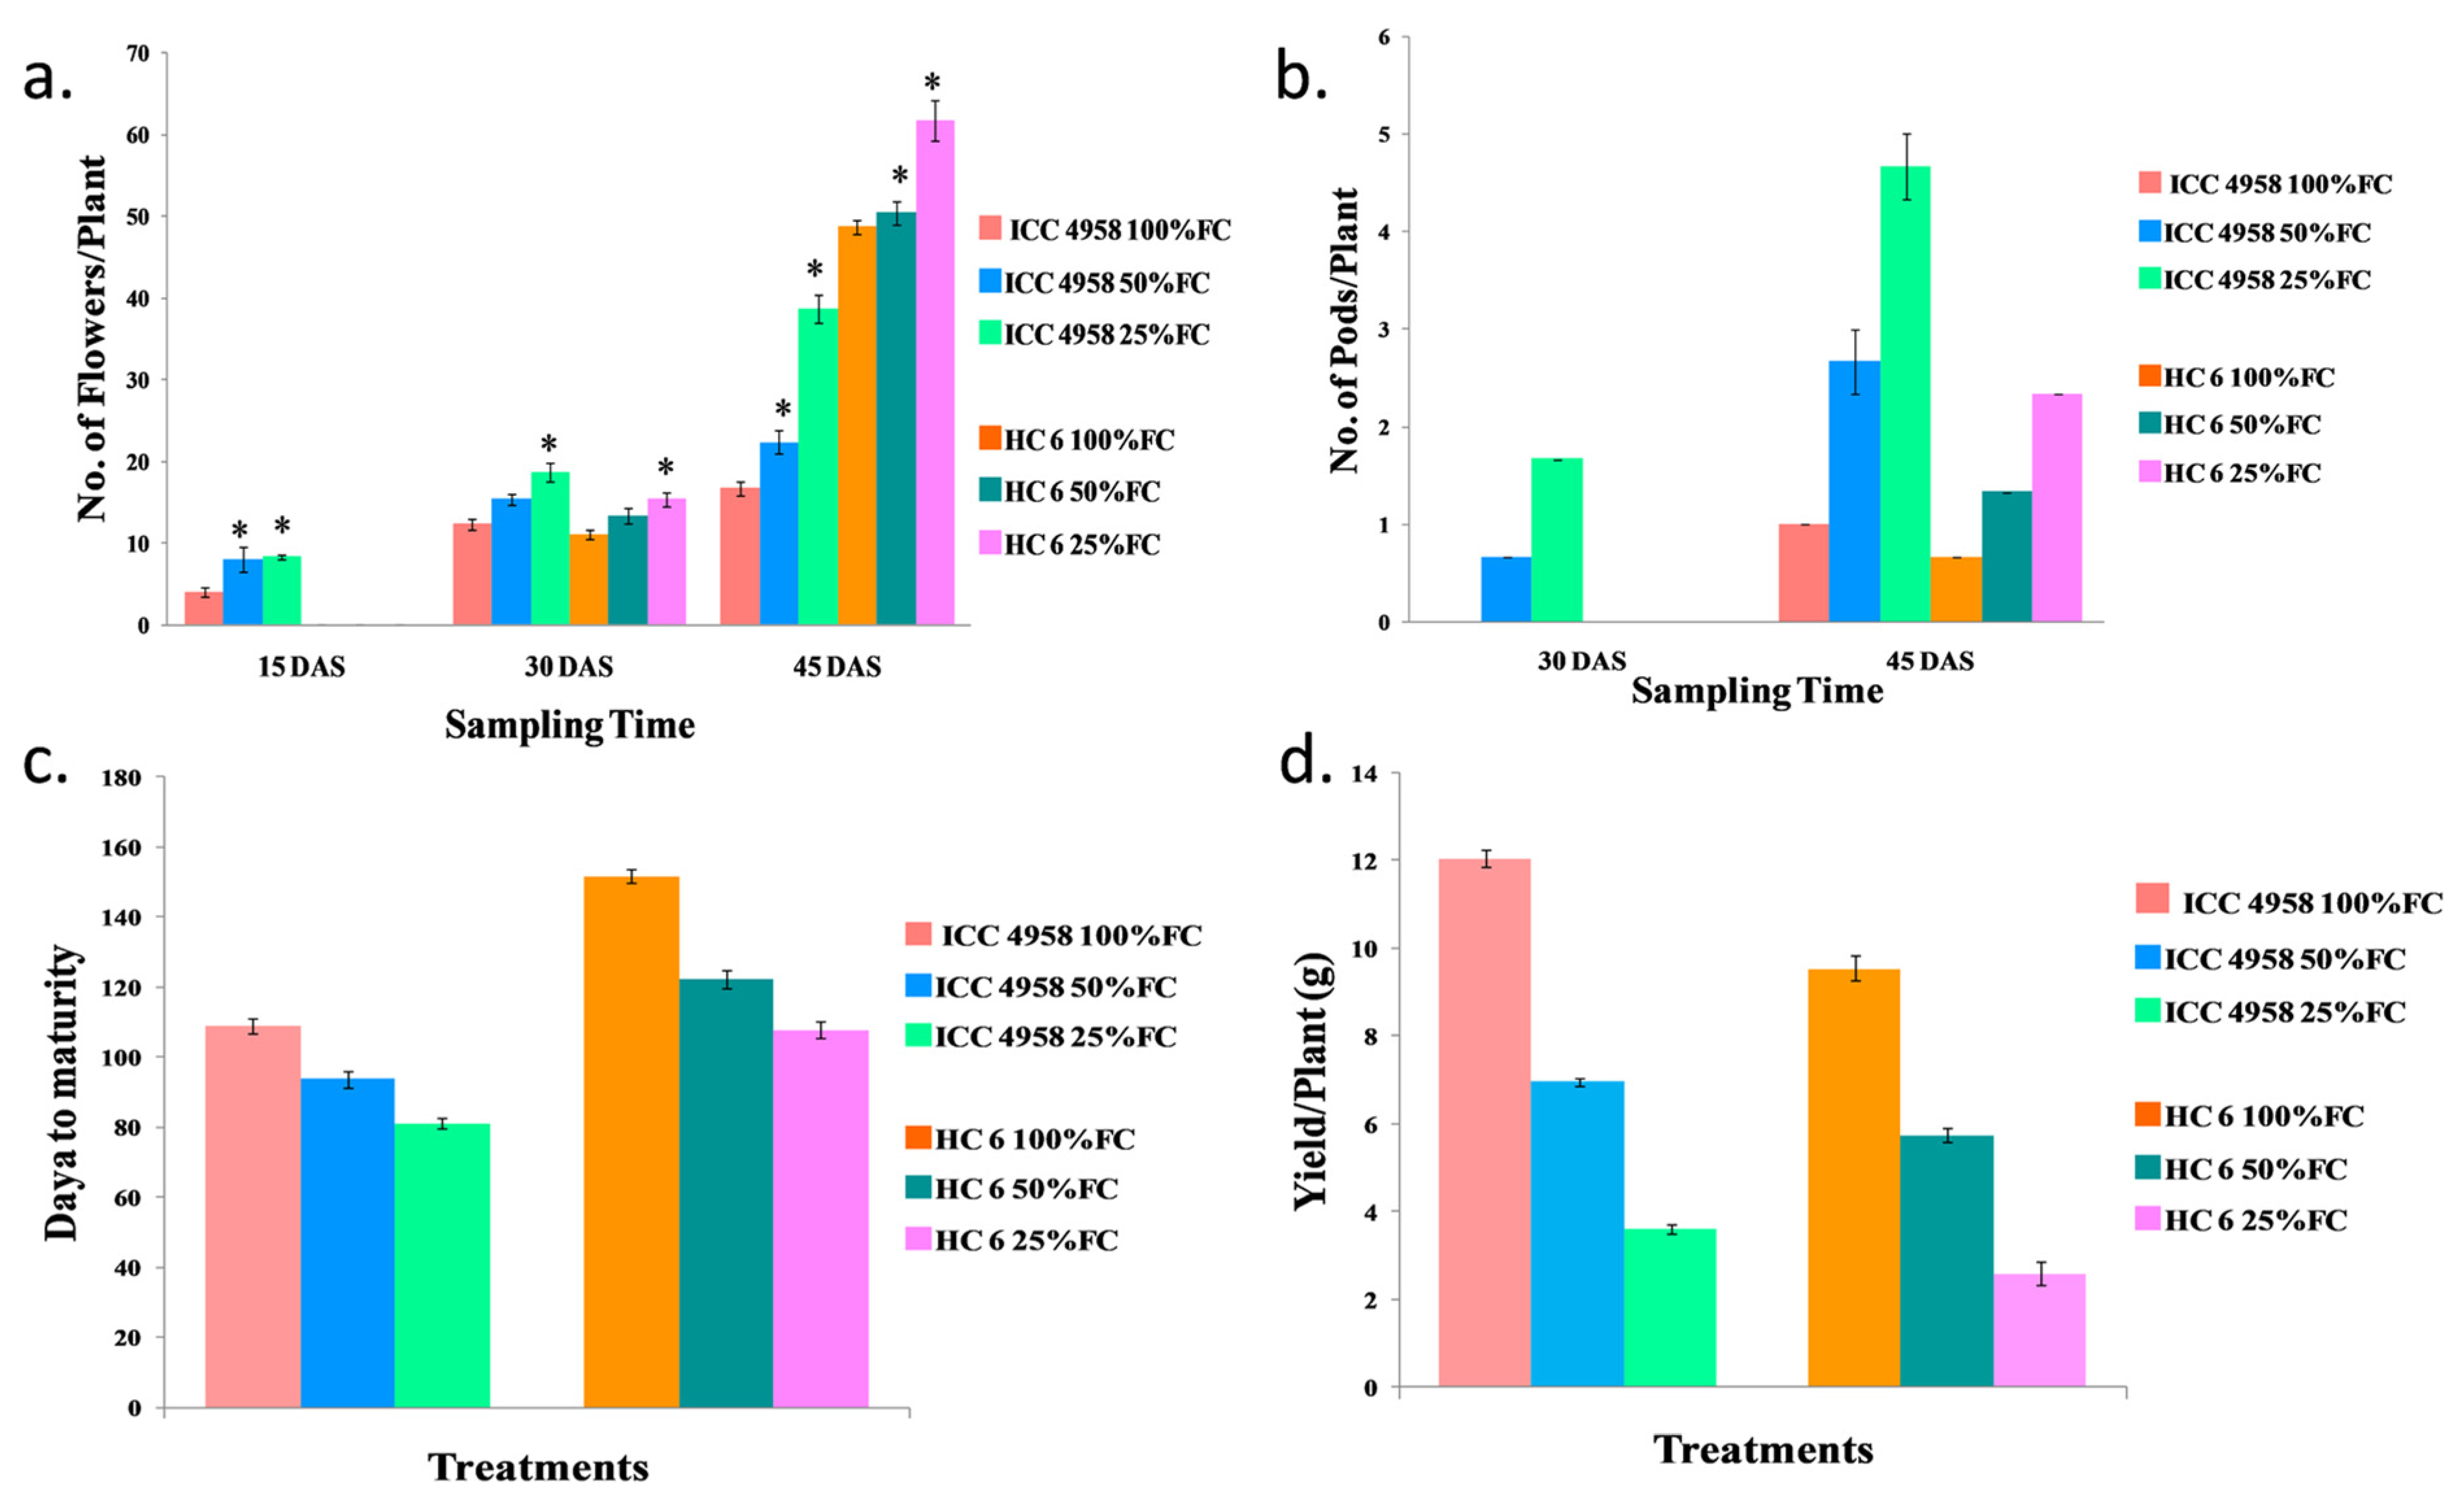
3.1.5. Number of Flowers/Plant
3.1.6. Number of Pods/Plant
3.1.7. Days to Maturity
3.1.8. Yield/Plant (g)
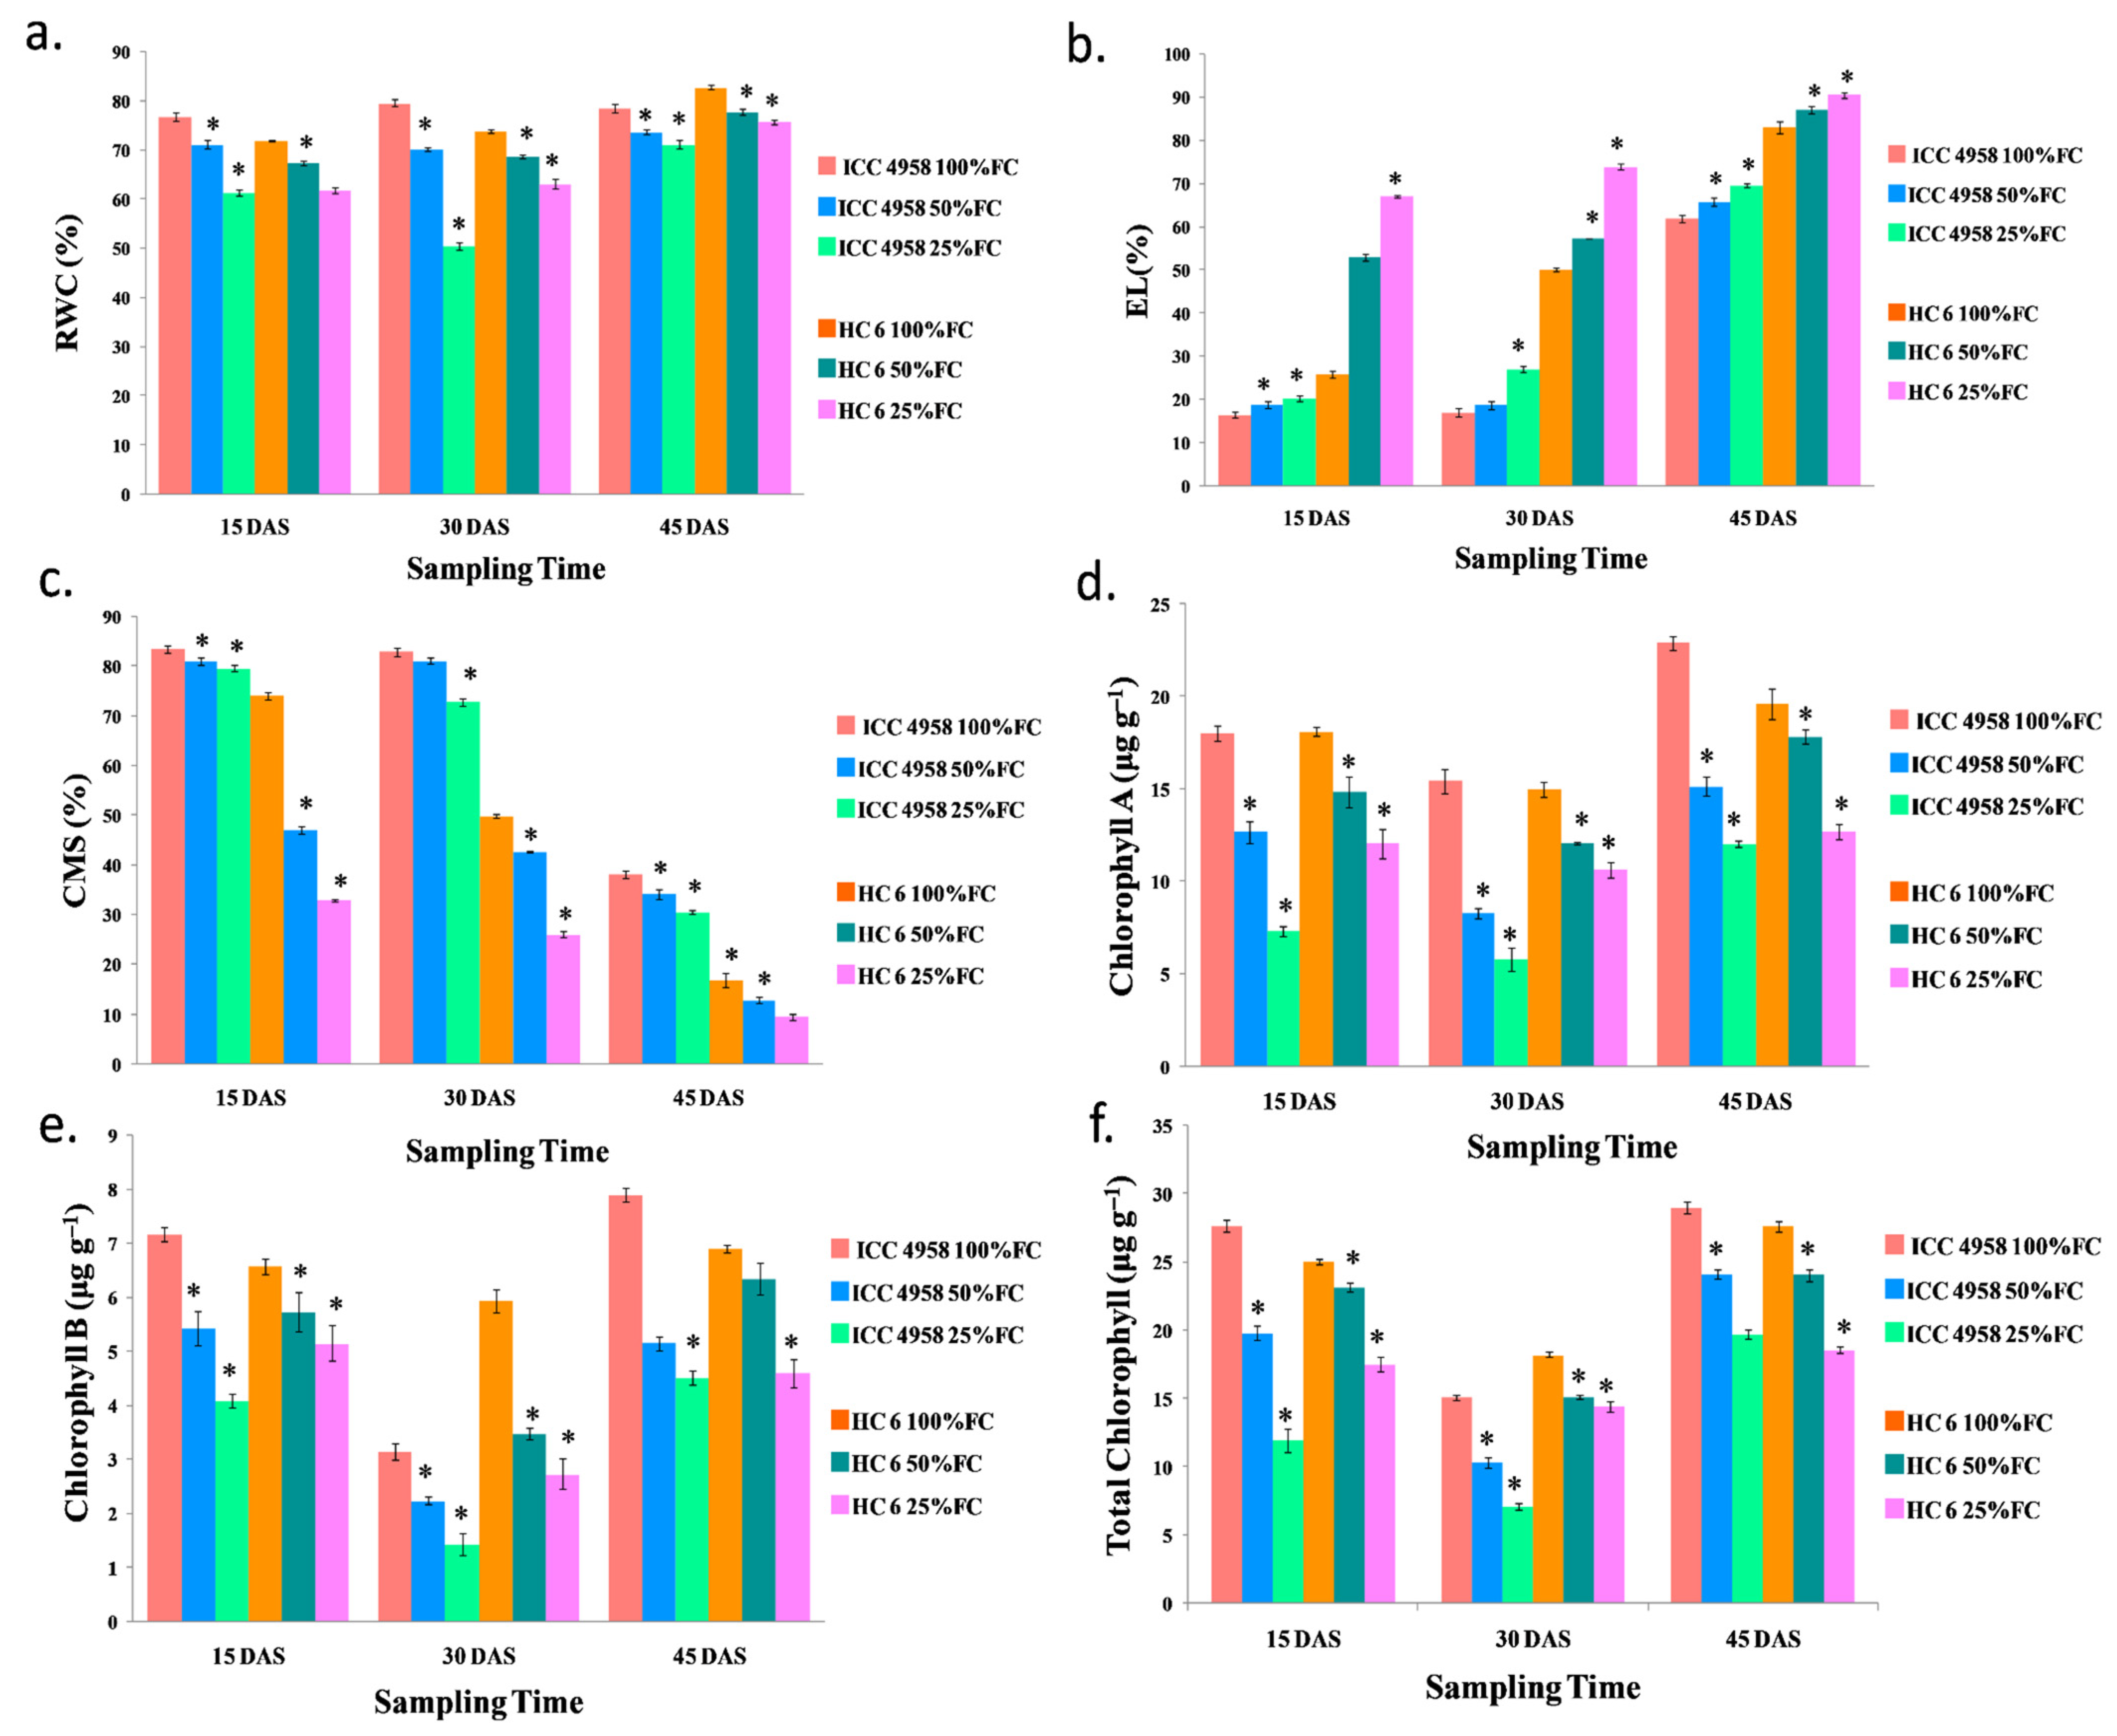
3.2. Physiological Parameters
3.2.1. Relative Water Content (RWC)
3.2.2. Electrolyte Leakage (EL)
3.2.3. Cell Membrane Stability (CMS)
3.2.4. Chlorophyll
Chlorophyll A
Chlorophyll B
Total Chlorophyll
3.3. Biochemical Parameters
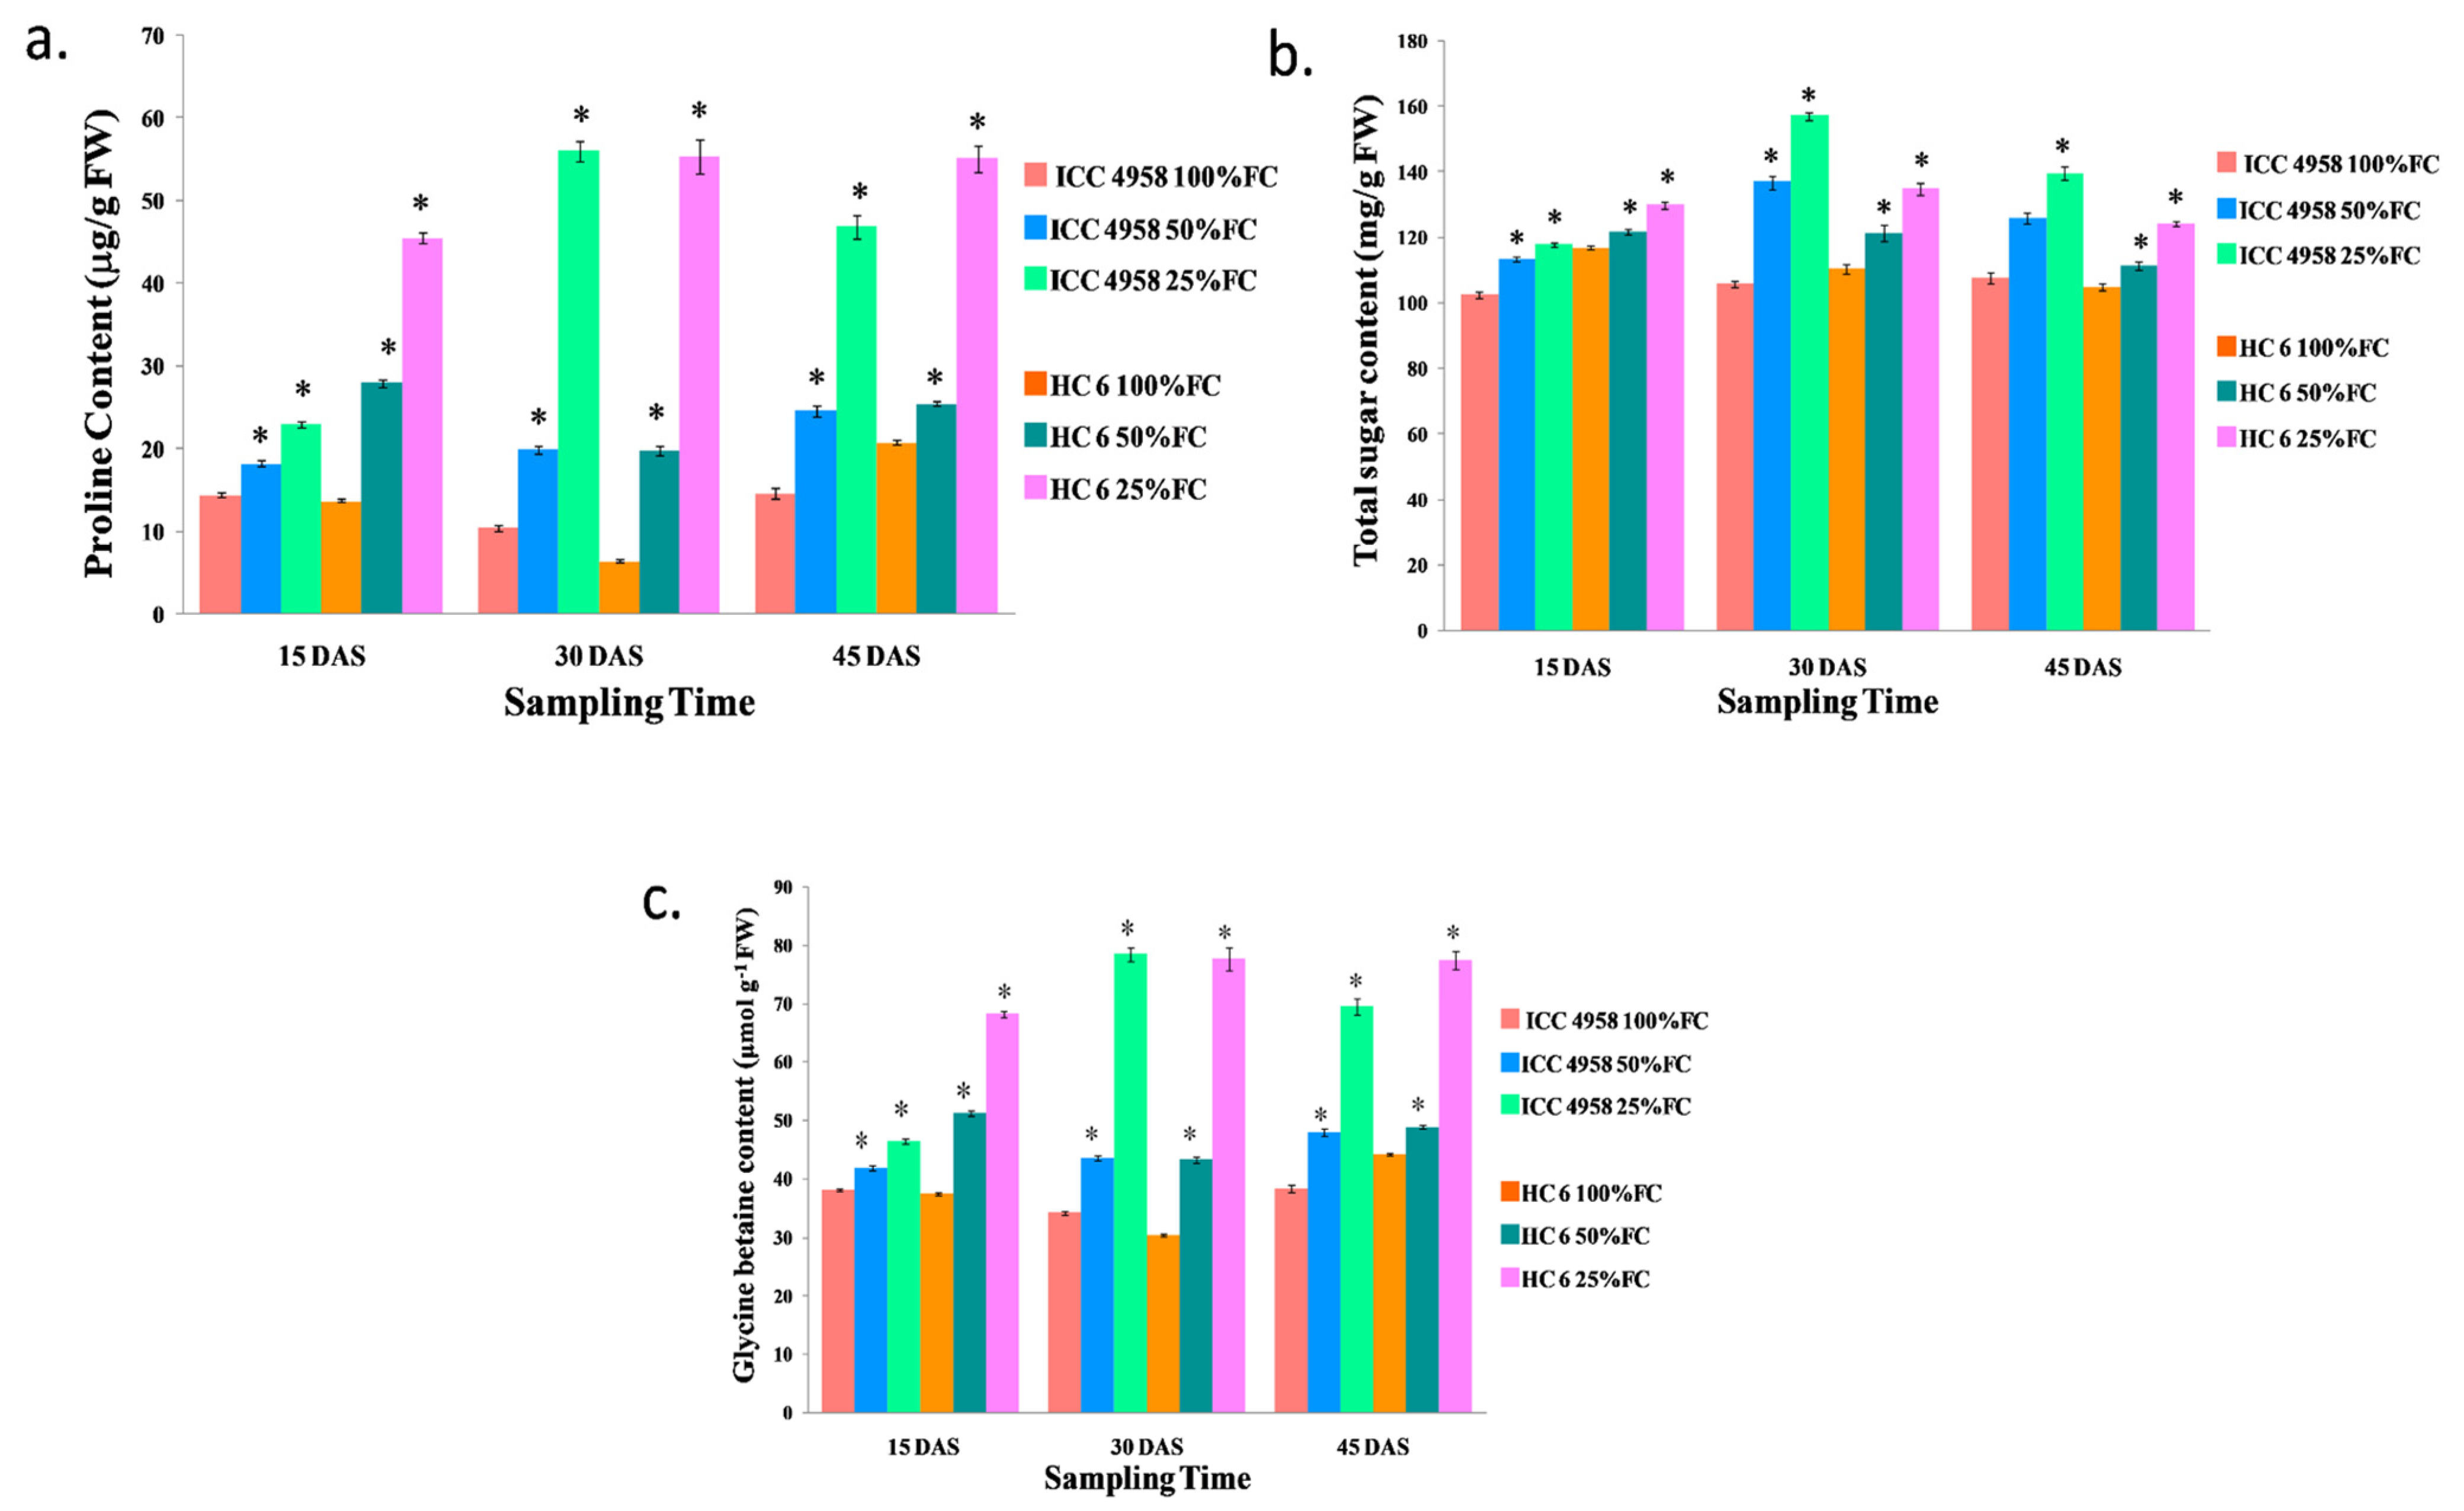
3.3.1. Proline
3.3.2. Total Sugar
3.3.3. Glycine Betaine
3.3.4. Enzyme Activity
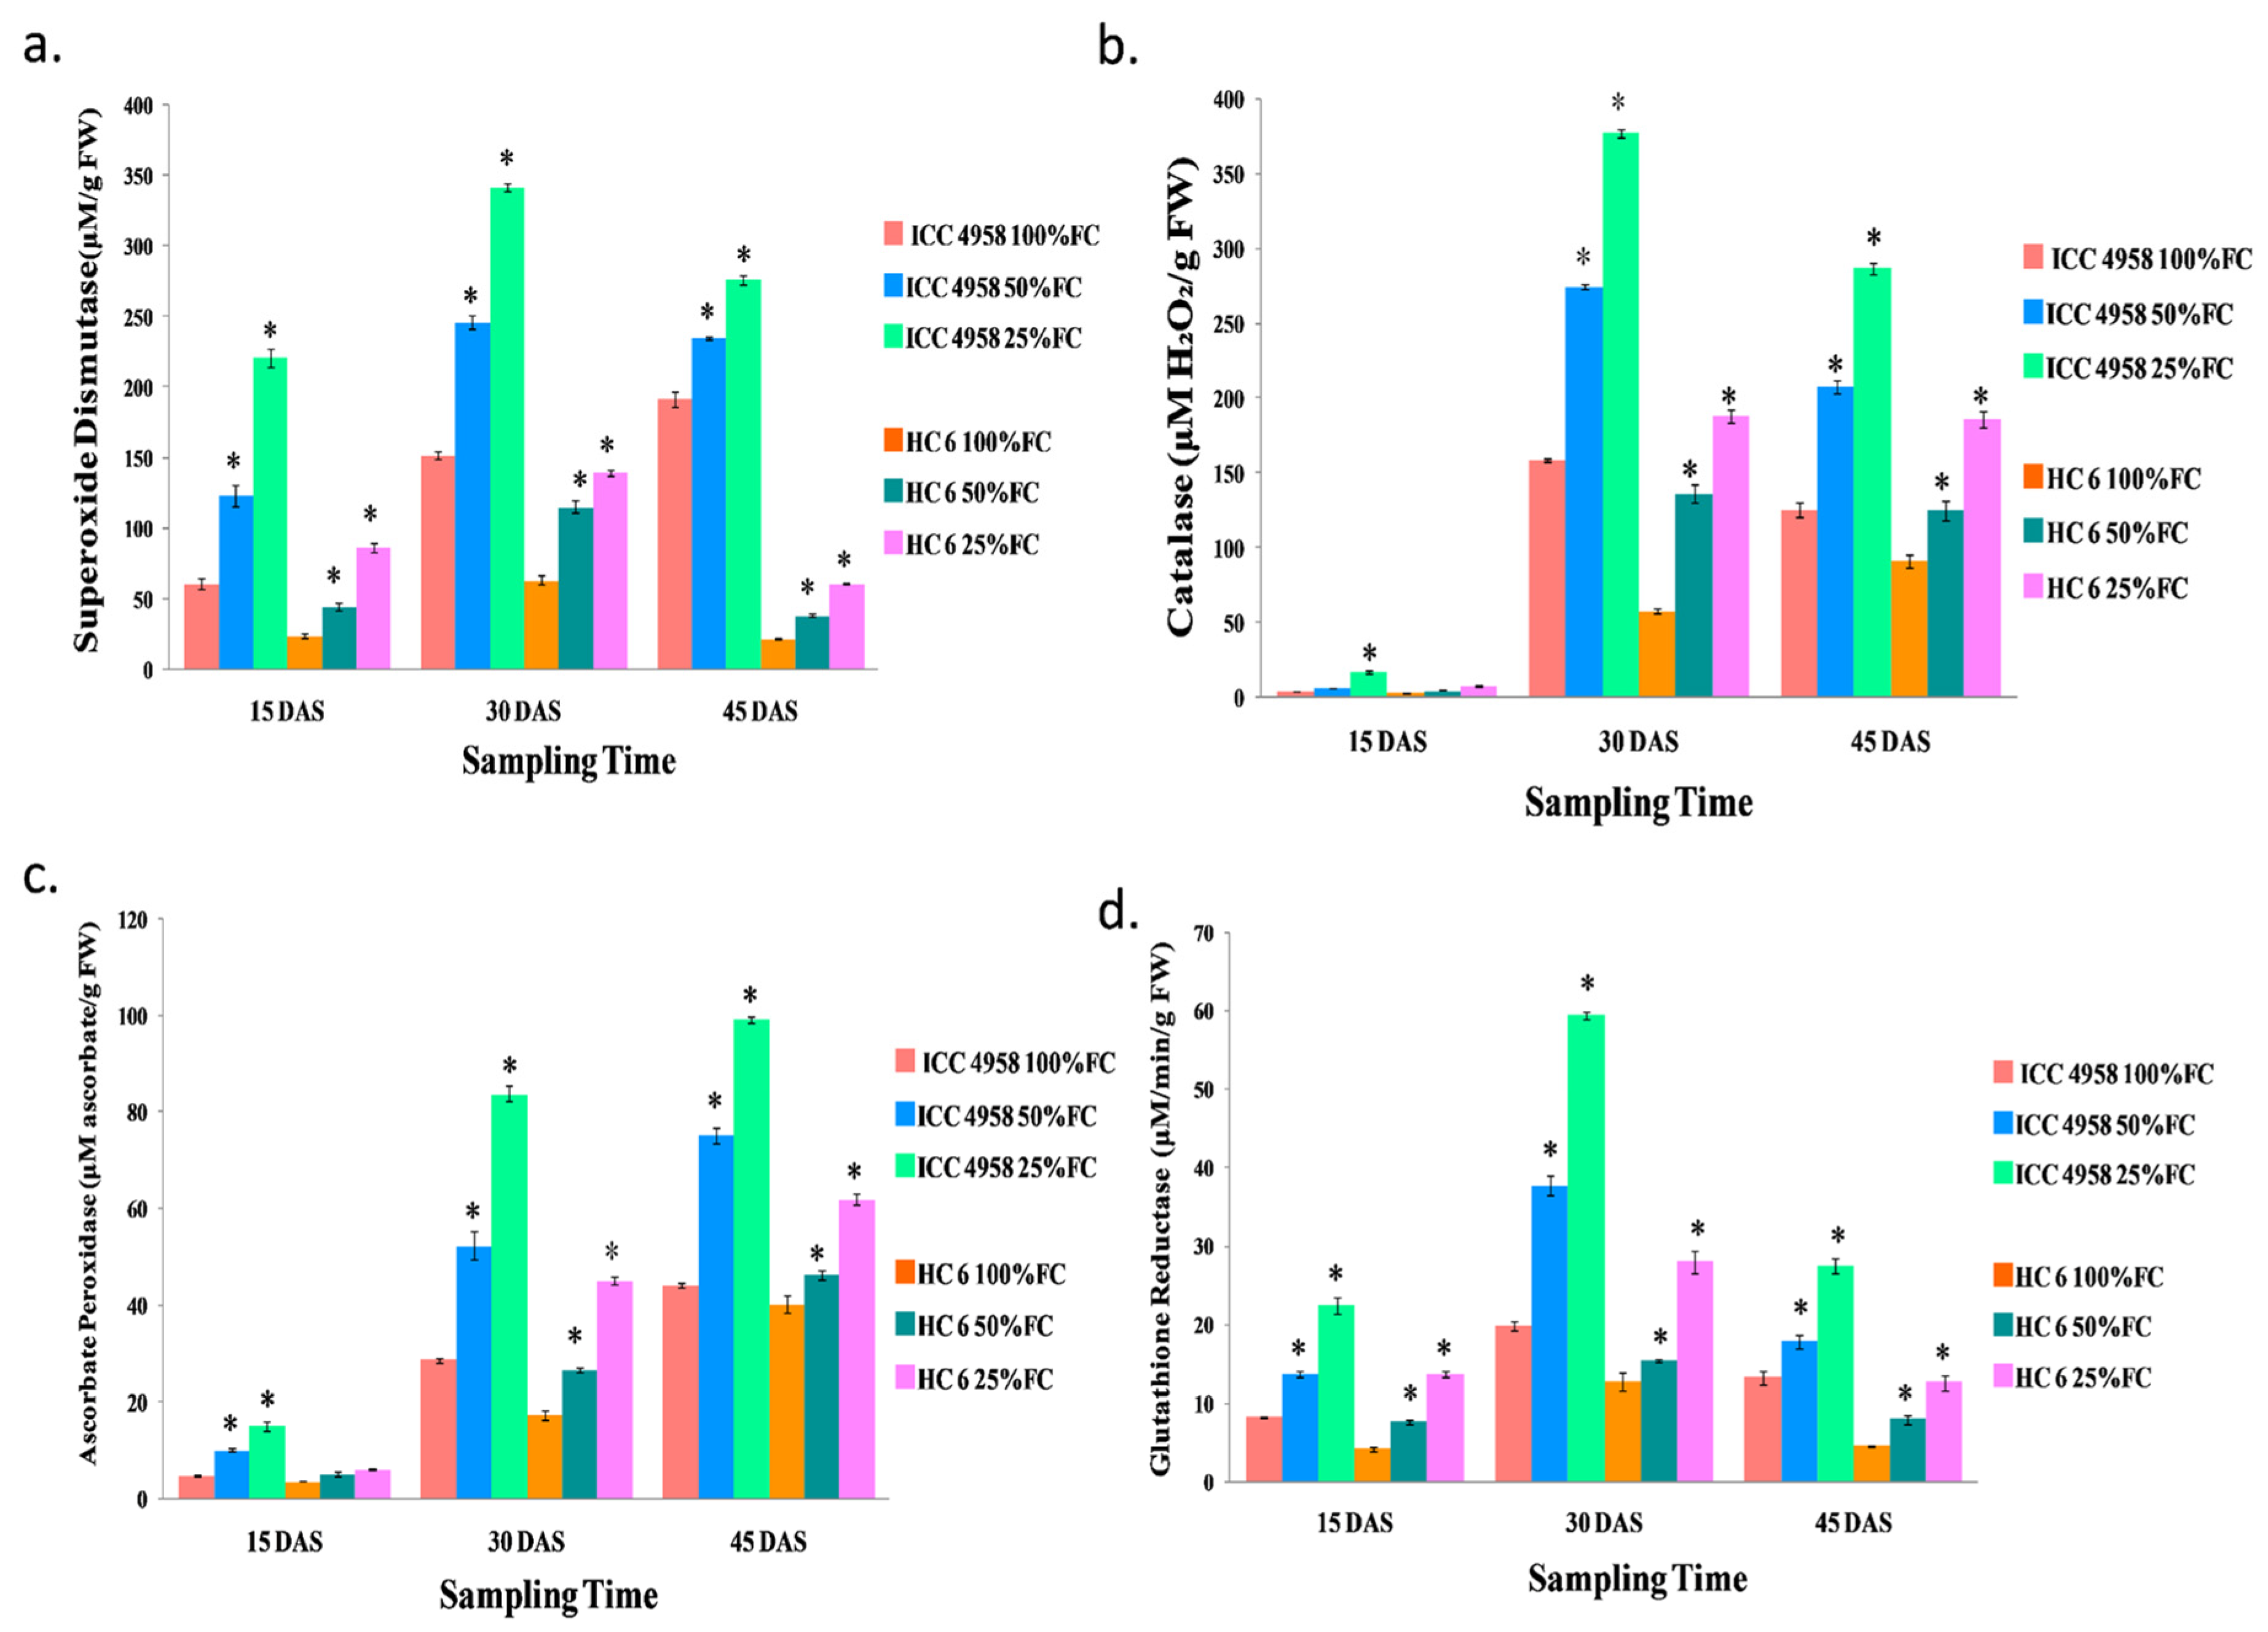
Superoxide Dismutase (SOD)
Catalase (CAT)
Ascorbate Peroxidase (APX)
Glutathione Reductase (GR)
3.4. Metabolite Analysis
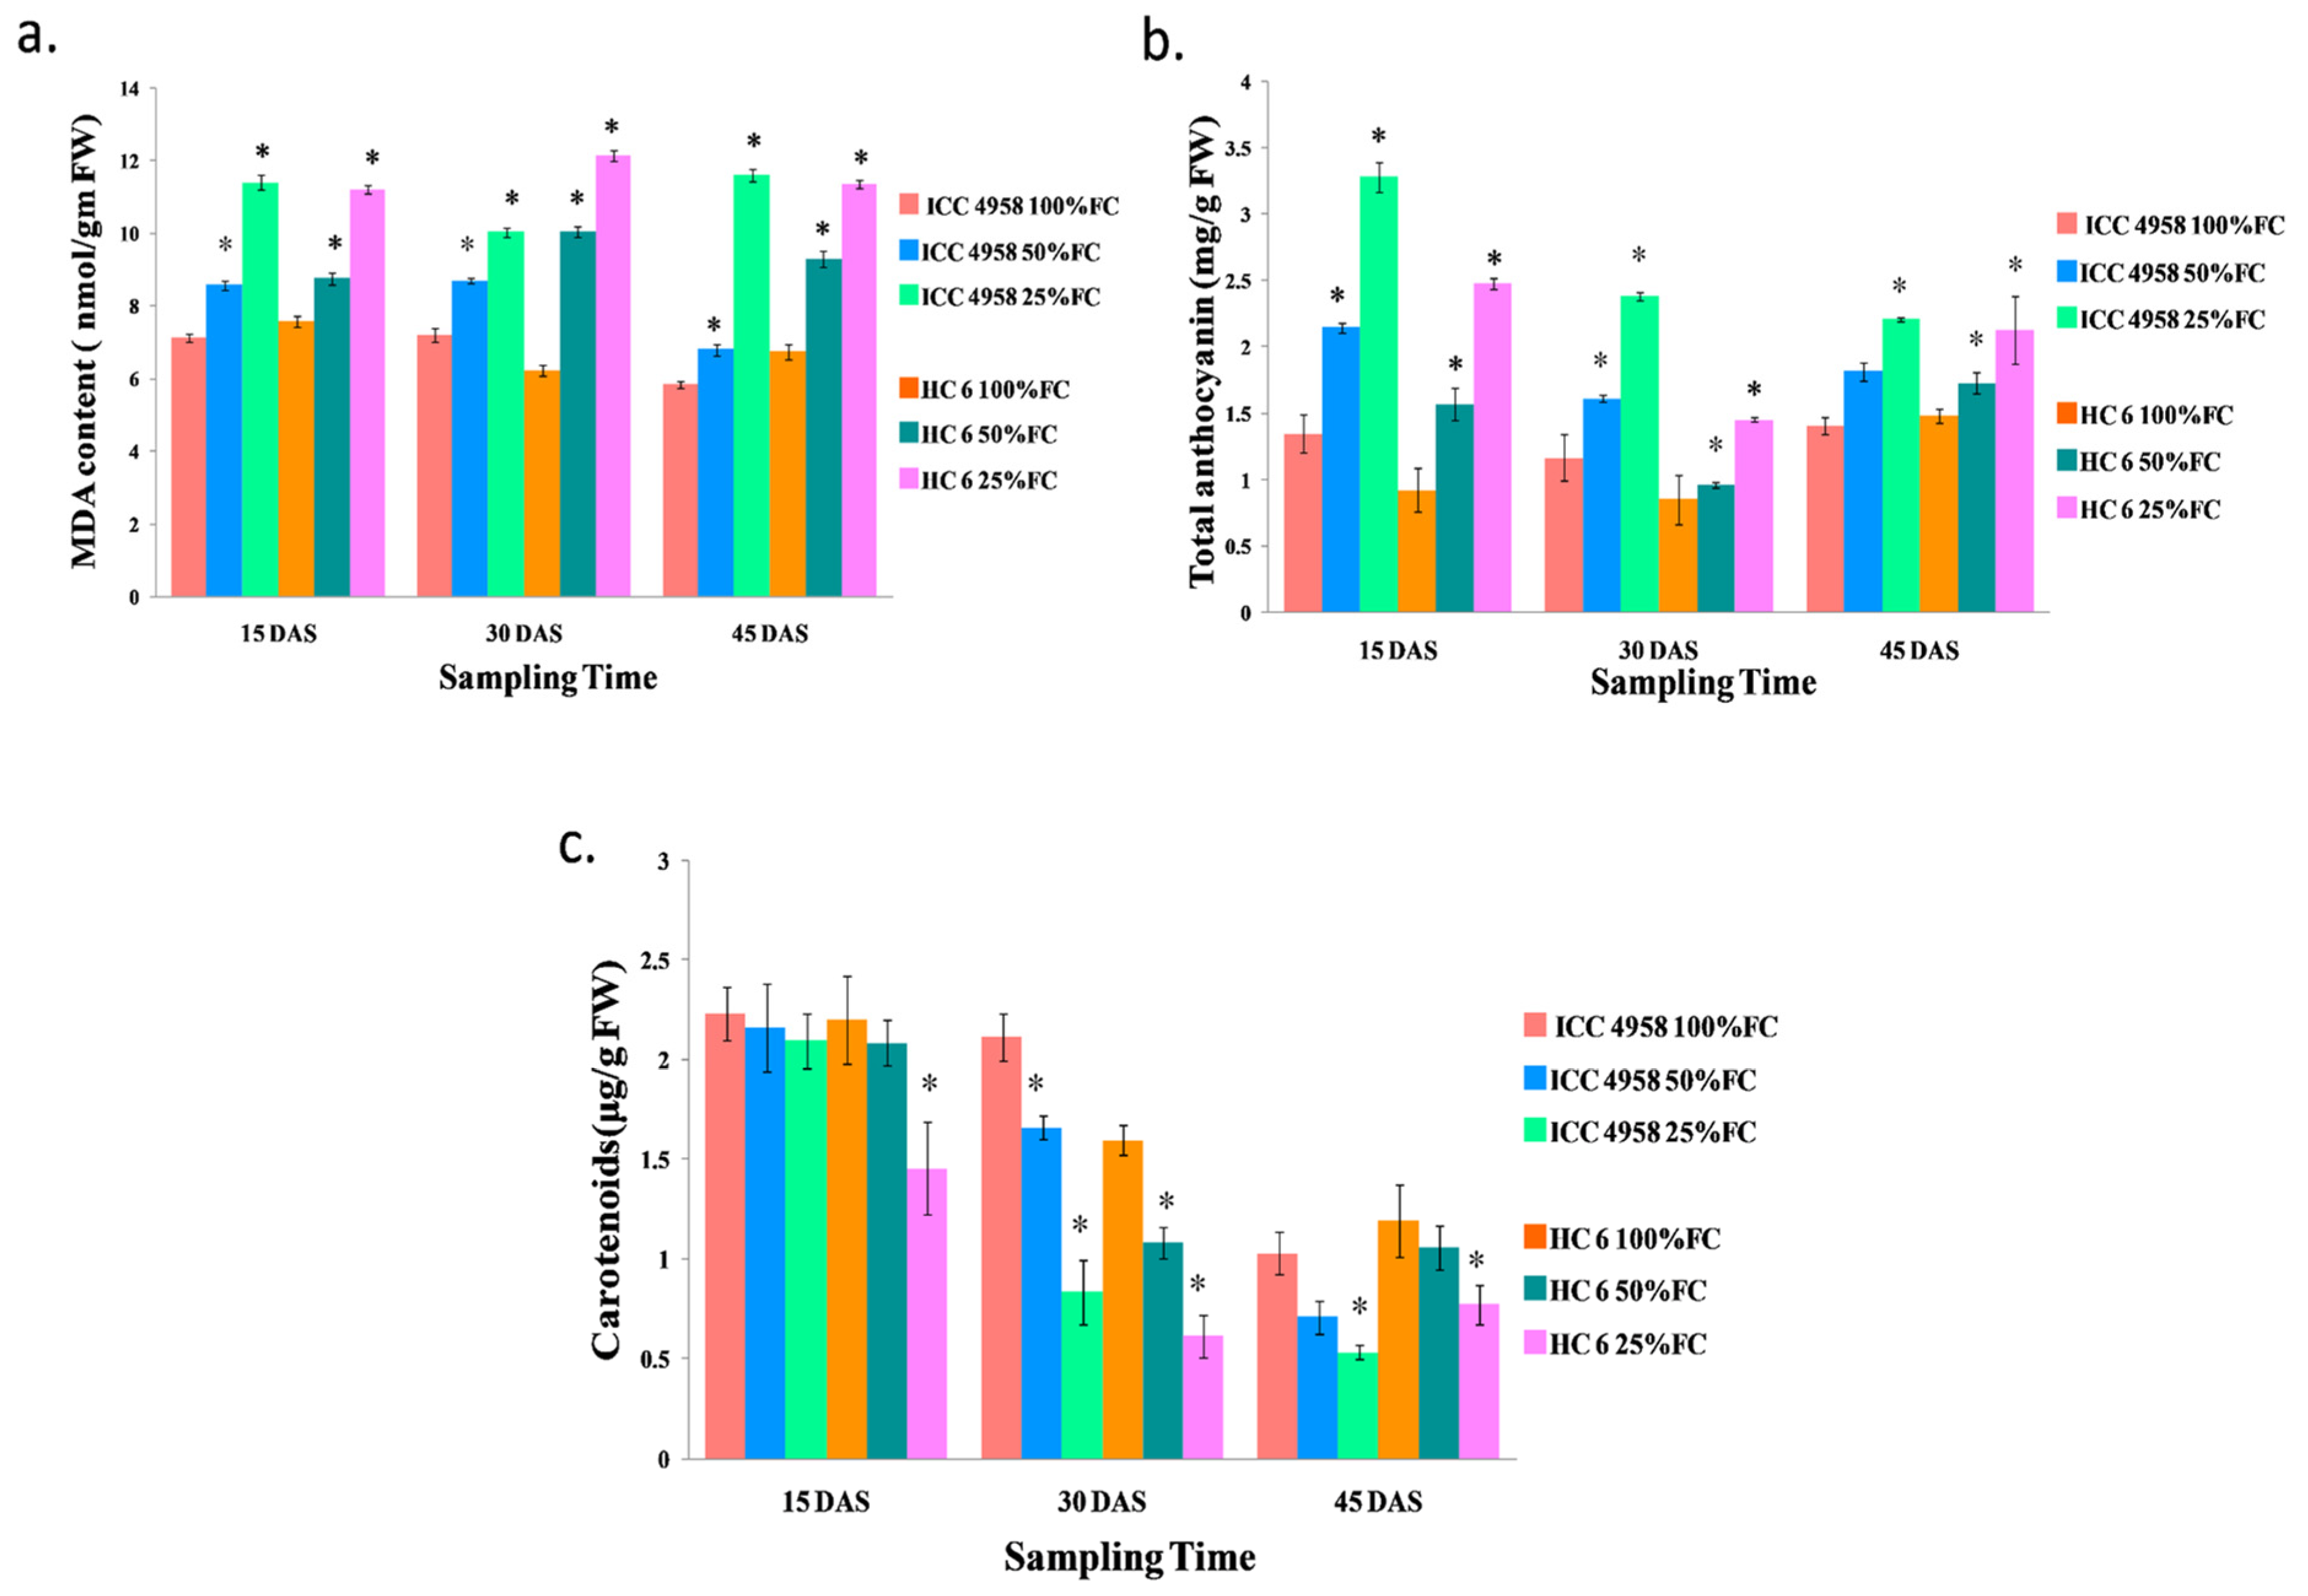
3.4.1. MDA
3.4.2. Total Anthocyanin
3.4.3. Carotenoid Content
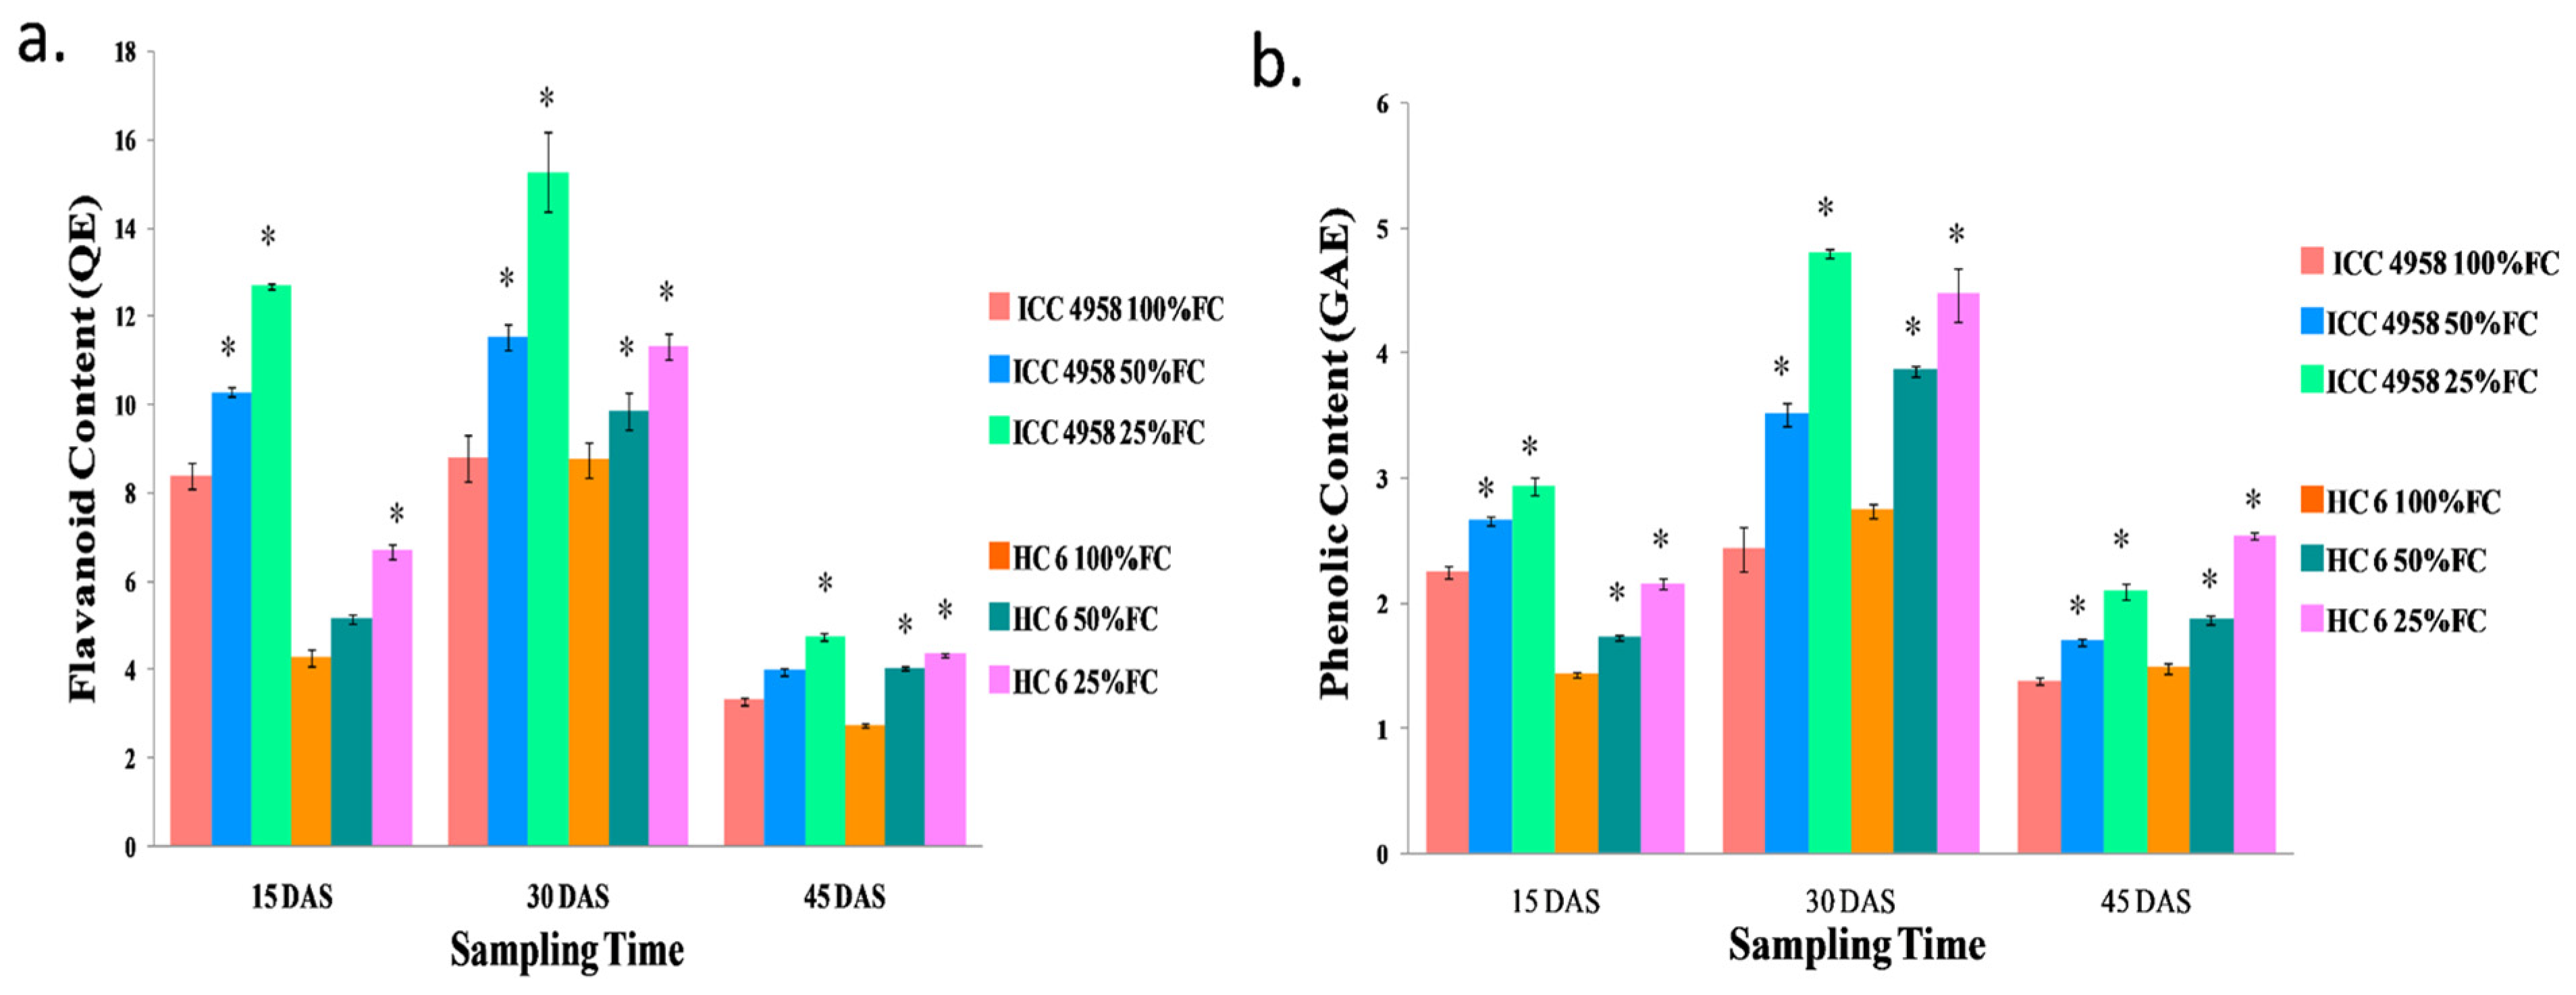
3.4.4. Flavonoid
3.4.5. Phenolic
3.5. Protein Profiling
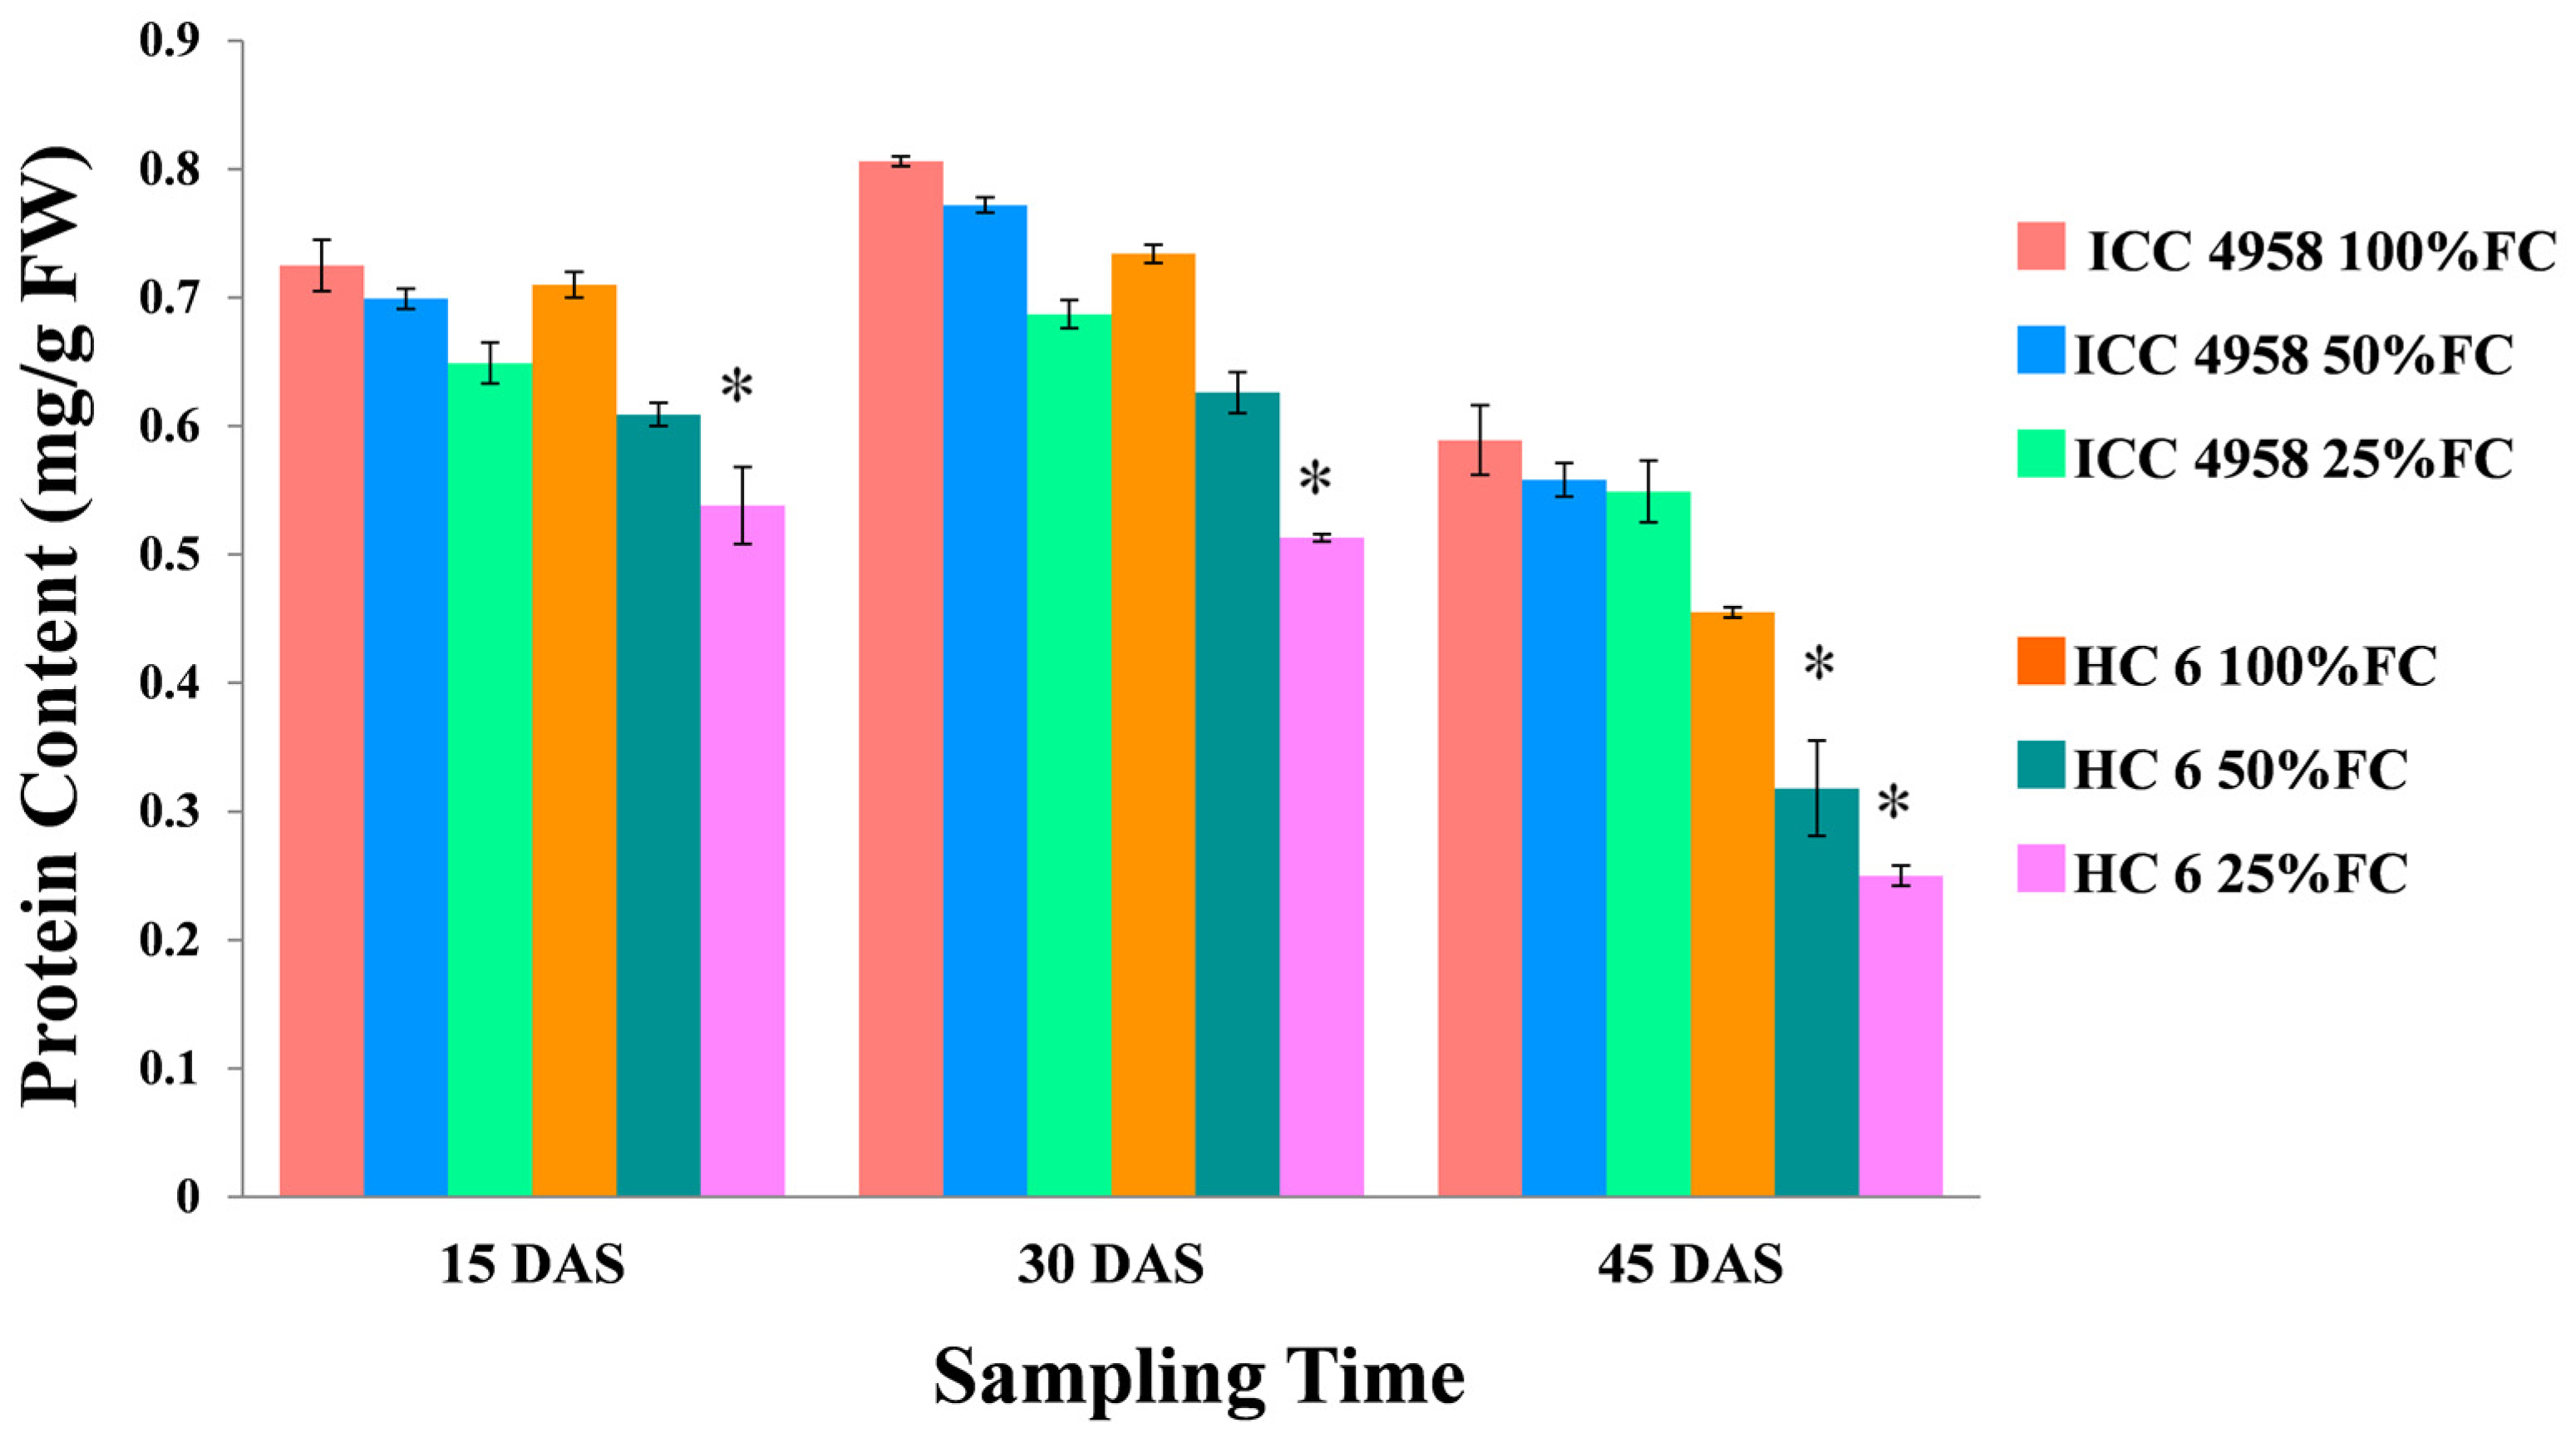
3.5.1. Total Protein
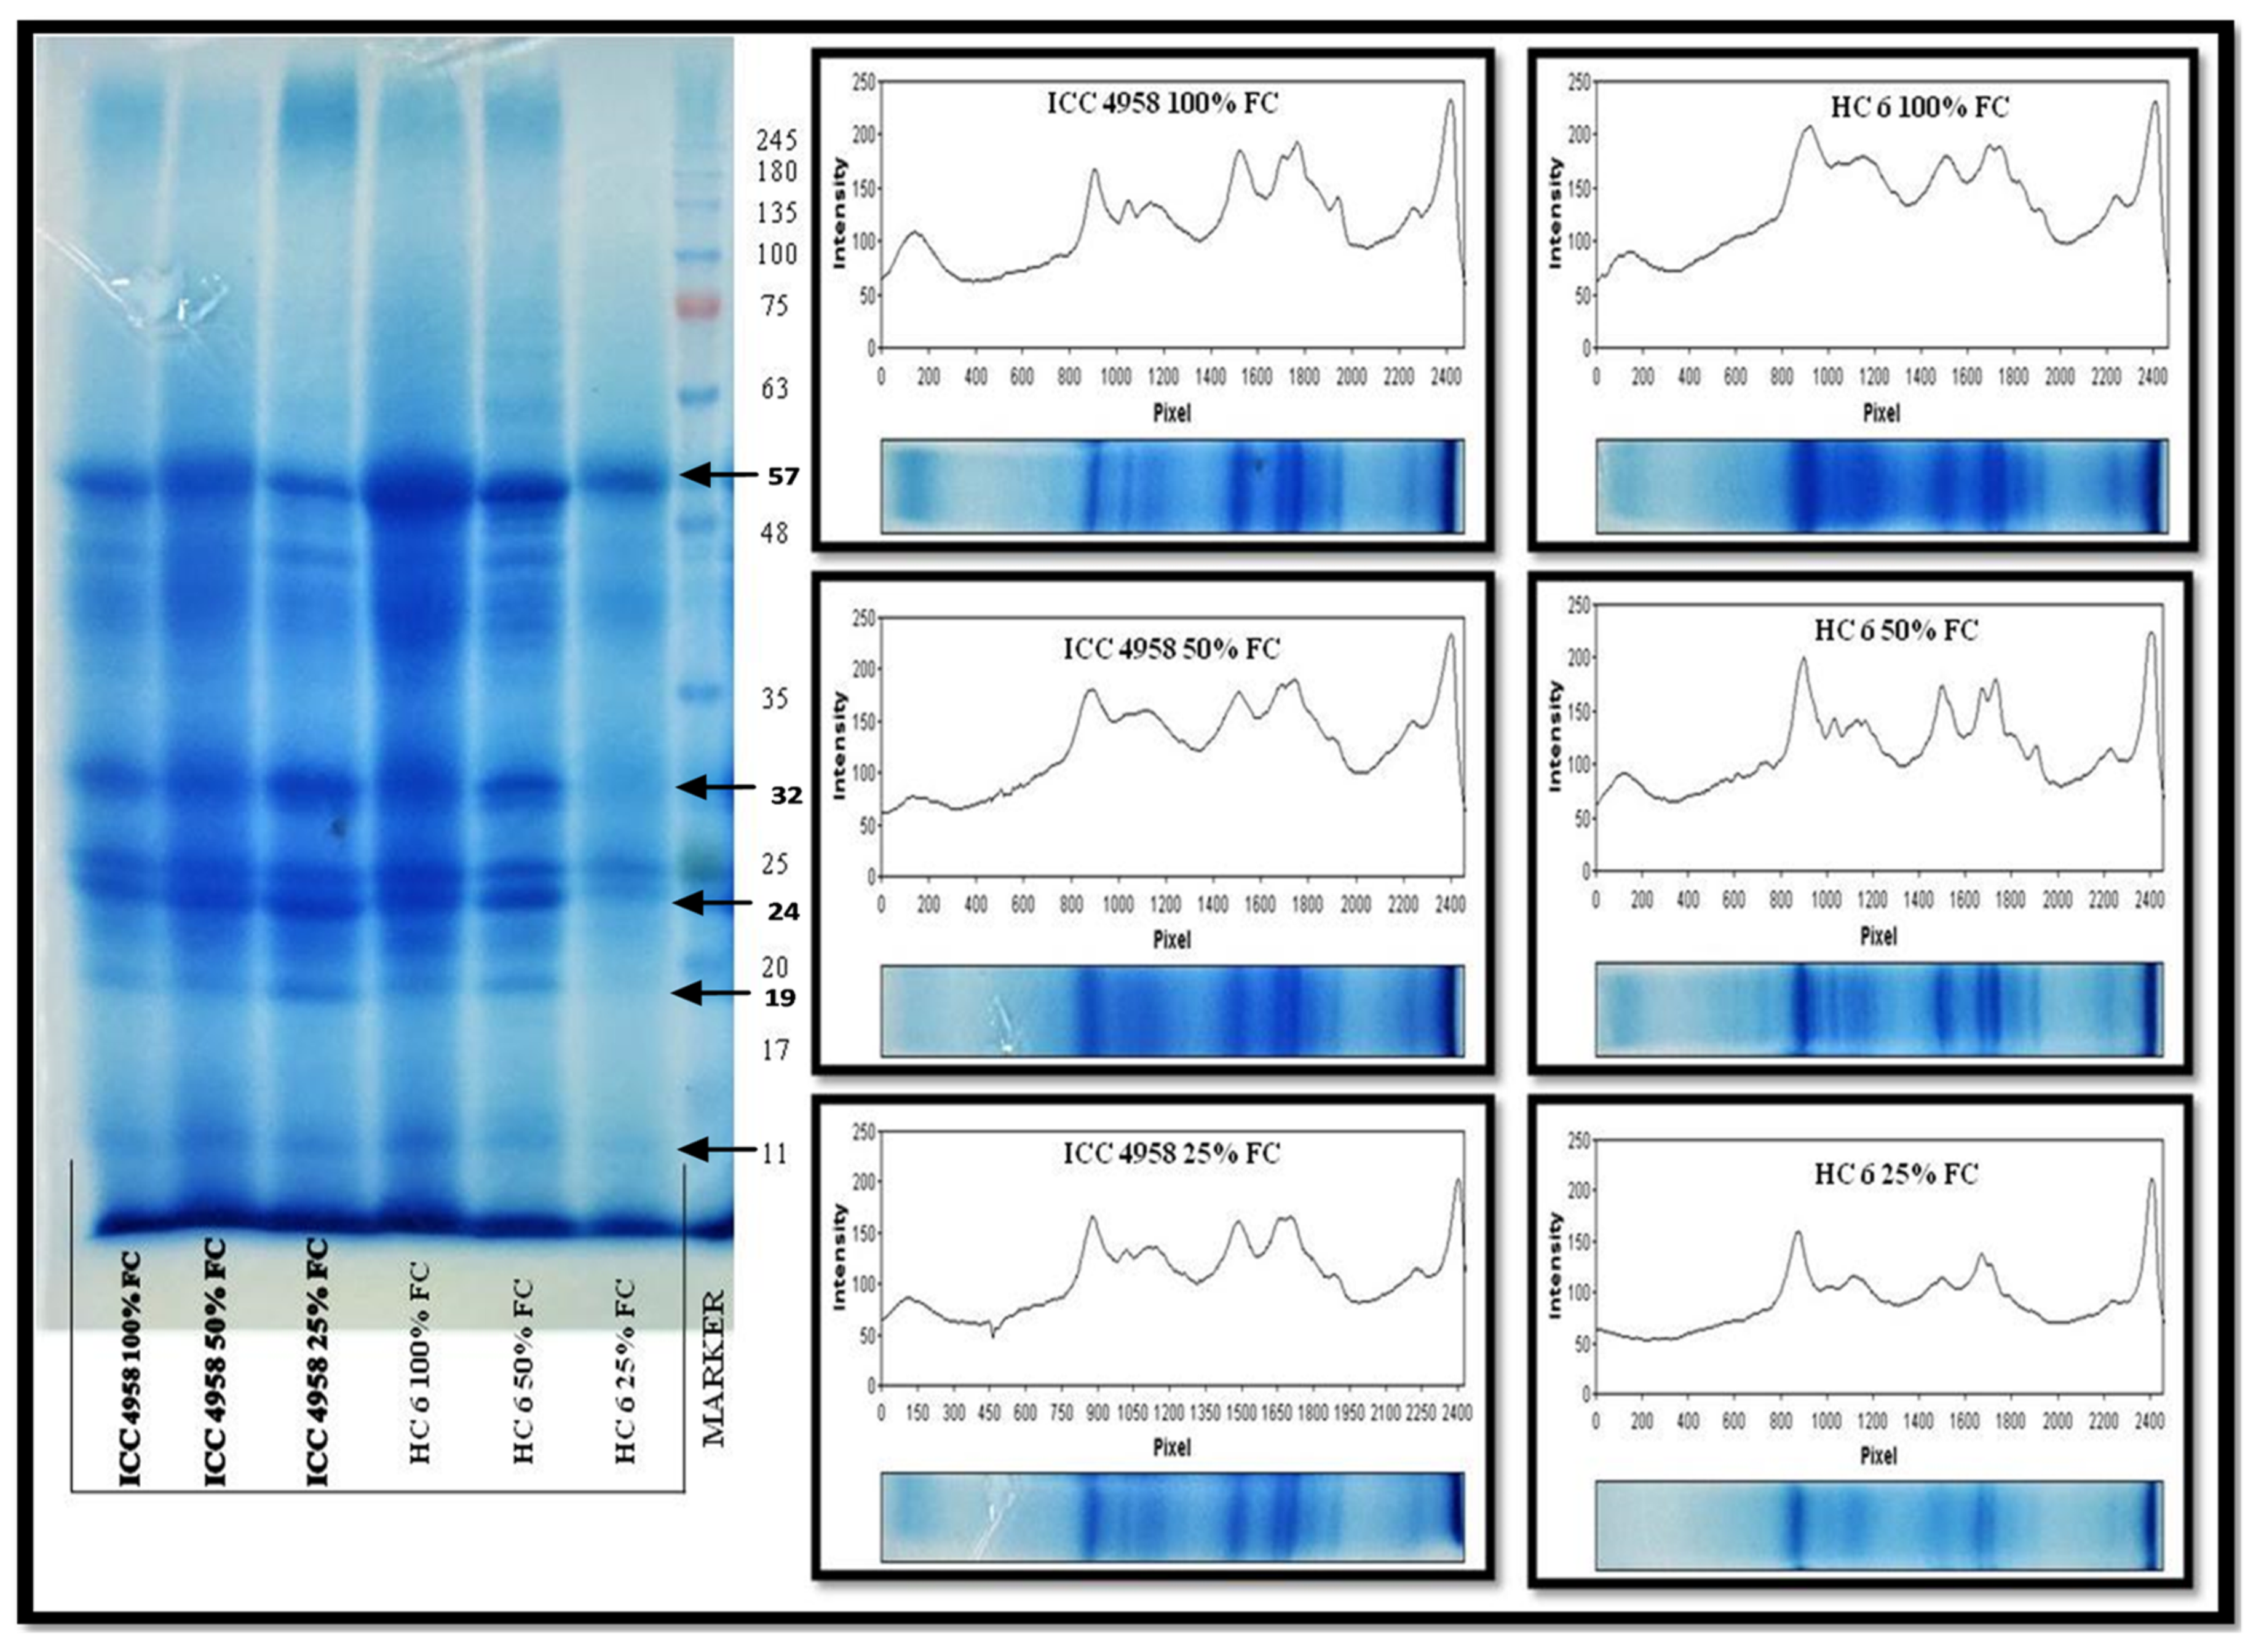
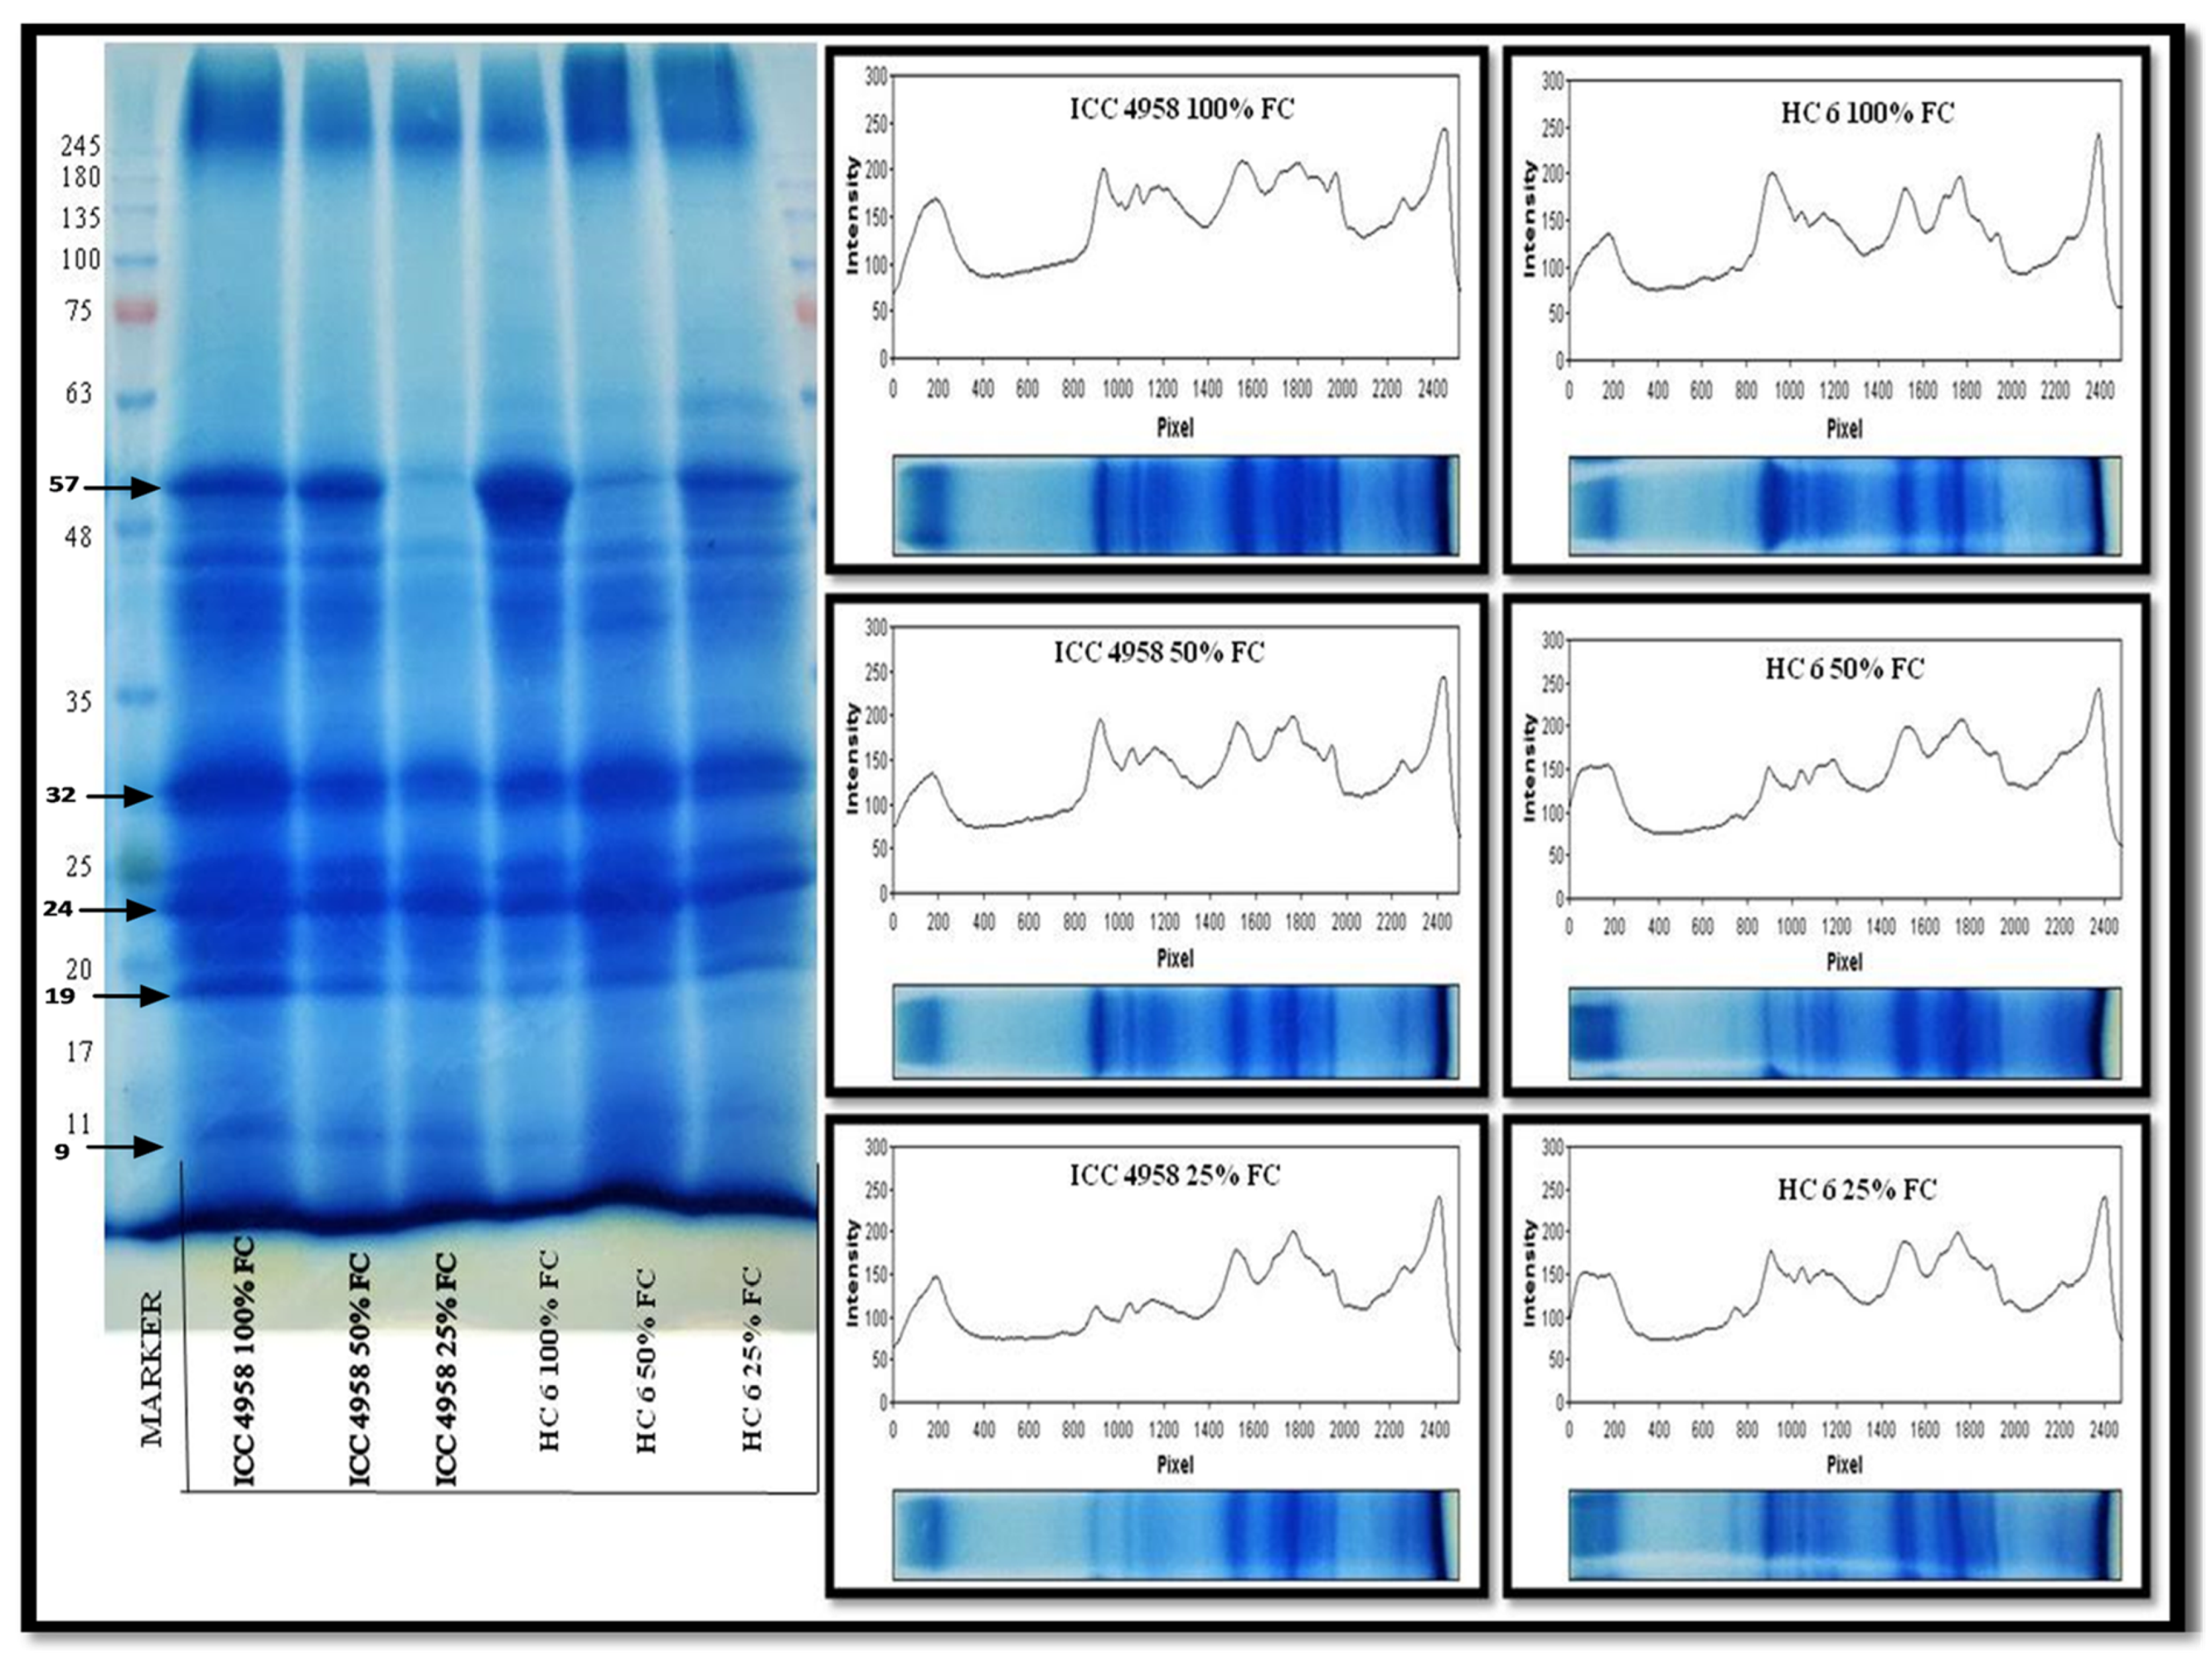
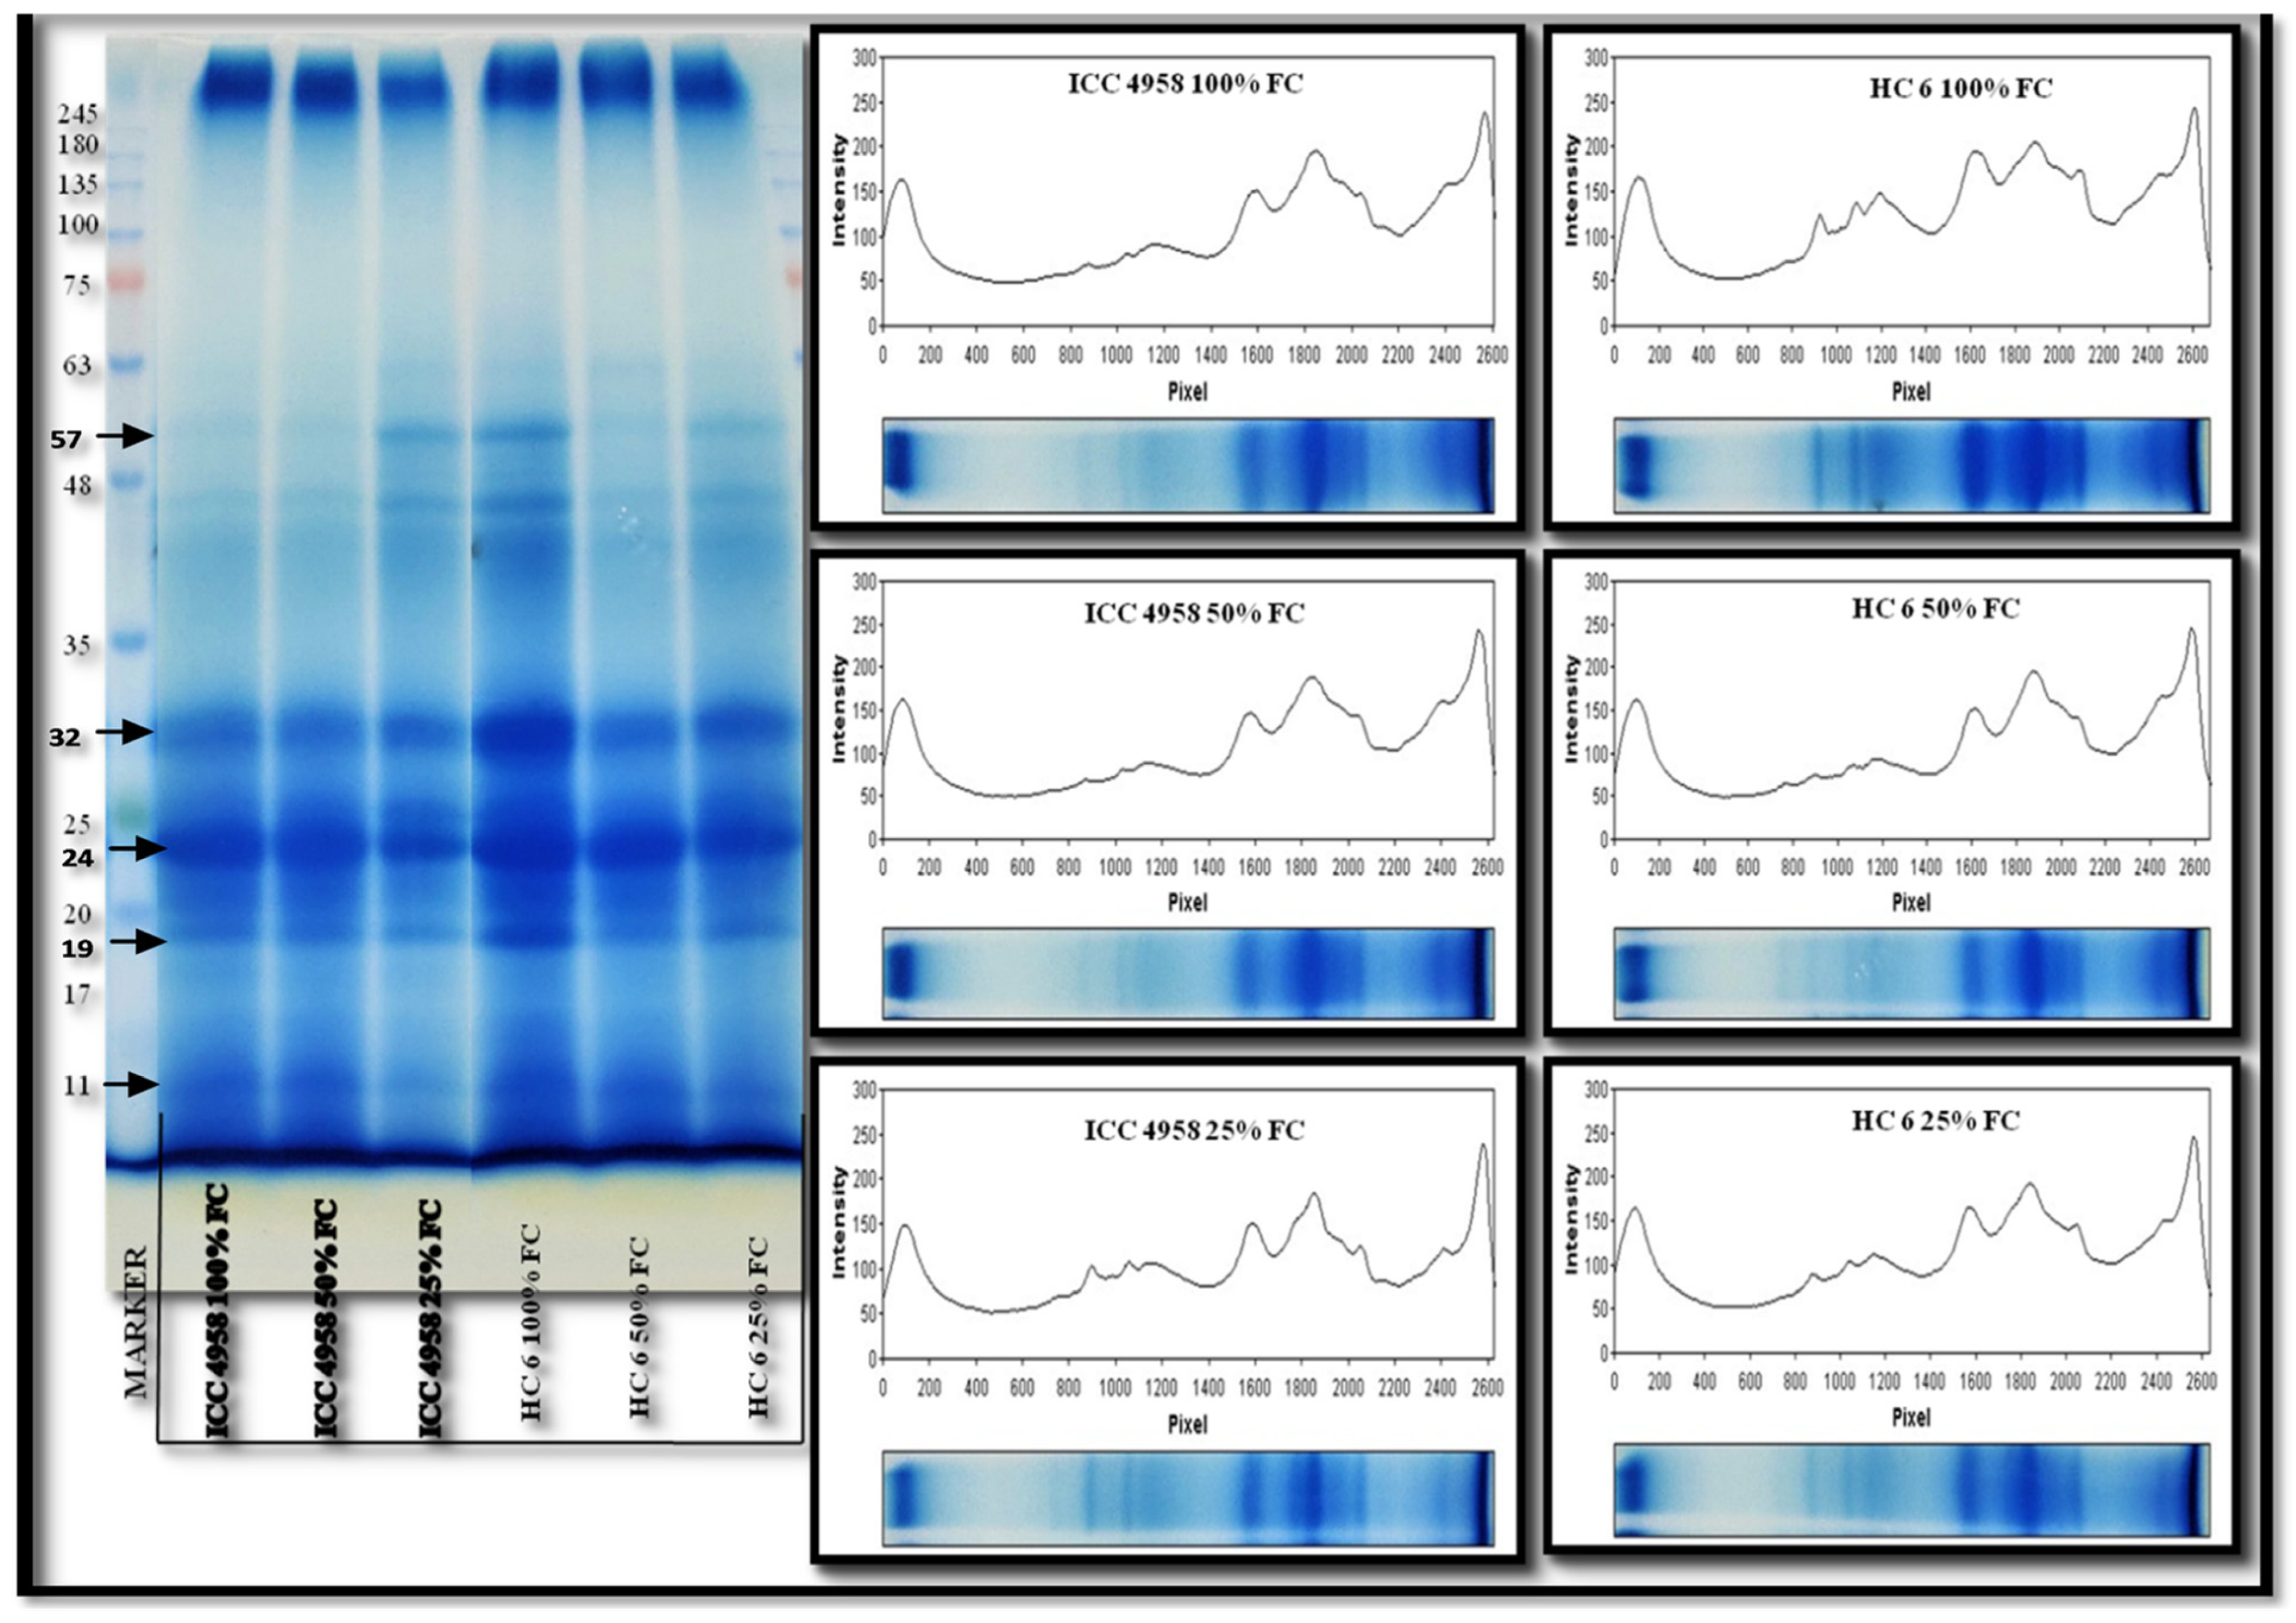
3.5.2. SDS-PAGE
4. Discussion
4.1. Morphological Parameters
4.2. Physiological Parameters
4.3. Biochemical Parameters
4.4. Metabolite Analysis
4.5. Protein Profiling
5. Conclusions
Author Contributions
Funding
Data Availability Statement
Acknowledgments
Conflicts of Interest
References
- FAOSTAT. 2019. Available online: http://www.fao.org/faostat (accessed on 11 November 2019).
- Graham, P.H.; Vance, C.P. Legumes: Importance and constraints to greater use. Plant Physiol. 2003, 131, 872–877. [Google Scholar] [CrossRef]
- Sarmah, B.K.; Acharjee, S.; Sharma, H.C. Chickpea: Crop improvement under changing environment conditions. In Improving Crop Productivity in Sustainable Agriculture; Wiley: Hoboken, NJ, USA, 2012; pp. 361–380. [Google Scholar]
- Varshney, R.K.; Thudi, M.; Nayak, S.N.; Gaur, P.M.; Kashiwagi, J.; Krishnamurthy, L.; Jaganathan, D.; Koppolu, J.; Bohra, A.; Tripathi, S.; et al. Genetic dissection of drought tolerance in chickpea (Cicer arietinum L.). Theor. Appl. Genet. 2004, 127, 445–462. [Google Scholar] [CrossRef] [PubMed]
- Korbu, L.; Fikre, A.; Tesfaye, K.; Funga, A.; Bekele, D.; Ojiewo, C.O. Response of chickpea to varying moisture stress conditions in Ethiopia. Agrosyst. Geosci. Environ. 2022, 5, e20234. [Google Scholar] [CrossRef]
- Singh, U.; Singh, B. Tropical grain legumes as important human foods. Econ. Bot. 1992, 46, 310–321. [Google Scholar] [CrossRef]
- Merga, B.; Haji, J. Economic importance of chickpea: Production, value, and world trade. Cogent Food Agric. 2019, 5, 1615718. [Google Scholar] [CrossRef]
- Manjunatha, L.; Puyam, A.; Prema, G.U.; Sanjay Bandi, M.; Kumar, R.; Keerthi, M.C.; Dixit, G.P.; Kavitha, T.R. Chickpea Biotic Stresses. In Genomic Designing for Biotic Stress Resistant Pulse Crops; Springer: Berlin/Heidelberg, Germany, 2022; pp. 117–159. [Google Scholar]
- Solomon, S.; Manning, M.; Marquis, M.; Qin, D. Climate Change 2007—The Physical Science Basis: Working Group I Contribution to the Fourth Assessment Report of the IPCC; Cambridge University Press: Cambridge, UK, 2007; Volume 7. [Google Scholar]
- Bulgari, R.; Franzoni, G.; Ferrante, A. Biostimulants application in horticultural crops under abiotic stress conditions. Agronomy 2009, 9, 306. [Google Scholar] [CrossRef]
- Farooq, M.; Gogoi, N.; Barthakur, S.; Baroowa, B.; Bharadwaj, N.; Alghamdi, S.S.; Siddique, K.H. Drought stress in grain legumes during reproduction and grain filling. J. Agron. Crop Sci. 2017, 203, 81–102. [Google Scholar] [CrossRef]
- Gupta, S.; Mishra, S.K.; Misra, S.; Pandey, V.; Agrawal, L.; Nautiyal, C.S.; Chauhan, P.S. Revealing the complexity of protein abundance in chickpea root under drought-stress using a comparative proteomics approach. Plant Physiol. Biochem. 2022, 151, 88–102. [Google Scholar] [CrossRef] [PubMed]
- Bodner, G.; Nakhforoosh, A.; Kaul, H.P. Management of crop water under drought: A review. Agron. Sustain. Dev. 2015, 35, 401–442. [Google Scholar] [CrossRef]
- Fahad, S.; Bajwa, A.A.; Nazir, U.; Anjum, S.A.; Farooq, A.; Zohaib, A.; Sadia, S.; Nasim, W.; Adkins, S.; Saud, S.; et al. Crop production under drought and heat stress: Plant responses and management options. Front. Plant Sci. 2017, 8, 1147. [Google Scholar] [CrossRef] [PubMed]
- Shi, L.; Wang, Z.; Kim, W.S. Effect of drought stress on shoot growth and physiological response in the cut rose ‘charming black’at different developmental stages. Hortic. Environ. Biotechnol. 2019, 60, 1–8. [Google Scholar] [CrossRef]
- Parkash, V.; Singh, S. A review on potential plant-based water stress indicators for vegetable crops. Sustainability 2020, 12, 3945. [Google Scholar] [CrossRef]
- Varshney, R.K.; Hiremath, P.J.; Lekha, P.; Kashiwagi, J.; Balaji, J.; Deokar, A.A.; Vadez, V.; Xiao, Y.; Srinivasan, R.; Gaur, P.M.; et al. A comprehensive resource of drought-and salinity-responsive ESTs for gene discovery and marker development in chickpea (Cicer arietinum L.). BMC Genom. 2009, 10, 532. [Google Scholar] [CrossRef] [PubMed]
- Garg, R.; Shankar, R.; Thakkar, B.; Kudapa, H.; Krishnamurthy, L.; Mantri, N.; Varshney, R.K.; Bhatia, S.; Jain, M. Transcriptome analyses reveal genotype-and developmental stage-specific molecular responses to drought and salinity stresses in chickpea. Sci. Rep. 2016, 6, srep19228. [Google Scholar] [CrossRef]
- Rashid, K.A.; Akhtar, M.U.; Cheema, K.L.; Rasool, I.R.; Zahid, A.F.; Hussain, A.M.; Aqeel, M.U.; Anwar, S.A.; Amin, M.; Qadeer, Z.; et al. Development of Selection Criteria for Assessment of Chickpea (Cicer arientum L.) On Physio-Morphic Attributes under Drought Stress at Seedling Stage and Maturity. Plant Cell Biotechnol. Mol. Biol. 2021, 22, 98–109. [Google Scholar]
- Smart, R.E.; Bingham, G.E. Rapid estimates of relative water content. Plant Physiol. 1974, 53, 258–260. [Google Scholar] [CrossRef]
- Dionisio-Sese, M.L.; Tobita, S. Antioxidant responses of rice seedlings to salinity stress. Plant Sci. 1998, 135, 1–9. [Google Scholar] [CrossRef]
- Lichtenthaler, H.K.; Wellburn, A.R. Determinations of total carotenoids and chlorophylls a and b of leaf extracts in different solvents. Analysis 1983, 11, 591–592. [Google Scholar] [CrossRef]
- Bates, L.S.; Waldren, R.P.; Teare, I.D. Rapid determination of free proline for water-stress studies. Plant Soil 1973, 39, 205–207. [Google Scholar] [CrossRef]
- Dubois, M.; Gilles, K.A.; Hamilton, J.K.; Rebers, P.T.; Smith, F. Colorimetric method for determination of sugars and related substances. Anal. Chem. 1956, 28, 350–356. [Google Scholar] [CrossRef]
- Grieve, C.M.; Grattan, S.R. Rapid assay for determination of water soluble quaternary ammonium compounds. Plant Soil 1983, 70, 303–307. [Google Scholar] [CrossRef]
- Beyer Jr, W.F.; Fridovich, I. Assaying for superoxide dismutase activity: Some large consequences of minor changes in conditions. Anal. Biochem. 1987, 161, 559–566. [Google Scholar] [CrossRef] [PubMed]
- Aebi, H. Catalase in vitro. In Methods in Enzymology; Academic Press: Cambridge, MA, USA, 1984; Volume 105, pp. 121–126. [Google Scholar]
- Nakano, Y.; Asada, K. Hydrogen peroxide is scavenged by ascorbate-specific peroxidase in spinach chloroplasts. Plant Cell Physiol. 1981, 22, 867–880. [Google Scholar]
- Foyer, C.H.; Halliwell, B. The presence of glutathione and glutathione reductase in chloroplasts: A proposed role in ascorbic acid metabolism. Planta 1976, 133, 21–25. [Google Scholar] [CrossRef]
- Heath, R.L.; Packer, L. Photoperoxidation in isolated chloroplasts: I. Kinetics and stoichiometry of fatty acid peroxidation. Arch. Biochem. Biophys. 1968, 125, 189–198. [Google Scholar] [CrossRef]
- Hodges, D.M.; Nozzolillo, C. Anthocyanin and anthocyanoplast content of cruciferous seedlings subjected to mineral nutrient deficiencies. J. Plant Physiol. 1996, 147, 749–754. [Google Scholar] [CrossRef]
- Julkunen-Tiitto, R. Phenolic constituents in the leaves of northern willows: Methods for the analysis of certain phenolics. J. Agric. Food Chem. 1985, 33, 213–217. [Google Scholar] [CrossRef]
- Quettier-Deleu, C.; Gressier, B.; Vasseur, J.; Dine, T.; Brunet, C.; Luyckx, M.; Cazin, M.; Cazin, J.C.; Bailleul, F.; Trotin, F. Phenolic compounds and antioxidant activities of buckwheat (Fagopyrum esculentum Moench) hulls and flour. J. Ethnopharmacol. 2000, 72, 35–42. [Google Scholar] [CrossRef]
- Bradford, M.M. A rapid and sensitive method for the quantitation of microgram quantities of protein utilizing the principle of protein-dye binding. Anal. Biochem. 1976, 72, 248–254. [Google Scholar] [CrossRef]
- Laemmli, U.K. Cleavage of structural proteins during the assembly of the head of bacteriophage T4. Nature 1970, 227, 680–685. [Google Scholar] [CrossRef]
- Korbu, L.; Tafes, B.; Kassa, G.; Mola, T.; Fikre, A. Unlocking the genetic potential of chickpea through improved crop management practices in Ethiopia. A review. Agron. Sustain. Dev. 2020, 40, 13. [Google Scholar] [CrossRef]
- Kumar, P.; Boora, K.S.; Kumar, N.; Batra, R.; Goyal, M.; Sharma, K.D.; Yadav, R.C. Traits of significance for screening of chickpea (Cicer arietinum L.) genotypes under terminal drought stress. J. Agrometeorol. 2018, 20, 40–45. [Google Scholar] [CrossRef]
- Malunga, L.N.; Bar-El, S.D.; Zinal, E.; Berkovich, Z.; Abbo, S.; Reifen, R. The potential use of chickpeas in development of infant follow-on formula. Nutr. J. 2014, 13, 8. [Google Scholar] [CrossRef] [PubMed]
- Gaur, P.M.; Jukanti, A.K.; Samineni, S.; Chaturvedi, S.K.; Basu, P.S.; Babbar, A.; Jayalakshmi, V.; Nayyar, H.; Devasirvatham, V.; Mallikarjuna, N.; et al. Climate change and heat stress tolerance in chickpea. In Climate Change and Plant Abiotic Stress Tolerance; Wiley: Hoboken, NJ, USA, 2013; pp. 837–856. [Google Scholar]
- Farooq, M.; Rizwan, M.; Nawaz, A.; Rehman, A.; Ahmad, R. Application of natural plant extracts improves the tolerance against combined terminal heat and drought stresses in bread wheat. J. Agron. Crop Sci. 2017, 203, 528–538. [Google Scholar] [CrossRef]
- Chaves, M.M.; Maroco, J.P.; Pereira, J.S. Understanding plant responses to drought—From genes to the whole plant. Funct. Plant Biol. 2003, 30, 239–264. [Google Scholar] [CrossRef] [PubMed]
- Wahid, A.; Gelani, S.; Ashraf, M.; Foolad, M.R. Heat tolerance in plants: An overview. Environ. Exp. Bot. 2007, 61, 199–223. [Google Scholar] [CrossRef]
- Manivannan, P.; Jaleel, C.A.; Sankar, B.; Kishorekumar, A.; Somasundaram, R.; Lakshmanan, G.A.; Panneerselvam, R. Growth, biochemical modifications and proline metabolism in Helianthus annuus L. as induced by drought stress. Colloids Surf. B Biointerfaces 2007, 59, 141–149. [Google Scholar] [CrossRef]
- Shakeel, A.A.; Xiao-yu, X.; Long-chang, W.; Muhammad, F.S.; Chen, M.; Wang, L. Morphological, physiological and biochemical responses of plants to drought stress. Afr. J. Agric. Res. 2011, 6, 2026–2032. [Google Scholar]
- Karim, A.M.A.; Sarker, U.K.; Hasan, A.K.; Islam, N.; Uddin, M.R. Physiological and Biochemical Responses of Chickpea (Cicer arietinum L.) Genotypes to Different Moisture Stresses. Turk. J. Field Crops 2022, 27, 1–9. [Google Scholar] [CrossRef]
- Naeem, M.K.; Ahmad, M.; Shah, M.K.N.; Kamran, M.; Iqbal, M.S. Character association and path analysis of osmotic adjustment, growth and physiological traits in wheat. JAPS J. Anim. Plant Sci. 2016, 26, 680–685. [Google Scholar]
- Baloch, M.J.; Dunwell, J.; Khakwani, A.A.; Dennett, M.; Jatoi, W.A.; Channa, S.A. Assessment of wheat cultivars for drought tolerance via osmotic stress imposed at early seedling growth stages. J. Agric. Res. 2012, 50, 299–310. [Google Scholar]
- Hussain, I.; Rasheed, R.; Ashraf, M.; Mohsin, M.; Ali, S.; Rashid, A.; Akram, M.; Nisar, J.; Riaz, M. Foliar Applied Acetylsalicylic Acid InducedGrowth and Key-Biochemical Changes in Chickpea (Cicer arietinum L.) Under Drought Stress. Dose-Response 2020, 18, 1559325820956801. [Google Scholar] [CrossRef]
- Fang, X.; Turner, N.C.; Yan, G.; Li, F.; Siddique, K.H. Flower numbers, pod production, pollen viability, and pistil function are reduced and flower and pod abortion increased in chickpea (Cicer arietinum L.) under terminal drought. J. Exp. Bot. 2010, 61, 335–345. [Google Scholar] [CrossRef]
- Mohammadi, A.; Habibi, D.; Rohami, M.; Mafakheri, S. Effect of drought stress on antioxidant enzymes activity of some chickpea cultivars. Am-Eurasian J. Agric. Environ. Sci. 2011, 11, 782–785. [Google Scholar]
- Farooq, M.; Hussain, M.; Wahid, A.; Siddique, K.H.M. Drought stress in plants: An overview. In Plant Responses to Drought Stress; Springer: Berlin/Heidelberg, Germany, 2012; pp. 1–33. [Google Scholar]
- Hussain, M.; Farooq, S.; Hasan, W.; Ul-Allah, S.; Tanveer, M.; Farooq, M.; Nawaz, A. Drought stress in sunflower: Physiological effects and its management through breeding and agronomic alternatives. Agric. Water Manag. 2018, 201, 152–166. [Google Scholar] [CrossRef]
- Ulemale, C.S.; Mate, S.N.; Deshmukh, D.V. Physiological indices for drought tolerance in chickpea (Cicer arietinum L.). World J. Agric. Sci. 2013, 9, 123–131. [Google Scholar]
- Hasan, S.A.; Hayat, S.; Ali, B.; Ahmad, A. 28-Homobrassinolide protects chickpea (Cicer arietinum) from cadmium toxicity by stimulating antioxidants. Environ. Pollut. 2008, 151, 60–66. [Google Scholar] [CrossRef]
- Talebi, R.; Ensafi, M.H.; Baghebani, N.; Karami, E.; Mohammadi, K. Physiological responses of chickpea (Cicer arietinum) genotypes to drought stress. Environ. Exp. Biol. 2013, 11, 9–15. [Google Scholar]
- Atteya, A.M. Alteration of water relations and yield of corn genotypes in response to drought stress. Bulg. J. Plant Physiol. 2003, 29, 63–76. [Google Scholar]
- Bilal, M.; Rashid, R.M.; Rehman, S.U.; Iqbal, F.; Ahmed, J.; Abid, M.A.; Ahmed, Z.; Hayat, A. Evaluation of wheat genotypes for drought tolerance. J. Green Physiol. Genet. Genom. 2015, 1, 11–21. [Google Scholar]
- Liu, H.; Searle, I.R.; Mather, D.E.; Able, A.J.; Able, J.A. Morphological, physiological and yield responses of durum wheat to pre-anthesis water-deficit stress are genotypedependent. Crop Pasture Sci. 2015, 66, 1024–1038. [Google Scholar] [CrossRef]
- Siddique, M.R.B.; Hamid, A.I.M.S.; Islam, M.S. Drought stress effects on water relations of wheat. Bot. Bull. Acad. Sin. 2000, 41, 35–39. [Google Scholar]
- Fu, J.; Huang, B. Involvement of antioxidants and lipid peroxidation in the adaptation of two cool-season grasses to localized drought stress. Environ. Exp. Bot. 2001, 45, 105–114. [Google Scholar] [CrossRef] [PubMed]
- Terzi, R.; Kadioglu, A. Drought stress tolerance and the antioxidant enzyme system. Acta Biol. Crac. Ser. Bot. 2006, 48, 89–96. [Google Scholar]
- Bayoumi, T.Y.; Eid, M.H.; Metwali, E.M. Application of physiological and biochemical indices as a screening technique for drought tolerance in wheat genotypes. Afr. J. Biotechnol. 2008, 7, 2341–2352. [Google Scholar]
- Gunes, A.I.; Adak, M.S.; Bagci, N.; Cicek, E.G.; Eraslan, F. Effect of Drought Stress Implemented at Pre- or Post-Anthesis Stage on Some Physiological Parameters as Screening Criteria in Chickpea Cultivars. Russ. J. Plant Physiol. 2008, 55, 59–67. [Google Scholar] [CrossRef]
- Scotti-Campos, P.; Pham-Thi, A.T.; Semedo, J.N.; Pais, I.P.; Ramalho, J.C.; do Céu Matos, M. Physiological responses and membrane integrity in three Vigna genotypes with contrasting drought tolerance. Emir. J. Food Agric. 2013, 25, 1002–1013. [Google Scholar] [CrossRef]
- Feng, Z.; Guo, A.; Feng, Z. Amelioration of chilling stress by triadimefon in cucumber seedlings. Plant Growth Regul. 2003, 39, 277–283. [Google Scholar] [CrossRef]
- Munne-Bosch, S.; Penuelas, J. Photo-and antioxidative protection, and a role for salicylic acid during drought and recovery in field-grown Phillyrea angustifolia plants. Planta 2003, 217, 758–766. [Google Scholar] [CrossRef]
- Farooq, M.; Basra, S.M.A.; Wahid, A.; Cheema, Z.A.; Cheema, M.A.; Khaliq, A. Physiological role of exogenously applied glycine betaine to improve drought tolerance in fine grain aromatic rice (Oryza sativa L.). J. Agron. Crop Sci. 2008, 194, 325–333. [Google Scholar] [CrossRef]
- Apel, K.; Hirt, H. Reactive oxygen species: Metabolism, oxidative stress, and signaling transduction. Annu. Rev. Plant Biol. 2004, 55, 373. [Google Scholar] [CrossRef]
- Shafiq, S.; Akram, N.A.; Ashraf, M.; García-Caparrós, P.; Ali, O.M.; Latef, A.A.H.A. Influence of glycine betaine (natural and synthetic) on growth, metabolism and yield production of drought-stressed maize (Zea mays L.) plants. Plants 2021, 10, 2540. [Google Scholar] [CrossRef] [PubMed]
- Chowdhury, J.A.; Karim, M.A.; Khaliq, Q.A.; Ahmed, A.U. Effect of drought stress on bio-chemical change and cell membrane stability of soybean genotypes. Bangladesh J. Agric. Res. 2017, 42, 475–485. [Google Scholar] [CrossRef]
- Simova-Stoilova, L.; Demirevska, K.; Petrova, T.; Tsenov, N.; Feller, U. Antioxidative protection in wheat varieties under severe recoverable drought at seedling stage. Plant Soil Env. 2008, 54, 529–536. [Google Scholar] [CrossRef]
- Moran, J.F.; Becana, M.; Iturbe-Ormaetxe, I.; Frechilla, S.; Klucas, R.V.; Aparicio-Tejo, P. Drought induces oxidative stress in pea plants. Planta 1994, 194, 346–352. [Google Scholar] [CrossRef]
- Campos, P.S.; Ramalho, J.C.; Lauriano, J.A.; Silva, M.J.; do Ceu Matos, M. Effects of drought on photosynthetic performance and water relations of four Vigna genotypes. Photosynthetica 1999, 36, 79–87. [Google Scholar]
- Egert, M.; Tevini, M. Influence of drought on some physiological parameters symptomatic for oxidative stress in leaves of chives (Allium schoenoprasum). Environ. Exp. Bot. 2002, 48, 43–49. [Google Scholar] [CrossRef]
- Mahdavi Mashaki, K.; Garg, V.; Nasrollahnezhad Ghomi, A.A.; Kudapa, H.; Chitikineni, A.; Zaynali Nezhad, K.; Yamchi, A.; Soltanloo, H.; Varshney, R.K.; Thudi, M. RNA-Seq analysis revealed genes associated with drought stress response in kabuli chickpea (Cicer arietinum L.). PLoS ONE 2018, 13, e0199774. [Google Scholar] [CrossRef]
- Bhuiyan, T.F.; Ahamed, K.U.; Nahar, K.; Al Mahmud, J.; Bhuyan, M.B.; Anee, T.I.; Fujita, M.; Hasanuzzaman, M. Mitigation of PEG-induced drought stress in rapeseed (Brassica rapa L.) by exogenous application of osmolytes. Biocatal. Agric. Biotechnol. 2019, 20, 101197. [Google Scholar] [CrossRef]
- Nyachiro, J.M.; Briggs, K.G.; Hoddinott, J.; Johnson-Flanagan, A.M. Chlorophyll content, chlorophyll fluorescence and water deficit in spring wheat. Cereal Res. Commun. 2001, 29, 135–142. [Google Scholar] [CrossRef]
- Massacci, A.; Nabiev, S.M.; Pietrosanti, L.; Nematov, S.K.; Chernikova, T.N.; Thor, K.; Leipner, J. Response of the photosynthetic apparatus of cotton (Gossypium hirsutum) to the onset of drought stress under field conditions studied by gas-exchange analysis and chlorophyll fluorescence imaging. Plant Physiol. Biochem. 2008, 46, 189–195. [Google Scholar] [CrossRef]
- Jaleel, C.A.; Manivannan, P.; Lakshmanan, G.M.A.; Gomathinayagam, M.; Panneerselvam, R. Alterations in morphological parameters and photosynthetic pigment responses of Catharanthus roseus under soil water deficits. Colloids Surf. B Biointerfaces 2008, 61, 298–303. [Google Scholar] [CrossRef]
- Rahbarian, R.; Khavari-Nejad, R.; Ganjeali, A.; Bagheri, A.; Najafi, F. Drought stress effects on photosynthesis, chlorophyll fluorescence and water relations in tolerant and susceptible chickpea (Cicer arietinum L.) genotypes. Acta Biol. Crac. Ser. Bot. 2011, 53, 47–56. [Google Scholar] [CrossRef]
- Parvaiz, A.; Khalid, U.R.H.; Ashwani, K.; Muhammad, A.; Nudrat, A.A. Salt-induced changes in photosynthetic activity and oxidative defense system of three cultivars of mustard (Brassica juncea L.). Afr. J. Biotechnol. 2012, 11, 2694–2703. [Google Scholar] [CrossRef]
- Mohamed, M.A.; Ashraf, M.Y.; Parvaiz, A. Evaluation of salicylic acid (SA) application on growth, osmotic solutes and antioxidant enzyme activities on broad bean seedlings grown under diluted seawater. Int. J. Plant Physiol. Biochem. 2011, 3, 253–264. [Google Scholar]
- Rasool, S.; Ahmad, A.; Siddiqi, T.O.; Ahmad, P. Changes in growth, lipid peroxidation and some key antioxidant enzymes in chickpea genotypes under salt stress. Acta Physiol. Plant. 2013, 35, 1039–1050. [Google Scholar] [CrossRef]
- Lata, C.; Muthamilarasan, M.; Prasad, M. Drought stress responses and signal transduction in plants. In Elucidation of Abiotic Stress Signaling in Plants; Springer: New York, NY, USA, 2015; pp. 195–225. [Google Scholar]
- Dapanage, M.; Bhat, S. Physiological responses of commercial sugarcane (Saccharum spp. hybrids) varieties to moisture deficit stress tolerance. Indian J. Plant Physiol. 2018, 23, 40–47. [Google Scholar] [CrossRef]
- Takahashi, F.; Kuromori, T.; Sato, H.; Shinozaki, K. Regulatory gene networks in drought stress responses and resistance in plants. Surviv. Strategies Extrem. Cold Desiccation 2018, 1081, 189–214. [Google Scholar]
- Mwadzingeni, L.; Shimelis, H.; Tesfay, S.; Tsilo, T.J. Screening of bread wheat genotypes for drought tolerance using phenotypic and proline analyses. Front. Plant Sci. 2016, 7, 1276. [Google Scholar] [CrossRef] [PubMed]
- Hassanvand, F.; Nejad, A.R.; Fanourakis, D. Morphological and physiological components mediating the silicon-induced enhancement of geranium essential oil yield under saline conditions. Ind. Crops Prod. 2019, 134, 19–25. [Google Scholar] [CrossRef]
- Szabados, L.; Savouré, A. Proline: A multifunctional amino acid. Trends Plant Sci. 2010, 15, 89–97. [Google Scholar] [CrossRef] [PubMed]
- Vendruscolo, E.C.G.; Schuster, I.; Pileggi, M.; Scapim, C.A.; Molinari, H.B.C.; Marur, C.J.; Vieira, L.G.E. Stress-induced synthesis of proline confers tolerance to water deficit in transgenic wheat. J. Plant Physiol. 2007, 164, 1367–1376. [Google Scholar] [CrossRef] [PubMed]
- Lum, M.S.; Hanafi, M.M.; Rafii, Y.M.; Akmar, A.S.N. Effect of drought stress on growth, proline and antioxidant enzyme activities of upland rice. JAPS J. Anim. Plant Sci. 2014, 24, 1487–1493. [Google Scholar]
- Ain-Lhout, F.; Zunzunegui, M.; Barradas, D.; Tirado, R.; Clavijo, A.; Garcia Novo, F. Comparison of proline accumulation in two Mediterranean shrubs subjected to natural and experimental water deficit. Plant Soil 2001, 230, 175–183. [Google Scholar] [CrossRef]
- Seifikalhor, M.; Niknam, V.; Aliniaeifard, S.; Didaran, F.; Tsaniklidis, G.; Fanourakis, D.; Teymoorzadeh, M.; Mousavi, S.H.; Bosacchi, M.; Li, T. The regulatory role of γ-Aminobutyric acid in chickpea plants depends on drought tolerance and water scarcity level. Sci. Rep. 2022, 12, 7034. [Google Scholar] [CrossRef]
- Sánchez, F.J.; Manzanares, M.; de Andres, E.F.; Tenorio, J.L.; Ayerbe, L. Turgor maintenance, osmotic adjustment and soluble sugar and proline accumulation in 49 pea cultivars in response to water stress. Field Crops Res. 1998, 59, 225–235. [Google Scholar] [CrossRef]
- Hoekstra, F.A.; Golovina, E.A.; Buitink, J. Mechanisms of plant desiccation tolerance. Trends Plant Sci. 2001, 6, 431–438. [Google Scholar] [CrossRef]
- Wang, L.; Ruan, Y.L. Regulation of cell division and expansion by sugar and auxin signaling. Front. Plant Sci. 2013, 4, 163. [Google Scholar] [CrossRef] [PubMed]
- Khan, N.; Bano, A.; Rahman, M.A.; Guo, J.; Kang, Z.; Babar, M. Comparative physiological and metabolic analysis reveals a complex mechanism involved in drought tolerance in chickpea (Cicer arietinum L.) induced by PGPR and PGRs. Sci. Rep. 2019, 9, 2097. [Google Scholar] [CrossRef]
- Ashraf, M.F.M.R.; Foolad, M.R. Roles of glycine betaine and proline in improving plant abiotic stress resistance. Environ. Exp. Bot. 2007, 59, 206–216. [Google Scholar] [CrossRef]
- Yaqoob, H.; Akram, N.A.; Iftikhar, S.; Ashraf, M.; Khalid, N.; Sadiq, M.; Alyemeni, M.N.; Wijaya, L.; Ahmad, P. Seed pretreatment and foliar application of proline regulate morphological, physio-biochemical processes and activity of antioxidant enzymes in plants of two cultivars of quinoa (Chenopodium quinoa Willd.). Plants 2019, 8, 588. [Google Scholar] [CrossRef] [PubMed]
- Nazar, Z.; Akram, N.A.; Saleem, M.H.; Ashraf, M.; Ahmed, S.; Ali, S.; Abdullah Alsahli, A.; Alyemeni, M.N. Glycinebetaine-induced alteration in gaseous exchange capacity and osmoprotective phenomena in safflower (Carthamus tinctorius L.) under water deficit conditions. Sustainability 2020, 12, 10649. [Google Scholar] [CrossRef]
- Shah Mahmud, T.; Imran, M.; Atta, B.M.; Ashraf, M.Y.; Hameed, A.; Waqar, I.; Maqbool, M.A. Selection and screening of drought tolerant high yielding chickpea genotypes based on physio-biochemical indices and multi-environmental yield trials. BMC Plant Biol. 2020, 20, 171. [Google Scholar]
- Lv, S.; Yang, A.; Zhang, K.; Wang, L.; Zhang, J. Increase of glycine betaine synthesis improves drought tolerance in cotton. Mol. Breed. 2007, 20, 233–248. [Google Scholar] [CrossRef]
- Blokhina, O.; Virolainen, E.; Fagerstedt, K.V. Antioxidants, oxidative damage and oxygen deprivation stress: A review. Ann. Bot. 2003, 91, 179–194. [Google Scholar] [CrossRef]
- Loggini, B.; Scartazza, A.; Brugnoli, E.; Navari-Izzo, F. Antioxidative defense system, pigment composition, and photosynthetic efficiency in two wheat cultivars subjected to drought. Plant Physiol. 1999, 119, 1091–1100. [Google Scholar] [CrossRef]
- Amman, A. Drought Effect of Drought Conditions at Yield, Yield Components and Physiological Characteristics in Different Varieties of Sunflowers. Master’s Thesis, Faculty of Agriculture and Natural Resources Karaj-Branch Islamic Azad University, Karaj, Iran, 2004. [Google Scholar]
- Saei, M. Study on Relationship Morph-Physiological Traits with Drought Tolerance in Different Genotypes of Sorghum M. Master’s Thesis, Faculty of Agriculture and Natural Resources Karaj Branch Islamic Azad University, Karaj, Iran, 2004. [Google Scholar]
- Shafei, S. Study on Water Shortage Effect at Some of Physiological Traits, Yield and Yield Components in Some Genotypes of Soybean. Master’s Thesis, Islamic Azad University, Tehran, Iran, 2005. [Google Scholar]
- Mafakheri, A.; Siosemardeh, A.F.; Bahramnejad, B.; Struik, P.C.; Sohrabi, Y. Effect of drought stress on yield, proline and chlorophyll contents in three chickpea cultivars. Aust. J. Crop Sci. 2011, 4, 580–585. [Google Scholar]
- Nounjan, N.; Nghia, P.T.; Theerakulpisut, P. Exogenous proline and trehalose promote recovery of rice seedlings from salt-stress and differentially modulate antioxidant enzymes and expression of related genes. J. Plant Physiol. 2012, 169, 596–604. [Google Scholar] [CrossRef]
- Eyidogan, F.; Öz, M.T. Effect of salinity on antioxidant responses of chickpea seedlings. Acta Physiol. Plant. 2007, 29, 485–493. [Google Scholar] [CrossRef]
- Ploenlap, P.; Pattanagul, W. Effects of exogenous abscisic acid on foliar anthocyanin accumulation and drought tolerance in purple rice. Biologia 2015, 70, 915–921. [Google Scholar] [CrossRef]
- Steyn, W.J.; Wand, S.J.E.; Holcroft, D.M.; Jacobs, G.J.N.P. Anthocyanins in vegetative tissues: A proposed unified function in photoprotection. New Phytol. 2002, 155, 349–361. [Google Scholar] [CrossRef] [PubMed]
- Deeba, F.; Pandey, A.K.; Ranjan, S.; Mishra, A.; Singh, R.; Sharma, Y.K.; Shirke, P.A.; Pandey, V. Physiological and proteomic responses of cotton (Gossypium herbaceum L.) to drought stress. Plant Physiol. Biochem. 2012, 53, 6–18. [Google Scholar] [CrossRef] [PubMed]
- Kalefetoğlu Macar, T.; Ekmekci, Y. Alterations in photochemical and physiological activities of chickpea (Cicer arietinum L.) cultivars under drought stress. J. Agron. Crop Sci. 2009, 195, 335–346. [Google Scholar] [CrossRef]
- Bandurska, H.; Pietrowska-Borek, M.; Cieślak, M. Response of barley seedlings to water deficit and enhanced UV-B irradiation acting alone and in combination. Acta Physiol. Plant. 2012, 34, 161–171. [Google Scholar] [CrossRef]
- Quan, N.T.; Anh, L.H.; Khang, D.T.; Tuyen, P.T.; Toan, N.P.; Minh, T.N.; Minh, L.T.; Bach, D.T.; Ha, P.T.T.; Elzaawely, A.A.; et al. Involvement of secondary metabolites in response to drought stress of rice (Oryza sativa L.). Agriculture 2016, 6, 23. [Google Scholar] [CrossRef]
- Cos, P.; Ying, L.; Calomme, M.; Hu, J.P.; Cimanga, K.; Van Poel, B.; Pieters, L.; Vlietinck, A.J.; Berghe, D.V. Structure—Activity relationship and classification of flavonoids as inhibitors of xanthine oxidase and superoxide scavengers. J. Nat. Prod. 1998, 61, 71–76. [Google Scholar] [CrossRef]
- Reddy, A.R.; Chaitanya, K.V.; Vivekanandan, M. Drought-induced responses of photosynthesis and antioxidant metabolism in higher plants. J. Plant Physiol. 2004, 161, 1189–1202. [Google Scholar] [CrossRef]
- Pawlowski, M.; Lasica, A.M.; Jagusztyn-Krynicka, E.K.; Bujnicki, J.M. AAN82231 protein from uropathogenic E. coli CFT073 is a close paralog of DsbB enzymes and does not belong to the DsbI family. Pol. J. Microbiol. 2009, 58, 181–184. [Google Scholar]
- Vessal, S.; Arefian, M.; Siddique, K.H. Proteomic responses to progressive dehydration stress in leaves of chickpea seedlings. BMC Genom. 2020, 21, 523. [Google Scholar] [CrossRef]
- Faghani, E.; Gharechahi, J.; Komatsu, S.; Mirzaei, M.; Khavarinejad, R.A.; Najafi, F.; Farsad, L.K.; Salekdeh, G.H. Comparative physiology and proteomic analysis of two wheat genotypes contrasting in drought tolerance. J. Proteom. 2015, 114, 1–15. [Google Scholar] [CrossRef]
- Seel, W.E.; Hendry, G.A.F.; Lee, J.A. The combined effects of desiccation and irradiance on mosses from xeric and hydric habitats. J. Exp. Bot. 1992, 43, 1023–1030. [Google Scholar] [CrossRef]
- Arefian, M.; Vessal, S.; Bagheri, A. Biochemical changes and SDS-PAGE analyses of chickpea (Cicer arietinum L.) genotypes in response to salinity during the early stages of seedling growth. J. Biol. Environ. Sci. 2014, 8, 99–109. [Google Scholar]
- Lande, N.V.; Subba, P.; Barua, P.; Gayen, D.; Prasad, T.K.; Chakraborty, S.; Chakraborty, N. Dissecting the chloroplast proteome of chickpea (Cicer arietinum L.) provides new insights into classical and non-classical functions. J. Proteom. 2017, 165, 11–20. [Google Scholar] [CrossRef] [PubMed]


Disclaimer/Publisher’s Note: The statements, opinions and data contained in all publications are solely those of the individual author(s) and contributor(s) and not of MDPI and/or the editor(s). MDPI and/or the editor(s) disclaim responsibility for any injury to people or property resulting from any ideas, methods, instructions or products referred to in the content. |
© 2023 by the authors. Licensee MDPI, Basel, Switzerland. This article is an open access article distributed under the terms and conditions of the Creative Commons Attribution (CC BY) license (https://creativecommons.org/licenses/by/4.0/).
Share and Cite
Keerthi Sree, Y.; Lakra, N.; Manorama, K.; Ahlawat, Y.; Zaid, A.; Elansary, H.O.; Sayed, S.R.M.; Rashwan, M.A.; Mahmoud, E.A. Drought-Induced Morpho-Physiological, Biochemical, Metabolite Responses and Protein Profiling of Chickpea (Cicer arietinum L.). Agronomy 2023, 13, 1814. https://doi.org/10.3390/agronomy13071814
Keerthi Sree Y, Lakra N, Manorama K, Ahlawat Y, Zaid A, Elansary HO, Sayed SRM, Rashwan MA, Mahmoud EA. Drought-Induced Morpho-Physiological, Biochemical, Metabolite Responses and Protein Profiling of Chickpea (Cicer arietinum L.). Agronomy. 2023; 13(7):1814. https://doi.org/10.3390/agronomy13071814
Chicago/Turabian StyleKeerthi Sree, Yama, Nita Lakra, Kesineni Manorama, Yogesh Ahlawat, Abbu Zaid, Hosam O. Elansary, Shaban R. M. Sayed, Mohamed A. Rashwan, and Eman A. Mahmoud. 2023. "Drought-Induced Morpho-Physiological, Biochemical, Metabolite Responses and Protein Profiling of Chickpea (Cicer arietinum L.)" Agronomy 13, no. 7: 1814. https://doi.org/10.3390/agronomy13071814
APA StyleKeerthi Sree, Y., Lakra, N., Manorama, K., Ahlawat, Y., Zaid, A., Elansary, H. O., Sayed, S. R. M., Rashwan, M. A., & Mahmoud, E. A. (2023). Drought-Induced Morpho-Physiological, Biochemical, Metabolite Responses and Protein Profiling of Chickpea (Cicer arietinum L.). Agronomy, 13(7), 1814. https://doi.org/10.3390/agronomy13071814