Article

Agronomic Response to Irrigation and Biofertilizer of Peanut (Arachis hypogea L.) Grown under Mediterranean Environment

Department of Agriculture, Food, Natural Resources and Engineering (DAFNE), University of Foggia, 71122 Foggia, Italy
*
Author to whom correspondence should be addressed.
Agronomy 2023, 13(6), 1566; https://doi.org/10.3390/agronomy13061566
Submission received: 8 May 2023 / Revised: 5 June 2023 / Accepted: 6 June 2023 / Published: 8 June 2023
(This article belongs to the Special Issue Sustainable Resource Management for Crop Production and Quality)

Abstract

:
Peanut is a staple crop suitable for mechanized harvest and a source of plant proteins and fatty acids. It is widespread in Asia and North America, while there is limited cultivation in Europe despite potentially favorable climatic conditions. To test the adaptability of peanut in the Mediterranean area, a two-year field trial was carried out with one Spanish-type and one Virginia-type genotype cultivated under two water regimes (full irrigation and half irrigation supply). In order to test the response to fertilization management, three treatments were carried out, including an unfertilized control, a N-fertilized treatment, and a N-fertilized treatment inoculated with a commercial mixture of plant-growth promoting microorganisms, including two Bacillus species, Trichoderma and arbuscular mycorrhizal fungi (AMF). Microbiological soil analysis assessed the robustness of bacilli and their viability in soil. The Virginia-type genotype showed a better adaptability, with a positive response to irrigation and biofertilization. In particular, the inoculated treatment led to the highest agricultural crop water productivity, with important implications for sustainability. The impact of agronomic strategies was evaluated also in relation to storage proteins. The expression of 7s vicilin fraction showed a variability associated with water supply.

1. Introduction

Peanut or groundnut (Arachis hypogaea L.) is a macrothermal crop largely cultivated in Africa, the United States, and Asia, with a great economic importance for China, India, Nigeria, and United States [1]. Peanut is an allotetraploid (2n = 4x = 40, AABB) species that belongs to the botanical family of Fabaceae or Leguminosae, originating in America and then disseminated in the world [2]. It represents one of the main oilseed crops, containing about twelve fatty acids, mostly (about 80%) as oleic acid (18:1) and linoleic acid (18:2) [3]; the seeds are also a source of proteins [4].
Breeding activity across the years has been mainly focused on improving drought tolerance or productive traits (number of fertile flowers) and assimilating partitioning. Other traits of genetic improvement rely on chemical quality, including the release of high oleic cultivars, also characterized by abiotic and biotic stress resistance [5]. Marketable quality peanut genotypes are grouped into Virginia, Spanish, Valencia, and Runner types. Runner and Virginia are classified as Arachis hypogaea L. subspecies hypogaea, Spanish as subspecies vulgaris and Valencia as subspecies fastigiata. In USA, 80% and 15% of peanut production is represented by Runner and Virginia cultivars, respectively [6]. Peanut consumption is as whole product, roasted for snacks, and for oil extraction and butter. Peanut products can positively affect human health for their lipidic profiles and bioactive compounds, mostly accumulated in the skin; on the other hand, peanut products are a valuable source of essential amino acids and proteins, including 7s vicilin-like, 11s legumin, and 2s albumin [4,7]. Peanut proteins include a list of 13 allergens [8], though, with a sensitization rate nearly 1% of children and 0.6% of adults in the populations of Western countries [9].
The cultivation of peanuts is not widespread in the Mediterranean environment, despite favorable climatic conditions [10]. Temperature and soil texture can drastically affect crop performance, with an impact on yield and quality. The adaptation of genetic material to a specific environment requires an agronomic optimization that takes into account phenological aspects, water use, and plant nutrition [11]. The assessment of the physiological traits of crops is crucial to identifying the best genotypes and agronomic strategies to improve peanut productivity and sustainability [12]. The use of canopy spectral signature and of vegetation indices can be promising in order to assess abiotic/biotic stress conditions and to predict yield-related traits [13,14]. The optimization of water management, in terms of irrigation strategies and efficient amount, is fundamental in order to promote peanut cultivation in high-water-demanding environments [10,15,16].
The inoculation of plant growth-promoting microorganisms, including bacteria and fungi, is suggested as a smart strategy to mitigate abiotic stresses and improve quality also in peanuts [17,18,19]. This could be of particular interest to improve water use under future climate change scenarios [17]. However, while most of these studies are conducted under controlled conditions, few observations were reported in Mediterranean environments.
To this purpose, the hypothesis of the current study was to test: (a) if peanut could be introduced in Mediterranean environment (South Italy); (b) the yield response in terms of agricultural water productivity (AWP) in order to reduce water consumption without affecting yield; (c) if inoculation with plant-promoting microorganisms can improve peanut adaptability in Mediterranean environment; (d) if canopy spectral phenotyping may work as a descriptor of crop physiological status, and which vegetation index could best predict yield related traits; and (e) if a variability in the main allergen storage proteins exists due to experimental factors. To this aim, two peanut genotypes (a Virginia and a Spanish type) were cultivated in two consecutive crop years in South Italy (Foggia) under two different irrigation levels (full and half irrigation rates), and plants were also subjected to the application of biofertilizer treatment in order to assess the response of genotypes in terms of yield and AWP. The relationships of yield and AWP with the main vegetation indices were also explored. In addition, analysis of storage protein was carried out to assess variations for the main peanut storage proteins.

2. Materials and Methods

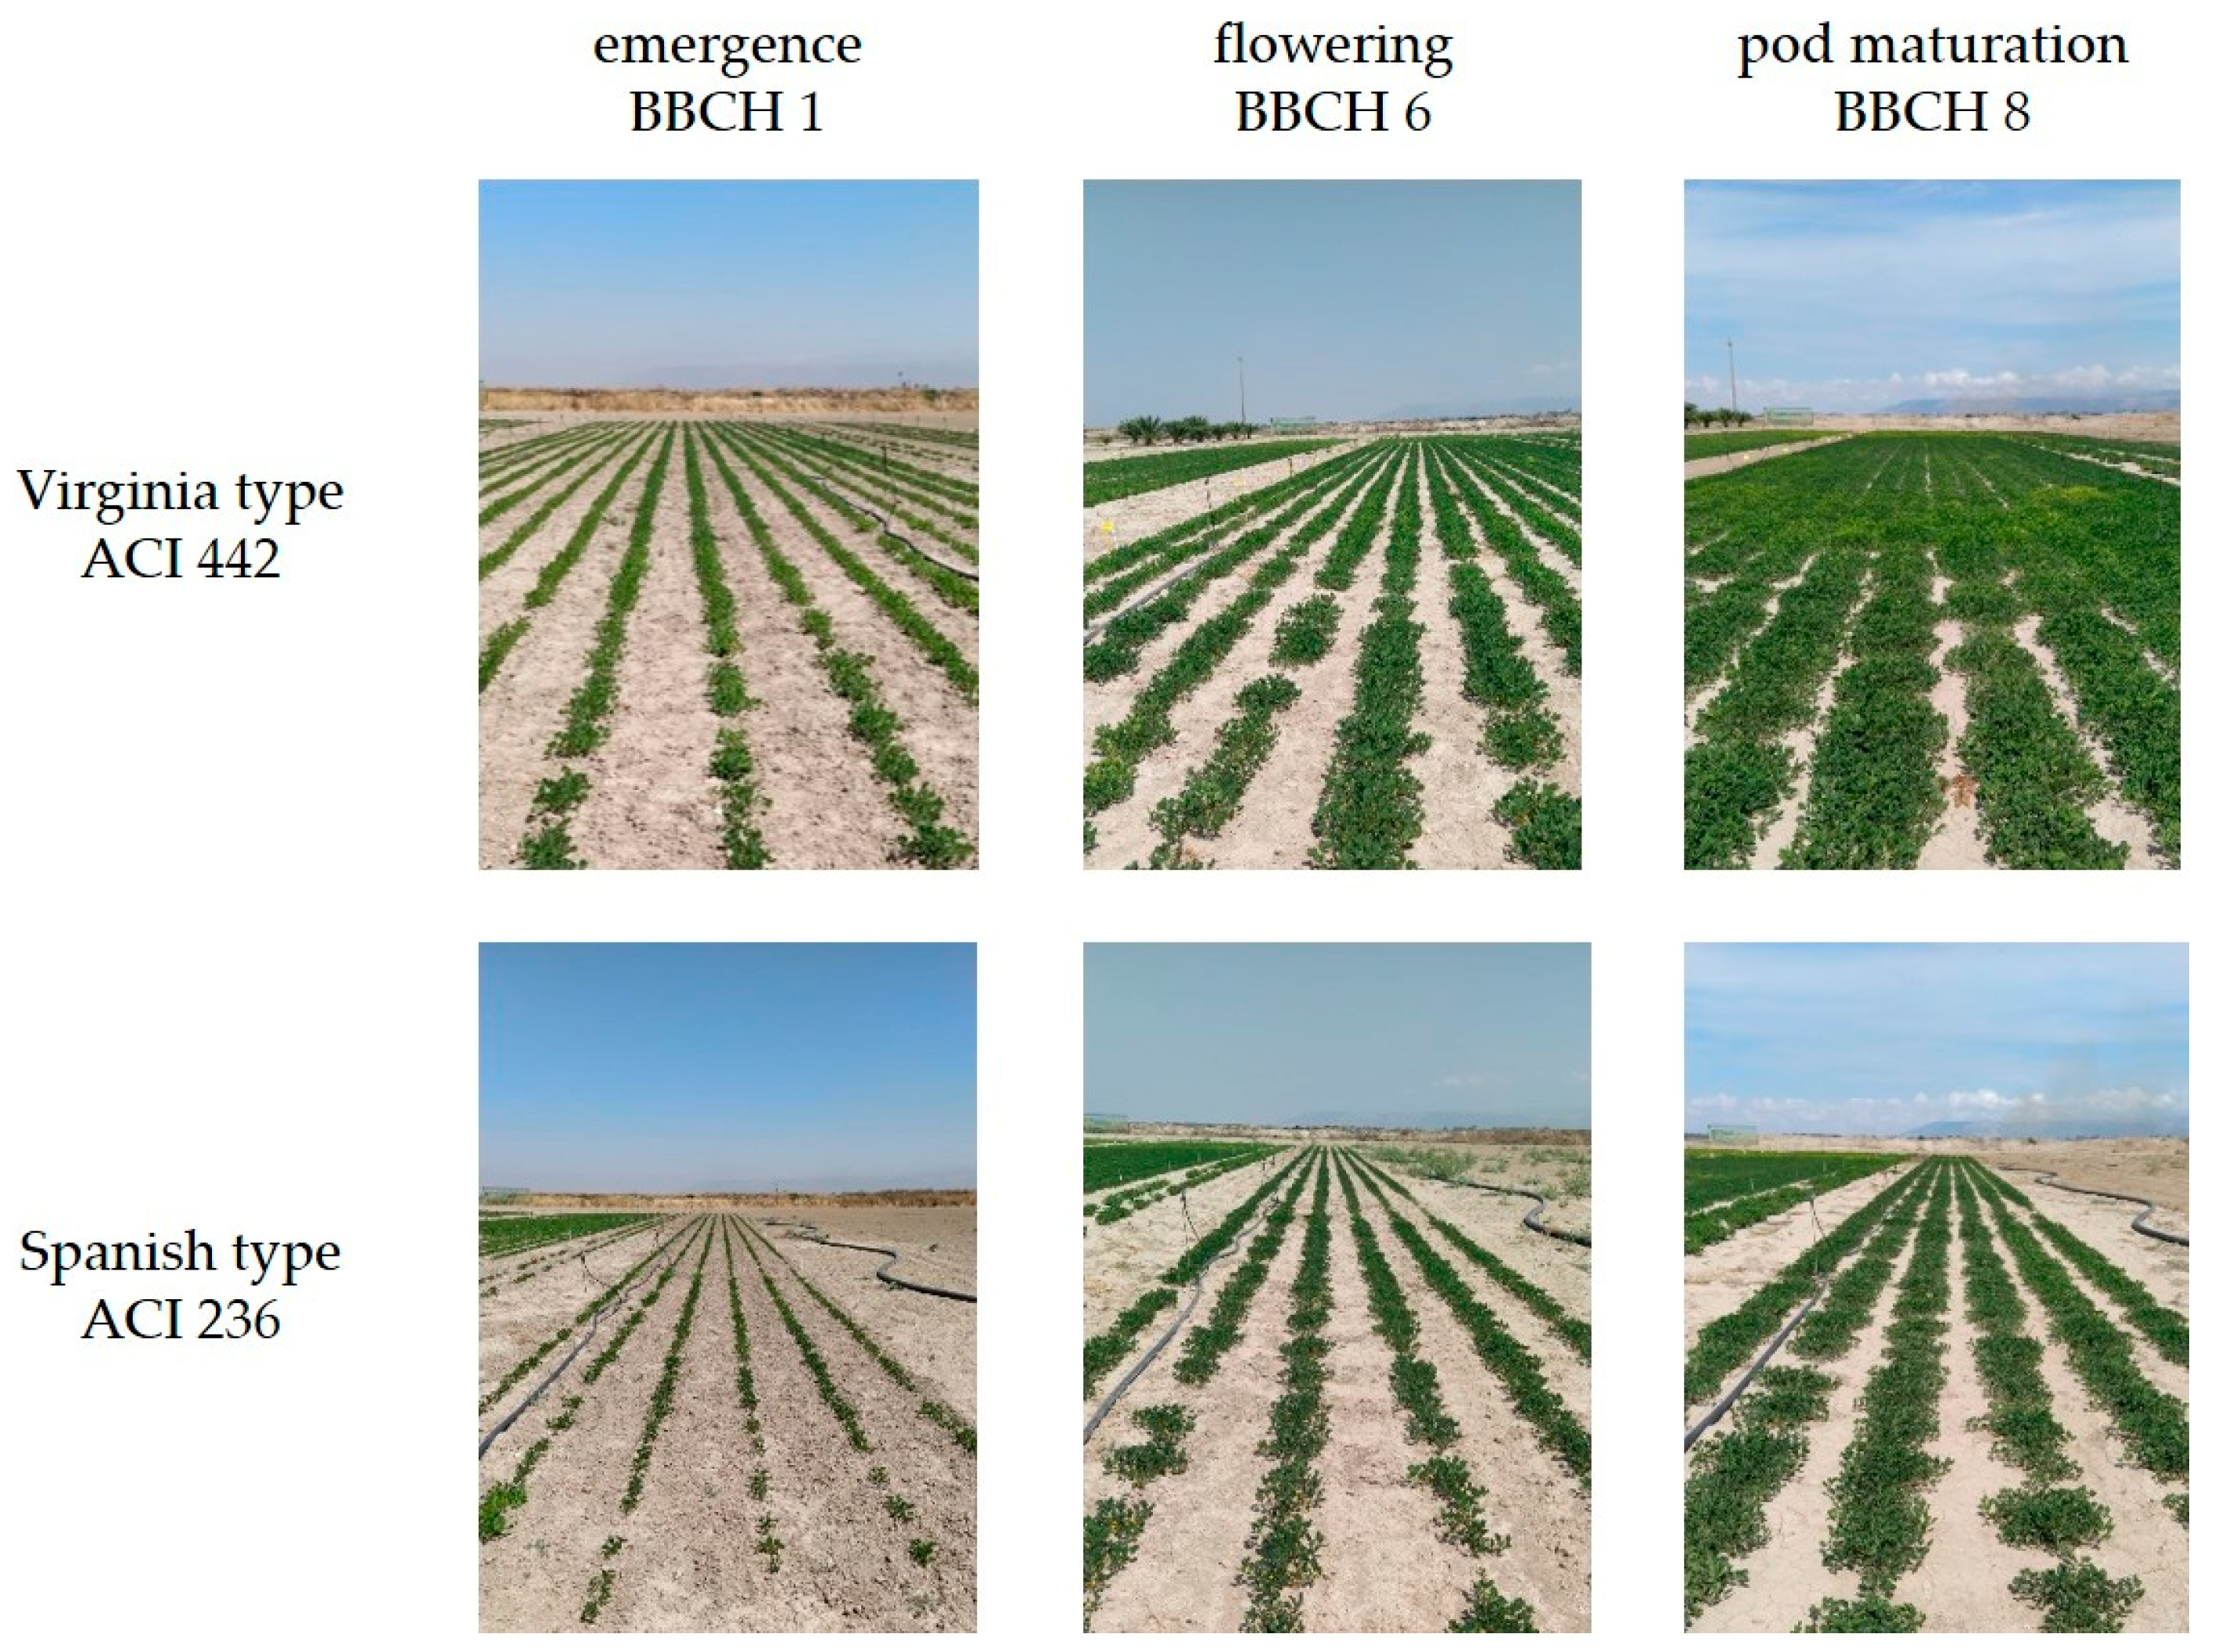
2.1. Field Experiments

On farm field experiments were carried out at Foggia (Italy, 41°30′40.109″ N, 15°40′28.101″ E, at 37 m a.s.l.) during 2021 and 2022. Weather data were recorded from a farm weather station; details are reported in Table 1 including long-term (LT) data showing a trend typical of the Mediterranean climate. The soil of the experiment was loam, according to USDA classification, with 46.2% sand, 36.1% silt, and 17.7% clay, respectively. The soil field capacity (−0.03 MPa) and wilting point (−1.5 MPa) were at 31.8% and 17.1% of volumetric soil moisture, with 7.7 pH, 450 ms cm−1 of conductivity, 0.155% of total N, 72.5 ppm of available P2O5, and 1.94% organic matter. Soil preparation was carried out with ploughing followed by rotary harrow.
Two peanut (Arachis hypogaea L.) genotypes were sown: a Virginia-type and a Spanish-type (ACI 442 and ACI 236, respectively, released by AgResearch Consultants Inc. ACI, Tifton, GA, USA), as shown in Figure 1. Plant material was chosen from high yielding and high oleic varieties adapted to hot-dry conditions (South West USA). Sowing was carried out at 20 May 2021 and 16 May 2022, with a seed density of 14 seed m−2, with inter-row and intra-row distances of 70 cm and 10 cm, respectively. Plot size was of four row width (2.1 m) and 6.0 m long (12.6 m2). Weed control was carried out with mechanical inter-row weeding and manually; no fungicide treatment was required. Phosphorous was applied at sowing at a rate of 100 kg ha−1 as ammonium superphosphate. Three different fertilization treatments were adopted in the experiments: T1 as a control with no basal N fertilization; T2 with the application of 40 kg ha−1 of N (urea); T3 with the application of 40 kg ha−1 of N (urea) and a spray inoculation of a commercial biofertilizer (Bottos Mycopower, 0.4 g m−2) and a mixture of arbuscular mycorrhizal fungi (AMF) and plant growth promoting bacteria (PGPB), including Glomus intraradices, Glomus mosseae, Glomus deserticola, 10%; Trichoderma asperellum, Bacillus pumilus, and Bacillus coagulans (106 CFU g−1). Growth stages (flowering, pod setting, pod filling, and maturity) were recorded in terms of days after sowing (DAS) and growing degree days (°C d), as reported in Figure 2, with a mean base temperature of 10 °C [18]. Plants were manually harvested for yield determination at 22 November 2021 (182 DAS) and at 21 October 2022 (158 DAS). Peanut pods were collected from 20 randomly sampled plants, sun dried for 2–4 days, oven dried at 60 °C for 24 h, and weighted to record the dry yield (10% of moisture). Yield components were then calculated, including seed yield, pods per plant, and seed weight. Shelling percentage was calculated as the ratio between seed yield to pod yield multiplied per 100. Protein content (PC) was assessed by near infrared spectroscopy NIR (Foss 1241).

2.2. Crop Physiological Measurements

At ripeness (126 and 130 DAS for 2021 and 2022, respectively), hyperspectral crop phenotyping was carried out by a field spectroradiometer (range 350–820 nm, Apogee SS-110) from 1 m above canopy under clear sky conditions at around noon. Crop reflectance in the narrow bands of blue, green, red, far red, and near infrared were recorded (Figure 3). Normalized difference vegetation index (NDVI) and optimized soil adjusted vegetation index (OSAVI) were calculated [19].

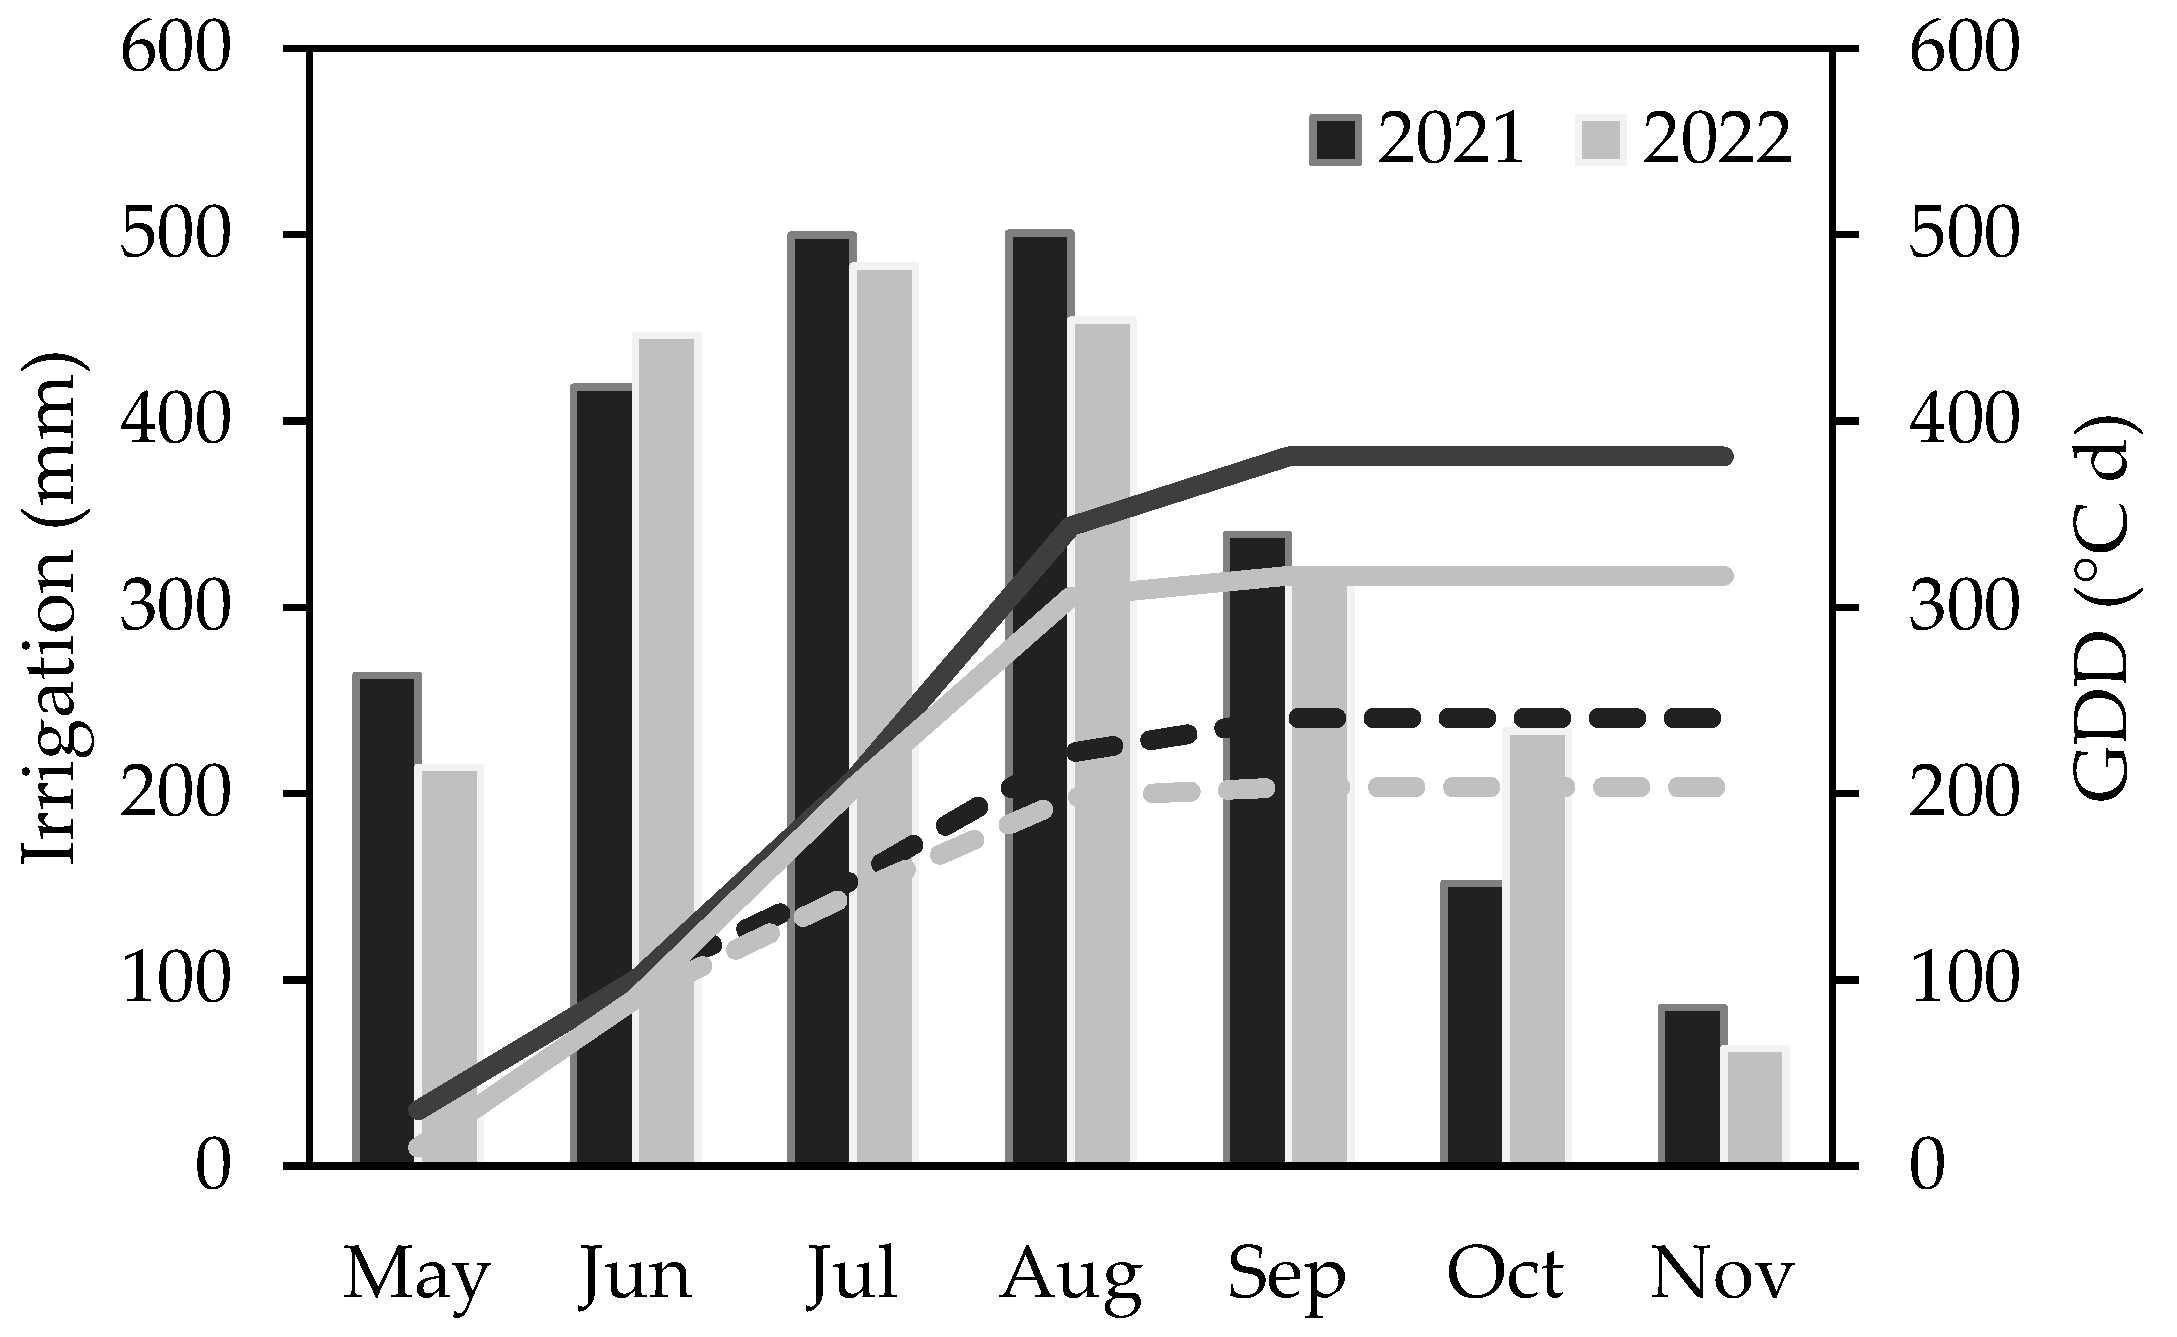
2.3. Irrigation Management and Agricultural Water Productivity

Sprinkler irrigation (irrigation efficiency of 0.7) was scheduled weekly, and replenished 50% (W1) and 100% (W2) of crop evapotranspiration (ET) after subtracting effective rainfall (Figure 1). A starter irrigation (100 mm) was provided in the first month and then the two water regimes were differentiated, as reported in Table 2. Evapotranspiration was calculated according to the following equation: ET = PET × Kc, with PET as potential evapotranspiration, Kc as the crop coefficient equal to 0.40, 1.15, and 0.6 at the initial, mid-season, and late stage, respectively, according to FAO56 handbook for Mediterranean environment [20]. Water use efficiency was expressed in terms of agricultural water productivity (AWP), calculated as the ratio between seed yield and the sum of cumulated precipitation and irrigation amounts during crop growth [21].

2.4. Microbiological Analyses of Soil

Soil samples were analyzed immediately before the inoculation of bioformulates (May), and immediately before harvesting (October–November). For analyses, 25 g of each sample were diluted with 225 mL of sterile saline solution (0.9% NaCl) and mixed on a horbital shaker at 300 rpm for 30 min; after that, decimal serial dilutions were carried out in saline solution and plated onto appropriate medium to select and count Mesophilic bacteria (Plate Count Agar supplemented with cycloheximide, 0.17 g L−1; 30 °C for 48 h); pseudomonads (Pseudomonas Agar Base supplemented with Pseudomonas Selective Supplement; 25 °C for 48–72 h); spore-formers (Plate Count Agar, after heat-treating the dilutions at 80 °C for 10 min; the plates were incubated at 30 °C for 24 h); actinobacteria (Bacteriological Peptone, 10 g L−1; Beef Extract, 5 g L−1; NaCl, 5 g L−1; Glycerol, 10 g L−1; Agar Technical n. 3, 20 g L−1; pH 7.00–7.20; 22–24 °C for 7–14 days); Enterobacteriaceae (Violet Red Bile Agar, incubated at 37 °C for 18–24 h); total soil microorganisms (PCA, 22 °C for 3–4 days); yeasts (Yeast peptone Glucose Agar, supplemented with chloramphenicol, 0.1 g L−1; 25 °C for 3–4 days); moulds (Potato Dextrose Agar, PDA; 25 °C for 5 days); and Nitrogen fixing bacteria on Brown medium [22], incubated at 25 °C for 5 days. All media and supplements were from Oxoid (Milan, Italy). Microbiological counts were confirmed by a random selection of colonies on plates, microscope examination, Gram staining, a test for spore production, and catalase and oxidase tests.

2.5. Analysis of Peanut Storage Protein Composition

Oil-rich seeds were ground and defatted with n-hexane [23]. From 50 mg of defatted flour, protein extraction was carried out with 1 mL of extraxction buffer (50 mM Tris–HCl, pH 7.8, 5 mM EDTA, 0.1% 1,4-dithiothreitol) for 1 h at room temperature with constant mixing, and then centrifuged at 10,000× g for 30 min. For each sample, 10 µL of extracted proteins were separated using a BioRad Mini Protean II system (Bio-Rad, Hercules, CA, USA) with precast acrylamide gels. Gels were stained with Coomassie Brilliant Blue G250 and digitally acquired (Epson Perfection V750pro). Molecular weight markers, from 10 to 250 kDa, were used (Bio-Rad Co, Hercules, CA, USA). Image analysis of gels was performed using ImageLab software (Bio-Rad Co, Hercules, CA, USA). The relative amount of each protein band abundance was determined by densitometric analysis and expressed as a percentage of the total protein amount in each gel lane. The expression of three groups of storage protein was assessed on denatured protein bands, namely, 7s vicilin-like (Ara h 1, ~64 kDa), 11s legumin (Ara h 3, ~49–57, 43–46, 36–39, 24 kDa), and 2s albumin (Ara h 2/6 ~15–18 kDa) [24,25].

2.6. Experimental Design and Statistical Analysis
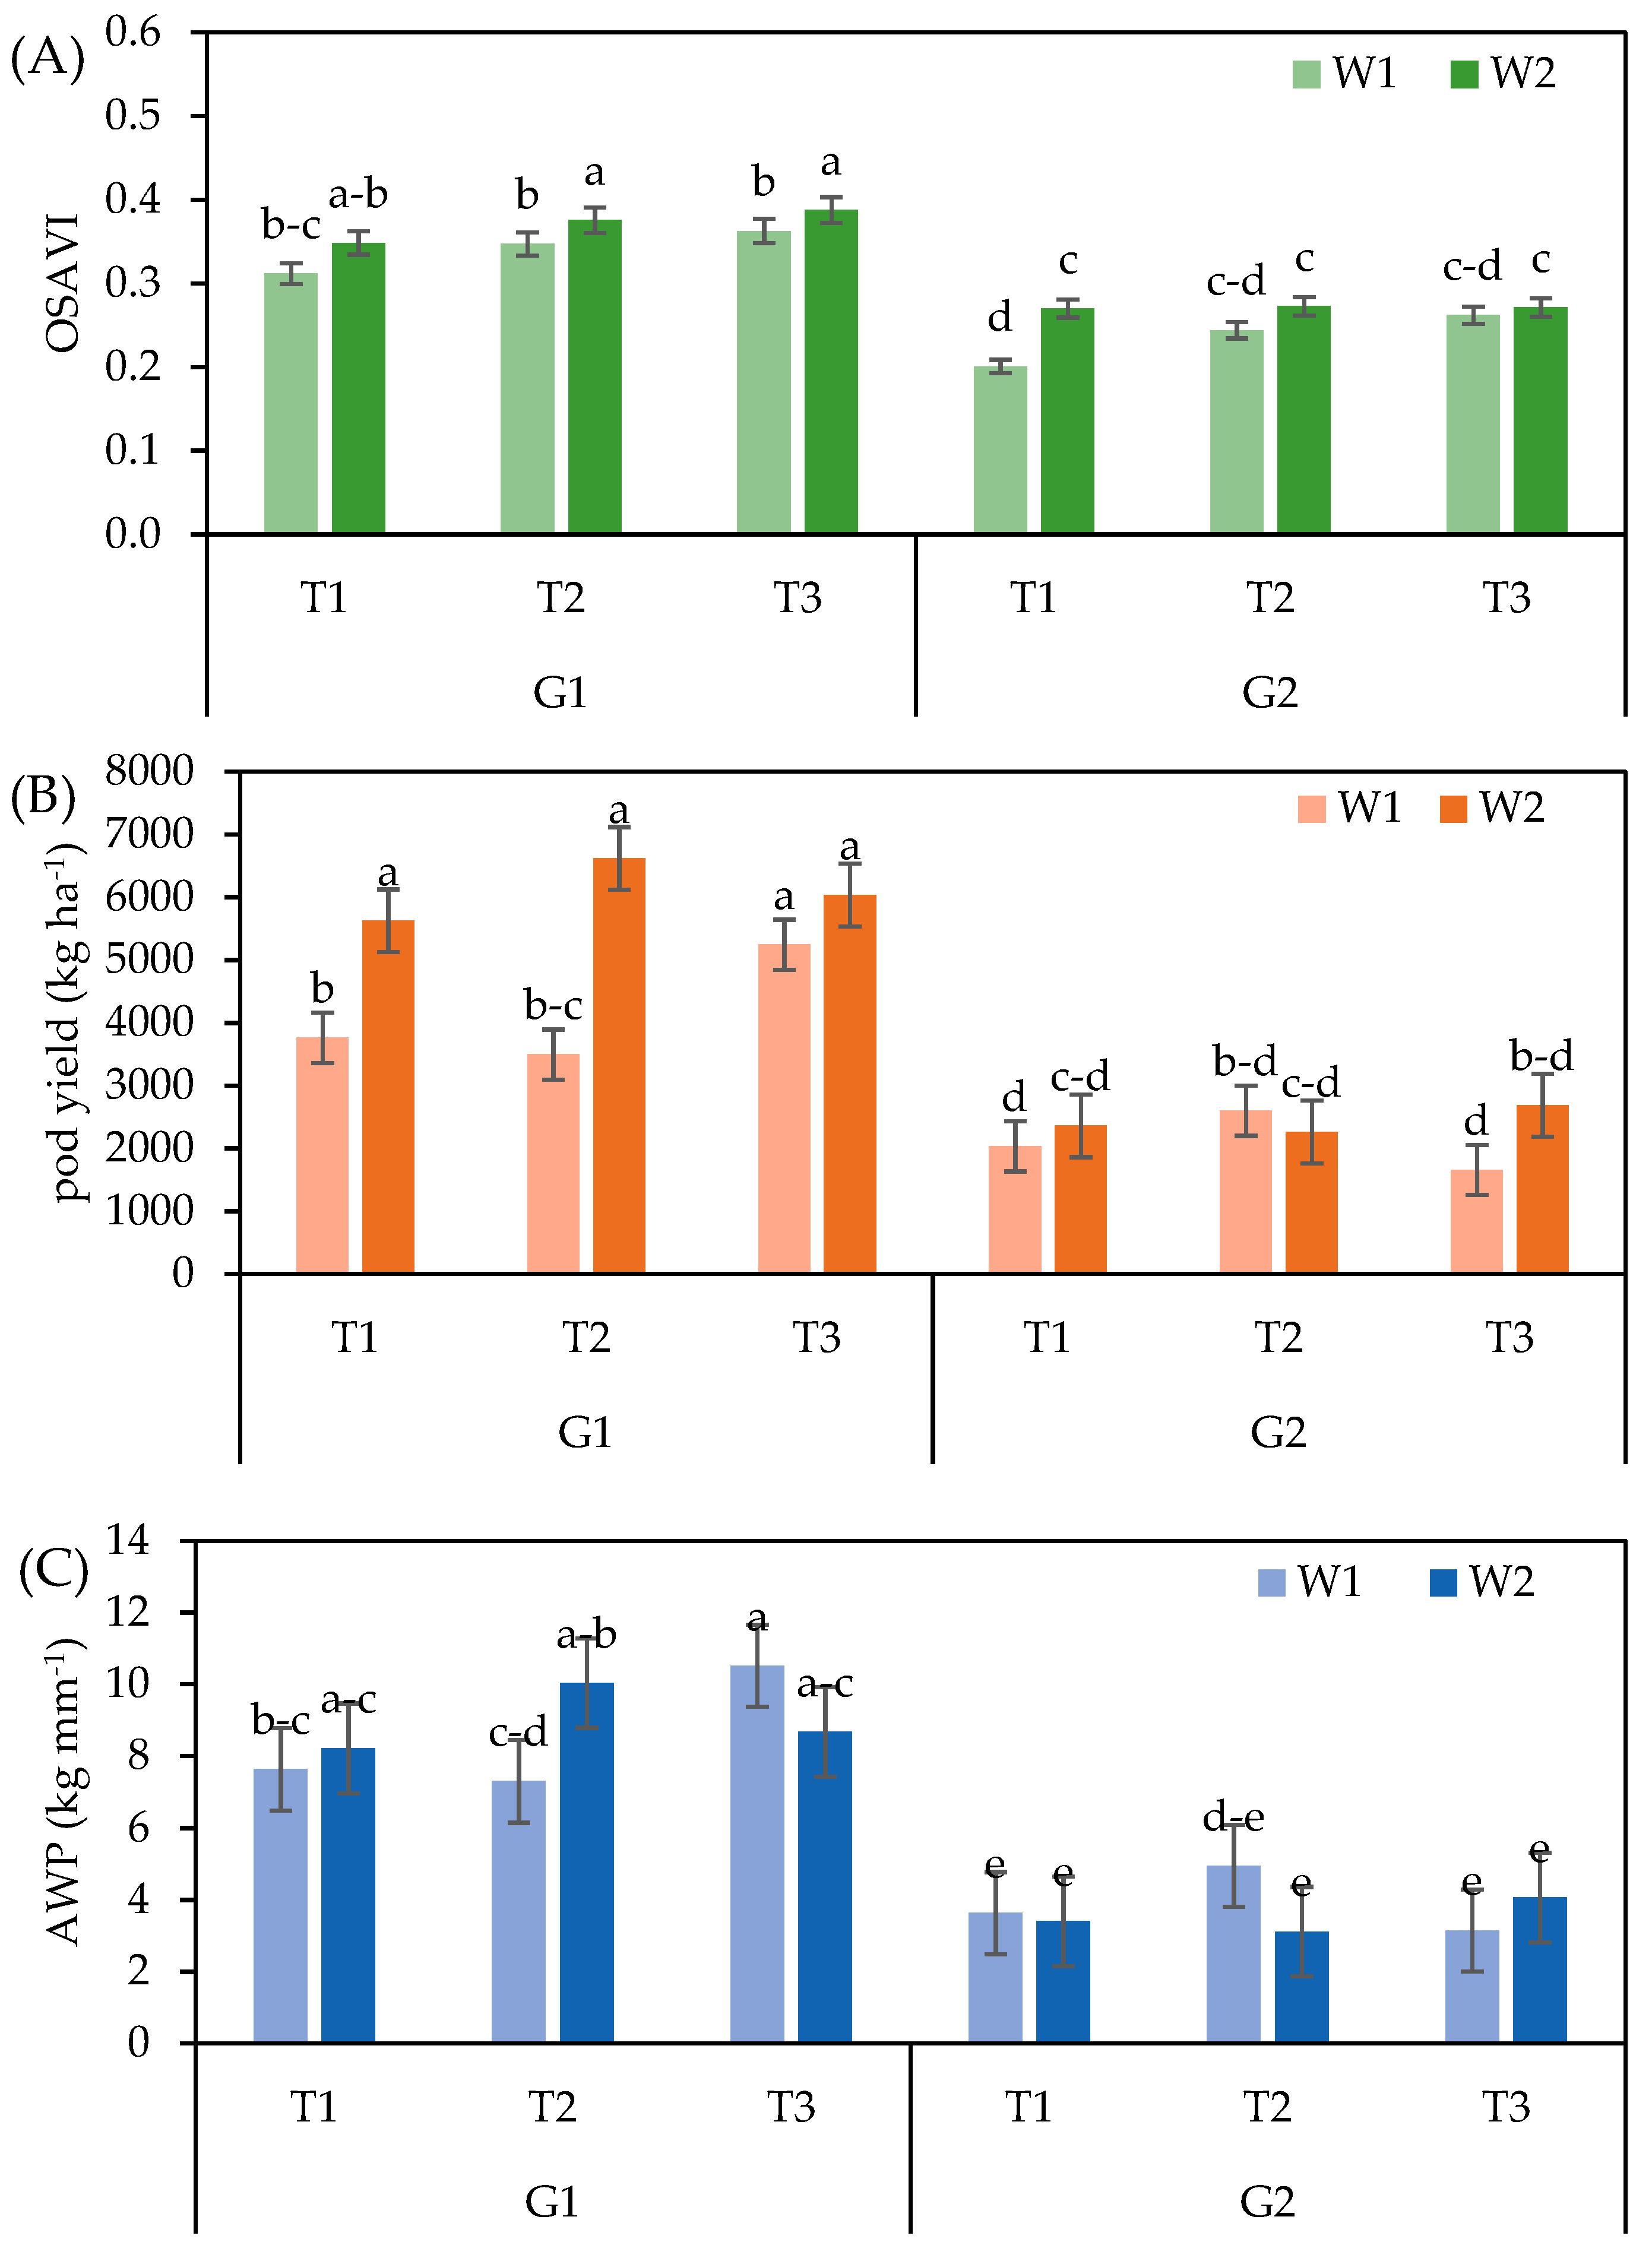
In each experiment, a split plot design was used with irrigation regimes as main plot, genotype as subplot, and fertilization treatment as sub subplot, with three repetitions. Analysis of the variance was carried out and means were separated by least significant difference according to Tukey’s test as post hoc, with a level of significance of 5% (p < 0.05). The Pearson’s multiple regression analysis and principal component analysis (PCA) on the correlation matrix were carried between investigated agronomic traits and protein composition. Statistical analysis was carried out by JMP (SAS Institute Inc., Cary, NC, USA, 2009).
Data of microbiological counts were preliminarily converted into log10, standardized as increase or decrease referring to the initial count, and then analyzed through a multivariate analysis of variance (MANOVA), using the treatment (T1, T2 or T3), the variety (G1 or G2), and the kind of microorganisms (mesophilic or spore-forming bacteria, actinobacteria, spore forming microorganisms, bacteria growing at 22 °C, or nitrogen-fixing microorganisms) as categorical predictors.

3. Results

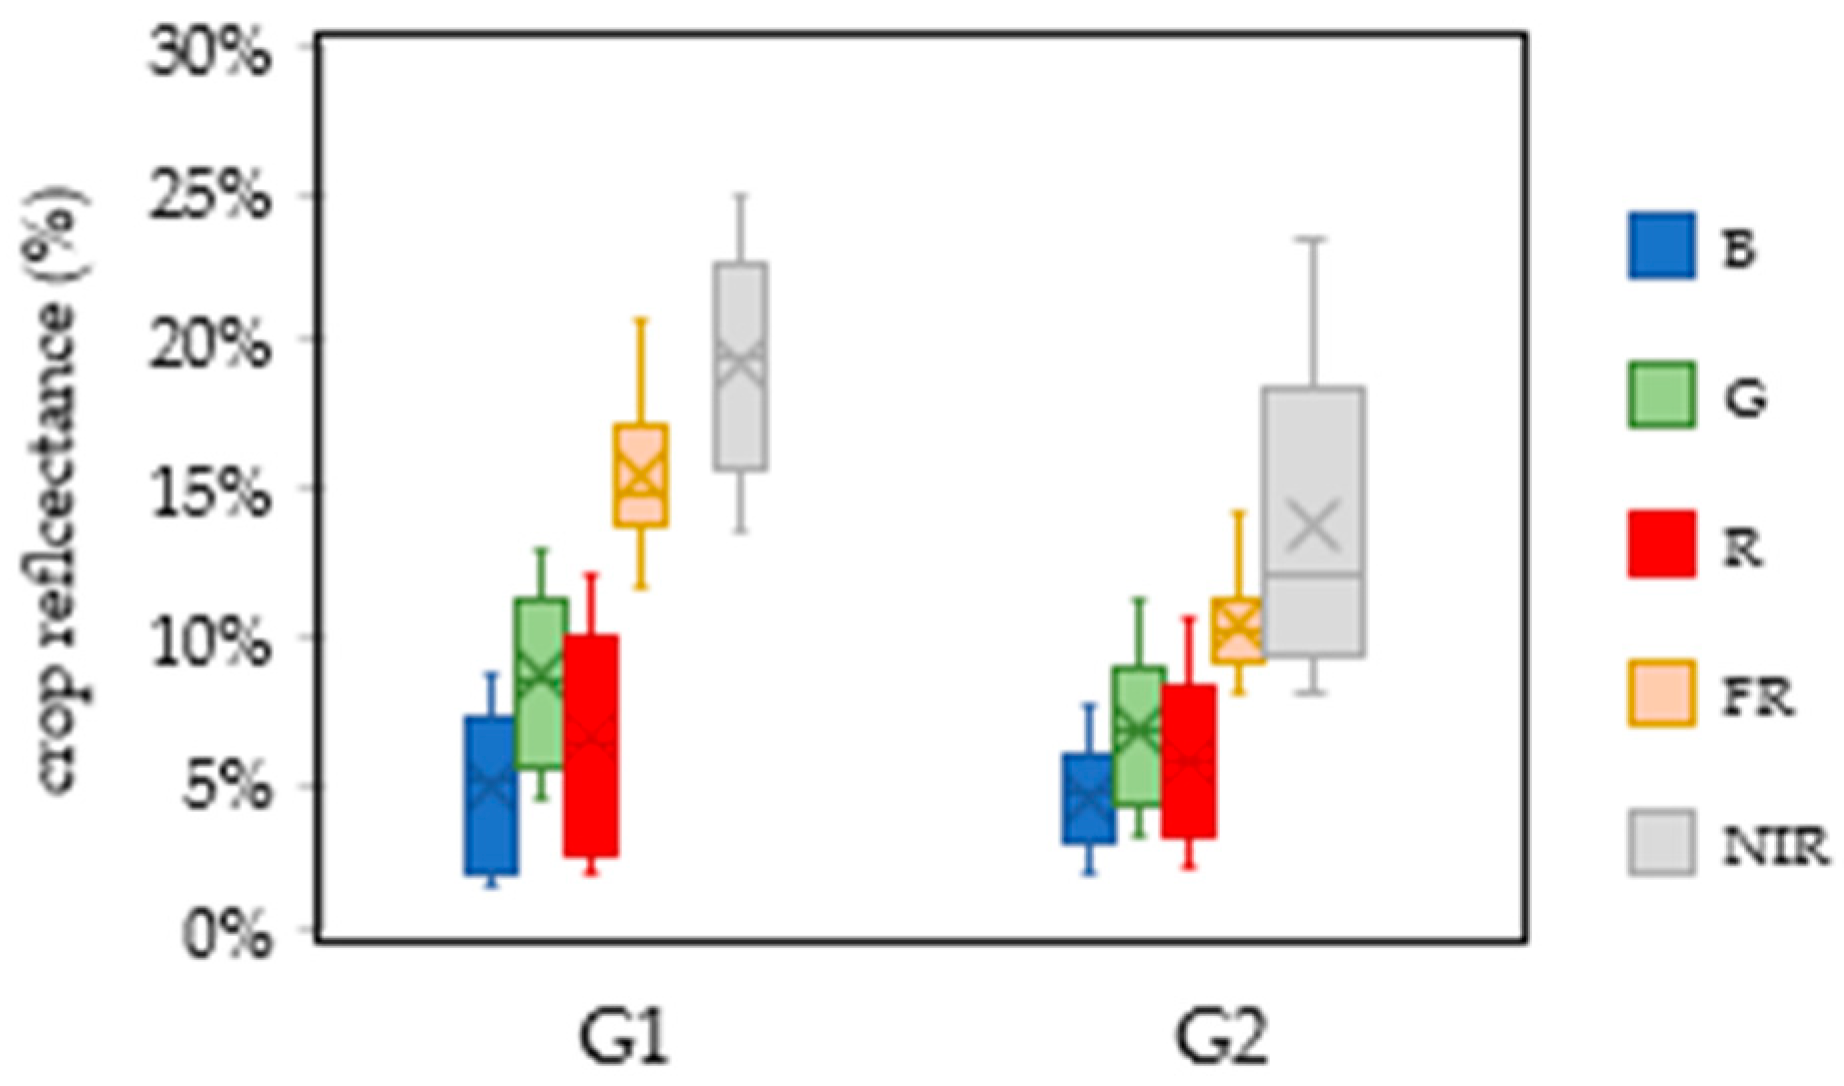
3.1. Weather Variability and Crop Physiological Response Assessed by Spectral Phenotyping

The two peanut genotypes showed a comparable canopy reflectance signature for the blue and red regions, while the green one and, especially, the far red and near infrared (NIR) regions where higher in the Virginia-type (G1, ACI 442) than in the Spanish-type (G2, ACI 236), as shown in Figure 3. All the vegetation indices (VIs) resulted significantly higher in G1 with respect to G2, confirming the observations of crop reflectance in the NIR regions. The investigated VIs well assessed crop vigor during the pod filling stage. Higher NDVI and OSAVI values were observed in the second year (Table 2). This is explained by a better initial crop development in the early stages in 2022 due to higher temperatures in May and June that affected peanut germination and expansion of leaves (Figure 2). Both NDVI and OSAVI showed higher values with W2 resulting significantly higher than under W1. The use of biofertilizers combined with basal N fertilization showed also the mean highest VIs values with respect to the control (T1) in terms of crop vigor (Table 2).
In terms of water demand, the higher maximum temperature observed in the first crop year (>35 °C, Table 1) led to a higher irrigation supply (Figure 2), especially during July-August, causing potential heat stress to canopy, and negatively influencing pod setting.

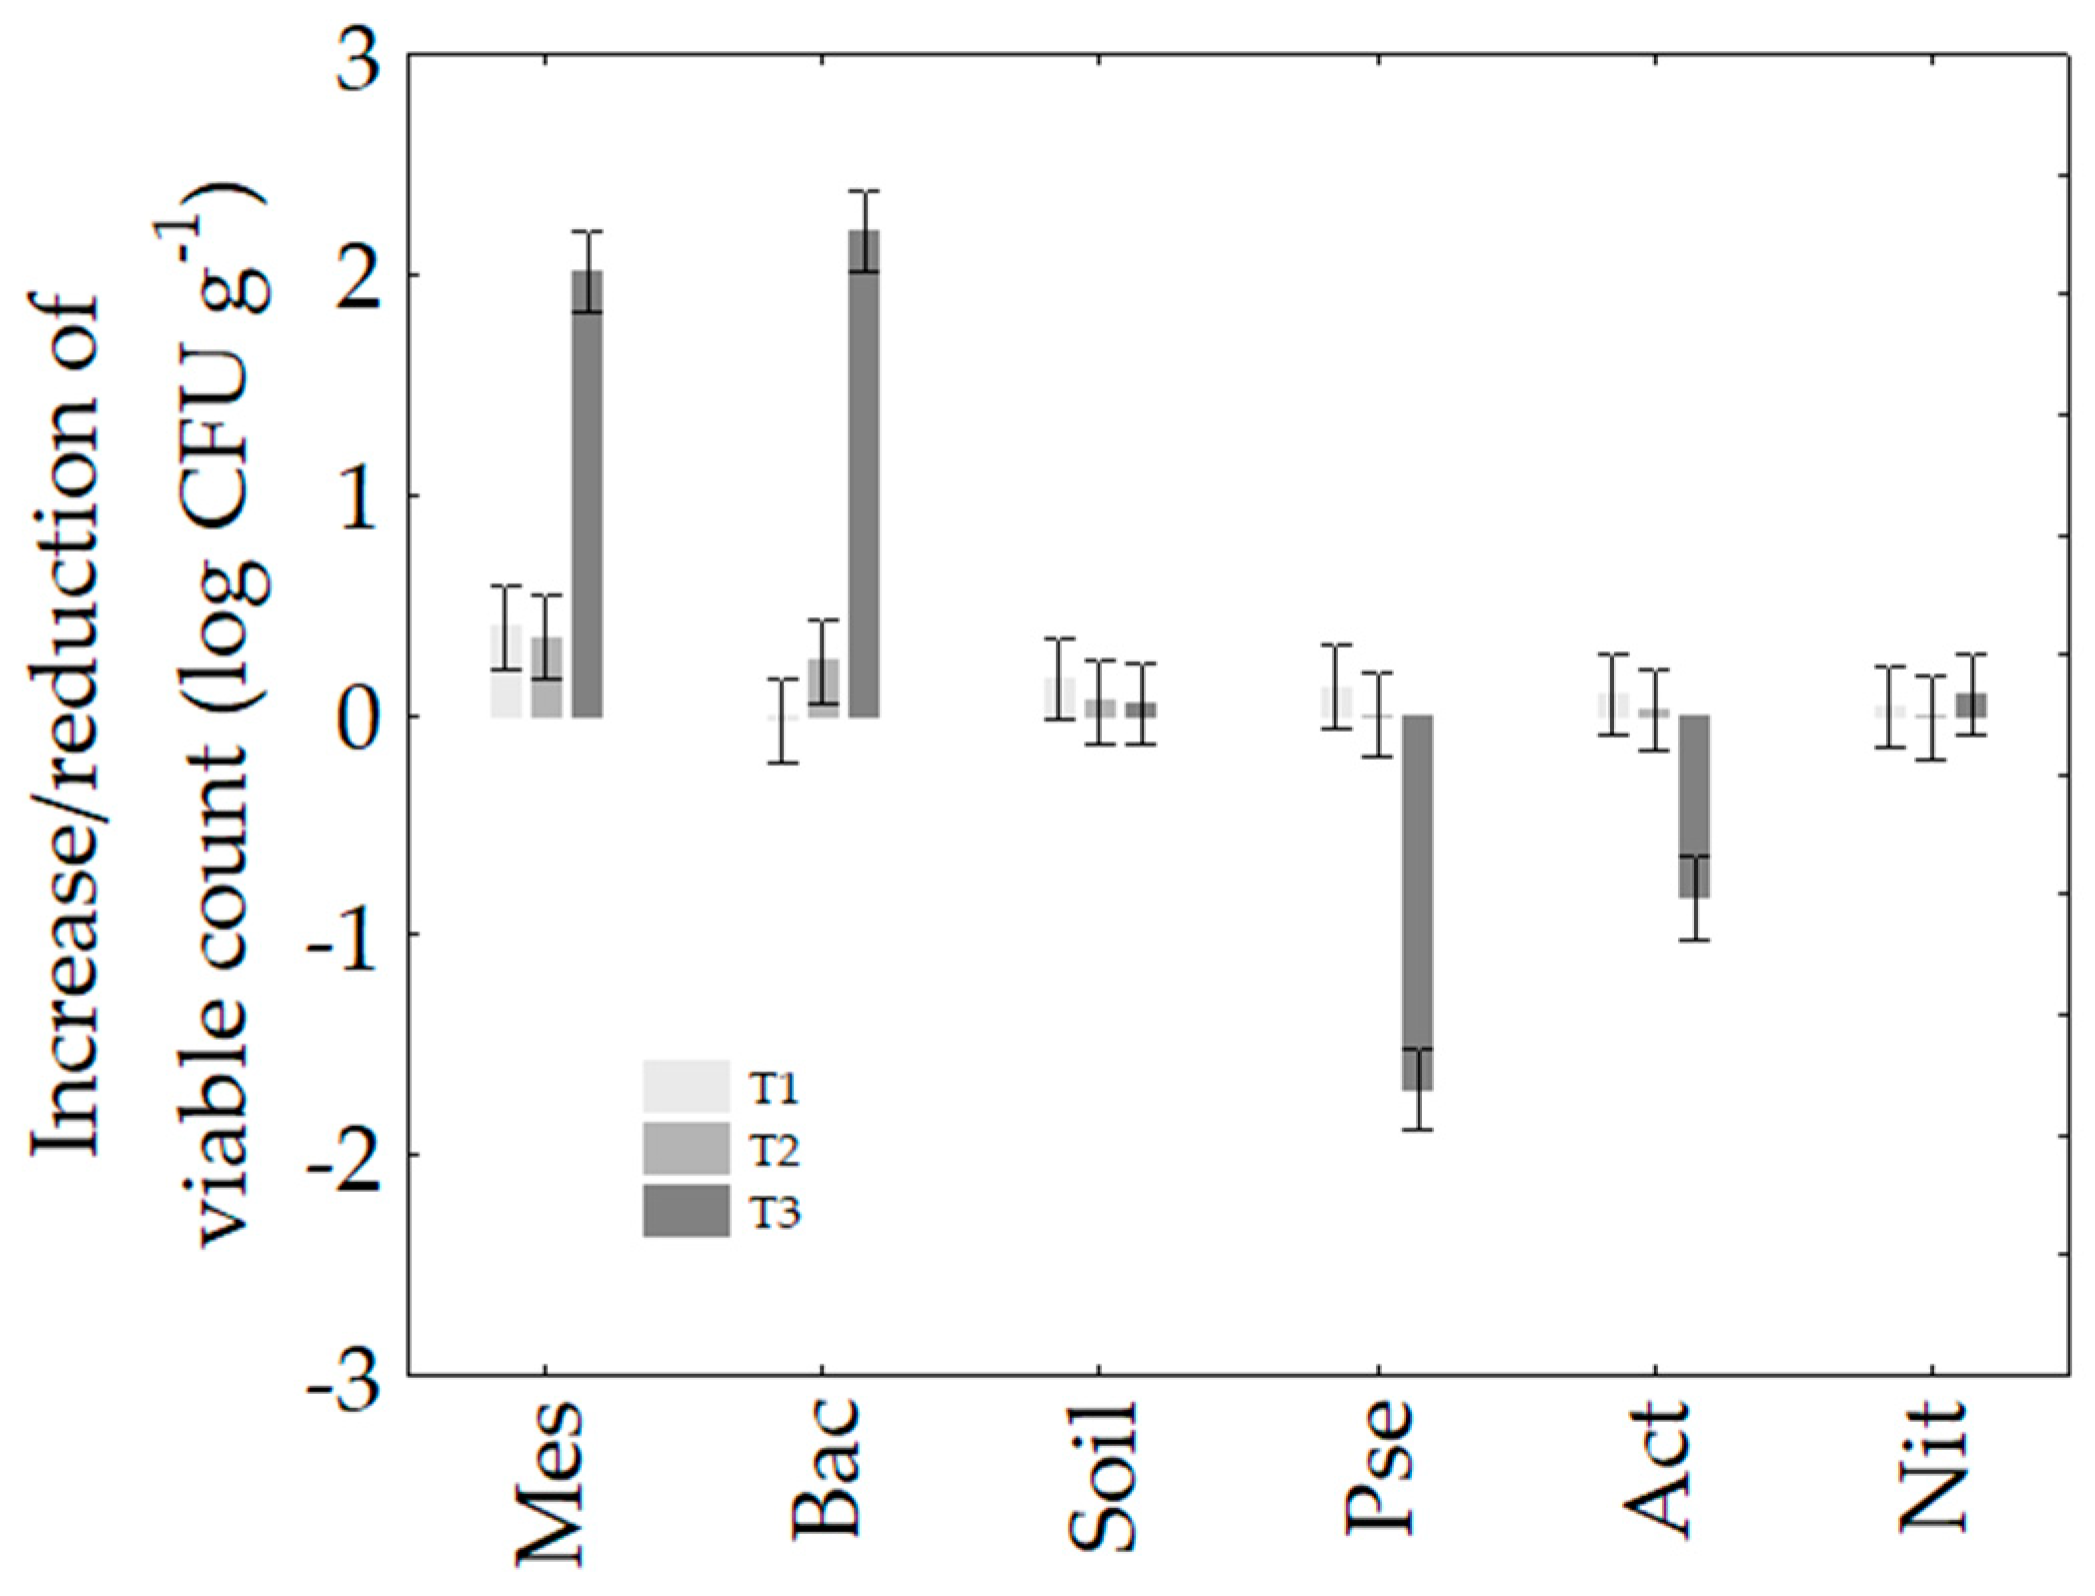
3.2. Soil Microbiology

MANOVA pointed out the significance of the kind of treatment (p, 0.001) as well as of the interaction count x microorganism (p < 0.0001), while irrigation (p, 0.235) genotype (p, 0.313) and year (p, 0.245) effects were not significant. Figure 4 shows the effects of the interaction treatment x microorganisms on the microbiological profile immediately after harvesting. The use of biofertilizer significantly affected some groups, such as spore forming bacteria, which experienced a significant increase (ca. 2.3 log CFU g−1) independently from the variety. This result suggests the ability of the Bacillus species included in the formula (B. coagulans and B. pumilus) to colonize and persist in soil. In addition, the increase in bacilli also caused a modulation of pseudomonads and actinobacteria, which showed a significant decrease (p < 0.01) by 1.7 or 1.0 log CFU g−1.
Fungi showed a slightly higher cell count (0.8 log CFU g−1) in T3 treatment (data not shown).

3.3. Peanut Yield, Yield Components and Water Productivity

Despite the higher canopy development that occurred in 2021, with respect to 2022, no significant difference between the two years was observed for pod and seed yield. The response of the main yield components was, however, different between years, with a higher number of pods per plant observed in 2021 and a higher mean seed weight observed in 2022. This was also due to the higher germination and number of plants per square meter that occurred in 2022 (data not shown), which was associated with a lower number of pods per plant. On the other hand, a significant effect of irrigation was observed with a higher yield in W2, as shown in Table 2; thus, a better AWP was observed in the second year, due to the more favorable weather conditions and lower irrigation water demand. As for yield components, seed weight and shelling significantly increased with the higher irrigation level (W2 vs. W1). The interaction between year and water regime was significant, with higher pod yield under full irrigation only in the 2022 crop year (3606 vs. 3871 kg ha−1, not significant in 2021; 2778 vs. 4502 kg ha−1, significant at p < 5% in 2022). Significant differences were found between the two genotypes, with marked higher yield, pod and seed, and all yield components for Virginia-type genotype (Table 2). In particular, the Spanish type genotype (G2) showed lower values than the Virginia-type one (G1), and also did not show a significant increase with full irrigation of pod yield (Figure 5) and its components.
In addition, the interaction G × W × T was significant for yield (Table 2), with G2 showing no significant variations due to irrigation and fertilization treatments. On the other hand, G1 showed a significant increase in pod yield with the use of plant-promoting microorganisms at W1 (+45% of pod yield of T3 vs. T2), achieving the highest productivity as at W2 (Figure 5B). Indeed, the same treatment also led to the highest AWP for G1 (Figure 5C); the same genotype also showed a significantly higher AWP than G2, and also with lower irrigation amount (Table 2). The application of basal N fertilization did not increase either peanut pod or seed yield, or AWP (Figure 5).
VIs showed good relationships with agronomic traits (Figure 5); in particular, OSAVI resulted a good predictor for seed weight (Figure 6) and then size (an important quality trait for food industry).

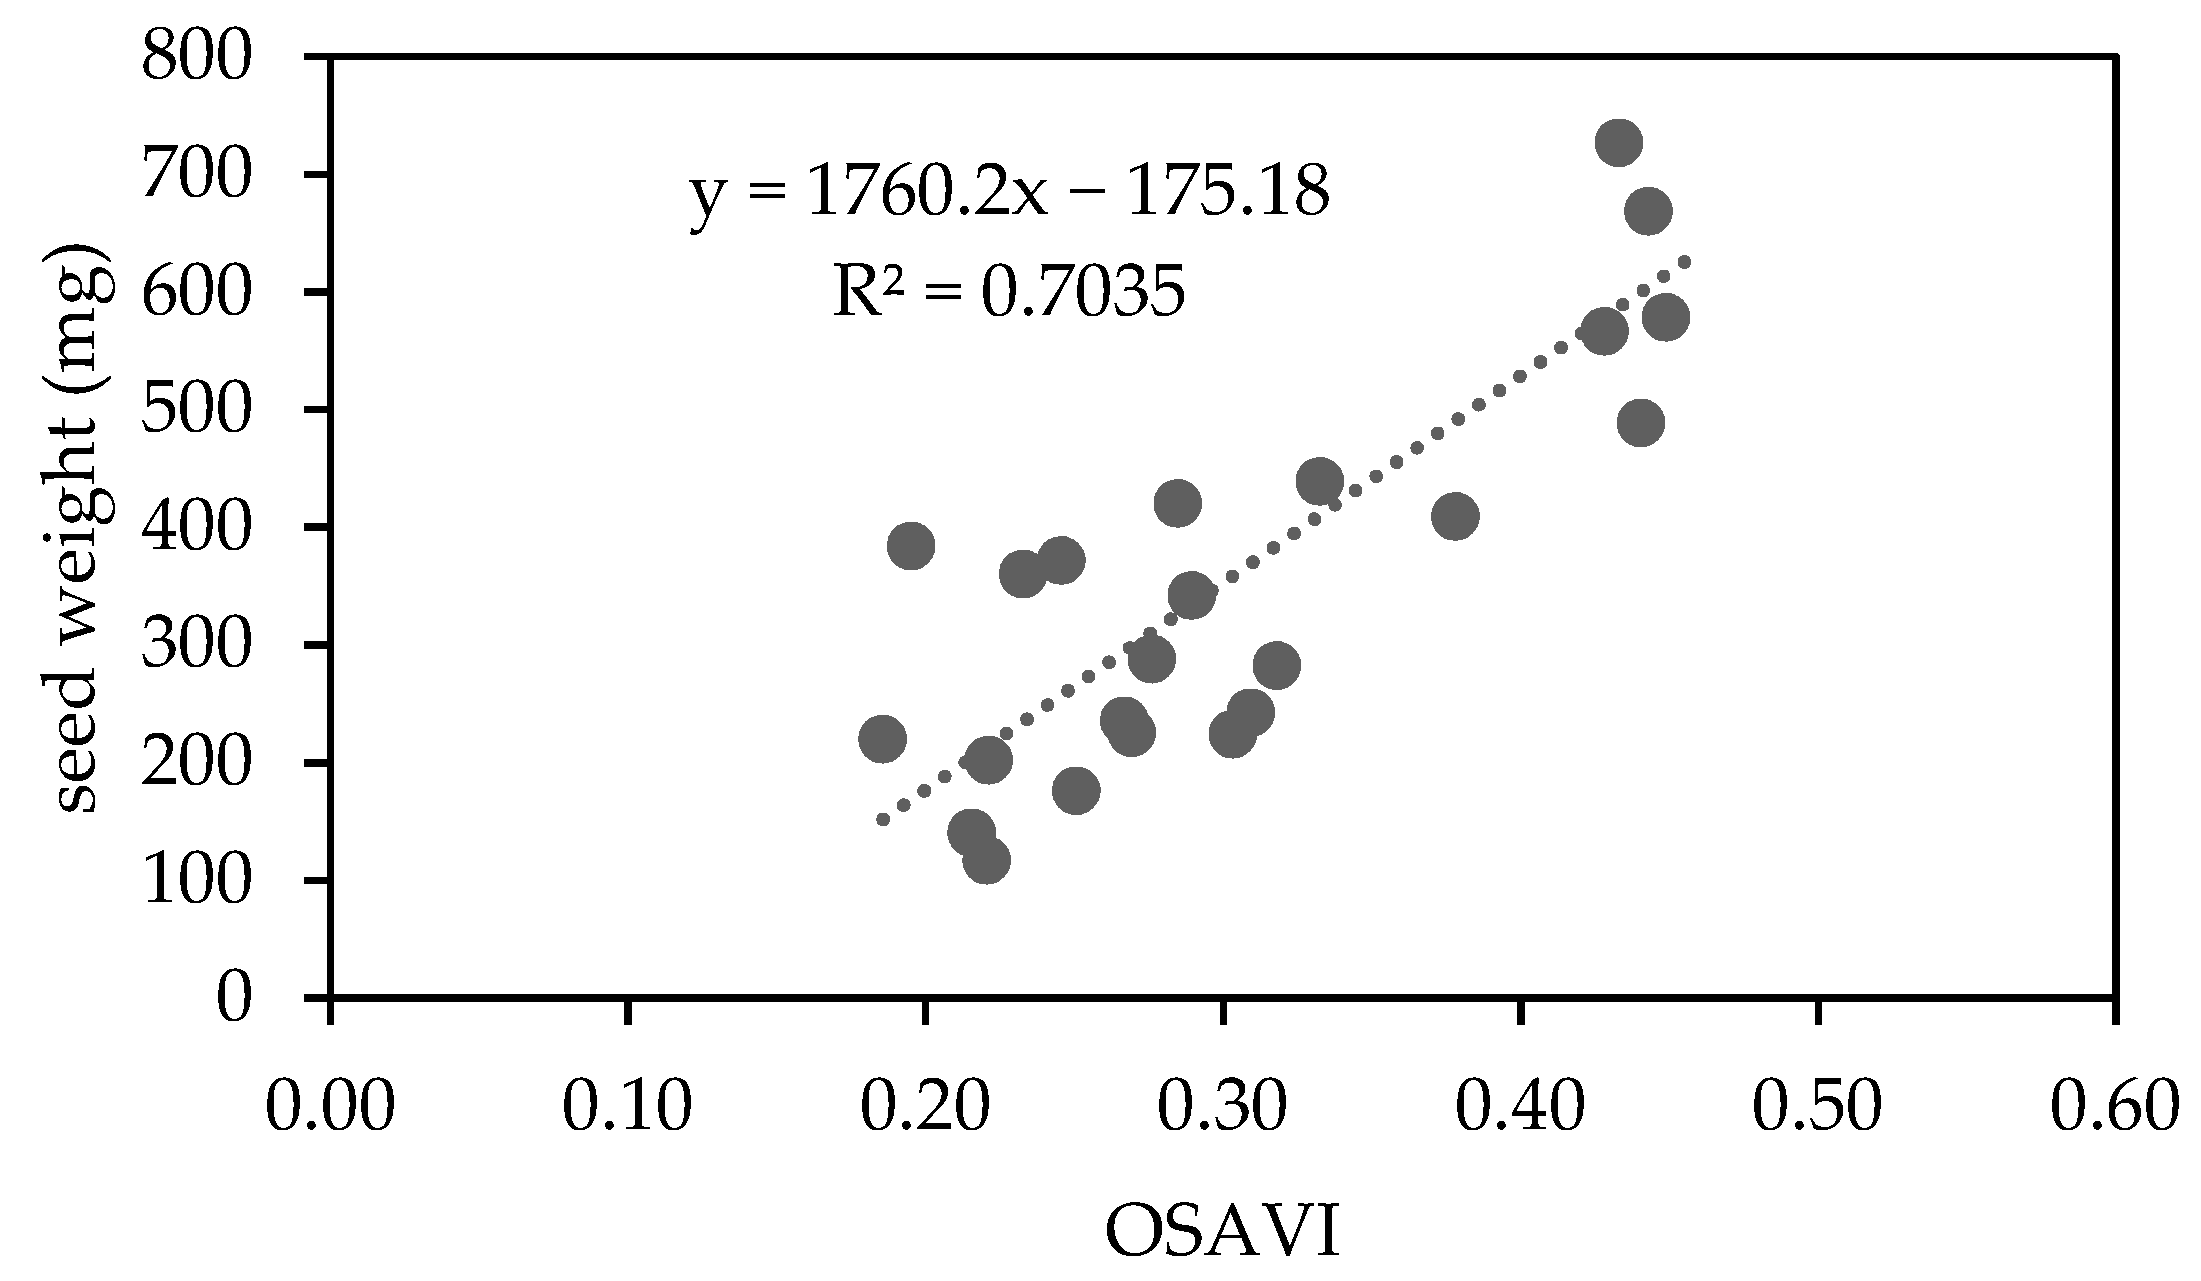
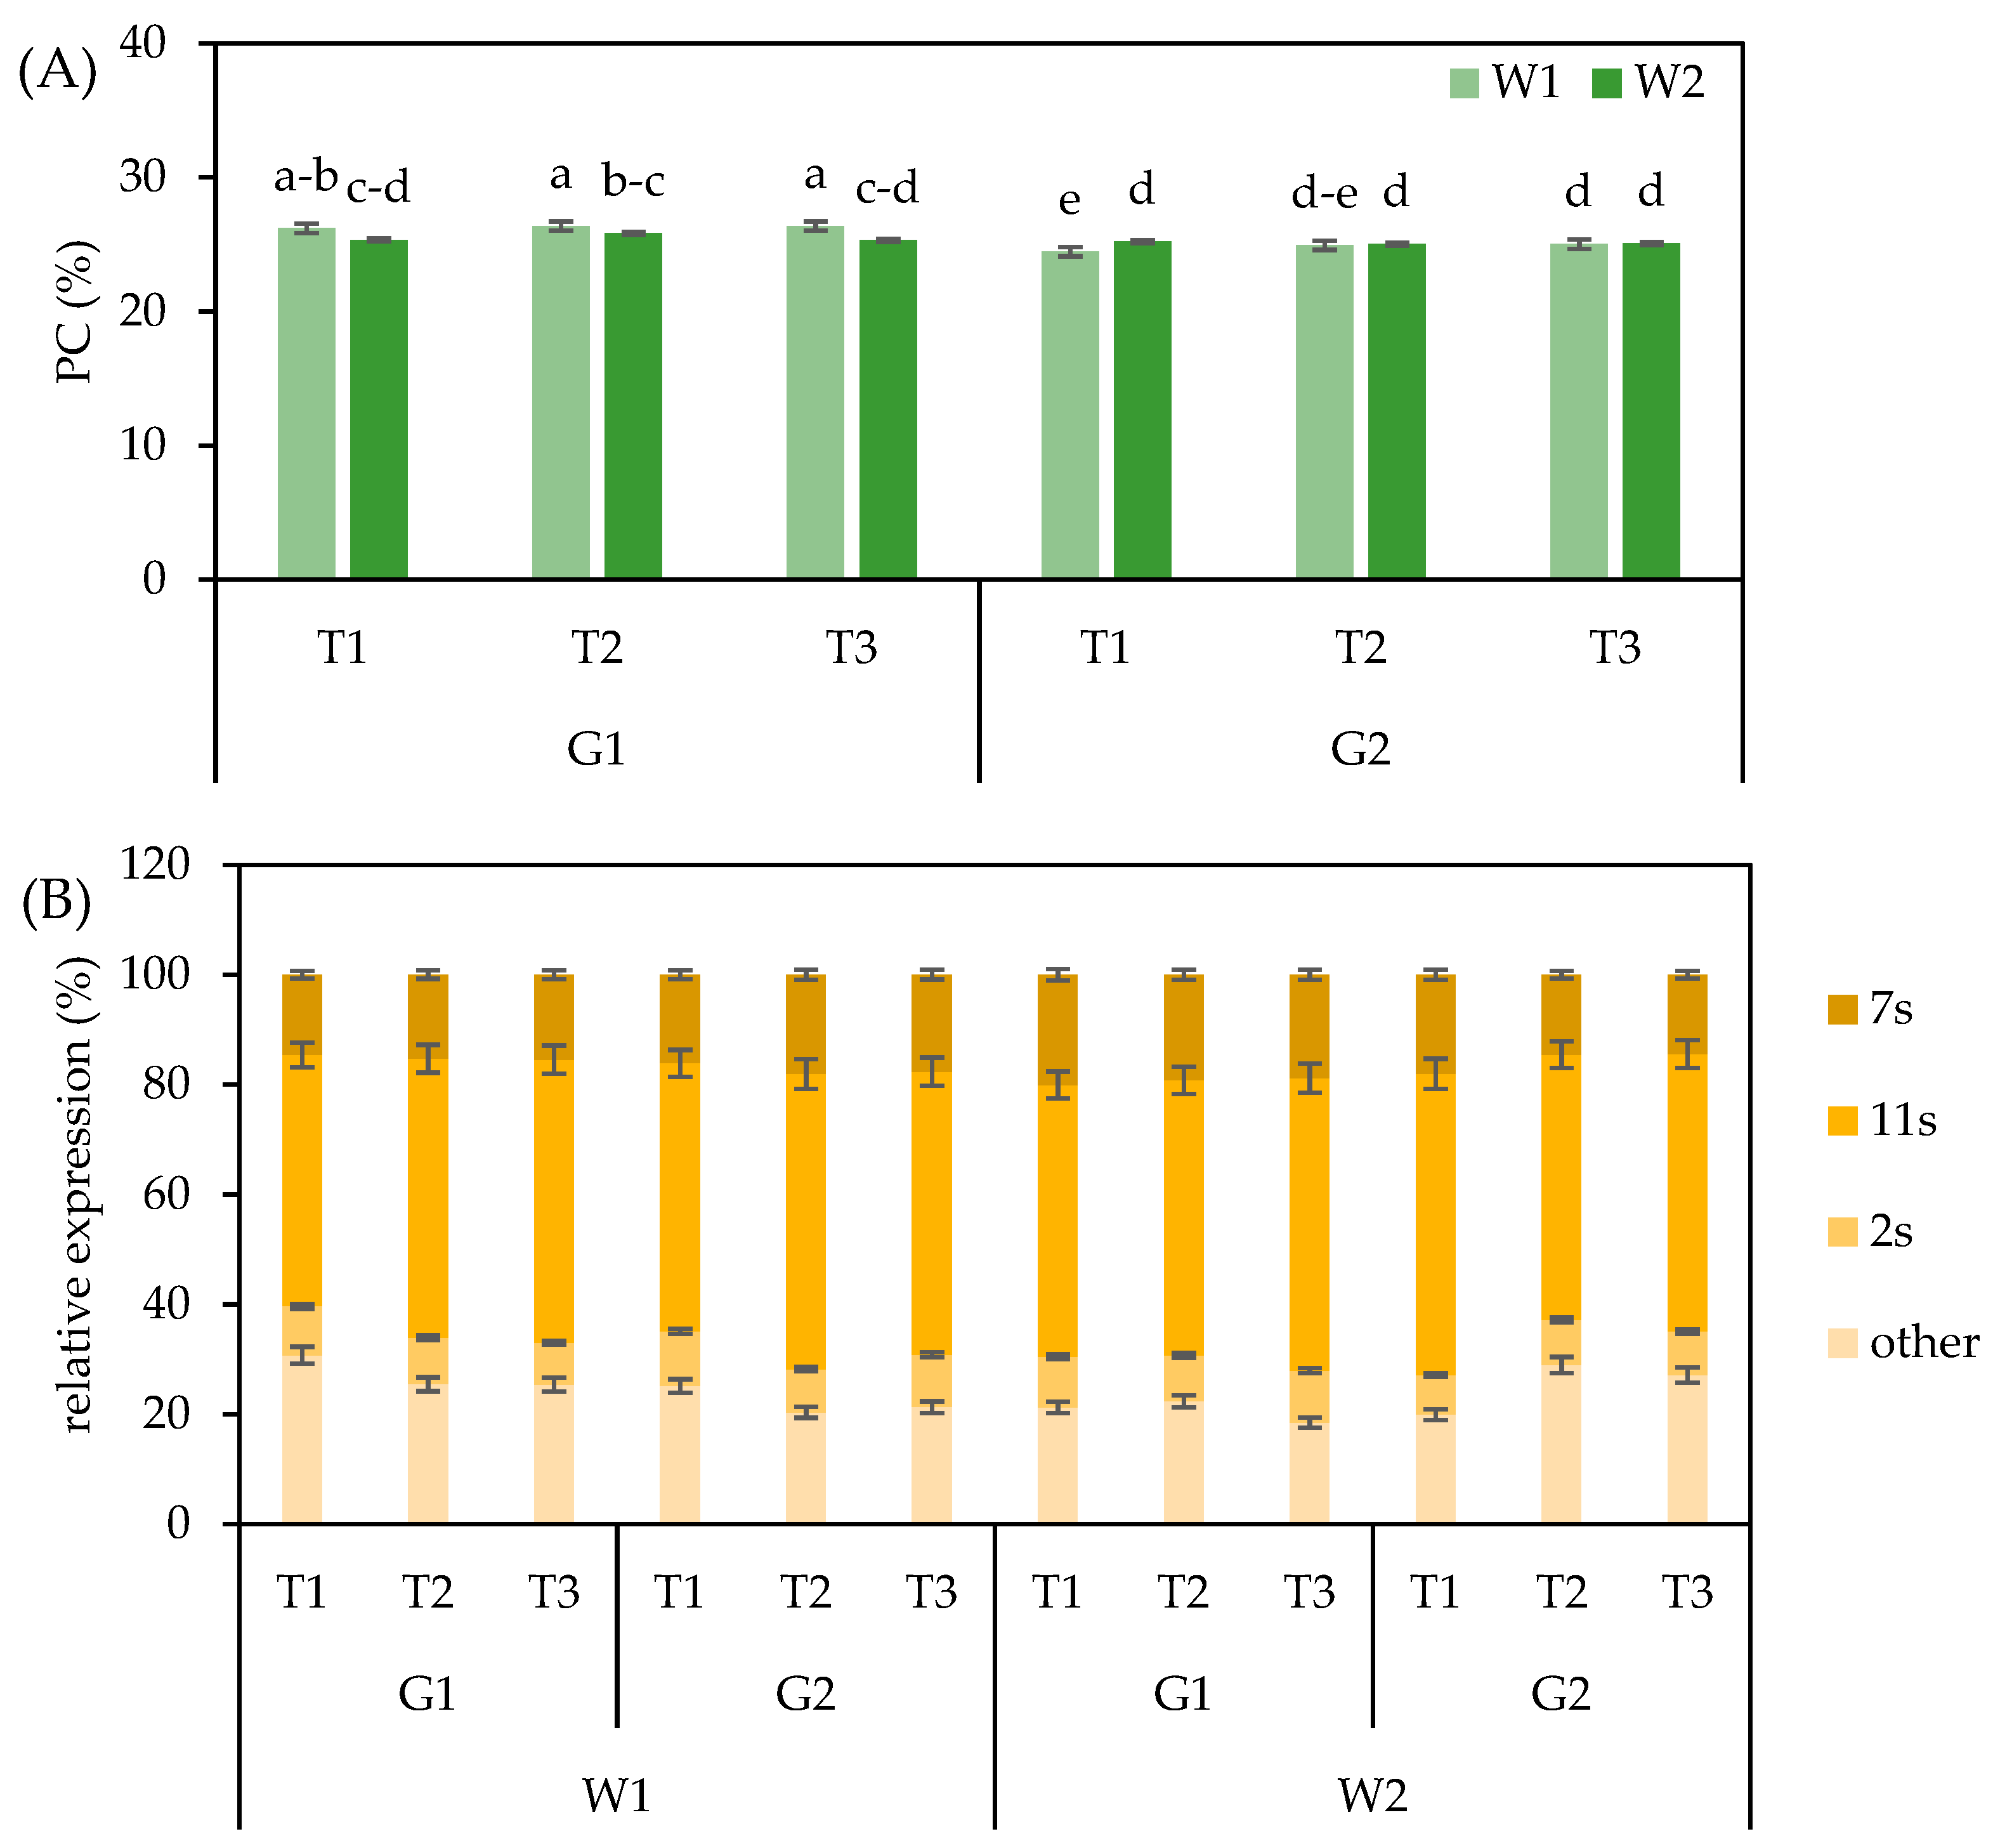
3.4. Seed Protein Content and Composition

Protein content (PC) was generally higher in the second year and for the Virginia-type genotype (Table 3); in particular, for G2 a mean lower PC was observed under W2, while nutrition management affected PC only for Spanish type genotype under W1, with higher values of T3 with respect to T1 control (Figure 7A).
With regard to peanut seed storage protein composition, the 11s legumin resulted the most expressed from the SDS-PAGE analysis (Table 3). This showed limited variations due to agronomic factors, although mean higher values were observed in 2022 and, in general, all fractions were affected by crop year. The 7s vicilin also showed a higher expression under W2 and in G2. The 2s albumin showed the lowest content in peanut seeds. Furthermore, nutrition treatments did not generally affect allergen composition in both varieties (Figure 7B).

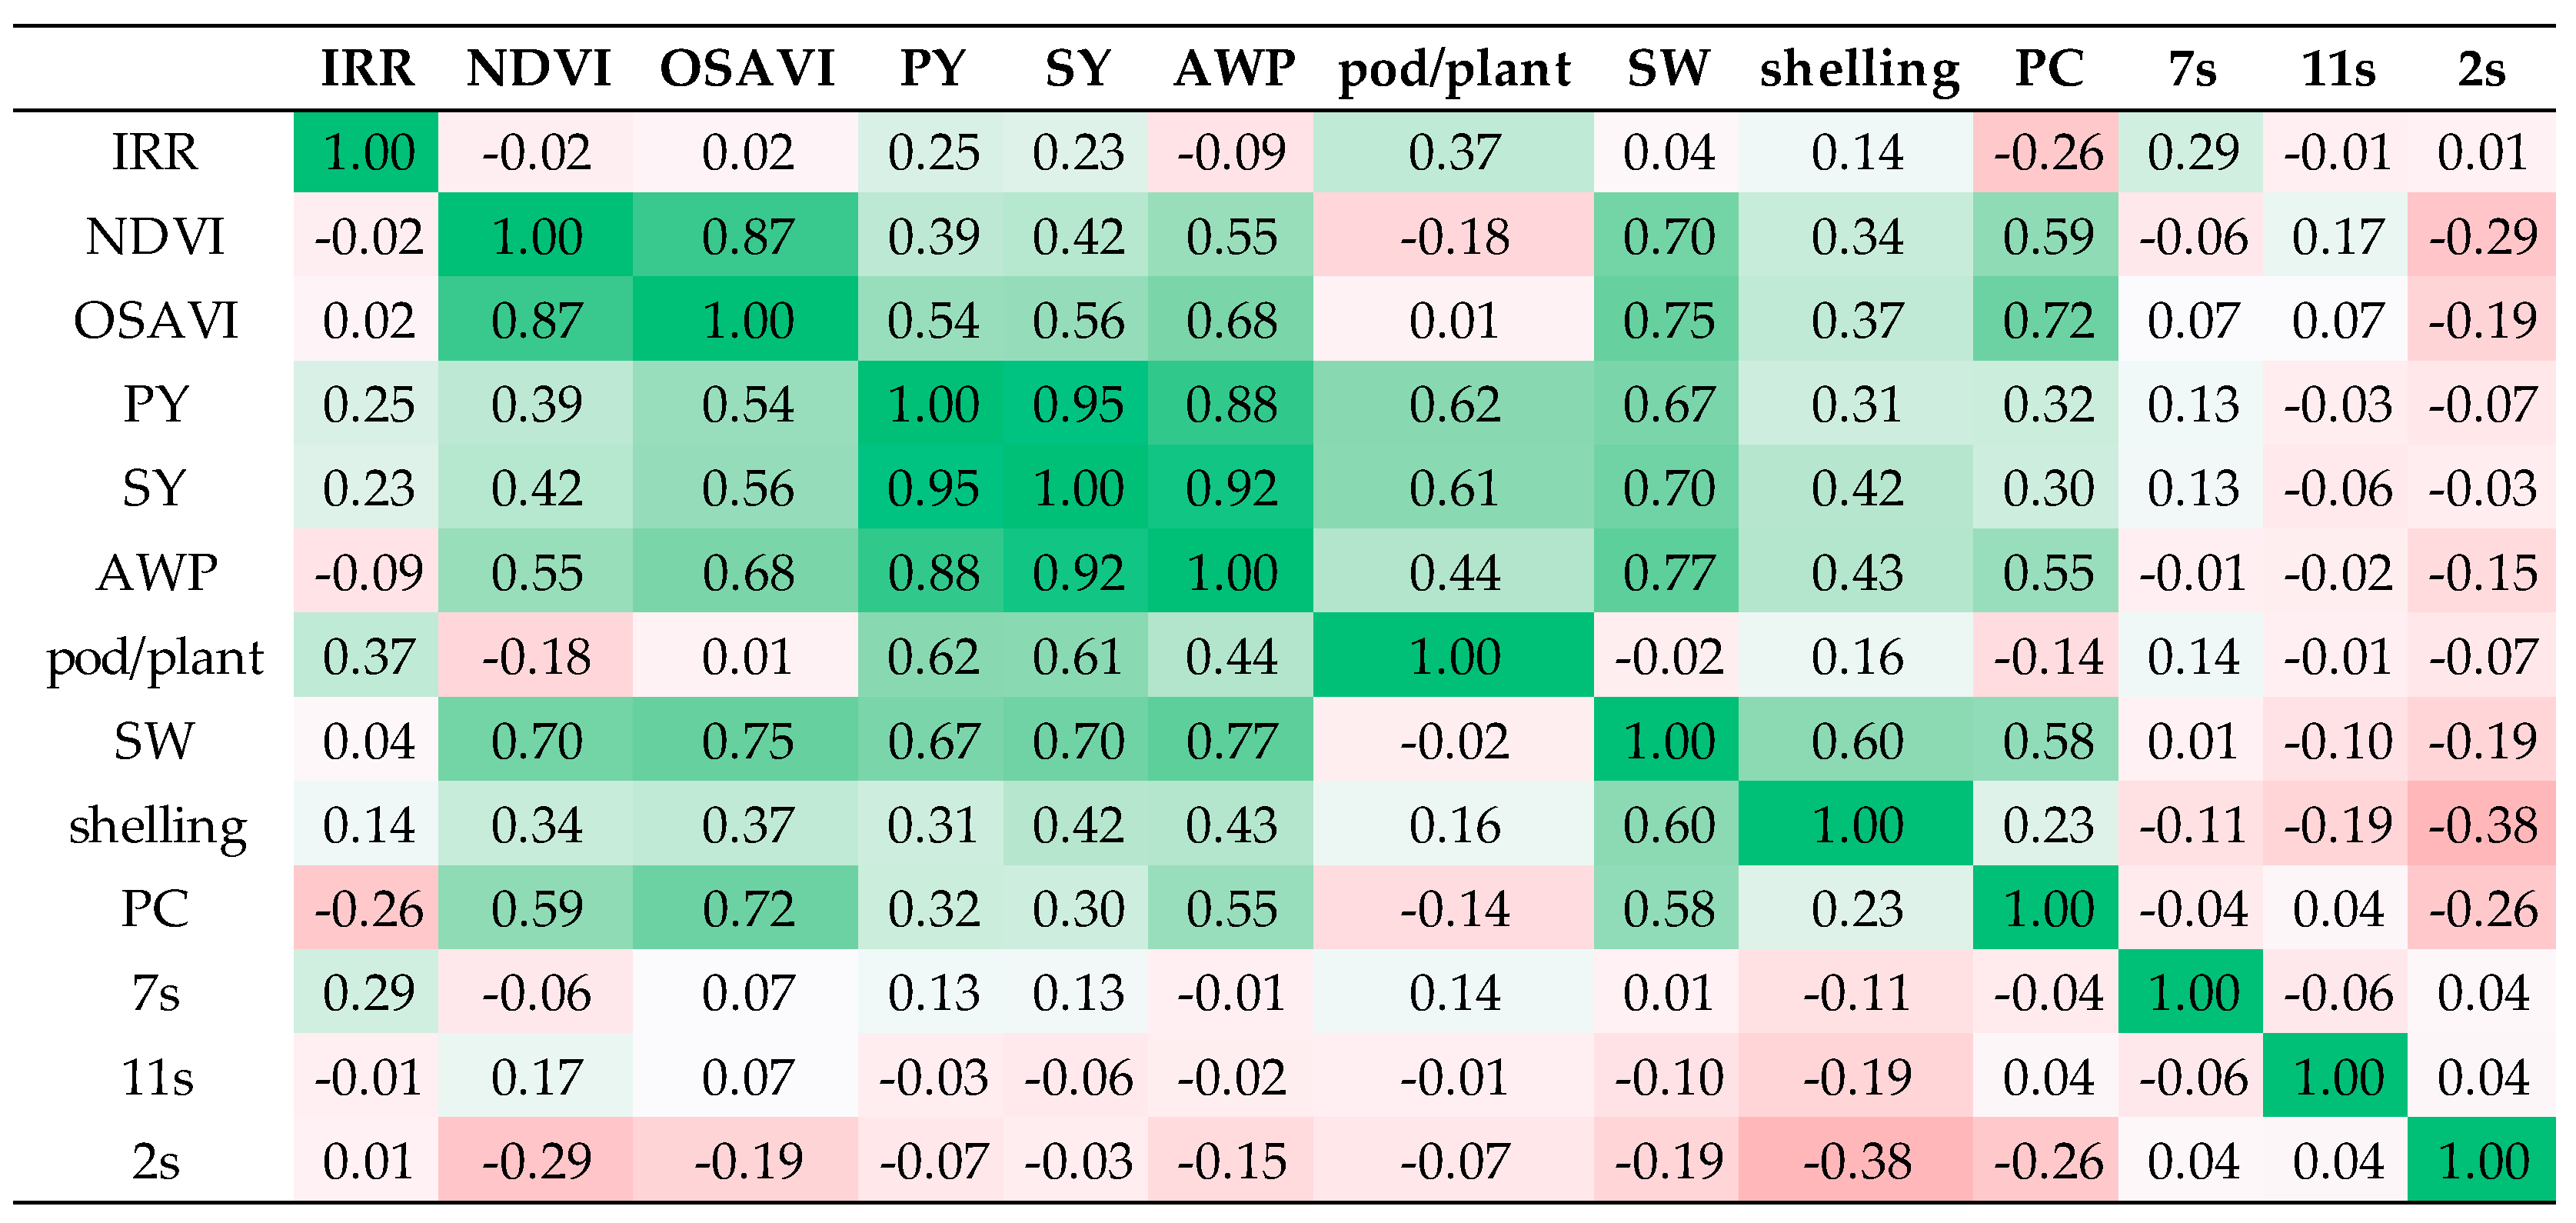
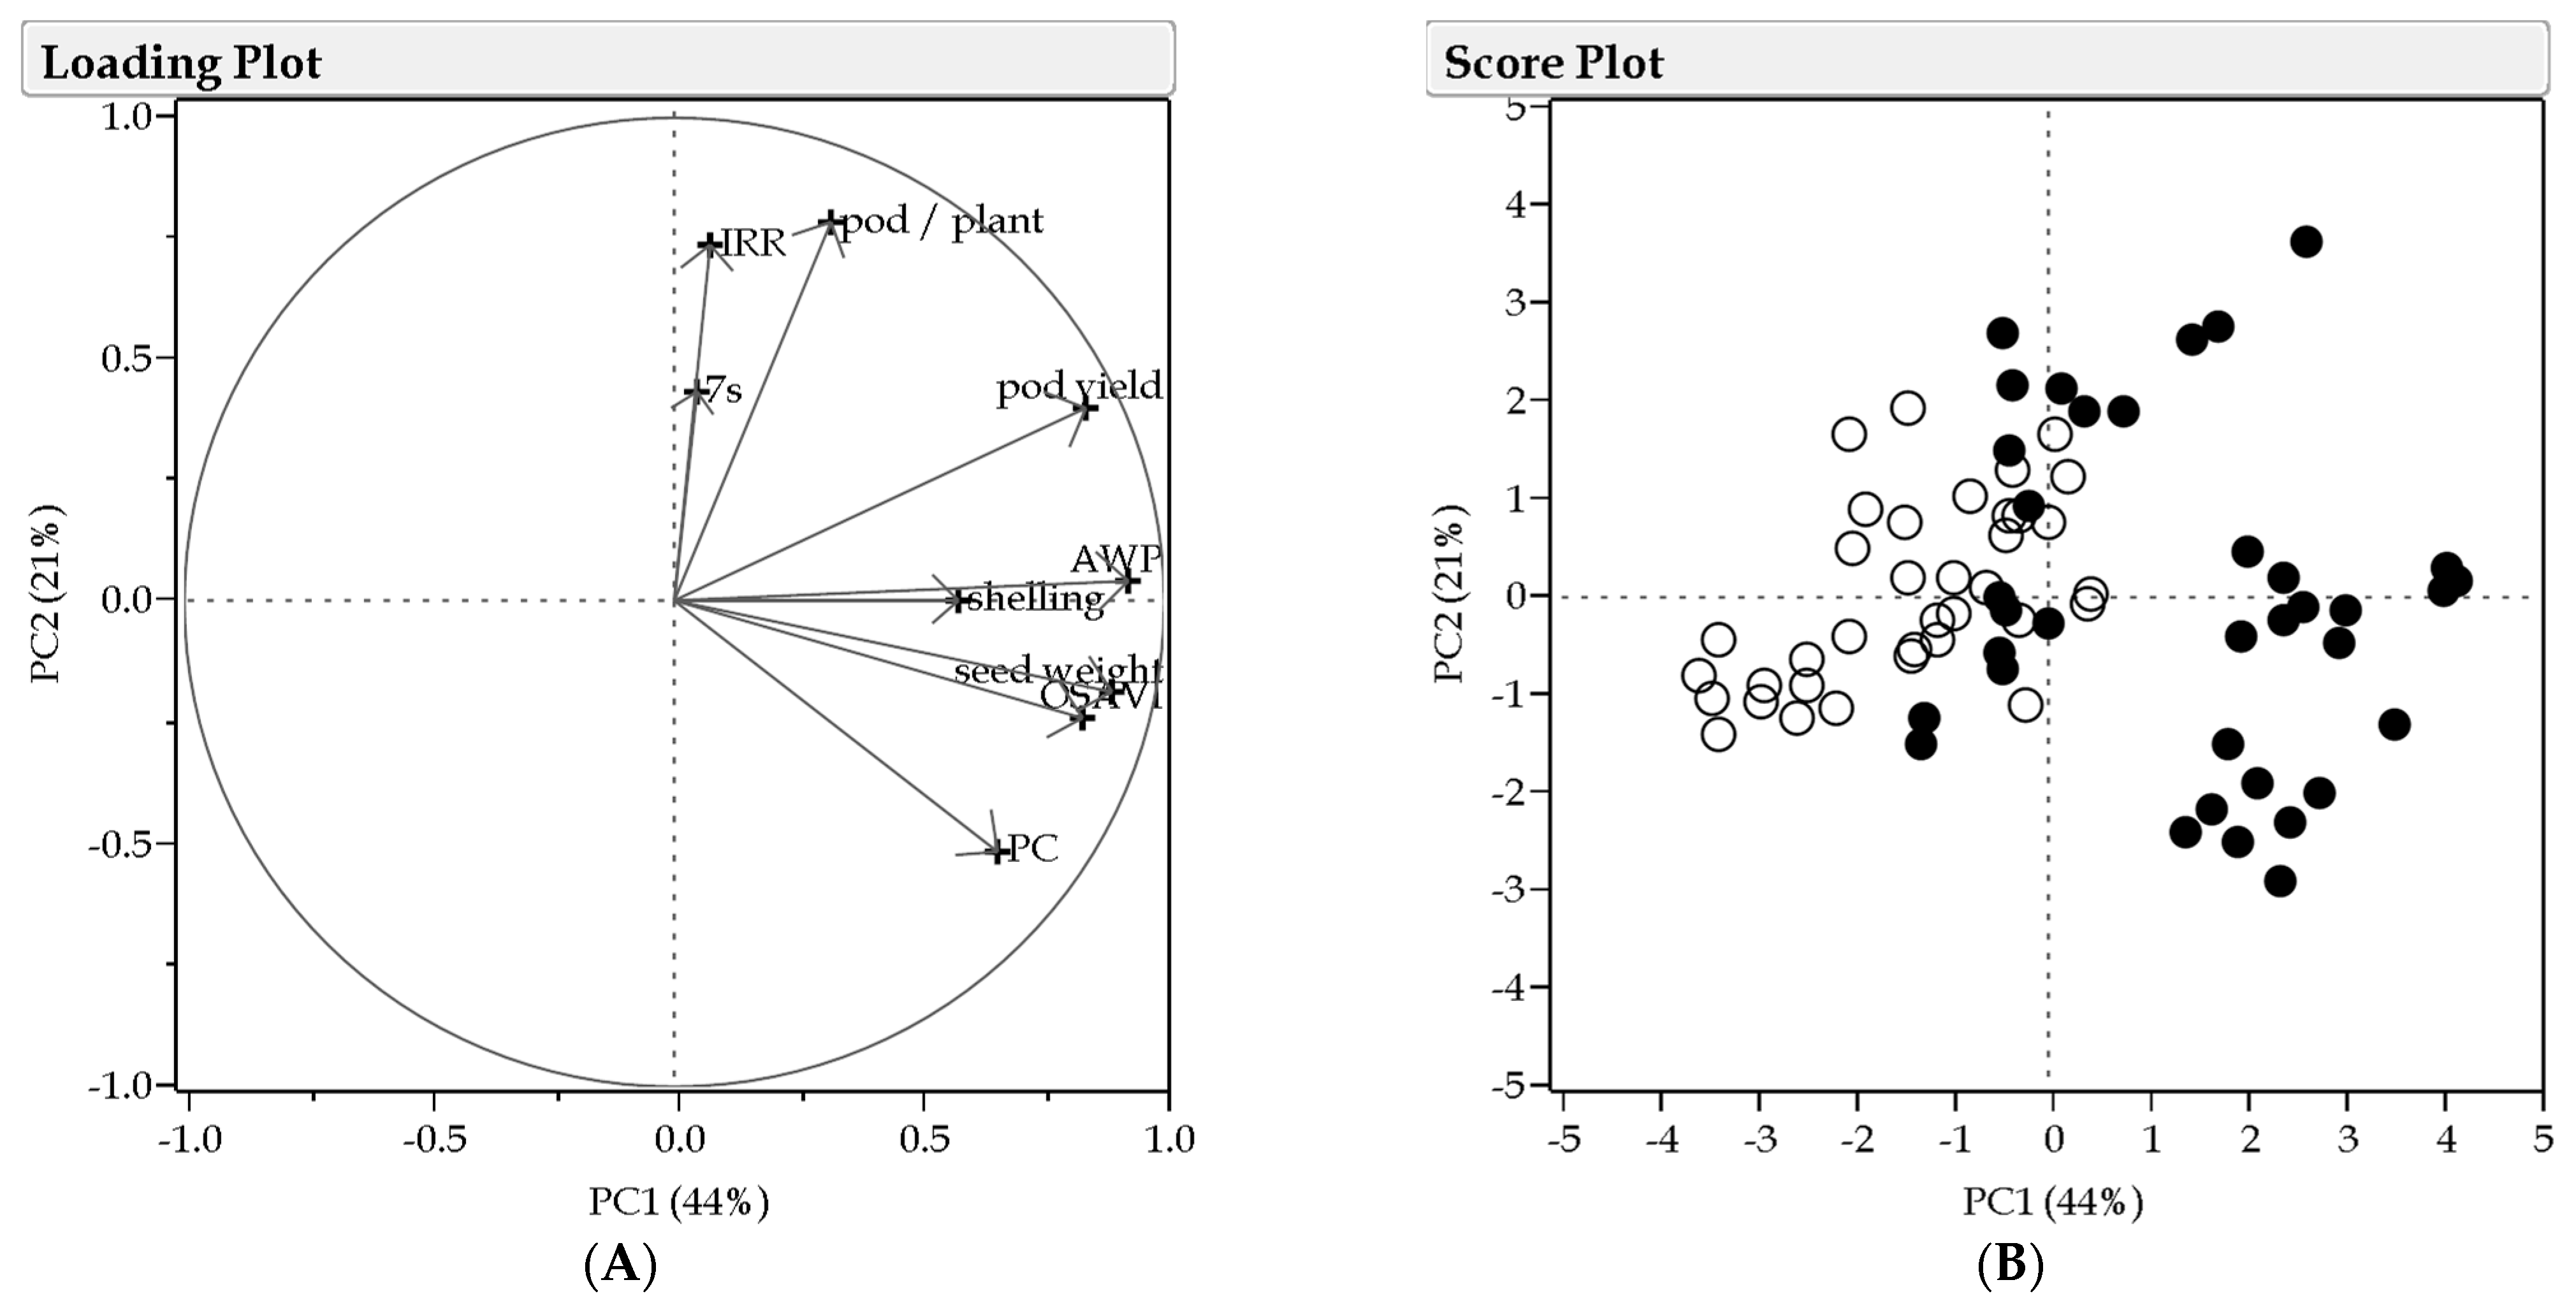
3.5. Multivariate Analysis

Multiple regression analysis showed that the yield components that mostly influenced final yield were seed weight followed by the number of pods per plant (Figure 8). Irrigation amount (IRR) showed a high significant correlation with the number of pods per plant and a negative correlation with PC. Investigated VIs for crop vigor well correlated with yield and its component. OSAVI showed a better correlation than NDVI, especially with PC and seed weight.
Principal component analysis (PCA) was carried out on the correlation matrix of the main investigated parameters (Figure 9A). The first two principal components explained 65% of total variance, with the first one (PC1) accounting for 44% and second one (PC2) for 21%. On the basis of the distribution of the parameters, PC1 may be attributed to the “genotype effect” while PC2 to the “water supply effect”. The two genotypes were well separated along PC1 (Figure 9B), with Virginia-type genotype characterized by better agronomic performance, including OSAVI, AWP, yield, and yield components; a slight overlap between the two genotypes occurred under low input (W1) conditions (Figure 8). Along PC2, irrigation amount was positively associated to the number of pods per plant and, secondarily, with the expression of the 7s vicilin-like.

4. Discussion

Thermal and pluviometry conditions of the Mediterranean basin are indicated as potentially suitable for peanut cultivation [10]; nonetheless, its cultivation is not yet widespread, especially in Italy, possibly because of an underdeveloped supply chain. The results from this study indicate that there is room for developing agronomic management, both for water and nutrient efficient peanut production. The impact of genotype is remarkable on peanut seed weight, which is the most important yield component for high yielding peanut genotypes and a target of the breeding activity [5]. However, a strong interaction of the genotype with management was observed.
In regards to the response of peanut yield to water supply, higher mean production was achieved by large seed genotype Virginia under non-limiting water conditions [16] with mean values in accordance to other observations in the Mediterranean basin, i.e., within 2400–5300 kg ha−1 [10]. However, in the observation of Sezen et al. [10], no inoculation with plant growth-promoting microorganism was carried out.
The higher adaptability of the Virginia-type genotypes was also reported in a multilocation study conducted in US, showing, also, a better response to water supply that positively increased grading quality [26]. These characteristics may be due to genotypic differences in photosynthetic rate and pod-filling rate [27,28,29]. In addition, large-seeded peanuts have a higher market quality [30].
Concerning yield components, it is known that peanut seed number is more dependent on growing conditions rather than on genetics [5]. Indeed, differences in the number of pods per plants observed between the two crop years may be possibly explained by differences in growing degree days recorded when the number of pods per plant was set (July and August). In addition, the positive relationship observed between irrigation amount and number of pods per plant is in accordance with previous studies in Mediterranean environments [31]. In fact, higher irrigation is reported to generally affect yield components in peanut [32].
In regards to agricultural water productivity, the observed values (4–10 kg mm−1) are in the range reported in the literature in India, Egypt, and Turkey [10,33,34]. The optimization of irrigation management can improve water productivity [10,17,29]. The influence of genotype is known for peanut water productivity and water use efficiency traits [32,35]. Indeed, the higher water use efficiency in the Virginia-type peanut genotypes with respect to Spanish ones was also previously reported under controlled conditions with different water supply levels [36], and it is in accordance with the results of the current study conducted in field conditions. Starter nitrogen fertilization and biofertilizer treatment did not significantly increase yield and agricultural water productivity while protein content was increased, as previously reported [37,38]; in addition, significant yield increases are reported only at higher rates of nitrogen (>150 kg ha−1), with a general higher impact of water supply on peanut [39].
Results on canopy reflectance observed in the current study confirmed the potential of assessing peanut phenology and physiological status, especially in the bands of the near infrared [1,14,40]. The higher vigor assessed in the second crop season in the current study was well described by near-infrared reflectance and vegetation indexes; Song et al. [41] well described the earlier emergence of peanut genotypes between two crop seasons, which was also due to air thermal differences, by NDVI measures. Indeed, the earlier emergence observed in the second crop year is explained by the higher temperature, since a linear relationship between soil temperature and emergence rate is reported for peanut [42]. Yao et al. [43] also reported a good correlation between soil temperature and moisture with hyperspectral vegetation indexes, indicating the superiority of EVI with respect to NDVI on estimating peanut leaf area index. The same conclusion, also for OSAVI, has been previously observed on other legume crops, and explained by the ability of the indexes to mitigate the effect of soil background reflectance [19]. Under our experimental conditions, the higher crop vigor was associated not only to seed weight but also to seed protein content. Indeed, the crop year and the genotype with higher values of both VIs showed higher protein content. In accordance with this, Tubbs et al. [37] observed, on a medium maturity peanut variety, a strong correlation between NDVI and N concentration in vegetative tissue at seed maturation stage. A novelty emerged from the current study is relationship between OSAVI measured during seed maturation and seed weight.
With regards to plant nutrition, the limited response to nitrogen fertilization for yield was confirmed [37,44]. On the other hand, the inoculation with plant biofertilizer was associated with an increase in yield and water productivity of Virginia-type genotype under half irrigation level, probably due to a partial modulation of soil microbiota. In particular, biofertilizer application showed a marked prevalence in Bacillus spp. increase, confirming the good survival ability of these microorganisms in peanut rhizosphere [45,46]. B pumilus was preliminarily evaluated for its disease control activity [47] as well as for its biostimulant activity associated with nitrogen fertilization [48]. The increase in yield observed in the current study was associated with a higher number of pods per plant; this is accordance to studies also carried out in Mediterranean basin [49,50]. Under a nutrient poor environment, such as with a reduced nitrogen rate, the interaction between microorganisms and peanut may, indeed, positively influence photosynthetic rate and canopy structure [51]. The advantage to the crop resulted in the early stages, increasing the pod number [50].
As for peanut proteins, the most abundant storage proteins detected in this study are reported to be high nutritional sources of amino acids [52]. The small differences found between the two types of genotype observed in the current study are in agreement with the comparable abundance in essential amino acids (EAA) reported in the literature between Spanish and Valencia peanut genotypes [7]. Most of the studies available in the literature deal with the genetic variability of peanut germplasm in relation to the allergen potential [24,53], with little information on the effect of environmental and agronomic conditions [23]; however, these must be within the framework that peanut allergy incidence is below 1% in the Western adult population [9]. Our results reported that the main variations were related to the 7s vicilin-like (Ara h 1) fraction and, secondarily, to the 11s legumin (Ara h 3), with a few changes relative to the 2s albumin (Ara h 2). The ratio between the different protein fractions is comparable to other observations and in general, with higher content of Ara h 3 in peanut seeds [24]. An interesting positive trend between 7s globulin and water supply (sum of rainfall and irrigation amount) was observed; but, despite this, more observations are needed, which could suggest that moderate irrigation could mitigate Ara h 1 accumulation in seeds. In a recent investigation conducted on Italian patients, Ara h 2 (lipid transfer protein, LTP) emerged as the main allergen in Italian population, with a general low prevalence of peanut allergy in Italy [54]. A lower content of Ara h 2/6 was found in the current study and not associated with environmental conditions, in agreement to other observations on peanut [23] and other pulses [19]. On the other hand, though, the influence of irrigation supply on the expression of 7s vicilin in chickpea has been reported [19]. The lack of correlation between peanut protein content and storage protein composition (Ara h 1, Ara h 2) was also observed in other studies [24].

5. Conclusions

The adaptability of peanut in Mediterranean environments is of interest since this could represent an alternative species in sustainable cropping systems. In this study genotype mainly influenced agronomic performance. The investigated Virginia-type genotype had a better agronomic performance in response to the different agronomic strategies tested, while the Spanish-type genotype did not show a good adaptability. Yield values achieved by Virginia-type genotype are in an optimal range in comparison to other geographic areas, such as Asia and North America. The response to irrigation supply gave an important indication on the yield potential in South Italy. Favorable soil temperature and starter irrigation in the early stages are key aspects to achieve optimal agronomic performances. Irrigation supply led to an increase in the number of pods per plant and, secondarily, to the seed weight. The use of spectral phenotyping was effective to describe crop physiological status and to predict end-use quality traits, such as seed weight, with a better performance of OSAVI than NDVI because of the capacity to correct soil background reflectance. Interesting indications were provided by the interaction between irrigation and the use of biofertilizer. In the Virginia-type genotype, the application of a commercial mixture of Bacillus spp., Trichoderma, and AMF led to the highest crop water productivity and the highest pod yield also at half-irrigation regime. The increase in aerobic spore forming bacteria (bacilli) in soil at harvest due to biofertilizer suggests the favorable implications of the inoculated Bacillus coagulans and Bacillus pumilus. Agronomic strategies were shown to slightly influence protein content and composition; among the main seed storage proteins, the 7s vicilin-like, also known as Ara h 1, was the most responsive, especially to water supply, i.e., rainfall and irrigation amount.
The selection of adapted genotypes and co-application of starter N and biofertilizer may be recommended to improve water use in a Mediterranean environment. Further studies will be required on a larger set of genotypes and environments in order to pursue goals of sustainability and quality of peanut cultivation in a climate change scenario.

Author Contributions

Conceptualization, M.A.D.S., A.B. and Z.F.; methodology, M.A.D.S. and A.B.; formal analysis, M.A.D.S. and A.B.; investigation, M.A.D.S., D.C., D.T. and L.G.; resources, A.B. and Z.F.; data curation, M.A.D.S. and A.B.; writing—original draft preparation, M.A.D.S.; writing—review and editing, A.B. and Z.F.; visualization, M.A.D.S., A.B. and Z.F.; supervision, Z.F.; project administration, A.B., M.R.C., M.S. and Z.F.; funding acquisition, A.B., M.R.C., M.S. and Z.F. All authors have read and agreed to the published version of the manuscript.

Funding

This research was funded by Apulian Region through the grant “Produzione e valorizzazione dell’arachide da frutto in Puglia—PEANUTPUGLIA” (P.S.R. Puglia 2014/2020-Misura 16.2)—CUP: B77H20001660009, DDS: 94250038034.

Data Availability Statement

Data will be made available upon request.

Acknowledgments

We thank farm Pedone for the field trials, together with Luca Ardito and “La cenerentola” company for the supply of genetic material.

Conflicts of Interest

The authors declare no conflict of interest.

References

  1. dos Santos, A.F.; Corrêa, L.N.; Lacerda, L.N.; Tedesco-Oliveira, D.; Pilon, C.; Vellidis, G.; da Silva, R.P. High-resolution satellite image to predict peanut maturity variability in commercial fields. Precis. Agric. 2021, 22, 1464–1478. [Google Scholar] [CrossRef]
  2. Chen, X.; Lu, Q.; Liu, H.; Zhang, J.; Hong, Y.; Lan, H.; Li, H.; Wang, J.; Liu, H.; Li, S.; et al. Sequencing of cultivated peanut, Arachis hypogaea, yields insights into genome evolution and oil improvement. Mol. Plant 2019, 12, 920–934. [Google Scholar] [CrossRef] [PubMed] [Green Version]
  3. Nawade, B.; Mishra, G.P.; Radhakrishnan, T.; Dodia, S.M.; Ahmad, S.; Kumar, A.; Kumar, A.; Kundu, R. High oleic peanut breeding: Achievements, perspectives, and prospects. Trends Food Sci. Technol. 2018, 78, 107–119. [Google Scholar] [CrossRef]
  4. Çiftçi, S.; Suna, G. Functional components of peanuts (Arachis Hypogaea L.) and health benefits: A review. Future Foods 2022, 5, 100140. [Google Scholar] [CrossRef]
  5. Haro, R.J.; Baldessari, J.; Otegui, M.E. Genetic improvement of peanut in Argentina between 1948 and 2004: Seed yield and its components. Field Crops Res. 2013, 149, 76–83. [Google Scholar] [CrossRef]
  6. Hauser, A. Peanuts. J. Agric. Food Inf. 2018, 19, 195–202. [Google Scholar] [CrossRef]
  7. Muñoz-Arrieta, R.; Esquivel-Alvarado, D.; Alfaro-Viquez, E.; Alvarez-Valverde, V.; Krueger, C.G.; Reed, J.D. Nutritional and bioactive composition of Spanish, Valencia, and Virginia type peanut skins. J. Food Compos. Anal. 2021, 98, 103816. [Google Scholar] [CrossRef]
  8. Matsuo, H.; Yokooji, T.; Taogoshi, T. Common food allergens and their IgE-binding epitopes. Allergol. Int. 2015, 64, 332–343. [Google Scholar] [CrossRef] [Green Version]
  9. Sicherer, S.H.; Wood, R.A. Advances in diagnosing peanut allergy. J. Allergy Clin. Immunol. Pract. 2013, 1, 1–13. [Google Scholar] [CrossRef]
  10. Sezen, S.M.; Yucel, S.; Tekin, S.; Yıldız, M. Determination of optimum irrigation and effect of deficit irrigation strategies on yield and disease rate of peanut irrigated with drip system in Eastern Mediterranean. Agric. Water Manag. 2019, 221, 211–219. [Google Scholar] [CrossRef]
  11. Putto, W.; Patanothai, A.; Jogloy, S. Hoogenboom, GDetermination of mega-environments for peanut breeding using the CSM-CROPGRO-Peanut model. Crop Sci. 2008, 48, 973–982. [Google Scholar] [CrossRef]
  12. Kokkanti, R.R.; Vemuri, H.; Gaddameedi, A.; Rayalacheruvu, U. Variability in drought stress-induced physiological, biochemical responses and expression of DREB2A, NAC4 and HSP70 genes in groundnut (Arachis Hypogaea L.). S. Afr. J. Bot. 2022, 144, 448–457. [Google Scholar] [CrossRef]
  13. Sullivan, D.G.; Holbrook, C.C. Using ground-based reflectance measurements as selection criteria for droughtߚ and aflatoxin-resistant peanut genotypes. Crop Sci. 2007, 47, 1040–1050. [Google Scholar] [CrossRef]
  14. Buchaillot, M.L.; Soba, D.; Shu, T.; Liu, J.; Aranjuelo, I.; Araus, J.L.; Runion, G.B.; Prior, S.A.; Kefauver, S.C.; Sanz-Saez, A. Estimating peanut and soybean photosynthetic traits using leaf spectral reflectance and advance regression models. Planta 2022, 255, 93. [Google Scholar] [CrossRef]
  15. Zhang, J.; Wang, Q.; Xia, G.; Wu, Q.; Chi, D. Continuous regulated deficit irrigation enhances peanut water use efficiency and drought resistance. Agric. Water Manag. 2021, 255, 106997. [Google Scholar] [CrossRef]
  16. Khodadadi Dehkordi, D. The effect of different irrigation treatments on yield and water productivity of Arachis Hypogaea L. under semi-arid conditions in Iran. Irrig. Drain. 2020, 69, 646–657. [Google Scholar] [CrossRef]
  17. Zhen, X.; Huo, W.; Tian, D.; Zhang, Q.; Sanz-Saez, A.; Chen, C.Y.; Batchelor, W.D. County level calibration strategy to evaluate peanut irrigation water use under different climate change scenarios. Eur. J. Agron. 2023, 143, 126693. [Google Scholar] [CrossRef]
  18. Awal, M.A.; Ikeda, T. Effects of changes in soil temperature on seedling emergence and phenological development in field-grown stands of peanut (Arachis Hypogaea). Environ. Exp. Bot. 2002, 47, 101–113. [Google Scholar] [CrossRef]
  19. De Santis, M.A.; Satriani, A.; De Santis, F.; Flagella, Z. Water use efficiency, spectral phenotyping and protein composition of two chickpea genotypes grown in Mediterranean environments under different water and nitrogen supply. Agriculture 2022, 12, 2026. [Google Scholar] [CrossRef]
  20. Allen, R.G. Crop Evapotranspiration: Guidelines for Computing Crop Water Requirements; FAO Irrigation and Drainage Paper; Food and Agriculture Organization of the United Nations: Rome, Italy, 1998; ISBN 978-92-5-104219-9. [Google Scholar]
  21. Satriani, A.; Loperte, A.; Soldovieri, F. Integrated geophysical techniques for sustainable management of water resource. A case study of local dry bean versus commercial common bean cultivars. Agric. Water Manag. 2015, 162, 57–66. [Google Scholar] [CrossRef]
  22. Brown, M.E.; Burlingham, S.K.; Jackson, R.M. Studies onAzotobacter species in soil. Plant Soil 1962, 17, 320–332. [Google Scholar] [CrossRef]
  23. Walczyk, N.E.; Smith, P.M.C.; Tovey, E.; Wright, G.C.; Fleischfresser, D.B.; Roberts, T.H. Analysis of crude protein and allergen abundance in peanuts (Arachis Hypogaea cv. Walter) from three growing regions in Australia. J. Agric. Food Chem. 2013, 61, 3714–3725. [Google Scholar] [CrossRef] [PubMed]
  24. Wu, Z.; Zhou, N.; Xiong, F.; Li, X.; Yang, A.; Tong, P.; Tang, R.; Chen, H. Allergen composition analysis and allergenicity assessment of Chinese peanut cultivars. Food Chem. 2016, 196, 459–465. [Google Scholar] [CrossRef] [PubMed]
  25. Mamone, G.; Di Stasio, L.; De Caro, S.; Picariello, G.; Nicolai, M.A.; Ferranti, P. Comprehensive analysis of the peanut allergome combining 2-DE gel-based and gel-free proteomics. Food Res. Int. 2019, 116, 1059–1065. [Google Scholar] [CrossRef]
  26. Kumar, N.; Haak, D.C.; Dunne, J.C.; Balota, M. Multilocation evaluation of Virginia and Runner-type peanut cultivars for yield and grade in Virginia–Carolina region. Agronomy 2022, 12, 3206. [Google Scholar] [CrossRef]
  27. Nautiyal, P.C.; Ravindra, V.; Rathnakumar, A.L.; Ajay, B.C.; Zala, P.V. Genetic variations in photosynthetic rate, pod yield and yield components in Spanish groundnut cultivars during three cropping seasons. Field Crops Res. 2012, 125, 83–91. [Google Scholar] [CrossRef]
  28. Haro, R.J.; Baldessari, J.; Otegui, M.E. Genetic improvement of peanut in Argentina between 1948 and 2004: Links between phenology and grain yield determinants. Field Crops Res. 2015, 174, 12–19. [Google Scholar] [CrossRef]
  29. Zhang, Q.; Dang, P.; Chen, C.; Feng, Y.; Batchelor, W.; Lamb, M.; Sanz-Saez, A. Tolerance to mid-season drought in peanut can be achieved by high water use efficiency or high efficient use of water. Crop Sci. 2022, 62, 1948–1966. [Google Scholar] [CrossRef]
  30. Mozingo, R.W.; Coffelt, T.A.; Wynne, J.C. Genetic improvement in large-seeded Virginia-type peanut cultivars since 1941. Crop Sci. 1987, 27, 228–231. [Google Scholar] [CrossRef]
  31. Yol, E.; Furat, S.; Upadhyaya, H.D.; Uzun, B. Characterization of groundnut (Arachis Hypogaea L.) collection using quantitative and qualitative traits in the Mediterranean basin. J. Integr. Agric. 2018, 17, 63–75. [Google Scholar] [CrossRef] [Green Version]
  32. Reddy, T.Y.; Reddy, V.R.; Anbumozhi, V. Physiological responses of groundnut (Arachis hypogea L.) to drought stress and its amelioration: A critical review. Plant Growth Regul. 2003, 41, 75–88. [Google Scholar] [CrossRef]
  33. Bandyopadhyay, P.K.; Mallick, S.; Rana, S.K. Water balance and crop coefficients of summer-grown peanut (Arachis Hypogaea L.) in a humid tropical region of India. Irrig. Sci. 2005, 23, 161–169. [Google Scholar] [CrossRef]
  34. Abou Kheira, A.A. Macromanagement of deficit-irrigated peanut with sprinkler irrigation. Agric. Water Manag. 2009, 96, 1409–1420. [Google Scholar] [CrossRef]
  35. Puangbut, D.; Jogloy, S.; Vorasoot, N.; Akkasaeng, C.; Kesmala, T.; Rachaputi, R.C.N.; Wright, G.C.; Patanothai, A. Association of root dry weight and transpiration efficiency of peanut genotypes under early season drought. Agric. Water Manag. 2009, 96, 1460–1466. [Google Scholar] [CrossRef]
  36. Craufurd, P.Q.; Wheeler, T.R.; Ellis, R.H.; Summerfield, R.J.; Williams, J.H. Effect of temperature and water deficit on water-use efficiency, carbon isotope discrimination, and specific leaf area in peanut. Crop Sci. 1999, 39, 136–142. [Google Scholar] [CrossRef]
  37. Scott Tubbs, R.; Harris, G.H.; Beasley, J.P.; Smith, A.R.; Smith, N.B. Effect of inoculant and nitrogen application at planting on peanut production in Georgia. Crop Manag. 2012, 11, 1–11. [Google Scholar] [CrossRef]
  38. Tekulu, K.; Taye, G.; Assefa, D. Effect of starter nitrogen and phosphorus fertilizer rates on yield and yield components, grain protein content of groundnut (Arachis Hypogaea L.) and residual soil nitrogen content in a semiarid north Ethiopia. Heliyon 2020, 6, e05101. [Google Scholar] [CrossRef]
  39. Xia, G.; Wu, Q.; Chi, D.; Chen, J.; Wang, S. Enhancing water productivity while improving peanut kernel quality by water regulation under different nitrogen levels. Irrig. Drain. 2020, 69, 86–94. [Google Scholar] [CrossRef]
  40. Carley, D.S.; Jordan, D.L.; Dharmasri, L.C.; Sutton, T.B.; Brandenburg, R.L.; Burton, M.G. Peanut response to planting date and potential of canopy reflectance as an indicator of pod maturation. Agron. J. 2008, 100, 376–380. [Google Scholar] [CrossRef]
  41. Song, Y.; Rowland, D.L.; Tillman, B.L.; Wilson, C.H.; Sarnoski, P.J.; Zurweller, B.A. Impact of seed maturity on season-long physiological performance and offspring seed quality in peanut (Arachis Hypogaea L.). Field Crops Res. 2022, 288, 108674. [Google Scholar] [CrossRef]
  42. Prasad, P.V.V.; Boote, K.J.; Thomas, J.M.G.; Allen Jr, L.H.; Gorbet, D.W. Influence of soil temperature on seedling emergence and early growth of peanut cultivars in field conditions. J. Agron. Crop Sci. 2006, 192, 168–177. [Google Scholar] [CrossRef]
  43. Yao, X.; Chen, S.; Ding, S.; Zhang, M.; Cui, Z.; Linghu, S.; Xu, J. Temperature, moisture, hyperspectral vegetation indexes, and leaf traits regulated soil respiration in different crop planting fields. J. Soil Sci. Plant Nutr. 2021, 21, 3203–3220. [Google Scholar] [CrossRef]
  44. Mondal, M.; Skalicky, M.; Garai, S.; Hossain, A.; Sarkar, S.; Banerjee, H.; Kundu, R.; Brestic, M.; Barutcular, C.; Erman, M.; et al. Supplementing nitrogen in combination with rhizobium inoculation and soil mulch in peanut (Arachis Hypogaea L.) production system: Part I. Effects on productivity, soil moisture, and nutrient dynamics. Agronomy 2020, 10, 1582. [Google Scholar] [CrossRef]
  45. Podile, A.R. Survival of Bacillus subtilis AF 1 in the bacterized peanut rhizosphere and its influence on native microflora and seedling growth. World J. Microbiol. Biotechnol. 1994, 10, 700–703. [Google Scholar] [CrossRef] [PubMed]
  46. Hinsu, A.T.; Panchal, K.J.; Pandit, R.J.; Koringa, P.G.; Kothari, R.K. Characterizing rhizosphere microbiota of peanut (Arachis Hypogaea L.) from pre-sowing to post-harvest of crop under field conditions. Sci. Rep. 2021, 11, 17457. [Google Scholar] [CrossRef] [PubMed]
  47. Xu, M.; Zhang, X.; Yu, J.; Guo, Z.; Wu, J.; Li, X.; Chi, Y.; Wan, S. Biological control of peanut southern blight (Sclerotium rolfsii) by the strain Bacillus pumilus LX11. Biocontrol Sci. Technol. 2020, 30, 485–489. [Google Scholar] [CrossRef]
  48. Masood, S.; Zhao, X.Q.; Shen, R.F. Bacillus pumilus promotes the growth and nitrogen uptake of tomato plants under nitrogen fertilization. Sci. Hortic. 2020, 272, 109581. [Google Scholar] [CrossRef]
  49. Abdelghany, A.M.; El-Banna, A.A.A.; Salama, E.A.A.; Ali, M.M.; Al-Huqail, A.A.; Ali, H.M.; Paszt, L.S.; El-Sorady, G.A.; Lamlom, S.F. The individual and combined effect of nanoparticles and biofertilizers on growth, yield, and biochemical attributes of peanuts (Arachis hypogea L.). Agronomy 2022, 12, 398. [Google Scholar] [CrossRef]
  50. Dey, R.; Pal, K.K.; Bhatt, D.M.; Chauhan, S.M. Growth promotion and yield enhancement of peanut (Arachis Hypogaea L.) by application of plant growth-promoting rhizobacteria. Microbiol. Res. 2004, 159, 371–394. [Google Scholar] [CrossRef]
  51. Bi, Y.; Zhou, H. Changes in peanut canopy structure and photosynthetic characteristics induced by an arbuscular mycorrhizal fungus in a nutrient-poor environment. Sci. Rep. 2021, 11, 14832. [Google Scholar] [CrossRef]
  52. Gravel, A.; Doyen, A. Pulse globulins 11S and 7S: Origins, purification methods, and techno-functional properties. J. Agric. Food Chem. 2023, 71, 2704–2717. [Google Scholar] [CrossRef] [PubMed]
  53. Guo, B.; Liang, X.; Chung, S.-Y.; Holbrook, C.C.; Maleki, J.S. Proteomic analysis of peanut seed storage proteins and genetic variation in a potential peanut allergen. Protein Pept. Lett. 2008, 15, 567–577. [Google Scholar] [CrossRef] [PubMed]
  54. Asero, R.; Nucera, E.; Rizzi, A.; Aruanno, A.; Uasuf, C.G.; Manzotti, G.; Villalta, D.; Conte, M.; Pastorello, E.A.; Losappio, L.; et al. Peanut allergy in Italy: A unique Italian perspective. J. Allergy Clin. Immunol. Glob. 2022, 1, 61–66. [Google Scholar] [CrossRef]
Figure 1. Representative pictures of the Virginia-type (ACI 442) and Spanish-type (ACI 236) peanut genotypes during different developmental stages.
Agronomy 13 01566 g001
Figure 2. Monthly growing degree days (GDD, histograms) and irrigation levels (W1, dashed lines and W2, continuous line) of the field trials conducted at Foggia during 2021 (dark grey) and 2022 (light grey).
Agronomy 13 01566 g002
Figure 3. Crop spectral signature of the two investigated peanut genotypes, Virginia-type (G1) and Spanish-type (G2), shown as box plots of the reflectance relative to the narrow bands of blue (B, 450 ± 5 nm), green (G, 550 ± 5 nm), red (R, 680 ± 5 nm), far red (FR, 720 ± 5 nm) and near infrared (NIR, 800 ± 5 nm), assessed during pod filling in the field trials conducted at Foggia during 2021 and 2022 crop seasons.
Agronomy 13 01566 g003
Figure 4. Decomposition of the statistical hypothesis for the effect of the interaction treatment × microorganisms on the microbiological profile of soil immediately after harvesting, reported as increase (positive values) or decrease (negative values) of viable count referred to the beginning of the experiments. Abbreviations: T1, control, T2, 40 kg ha−1 of N; T3, 40 kg ha−1 of N + biofertilizer. Mes, mesophilic bacteria; Bac., aerobic spore forming bacteria (bacilli); Soil, soil microorganisms growing at 22 °C; Pse, pseudomonads; Act, actinobacteria; Nit, nitrogen-fixing microorganisms. Bars represent 95% confidence intervals. Data are the average of the two years and irrigation treatments (W1 and W2) for the two genotypes.
Agronomy 13 01566 g004
Figure 5. Response to nitrogen and biofertilizer supply of (A) optimized soil-adjusted vegetation index (OSAVI), (B) pod yield, and (C) agricultural water productivity (AWP) of two peanut genotypes, Virginia-type (ACI 442, G1) and Spanish-type (ACI 236, G2), grown under two irrigation regimes (50%-ET W1, 100%-ET W2) in South Italy (Foggia). For each parameter, values not connected by the same letter are significantly different according to Tukey’s test as post hoc. Abbreviations: W1 = half irrigation level; W2 = full irrigation level; T1 = unfertilized and not inoculated control; T2 = fertilized and not inoculated treatment; T3 = fertilized and inoculated with biofertilizer treatment.
Agronomy 13 01566 g005
Figure 6. Relationship between optimized soil adjusted vegetation index (OSAVI) and seed weight of peanut varieties grown under two irrigation regimes in South Italy (Foggia).
Agronomy 13 01566 g006
Figure 7. Differences of Virginia (G1) and Spanish (G2) peanut genotypes to irrigation regime (W1 vs. W2) and fertilization in relation to seed protein content (A) and composition in terms of storage protein relative expression (B). Abbreviations: PC = protein content; 7s = 7s vicilin-like (Ara h 1); 11s = 11s legumin (Ara h 3); 2s = 2s albumin (Ara h 2/6); Y = year; W = water irrigation regime; G = genotype; T = fertilization treatment. For each parameter, values not connected by the same letter are significantly different according to Tukey’s test as post hoc. Bars represent 95% confidence intervals.
Agronomy 13 01566 g007
Figure 8. Heatmap of Pearson’s correlation matrix among agronomic parameters, vegetation indexes, and agricultural water productivity. Red and green represent, respectively, low and high R values. Abbreviations are as follows: IRR = irrigation amount; NDVI = normalized difference vegetation index; OSAVI = optimized soil adjusted vegetation index; PY = pod yield, SY = seed yield; AWP = agricultural water productivity; SW = seed weight; PC = protein content; 7s = 7s vicilin; 11s = 11s legumin; 2s = 2s albumin. Level of significance: p ≤ 5% with R < −0.25 and R > 0.25; p ≤ 1% with R < −0.36 and R > 0.36; p ≤ 0.1% with R < −0.46 and R > 0.46.
Agronomy 13 01566 g008
Figure 9. Principal component analysis relative to the agronomic performances, vegetation indexes, and protein composition of peanut genotypes grown in field trials conducted in South Italy during 2021 and 2022. Loading plot (A) and score plot (B), relative to Spanish-type (empty circle) and Virginia-type (full black circle) genotype. Abbreviations are as follows: IRR = irrigation amount; OSAVI = optimized soil adjusted vegetation index; AWP = agricultural water productivity; 7s = 7s vicilin.
Agronomy 13 01566 g009
Table 1. Weather data of the field trials conducted at Foggia during 2021 and 2022 years, in comparison with long term (LT) data (1954–2018).
ParameterYear Month
MayJunJulAugSepOctNov
SRAD (W m−2)202125425625222720713170
202225928127722115111458
LT25227928525418112479
T min (°C)202111.016.119.019.315.510.911.6
202213.218.319.119.115.111.78.3
LT13.117.620.821.317.313.28.8
T max (°C)202126.833.835.335.029.220.918.1
202228.433.534.132.228.225.417.9
LT25.030.333.633.728.323.417.6
T ave (°C)202118.924.927.127.222.315.914.9
202220.825.926.625.621.718.513.1
LT19.123.927.227.522.818.313.2
P (mm)2021119828125375
202222151615727
LT38302625475166
PET (mm)202193112115100743611
202210011711987543814
LT83104119104633919
RH (%)202160535658677891
202265586067677885
LT57484448607075
WS (m s−1)20213.22.73.03.32.83.32.4
20222.83.02.83.22.72.32.3
LT3.73.63.73.53.63.63.9
Abbreviations: Jun = June; Jul = July; Aug = August; Sep = September; Oct = October; Nov = November; SRAD = solar radiation; T ave = monthly average temperature; P = precipitations; PET = potential evapotranspiration; RH = relative humidity; WS = wind speed; LT = long term.
Table 2. Effect of crop year (Y), irrigation level (W), variety (G), and fertilization treatment (T) on vegetation indexes, yield, agricultural water productivity (AWP), and yield components of peanut field trials conducted at Foggia in 2021 and 2022.
Factors NDVIOSAVIPod YieldSeed YieldAWPPod/PlantSeed WeightShelling
GS 8GS 8kg ha−1kg ha−1kg mm−1n.mg%
Y20210.36 b0.27 b3756 a2285 a5.4 b37.0 a512 b58.1 a
20220.59 a0.34 a3639 a2264 a7.0 a22.9 b735 a59.6 a
SE0.0080.0061981510.382.0131.2
p******nsns********ns
WW10.43 b0.29 b3131 b1915 b6.2 a27.0 b565 b57.0 b
W20.52 a0.32 a4264 a2634 a6.3 a32.9 a683 a60.6 a
SE0.0080.0061981510.382.0131.2
p*********ns*****
GG10.52 a0.36 a5129 a3166 a8.7 a32.0 a850 a60.6 a
G20.42 b0.25 b2266 b1383 b3.7 b27.9 a397 b57.0 b
SE0.0080.0061981510.382.0131.2
p***************ns****
TT10.45 b0.29 b3445 a2081 a5.7 a28.0 b616 a58.7 a
T20.47 ab0.30 ab3744 a2313 a6.4 a29.3 b650 a59.6 a
T30.49 a0.32 a3905 a2428 a6.6 a32.3 a605 a58.1 a
SE0.0100.0072431840.462.5161.4
pnsnsnsnsnsnsnsns
Y × W ns****ns**
Y × G **********ns*ns
W × G nsns**nsnsns*
Y × W × G ns*nsnsnsnsnsns
Y × T ****nsnsnsnsnsns
W × T ***nsnsnsnsnsns
Y × W × T nsnsnsnsnsnsnsns
G × T nsnsnsnsnsnsnsns
Y × G × T nsnsnsnsnsnsnsns
W × G × T nsns*ns*nsnsns
Y × W × G × T nsnsnsnsnsnsns*
Abbreviations: GS 8 = pod filling growth stage; NDVI = normalized difference vegetation index; OSAVI = optimized soil adjusted vegetation index; AWP = agricultural water productivity; PC = protein content; Y = year; W = water irrigation regime; W1 = 50% irrigation level; W1 = full irrigation level; G = genotype; G1 = Virginia-type ACI442; G2 = Spanish-type AC236; T = fertilization treatment. For each parameter, values not connected by the same letter are significantly different according to Tukey’s test as post hoc. Level of significance: SE = standard error; ns = not significant; * p < 0.05; ** p < 0.01; *** p < 0.001.
Table 3. Effect of crop year (Y), irrigation level (W), variety (G), and fertilization treatment (T) on protein content (PC) and storage protein expression of peanut genotypes from field trials conducted at Foggia in 2021 and 2022.
Factors PC7s vicilin11s legumin2s albumin
%%%%
Y202125.0 b17.6 a49.6 b9.0 a
202225.8 a16.1 b51.8 a8.1 b
SE0.050.070.180.06
p*******
WW125.5 a16.2 b50.3 a8.7 a
W225.2 a17.5 a51.1 a8.4 a
SE0.050.070.180.06
pns**nsns
GG125.9 a16.5 b51.3 a8.4 a
G225.0 b17.2 a50.1 a8.7 a
SE0.050.070.180.06
p**nsns
TT125.0 a17.2 a49.7 a8.8 a
T225.5 a16.8 a50.7 a8.2 a
T325.5 a16.6 a51.7 a8.6 a
SE0.060.090.210.08
pnsnsnsns
Y × W ****nsns
Y × G *nsnsns
W × G ****ns**
Y × W × G ****ns
Y × T ns****ns
W × T *****ns
Y × W × T ****nsns
G × T nsns*ns
Y × G × T ******
W × G × T *nsns*
Y × W × G × T ****ns
Abbreviations: PC = protein content; Y = year; W = water irrigation regime; G = genotype; T = fertilization treatment. For each parameter, values not connected by the same letter are significantly different according to Tukey’s test as post hoc. Level of significance: SE = standard error; ns = not significant; * p < 0.05; ** p < 0.01; *** p < 0.001.
Disclaimer/Publisher’s Note: The statements, opinions and data contained in all publications are solely those of the individual author(s) and contributor(s) and not of MDPI and/or the editor(s). MDPI and/or the editor(s) disclaim responsibility for any injury to people or property resulting from any ideas, methods, instructions or products referred to in the content.

