Article

Winter Survival, Yield and Yield Components of Alfalfa as Affected by Phosphorus Supply in Two Alkaline Soils

1
Institute of Grassland Research, Chinese Academy of Agricultural Sciences, Hohhot 010010, China
2
College of Tourism and Environment, Zhangjiakou University, Zhangjiakou 075000, China
3
College of Grassland, Qingdao Agricultural University, Qingdao 266109, China
4
School of Life Sciences, Inner Mongolia University, Hohhot 010021, China
*
Authors to whom correspondence should be addressed.
Agronomy 2023, 13(6), 1565; https://doi.org/10.3390/agronomy13061565
Submission received: 11 May 2023 / Revised: 3 June 2023 / Accepted: 5 June 2023 / Published: 8 June 2023
(This article belongs to the Special Issue Improving Fertilizer Use Efficiency)

Abstract

:
Alfalfa (Medicago sativa L.) is an important forage for the development of herbivorous animal husbandry, which is widely planted in the cold climate areas of northern China, where there is low overwintering and forage yield in production, and fertilization is a vital production strategy. A field study was conducted to determine the response of alfalfa’s winter survival rate, yield, and yield components to different gradients of phosphate (P) fertilizer (0, 45, 90, and 135 kg P2O5 ha−1) in two types of low-phosphorus alkaline soils. The results show that the winter survival rates and forage yield increased at first and then decreased with the increase of P application; the greater winter survival rates were achieved at 45~90 kg ha−1 of P fertilizer applied, while the greater forage yield were achieved at 90 kg ha−1 in the two sites, and the suitable P fertilizer application rates for greater winter survival were less than those for greater forage yield; plant height and shoot mass made a greater contribution to forage yield than other yield components. To pursue greater forage yield, the suitable P fertilization rates for aeolian sandy soil and silt loam soil are 108.1 and 78.3 kg ha−1, respectively, based on the regression equations. Therefore, in cold winter and soil P deficiency areas, applying P fertilizer can be used as an effective strategy to improve alfalfa’s forage yield and persistence, and the most appropriate amount of fertilizer should be determined according to climate and soil conditions.

1. Introduction

Alfalfa (Medicago sativa L.) is one of the world’s most valuable fodder crops, planted for hay and pasture in more than 80 countries with an area of 30~35 million ha [1,2]. Around the world, alfalfa is grown under a wide range of environmental and climatic conditions with variable precipitation, temperature, and soil fertility [2]. The northern hemisphere includes the mid-west United States, western and eastern Canada, western and northern China, and Northern Europe [3], with cold winters and low temperatures as major factors limiting alfalfa production and distribution, causing severe economic losses [4].
Fertilization is one of the important measures to improve alfalfa’s cold resistance and production performance [5]. Because alfalfa itself has rhizobia to fix nitrogen, no additional nitrogen fertilizer is needed [6], so P and potassium fertilizers are mainly applied in alfalfa production [7]. P deficiency is one of the most limiting factors of crop production [8] and plant survival [9] in many soils worldwide, which also greatly impacts alfalfa production and cold tolerance [10]. Sometimes the problem with P deficiency is not the total P content in the soil, but P is relatively immobile and often poorly available to plants [11]. Because of the low concentration and mobility of available P in the soil, P fertilizer has been used widely in crop production and increased crop yield by a large margin [12,13]. However, P fertilizers are often applied to soils above plant requirements, and many soils have accumulated large stores of residual P and non-labile inorganic P over time [14]. Excessive application of P fertilizer in the soil not only increases the production cost but also causes environmental pollution [15]. Furthermore, P is a non-renewable resource [16]. It is very important to apply an appropriate amount of P fertilizer to alfalfa.
Alfalfa forage yield can be described as the product of three plant characteristics: plants m−2, shoots per plant, and shoot mass [17]. Understanding which yield component has a greater impact on forage yield is important, but people have different views on this. Several investigations concluded that shoot mass is the most important component of forage yield [7,18]. By contrast, Volenec et al. [17] and Undersander et al. [19] reported that plant population plays an important role in forage yield, while the plant population and shoots per plant can determine shoots m−2. The shoots plant−1 would decrease as populations increased from 11 to 86 plants m−2 [20]. The decline in plant population may be partially or fully compensated for by increases in other yield components such as shoots plants and shoot mass, so as to maintain the forage yield at a higher level [18]. Shoot mass could be decided by plant height and mass per centimeter of the shoot (g cm−1) [12], and thus plant height also can be used as a trait explaining the variation of forage yield [21]. Fertilization with P often increases forage yield and affects the yield components [7,22,23]. Jung and Smith [9] reported that P fertilization was essential for plant survival. Sanderson and Jones [22] reported that P fertilization increased shoots per plant of field-grown alfalfa when compared with alfalfa not receiving P. Yang and Shi [24] reported that P fertilizer could significantly increase the plant height and shoots per plant of alfalfa. Shoot mass is the yield component most closely associated with yield increases in response to P fertilization, caused by new shoot growth that is quicker because increased nutrient mobilization occurs between roots and actively growing shoots [25].
Alfalfa is an important perennial herbaceous forage legume for the animal industry in Inner Mongolia [26]. Due to the rapid development of animal husbandry, the alfalfa cultivation area continued to expand. Since the government has set a red line of 120 million ha of arable land area, farmers can only plant alfalfa on marginal land, many soils in Inner Mongolia contain inadequate amounts of plant-available P, and their fertilization with P is required to achieve an optimal yield of alfalfa. Many studies conducted with P fertilizer on crops indicate that soil-applied fertilizer P may be available for many years [27]. The first hypothesis of this study was that P fertilization will improve one or more yield components of alfalfa, and those components affect the forage yield. The second hypothesis was that the effect of P fertilization will be different under different climatic conditions in the alfalfa planting area. The objectives of this study were to: (i) identify the winter survival, forage yield, and yield components of alfalfa response to P fertilizer on two sites; (ii) optimize P application rates that maximize forage yield and winter survival on the two sites.

2. Materials and Methods

2.1. Growth Conditions

Two field experiments were conducted in central Inner Mongolia. The two experimental sites were situated on two alkaline soils, i.e., an aeolian sandy soil and silt loam soil. The first one was aeolian sandy soil in Siziwang County (41°40′ N, 111°78′ E), and the second one was silt loam soil in Tuzuo County (40°34′ N, 111°46′ E); analysis was performed on soil samples taken to a 15 cm depth before planting (Table 1). The soil in Inner Mongolia is divided into 11 grades according to the level of P deficiency [28], with the soils in the two sites belonging to levels 2 and 3, respectively, both of which are mildly deficient in P. The average precipitation and temperature of each month from 2019 to 2021 are shown in Table 2.

2.2. Plant Materials

The cultivars used in the study were Zhongcao No.3 and Gannong No.3. The cultivar Zhongcao No.3 was bred by the grassland research institute of the Chinese Academy of Agricultural Sciences; it is a dormant cultivar, and suitable for cultivation in dry and cold areas. The cultivar Gannong No.3 was bred by Gansu Agricultural University; it is a semi-dormant cultivar, and suitable for cultivation in irrigated and template areas. The germination rates of the two cultivars were both more than 93%, based on a germination experiment.

2.3. Field Design

The experiment was planted on the 23rd of July in Siziwang County and on the 25th of July in Tuozuo County in 2019. Seeds were planted manually in each plot (3 m × 5 m), at 15 kg ha−1 at a soil depth of 1~2 cm and 30 cm row spacing. Treatments were arranged in a randomized complete block design with a split-plot arrangement with three replications at two sites. The whole treatments were P fertilization treatments, and the subplot treatments were cultivars. Whole treatments were surrounded by a one-meter-wide strip of unfertilized Zhongcao No.3 alfalfa to prevent border effects. Application of P fertilization was carried out on the 23rd and 24th of August, four P fertilizer (P2O5) treatments (0, 45, 90, and 135 kg ha−1) were applied to a 5 cm depth in the middle of two rows and then covered and irrigated, which was produced by Henan Jixin Chemical Products Co., Ltd., Zhengzhou, China. No other fertilizer was supplied throughout the experiment. Plots were hand-weeded during the growing period whenever necessary for proper weed control. Plants were kept well-watered, and no diseases or pests occurred during the experiment period.

2.4. Investigation of Winter Survival Rate and Sampling

The winter survival rate was calculated depending on the number of initial plants (W) on 5–10 October 2019, and the number of living plants (L) was counted on 23–26 April 2020 and again on 25–30 April 2021 within 0.3 m2 in each plot, according to the following formula:
Winter   survival   rate   % = L   W × 100
Two forage harvests at the early flowering stage from early July to late August were carried out in Siziwang County and three forage harvests at the early flowering stage from late June to middle September were carried out in Tuzuo County in 2020 and 2021. Sampling should be avoided on borderlines to prevent marginal utility. A an area of 1.0 m2 from the center of each plot was harvested, approximately 5 cm above the ground. Fresh weight was determined, dried at 105 °C for 30 min and then at 65 °C for 48 h, re-dried and re-weighed, until it reached a constant weight; the percentage of dry matter of the forage was determined, and the dry matter yield per hectare was calculated based on the forage fresh weight and the percentage of dry matter of the forage. Shoots per plant were calculated by counting ten plants in each plot before harvest. Plant height was measured for ten plants in each plot before harvest. A subsample of 10 shoots was hand-collected in each plot before harvest, weighted, and the percentage of dry matter of forage was used to calculate the dry mass shoot−1. Taproots in a 1.0 m2 area of each plot were excavated to a depth of 10 cm and counted before each harvest in each year to determine plant density. The annual forage yield was counted by summing the yield of each harvest. After each harvest, all border areas around plots were removed.

2.5. Statistical Analysis

Analysis of variance was performed on winter survival rate, yield, and yield components using SPSS 26. Where F-tests were significant (p < 0.05), LSD was calculated to compare means. Data were analyzed using the general linear models (GLM) procedure. Because forage yield is a linear function of plants m−2, shoots plant−1, plant height, and mass shoot−1, we used correlation analysis to determine the effects of each yield component on forage yield. These values were assigned to dummy variables representing linear, quadratic, cubic, and quartic polynomial contrasts and their interaction. Occasionally, a regression model exhibiting an anomalous relationship was rejected. Differences in regression slopes were determined using the standard error of the difference between the slopes adjusted for the experimental error [7]. We used the general linear model procedure to identify the P fertilization rates that maximize forage yield and winter survival. Because forage yield is a linear function of plants m−2, shoots plant−1, plant height, and shoot mass, and given those yield components themselves are often correlated with one another, we used path analysis to determine the direct effects of individual yield components on forage yield [7].

3. Results

3.1. Main Effect of Soil Types and P fertilizer

Although differences among cultivars with fall dormancy category existed for winter survival, forage yield of each harvest, plants m−2, and shoots plant−1, as expected (Table 3), the focus of the study was on soil types and P fertilizer effects. Consequently, cultivars with fall dormancy category effects will not be discussed.

3.2. Winter Survival Rate

The effects of P fertilizer on winter survival were investigated in the two sites (Figure 1). In the two sites, the winter survival rates both increased first and then decreased with the increase of P application over two years, and the winter survival rates of 2020 were higher than those of 2021 in the two sites. In Siziwang County, the winter survival rate reached 85.6%% at 90 kg ha−1, but did not have a significant difference from the control in 2020, while the winter survival rate reduced to 63.8% at 45 kg ha−1 in 2021, and had a significant difference from the control (Figure 1a). In Tuzuo County, the winter survival rate reached 93.4% at 45 kg ha−1 in 2020, which was significantly higher than that of the control, while the winter survival rates in 2021 did not have a significant difference among P treatments, which reached 65.3% at 90 kg ha−1, a little higher than other treatments (Figure 1b).
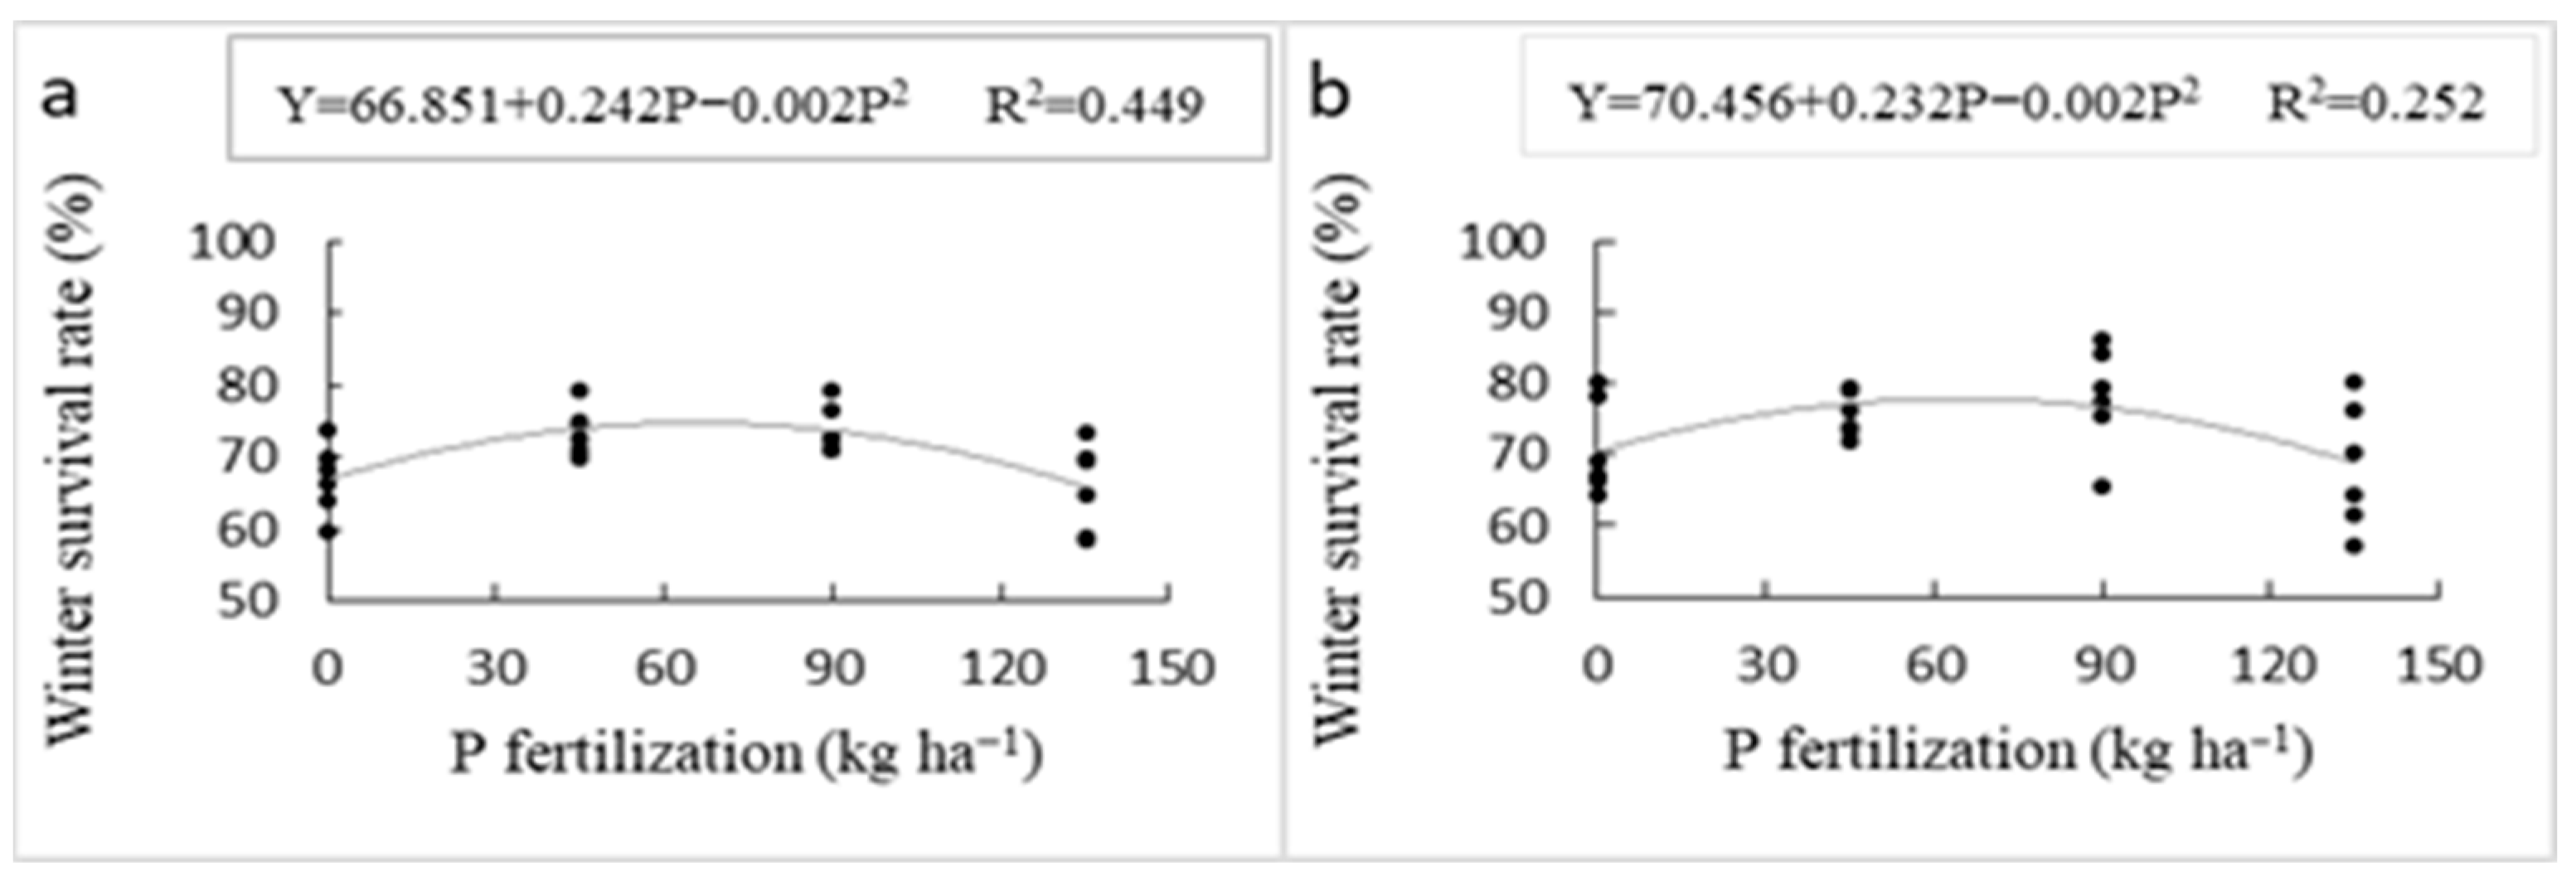
The response curve and degree of response were different for the two sites. However, P fertilizer had significant linear effects on the mean winter survival rate for the two years (Figure 2). The quadric curve fit the data best for the winter survival rate in the two sites. In Siziwang County, the winter survival rate and P fertilizer had a significant quadratic regression relationship (p < 0.01), where the winter survival rate reached a maximum value at the P fertilizer application of 60.5 kg P2O5 ha−1 (Figure 2a). In Tuzuo County, the winter survival rate and P fertilizer also had a significant quadratic regression relationship (p < 0.05), where the winter survival rate reached a maximum value at the P fertilizer application rate of 58.0 kg P2O5 ha−1 (Figure 2b).

3.3. Forage Yield

The effects of P fertilizer on forage yield were investigated in the two sites (Table 4). The site, year, harvest, and P fertilizer all impacted the forage yield.
In Siziwang County, the forage yield of each harvest increased with the increase of P fertilization in 2020; when P was applied at more than 90 kg ha−1, the forage yield of the first harvest was significantly higher than that of the control, and when P was applied at 135 kg ha−1, the forage yield of the second harvest was significantly higher than that of the control. The annual forage yield of 2020 also increased with the increase of P fertilization. When P was applied at more than 90 kg ha−1, it reached more than 9000 kg ha−1, which was significantly higher than that of the control. The forage yield of each harvest both increased first and then decreased with the increase of P fertilization in 2021; when P was applied at 45 kg ha−1, the forage yield of the first harvest reached 4638.6 kg ha−1, which was not significantly higher than the control, while when P applied at 90 kg ha−1, the forage yield of the second harvest reached 3849.4 kg ha−1, which was higher than the control (p < 0.05). The annual forage yield also increased first and then decreased with the increase of P fertilization; it reached 8386.6 kg ha−1 under 90 kg P2O5 ha−1, which was increased by 39.2% relative to the control.
In Tuzuo County, the forage yield of each harvest and the annual yield both increased first and then decreased with the increase of P fertilization in 2020. When P was applied at 90 kg ha−1, each harvest and annual forage yield reached the greatest value, the forage yields of each harvest were 6562.2 kg ha−1, 4064.4 kg ha−1 and 2709.1 kg ha−1, and the forage yield was 13,335.6 kg ha−1, all of them significantly higher than those of the controls. The forage yield of the first harvest increased first and then decreased with the increase of P fertilization in 2021; the application of P fertilizer at 90 kg ha−1 reached 6331.7 kg ha−1, which was significantly higher than that of control, while the forage yields of the second harvest under P fertilization were all greater than those of the control (p < 0.05). The forage yield of the third harvest did not have an obvious difference between the P treatments and the control. However, when P was applied at 90 kg ha−1, the forage yield was much greater than the others. The annual forage yield of 2021 increased first and then decreased with the increase of P fertilization; when P2O5 was applied at 90 kg ha−1, it reached 14,287.6 kg ha−1, which was increased by 53.9% relative to the control.
The application of P fertilizer had significant linear effects on forage yield, but the response curve and degree were different in the two sites (Figure 3). The forage yield and P fertilizer had significant quadratic regression relationships in the two sites (p < 0.01). In Siziwang County, through derivative calculation, the maximum mean forage yield of the two years reached 8774.4 kg ha−1 under 108.1 kg P2O5 ha−1. In Tuzuo County, through derivative calculation, the maximum mean forage yield of the two years reached 13,022.3 kg ha−1 under 78.3 kg P2O5 ha−1.

3.4. Yield Components

3.4.1. Plant Population Density

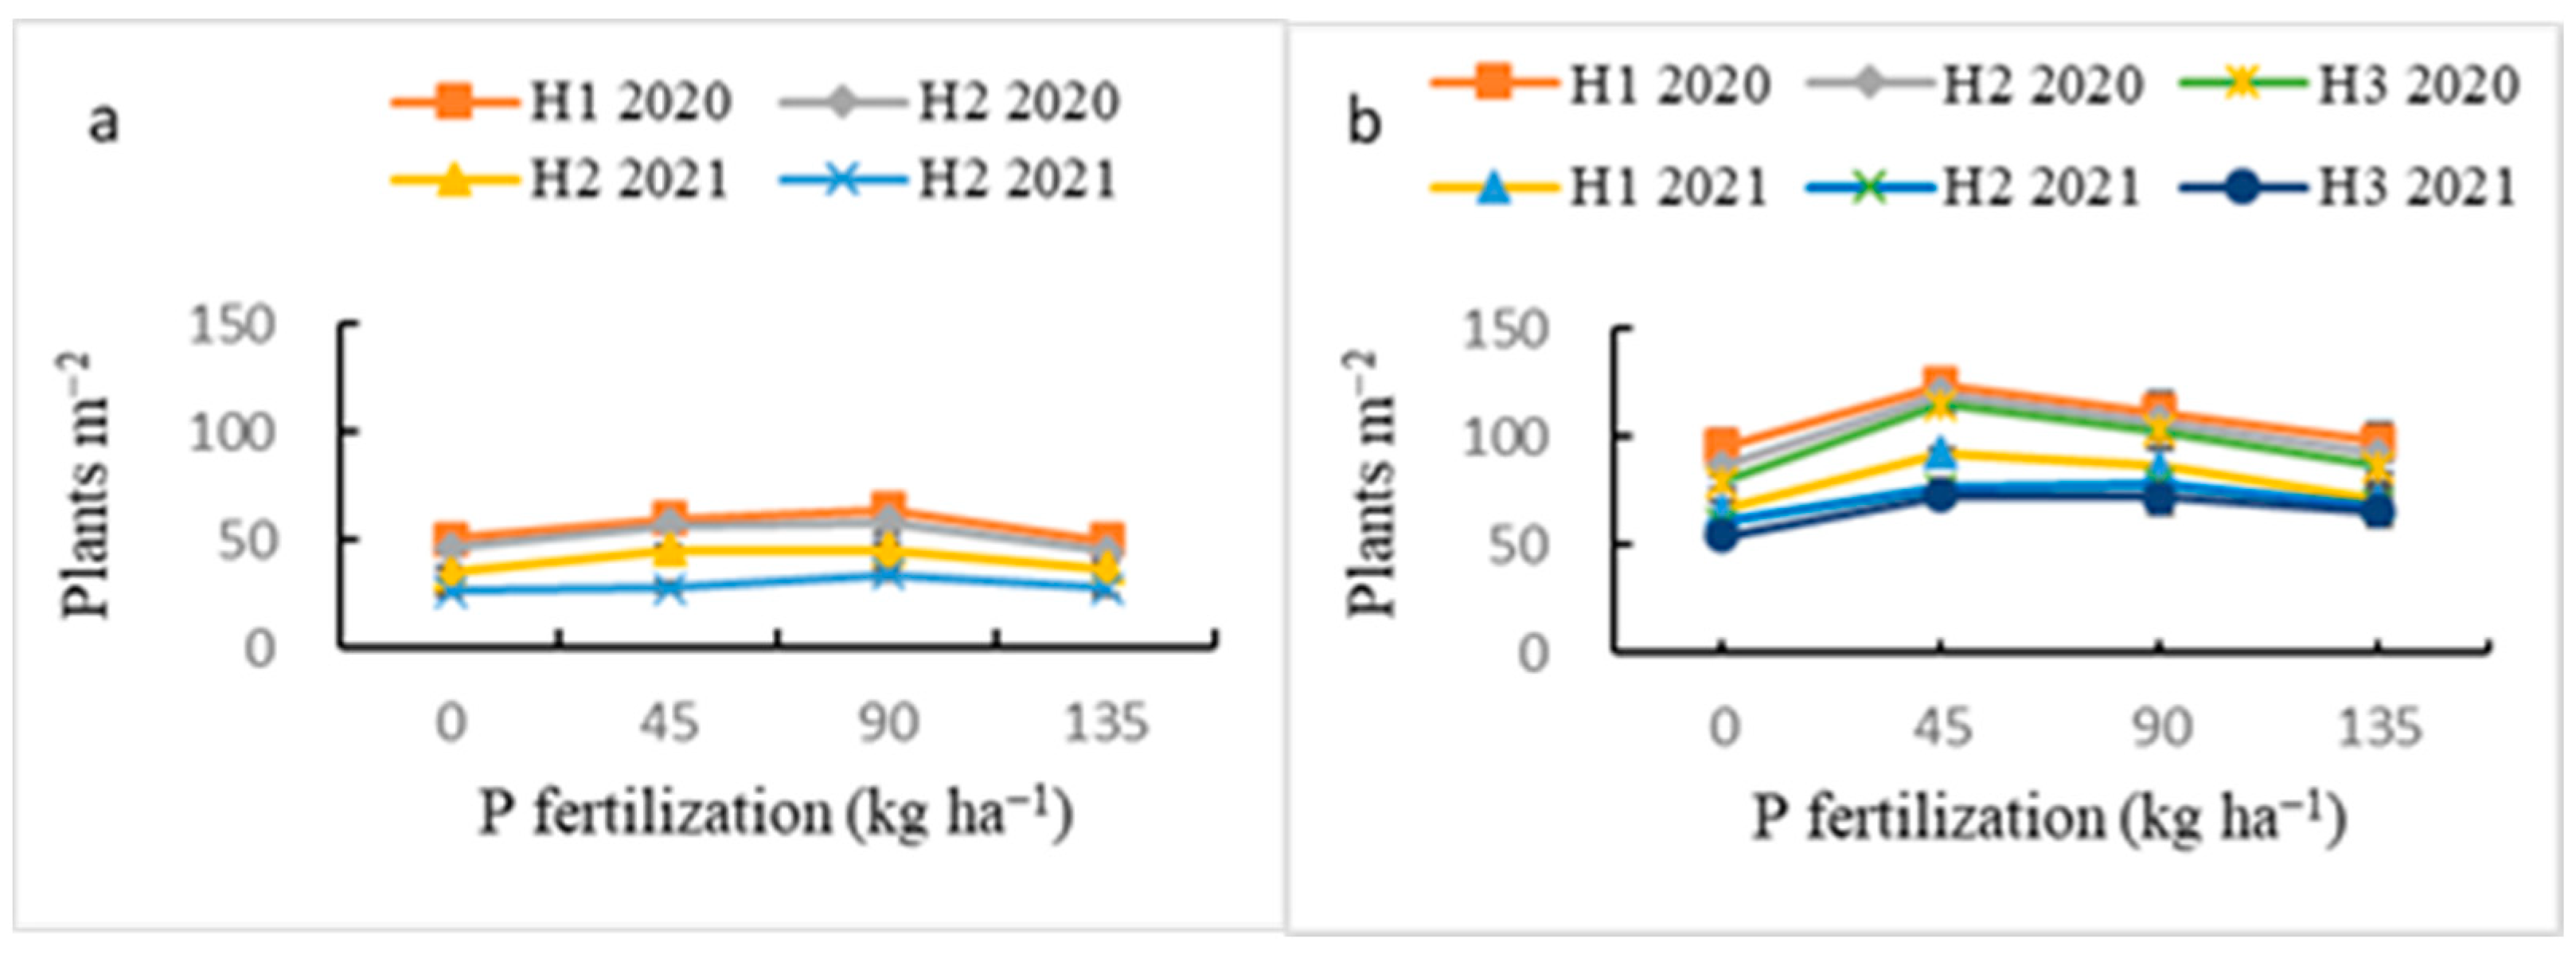
Alfalfa forage yield can be described as the product of three components: plants m−2, shoots plant−1, and mass shoot−1 [17]. The application of P fertilizer impacted the plant population density of alfalfa in the two sites (Figure 4). The plant population density increased first and then decreased with the increase of P fertilizer in the two sites. In Siziwang County, when P was applied at 90 kg ha−1, the plant population density of each harvest was greater than the control (p < 0.05) (Figure 4a). Ignoring the influence of P and cultivar, plots averaged 56.25 plants m−2 in July 2020, and this decreased to 51.92 plants m−2 in late August 2020, decreased to 41.08 plants m−2 in July 2021, and decreased to 29.38 plants m−2 in late August 2021 (not shown in the figure). By the regression analysis, the plant population density had significant linear effects on forage yield (Table 5). The regression models subsequently developed exhibited a linear relationship between forage yield and plants m−2 of each harvest. The forage yield increased with the increase in the plant population density.
In Tuzuo County, when P was applied at 45 kg ha−1, the plant population density of each harvest was greater than that of the control. Ignoring the influence of P fertilizer and cultivar, plots averaged 107.25 plants m−2 in June 2020, decreased to 95.9 plants m−2 in September 2020, and then decreased to 79.0 plants m−2 in June 2021 and decreased to 66.0 plants m−2 in September 2021 (Figure 4b). The regression models developed exhibited a linear relationship between forage yield and plants m−2 of each harvest. The forage yield increased with the increase in the plant population density (Table 5).

3.4.2. Shoots per Plant

The effects of P fertilizer on shoots number were investigated in the two sites (Figure 5). In Siziwang County, the shoots per plant increased with the increase of P fertilization in the two years. In 2020, when P was applied at 135 kg ha−1, the shoots plant−1 of the first harvest was 10.1, increased by 28.8% relative to the control (p < 0.05); the shoots plant−1 of the second harvest did not have an obvious difference among fertilization treatments, from 12.5 to 14.2. In 2021, when P was applied at more than 90 kg ha−1, the shoots plant−1 of the first harvest was greater than that of the control (p < 0.05), increased by more than 19.2%; and the shoots plant−1 of the second harvest did not have a significant difference among fertilization treatments, arranged from 12.0 to 13.1. In the two years, the shoots plant−1 of the first harvest was less than that of the second harvest (Figure 5a). The regression models developed exhibited a consistent positive linear relationship between forage yield and shoots plant−1 of each harvest, and the forage yield increased with the increase of the shoots per plant (Table 6).
In Tuzuo County, the shoots plant−1 of the first harvest increased first and then decreased with the increase of P fertilization treatments in 2020; when P was applied at more than 90 kg ha−1, the shoots plant−1 was significantly greater than that of the control; the shoots plant−1 of the second harvest of 2020 increased with the increase of P fertilization treatments and increased from 25.4% to 78.0%, while the shoots plant−1 of the third harvest did not change obviously under any P fertilization. In 2021, the shoots plant−1 of the first harvest under any P fertilization did not have a significant difference from the control, and the shoots plant−1 of the last two harvests did not have a significant difference between applied P fertilizer treatments and the control. In the same year, the shoots plant−1 of the following harvest was more than that of the previous harvest (Figure 5b). The regression analysis, there was a linear correlation between forage yield and shoots plant−1 of the first harvest in 2020 (y = 3388 + 94.746x), the forage yield increased with the increase of shoots plant−1, and there was a quadratic regression correlation between forage yield and shoots plant−1 of the second harvest in 2020 (y = 1556 + 1085x − 61.508x2). The optimum shoots plant−1 was 8.82; the linear relationship between forage yield and shoots plant−1 of the third harvest was not obvious, and the slope was 0.0002 (Table 6). In 2021, there were linear correlations between forage yield and shoots plant−1 of the first two harvests, and the forage yield increased with the increase of shoots plant−1. The forage yield of the third harvest had a quadratic regression correlation with the shoots plant−1, and the optimum shoots plant−1 was 23.6 (Table 6).

3.4.3. Plant Height

The effects of the P fertilizer rate on plant height were investigated in the two sites (Figure 6). In Siziwang County, the plant height did not have an obvious change in 2020; the plant height of the first harvest ranged from 60.7 to 67.8 cm, and the second harvest ranged from 49.2 to 55.0 cm. The plant height of the first harvest increased first and then decreased in 2021, when P was applied at 45 kg ha−1, the plant height was 52.05 cm, which was an increase of 12.7% relative to the control; and the plant height of the second harvest did not show a significant change with the increase of P fertilization, ranging from 40.7 to 44.9 cm. The plant height of the first harvest was greater than that of the second harvest in the two years (Figure 6a). The regression models developed exhibited a consistent positive linear relationship between forage yield and plant height of each harvest in 2020; the forage yield increased with the increase of plant height (Table 7). As plant height increased, the forage yield increased until plant height reached 53.6 and 44.8 cm for every harvest in 2021, respectively (Table 7).
In Tuzuo County, the plant heights of the first two harvests increased first and then decreased with the increase of P fertilization in 2020; the plant height reached 76.3 and 73.4 cm, respectively. When P was applied at more than 90 kg ha−1, the plant heights of the third harvest were greater than those of the control. The plant heights of 2021 did not change obviously with the increase of P fertilization. The plant heights of the first two harvests were greater than the first harvest (Figure 6b). Forage yield also had a linear correlation with plant height in 2020; the forage yield increased with greater plant height (Table 7). The regression models developed exhibited a consistent quadratic correlation between forage yield and plant height of the first harvest; the forage yield reached a greater value when the plant height was 66.5 cm; the forage yield of the second harvest showed a linear correlation with plant height, the forage yield increased with greater plant height; the forage yield of the third harvest also exhibited a consistent quadratic correlation with plant height; when the plant height was more than 43.0 cm, the forage yield increased with the plant height (Table 7).

3.4.4. Shoot Mass

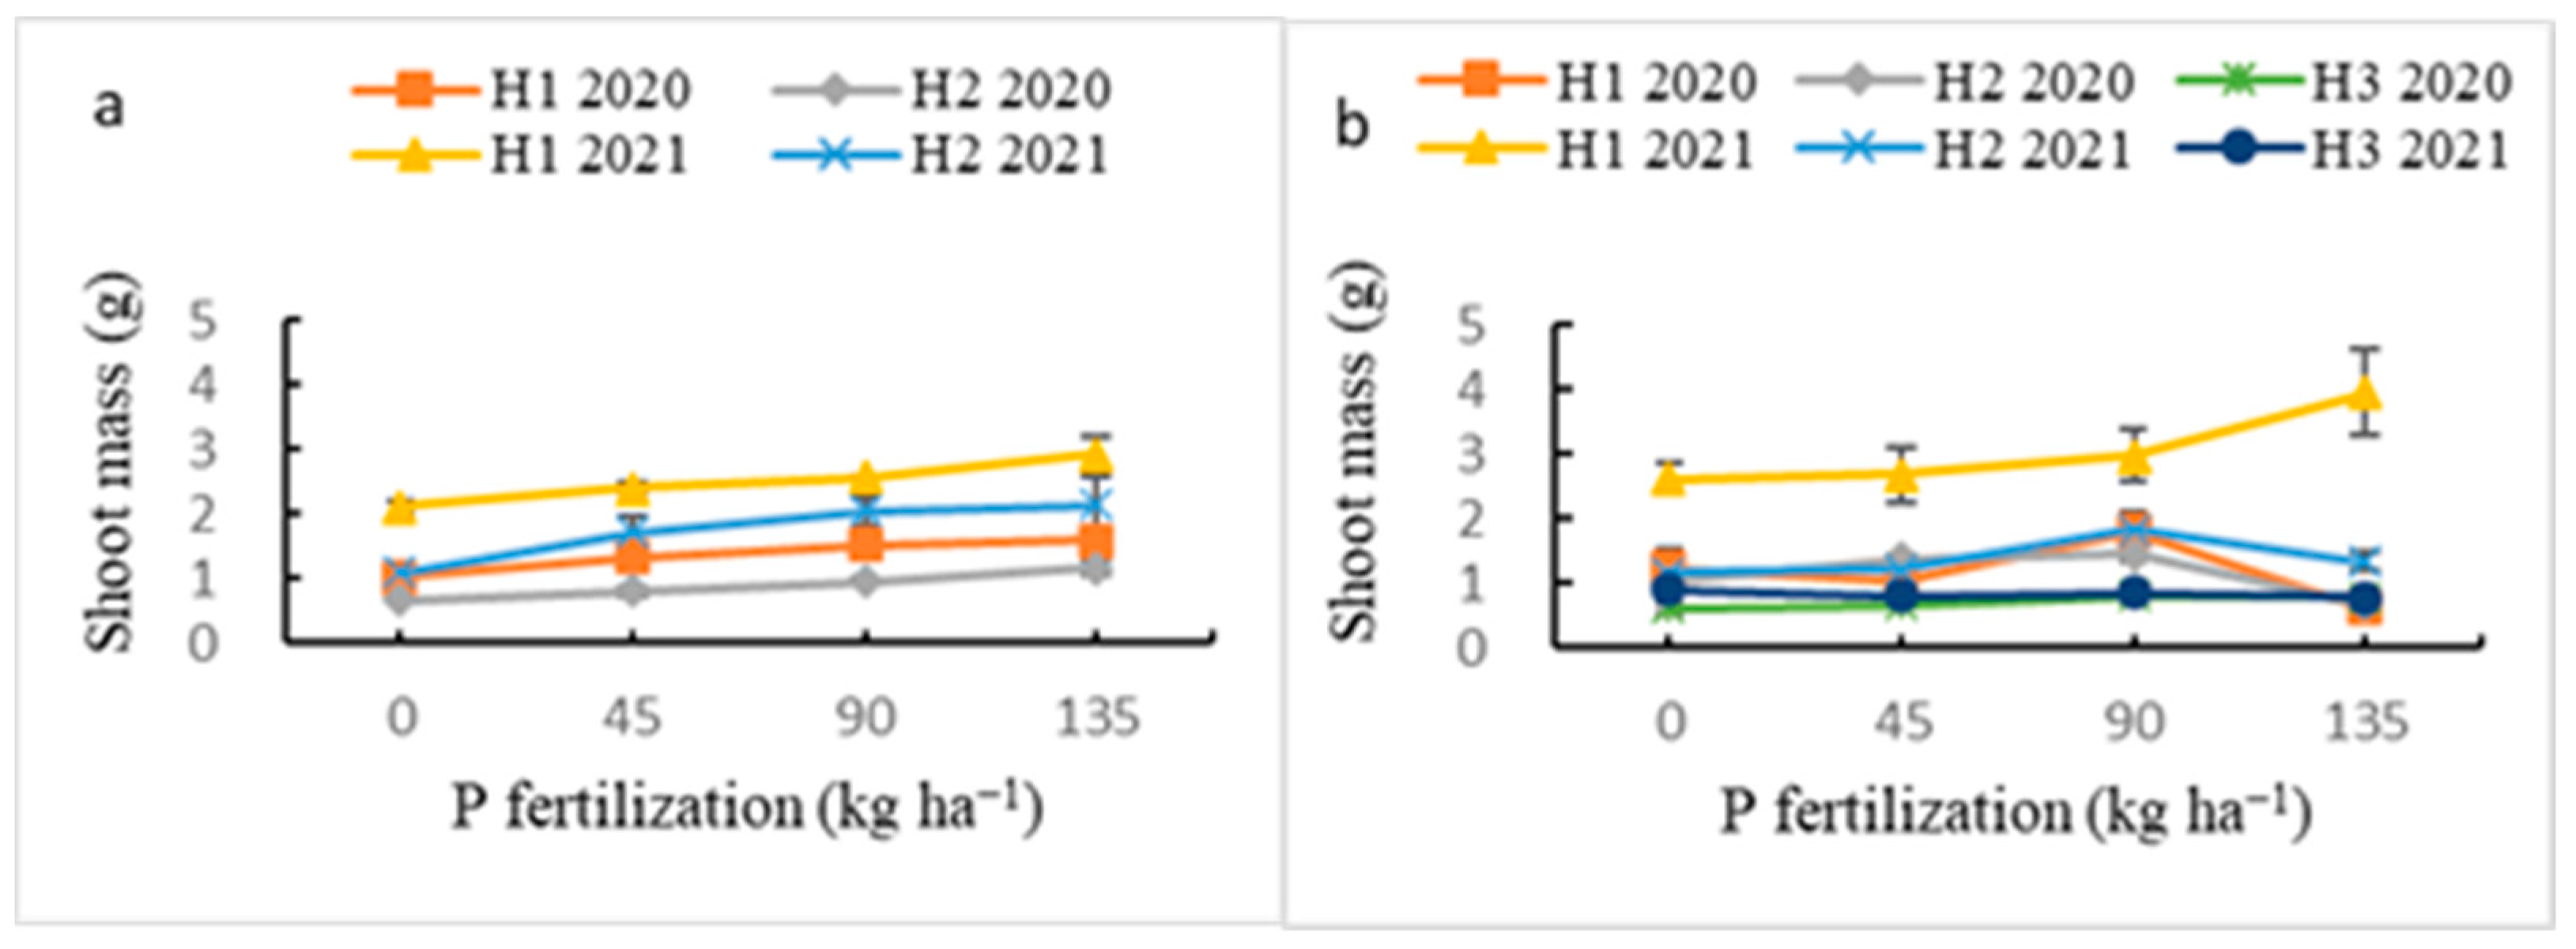
The effects of P fertilizer on shoot mass were investigated in the two sites (Figure 7). In Siziwang County, the shoot mass of each harvest increased first and then decreased with the increase of P fertilization in 2020 and 2021. When P was applied at more than 90 kg ha−1, the shoot mass of each harvest was greater than that of the control, increased by 39.1~70.1% in 2020; when P was applied at 135 kg ha−1, the shoot mass of the first harvest in 2021 was significantly greater than that of the control, increased by 38.4%; and when P was applied at more than 90 and 135 kg ha−1, the shoot mass of the second harvest in 2021 was greater than that of the control, increased by 85.1% and 93.9%. The shoot mass of the first harvest was greater than that of the second harvest in the two years (Figure 7a). Through the regression equation analysis, we found that the forage yield of 2020 increased with greater shoot mass. The forage yield of 2021 exhibited a consistent quadratic correlation with shoot mass; when the shoot mass was 1.76 and 2.02 g, the alfalfa reached the ideal forage yield (Table 8).
In Tuzuo County, the shoot mass of the first two harvests in 2020 increased first and then decreased with the P fertilization treatment; when P was applied at 90 kg ha−1, the shoot masses of the first two harvests were 1.81 and 1.45 g, increased by 45.3% and 42.9% relative to the control, respectively, while the shoot mass of the third harvest did not have obvious differences among treatments. The shoot mass of each harvest in 2021 did not have a significant difference between P fertilization and the control (Figure 7b). The regression models developed exhibited a consistent positive linear relationship between the forage yield and shoot mass of each harvest in 2020 and 2021; the forage yield increased with greater shoot mass (Table 8).

3.5. Relative Importance of Yield Components

To better understand the direct effect of each yield component on forage yield, a four-component path analysis (plants m−2, shoots plant−1, plant height, shoot mass) was performed at each harvest and year. The ratio of path coefficients of the yield components provides an estimate of the relative importance of each component on forage yield [12].
In Siziwang County, path analysis revealed that plants m−2 did not make a significant contribution to forage yield (p > 0.05) (Table 9). In the first harvest, plant height made a greater contribution than shoot mass and shoots plant−1 (ratio 1.71:1 for plant height:shoots plant−1); in the second harvest, only plant height made a greater contribution to forage yield, and others did not make a significant contribution (p > 0.05). With regards to the year, in 2020, plant height made a greater contribution to forage yield than shoot mass (ratio 1.32:1 for plant height:shoot mass); in 2021, plant height made a greater contribution than plants m−2 (ratio 1.43:1 for plant height:plants m−2).
In Tuzuo County, the plants m−2 did not make a significant contribution to forage yield at each harvest and year either (p > 0.05) (Table 10). In the first harvest, only plant height and shoot mass made a contribution to forage yield, and plant height made a greater contribution than shoot mass (ratio 1.14:1 for plant height:shoot mass); in the second harvest, only plant height and shoots plant−1 made contributions to forage yield, and they made an approximately equal impact on forage yield (ratio 1.02:1 for plant height:shoots plant−1); in the third harvest, only plant height contributed to forage yield. With regards to the year, plant height and shoot mass made a contribution to forage yield, and plant height was more than twice as important in defining forage yield compared to shoot mass in 2020 (ratio 2.33:1 for plant height:shoot mass); in 2021, plant height and shoot mass had an approximately equal impact on forage yield (ratio 0.83:1 for plant height:shoot mass).

4. Discussion

4.1. Application of P Fertilizer Affects Winter Survival of Alfalfa

The cold resistance of alfalfa refers to its ability to survive in winter and regenerate in the following Spring [29], which directly affects its persistence and production capacity. Plant nutrition is one management factor to improve alfalfa winter survival. Fertilization with P and K has long been known to improve the persistence and yield of alfalfa [30,31]. Jung and Smith [9] reported that P fertilization was essential for plant survival. Some reports indicated no impact, and occasionally a negative effect of enhanced P and K nutrition on winter survival. Gross et al. [32] found that plant density decreased with P fertilization. Berg et al. [7] also reported that fertilization with P decreased plant population. Sanderson and Jones [23] found that delayed application of P on fall-planted alfalfa did not affect plant density. In our study, despite some reductions in the alfalfa population following emergence, the winter of 2019–2020 was warmer than usual, and the winter survival rates of alfalfa in the two sites were both more than 80%; the effects of P fertilizer on winter survival were obvious in the Tuzuo experiment site, where the winter survival rate of which reached 93.4% at 45 kg ha−1 in 2020, whereas it reached 65.3% at 90 kg ha−1 in 2021. The winter of 2020–2021 was colder than usual, and although some alfalfa plants survived in the first winter, but died in the winter of 2020–2021, the alfalfa under a proper amount of P fertilization had a greater overwintering rate, especially for the Siziwang experiment site, where the maximum winter survival rate in 2020 did not have a significant difference from the control, whereas the maximum winter survival rate in 2021 had a significant difference from the control. The suitable amount of P fertilizer for a greater winter survival rate was 45~90 kg ha−1 in the two sites. The effect of P fertilizer on winter survival was related to other factors, including temperature, soil test P levels, and the content of other mineral elements, which may be responsible for this overwintering difference. The initial P content of the soil was relatively high, and in a warm winter, the addition of P would not significantly affect the overwintering of alfalfa. If more severe stress had been placed on the soils to supply P to the plant, such as done today with exceptionally high yields and the cold winter of 2020–2021, the initial P soil supply may not be sufficient to carry the crop through the winter [12,33]. The other interpretation of the confusion may be that it resulted from inaccuracies associated with estimating plant numbers by counting crowns from aboveground instead of directly digging and counting plants [3].

4.2. Application of P Fertilizer Affects Alfalfa Yield and Yield Components

P is a crucial element for alfalfa growth and agronomic performance [34]. When soil P is limited, plants tend to show a positive growth response to P addition [35]. Berg et al. [7] found that the addition of P fertilizer can increase alfalfa yield and stand persistence. Malhi et al. [27] reported that the alfalfa forage yield increased with P application, but its magnitude of response to added P was lower at Botha than at Lacombe, and the residual effect of large single P application on forage yield lasted at least for five years. However, the addition of P to P-deficient plants stimulated the growth of shoots but not roots [34]. In our study, proper application of P fertilizer increased alfalfa forage yield, and the effects of applying P fertilizer on alfalfa forage yield were significantly different at the two sites. Applying 90 kg P2O5 ha−1, the forage yield increased in the two sites; in Siziwang County, the forage yield of 2020 reached 9101.5 kg ha−1, which was an increase of 54.0% relative to the control. Because a large amount plants died in the cold winter of 2020–2021 and the consumption of fertility, the forage yield of 2021 decreased relative to that of 2020; the forage yield under 90 kg ha−1 reached 8386.8 kg ha−1, which was increased by 39.2% relative to the control. To obtain the ideal forage yield, the optimum amount of P2O5 application was 108.1 kg ha−1. In Tuzuo County, the forage yield of 2020 under 90 kg P2O5 ha−1 reached 13,335.6 kg ha−1, which was an increase of 89.9% relative to the control, and reached 14,287.2 kg ha−1 in 2021, which was an increase of 53.9% relative to the control. The optimum P2O5 application rate for alfalfa production was 78.3 kg ha−1 for Tuzuo County. The test P levels of the two soil types were different, and the different contents of other nutrient elements and water conditions in the two sites may also have led to the different demands of P fertilizer for higher forage yield. Insufficient or excessive supply of P fertilizer would reduce the forage yield of alfalfa to some extent, and only appropriate application of P fertilizer can maximize higher yield and the ideal economic benefits [36].
Alfalfa forage yield can be described as the product of three components: plants area−1, shoots plant−1, and mass shoot−1 [17]. Adequate soil P at planting is essential to establishing productive stands of legumes [23]. Supplemental P should be placed according to the native soil fertility and soil P-fixing capacity [37]. Previous reports on the effect of P fertilizer on alfalfa density have had different results. Markus and Battle [30] and Berg et al. [38] found that decreased alfalfa populations were observed in response to enhanced P fertilization. Sanderson and Jones [23] found that the delayed application of P to fall-planted alfalfa did not affect plant density. In a decade-long alfalfa fertility study, stand densities in plots fertilized with both P and K were greater than stand densities of plots fertilized with P alone [39]. In our study, applied P fertilizer improved plant population density in the two sites; however, the amount of P fertilizer required for high plant population in the two sites was different. The differences in the results are related to the initial P levels of soils in various regions. In the two years, plant losses totaled 27 plants m−2 in Siziwang County and 41 plants m−2 in Tuzuo County. As the climate and environmental conditions of Tuzuo County during the alfalfa planting period were better than those of Siziwang County, Tuzuo County had more initial plants m−2. Plants die not only in winter but also during the growing season [38]. As the plant grows, intraspecific competition gradually intensifies later, including competition for water, light, and nutrients. Moreover, the winter-injured plants may survive through the first harvest but subsequently die later in summer [38]. These reasons may lead to Tuzuo County losing more plants m−2.
Improved plant nutrition is helpful to increase plant persistence. P fertilizer application can increase the number of leaves and stems, promote root development, increase the forage yield, and improve soil fertility [40]. Application of P fertilizer increased the initial plant population, but plants were also lost during the growing period; the magnitude reduction of the plants m−2 was equal to that of the no fertilization treatment. The decline in the alfalfa population may have resulted from enhanced interplant competition for light, water, and nutrients that eliminated smaller, less vigorous plants from the genetically heterogeneous population of plants that comprise an alfalfa stand. This is because extensive shading and low nutrition content cause preferential death of the weakest plants in the population [41]. Robust, P-responsive plants have greater mass and have more rapid regrowth after harvest, eventually crowding out smaller, less vigorous, slower-growing alfalfa plants [38].
The shoots number of alfalfa is the number of branches derived from the taproot, which are needed for forage yield [42]. Shoots plant−1 is the yield component that is thought to increase as stand density declines to maintain a high yield [43]. The application of P fertilizer can increase the shoots number and yield of alfalfa [44]. In our study, the shoots plant−1 of alfalfa in Siziwang County increased with the P fertilization and shoots plant−1 of the second harvest was larger than that of the first harvest. However, the shoots plant−1 in Tuzuo County also increased with the P fertilization in 2020, while the shoots plant−1 in 2021 did not have an obvious difference between P fertilization treatments. There was a slight increase in shoots plant−1 at the same harvest in the two years. The greater forage yield needed more shoots plant−1, except for the second harvest of 2020 and the third harvest of 2021 in Tuzuo County. Berg et al. [38] found that slight increases in shoots plant−1 occurred as plant populations decreased, but these changes were independent of P fertilization. The shoots plant−1 of alfalfa is determined by genetics, which would be affected by nutrition and other environmental conditions to a certain extent, but it will not continue to increase with the improvement of nutritional conditions [17].
Mass shoot−1 is the most important component of forage yield [18]. Increased mass shoot–1 has consistently been associated with the improved agronomic performance of alfalfa, and improved soil fertility is a strategy to increase mass shoot−1 [25]. When applying an appropriate amount of P fertilizer, the shoot mass increased in a consistently positive relationship with forage yield. Two components determine mass shoot−1: mass shoot height−1 and height shoot−1. The latter has a more direct impact on forage yield [12]. In our study, shoot mass and plant height both increased when the P application rate increased, and were also linearly correlated with forage yield. Rapid shoot initiation rates after harvest permit shoot regrowth to resume quickly after harvest, resulting in high plant height and shoot mass [45]. Plants receiving P initiated shoot growth quicker, leading to higher plant height and greater shoot mass [25].

5. Conclusions

When alfalfa was planted in soil with mild P deficiency in Inner Mongolia, the winter survival rates and forage yield increased at first and then decreased with the increase of P application; the greater winter survival rates were achieved at 45~90 kg ha−1 of P fertilizer applied, while the greater forage yield was achieved at 90 kg ha−1 in the two sites. The suitable P fertilizer application rates for greater winter survival were less than those for higher forage yield; plant height and shoot mass made a greater contribution to forage yield than other yield components. To pursue a higher forage yield, the suitable P fertilization rates for aeolian sandy soil and silt loam soil were 108.1 and 78.3 kg P2O5 ha−1, respectively, based on the regression equations. Therefore, when fertilizing alfalfa production in alpine and soil P deficiency areas, the most appropriate amount of fertilizer should be determined according to climate and soil conditions.

Author Contributions

Y.W., J.X. and L.Y. designed the study. Y.W., Z.S. and Q.W. carried out the study and acquired the data. Y.W. analyzed the data and wrote the manuscript. J.X. and L.Y. revised the manuscript. All authors have read and agreed to the published version of the manuscript.

Funding

This research was funded by Achievement Transformation Project in Science and Technology of Inner Mongolia (2019CG041), Science and Technology Program of Inner Mongolia (2020GG0176), High-level talent introduction project of Inner Mongolia University (10000-22311201/016), Major Science and Technology Program of Hohhot (2021-Key-Social-2), Major Science and Technology Program of Inner Mongolia (2021ZD0031), Alfalfa breeding for high quality and industry demonstration (2022JBGS0020), Technological Innovation2030-Major program (2022ZD0401202). The funding bodies had no contribution to the study’s design, data collection, analysis, interpretation, or manuscript writing.

Data Availability Statement

The datasets generated during and/or analyzed during the current study are available from the corresponding author or the first author upon reasonable request.

Acknowledgments

We thank Xianglin Yue and Jiageng Zhang for assistance in field measurements.

Conflicts of Interest

The authors declare no conflict of interest.

References

  1. Radovic, J.; Sokolovic, D.; Markovic, J. Alfalfa-most important perennial forage legume in animal husbandry. Biotechnol. Anim. Husb. 2009, 25, 465–475. [Google Scholar] [CrossRef]
  2. Humphries, A.W.; Ovalle, C.; Hughes, S.; del Pozo, A.; Inostroza, L.; Barahona, V.; Yu, L.; Yerzhanova, S.; Rowe, T.; Hill, J.; et al. Characterization and pre-breeding of diverse alfalfa wild relatives originating from drought-stressed environments. Crop Sci. 2020, 61, 69–88. [Google Scholar] [CrossRef]
  3. Castonguay, Y.; Laberge, S.; Brummer, E.C.; Volenec, J.J. Alfalfa winter hardiness: A research retrospective and integrated perspective. Adv. Agric. 2006, 90, 203–265. [Google Scholar] [CrossRef]
  4. Xu, H.; Tong, Z.; He, F.; Li, X. Response of Alfalfa (Medicago Sativa L.) to Abrupt Chilling as Reflected by Changes in Freezing Tolerance and Soluble Sugars. Agronomy 2020, 10, 255. [Google Scholar] [CrossRef] [Green Version]
  5. Geng, H. Alfalfa of China; China Agricultural Press: Beijing, China, 1995. [Google Scholar]
  6. Vasileva, V.; Kostov, O. Effect of alfalfa grown for forage on soil fertility related to mineral and organic fertilization. Emir. J. Food Agric. 2015, 27, 678–686. [Google Scholar] [CrossRef] [Green Version]
  7. Berg, W.K.; Cunningham, S.M.; Brouder, S.M.; Joern, B.C.; Johnson, K.D.; Santini, J.B.; Volenec, J.J. The long-term impact of phosphorus and potassium fertilization on alfalfa yield and yield components. Crop Sci. 2007, 47, 2198–2209. [Google Scholar] [CrossRef]
  8. Richardson, A.E.; Lynch, J.P.; Ryan, P.R.; Delhaize, E.; Smith, F.A.; Smith, S.E.; Harvey, P.R.; Ryan, M.H.; Veneklaas, E.J.; Lambers, H.; et al. Plant and microbial strategies to improve the phosphorus efficiency of agriculture. Plant Soil 2011, 349, 121–156. [Google Scholar] [CrossRef]
  9. Jung, G.A.; Smith, D. Influence of soil potassium and phosphorus content on the cold resistance of alfalfa. Agron. J. 1959, 51, 585–587. [Google Scholar] [CrossRef]
  10. Ren, W.B.; Chen, L.B.; Guo, H.Q.; Zhu, X.U.; Xie, J.H. Progress in Winter Hardiness and Survival of Alfalfa. Chin. J. Grassl. 2008, 2, 104–108. [Google Scholar] [CrossRef]
  11. He, H.; Peng, Q.; Wang, X.; Fan, C.; Pang, J.; Lambers, H.; Zhang, X. Growth, morphological and physiological responses of alfal fa (Medicago sativa) to phosphorus supply in two alkaline soils. Plant Soil 2017, 416, 565–584. [Google Scholar] [CrossRef]
  12. Ventroni, L.M.; Volenec, J.J.; Cangiano, C.A. Fall dormancy and cutting frequency impact on alfalfa yield and yield components. Field Crop Res. 2010, 119, 252–259. [Google Scholar] [CrossRef]
  13. Jiang, H.; Shen, Y.; Zhai, G.; Liu, Z. Effect of phosphate fertilizer on the shoot growth and forage yield of Medicago Sativa L. Acta Agrestia Sin. 2009, 17, 588–592. [Google Scholar]
  14. Vu, D.T.; Tang, C.; Armstrong, R.D. Changes and availability of P fractions following 65years of P application to a calcareous soil in a Mediterranean climate. Plant Soil 2008, 304, 21–33. [Google Scholar] [CrossRef]
  15. Ulrich, A.E.; Malley, D.F.; Watts, P.D. Lake Winnipeg Basin: Advocacy, challenges and progress for sustainable phosphorus and eutrophication control. Sci. Total Environ. 2015, 542, 1030–1039. [Google Scholar] [CrossRef] [PubMed]
  16. Fixen, P.E.; Johnston, A.M. World fertilizer nutrient reserves: A view to the future. J. Sci. Food Agric. 2012, 92, 1001–1005. [Google Scholar] [CrossRef] [PubMed]
  17. Volenec, J.J.; Cherney, J.H.; Johnson, K.D. Yield components, plant morphology, and forage quality of alfalfa as influenced by plant population. Crop Sci. 1987, 27, 321–326. [Google Scholar] [CrossRef]
  18. Teixeira, E.I.; Moot, D.J.; Brown, H.E.; Fletcher, A.L. The dynamics of lucerne (Medicago Sativa L.) yield components in response to defoliation frequency. Eur. J. Agron. 2007, 26, 394–400. [Google Scholar] [CrossRef]
  19. Undersander, D.J.C.; Grau, D.; Cosgrove, J.D.; Martin, N. Alfalfa Stand Assessment: Is the Stand Good Enough to Keep; University of Wisconsin-Extension: Madison, WI, USA, 1998; pp. 3–6. [Google Scholar]
  20. Cowett, E.R.; Sprague, M.A. Factors affecting tillering in alfalfa1. Agron. J. 1962, 54, 937–940. [Google Scholar] [CrossRef]
  21. Feng, Y.Q.; Cao, Z.Z. Correlation analysis of yield components of Longdong black medic. J. Gansu Agric. Univ. 2006, 41, 76–78. [Google Scholar] [CrossRef]
  22. Wang, Y.; Zhang, J.; Yu, L.; Xu, Z.; Samac, D.A. Overwintering and Yield Responses of Two Late-Summer Seeded Alfalfa Cultivars to Phosphate Supply. Agronomy 2022, 12, 327. [Google Scholar] [CrossRef]
  23. Sanderson, M.A.; Jones, R.M. Stand dynamics and yield components of alfalfa as affected by phosphorus fertility. Agron. J. 1993, 85, 241–246. [Google Scholar] [CrossRef]
  24. Yang, M.; Shi, S.L. Study on grown diversity of alfalfa root. Grassl. Turf. 2016, 36, 21–27. [Google Scholar] [CrossRef]
  25. Li, R.; Volenec, J.J.; Joern, B.C.; Cunningham, S.M. Effects of phosphorus nutrition on carbohydrate and protein metabolism in alfalfa roots. J. Plant Nutr. 1998, 21, 459–474. [Google Scholar] [CrossRef]
  26. Deng, L.; Wang, K.B.; Li, J.P.; Shangguan, Z.P.; Sweeney, S. Carbon Storage Dynamics in Alfalfa (Medicago sativa) Fields in the Hilly-Gully Region of the Loess Plateau, China. Clean Soil Air Water 2014, 42, 1253–1262. [Google Scholar] [CrossRef]
  27. Malhi, S.S.; Arshad, M.A.; Gill, K.S.; McBeath, D.K. Response of alfalfa hay yield to phosphorus fertilization in two soils in central Alberta. Commun. Soil Sci. Plant Anal. 2008, 23, 717–724. [Google Scholar] [CrossRef]
  28. Sun, H.; Cao, Y.; Liu, L.; Wu, Y.; Yang, X.; Zhao, Y. Preliminary study on abundance-deficiency index of soil available P and appropriate phosphorus application rates for alfalfa in the North of China. Soil Fertil. Sci. China 2016, 3, 30–36. [Google Scholar] [CrossRef]
  29. Cunningham, S.M.; Gana, J.A.; Volenec, J.J.; Teuber, L.R. Winter Hardiness, Root Physiology, and Gene Expression in Successive Fall Dormancy Selections from ‘Mesilla’ and ‘CUF 101’ Alfalfa. Crop Sci. 2001, 41, 1091–1098. [Google Scholar] [CrossRef] [Green Version]
  30. Markus, D.K.; Battle, W.R. Soil and plant responses to long-term fertilization of alfalfa (Medicago Sativa L.). Agron. J. 1965, 1, 613–616. [Google Scholar] [CrossRef]
  31. Powell, R.D. Alfalfa Fertilization; University of Wisconsin-Extension: Madison, WI, USA, 1972; p. A2448. [Google Scholar]
  32. Gross, H.D.; Wilsie, C.P.; Pesek, J. Some responses of alfalfa varieties to fertilization and cutting treatments. Agron. J. 1958, 50, 161–164. [Google Scholar] [CrossRef]
  33. Mays, D.A. Effect of fertilization on winterhardiness of forages. In Forage Fertilizer; Kresge, C.B., Ed.; Tennessee Valley Authority Pullman: Washington, DC, USA, 1974. [Google Scholar]
  34. Abu Qamar, S.F.; Cunningham, S.M.; Volenec, J.J. Phosphate Nutrition and Defoliation Effects on Growth and Root Physiology of Alfalfa. J. Plant Nutr. 2006, 29, 1387–1403. [Google Scholar] [CrossRef]
  35. Elser, J.J.; Bracken, M.E.S.; Cleland, E.E.; Gruner, D.S.; Harpole, W.S.; Hillebrand, H.; Ngai, J.T.; Seabloom, E.W.; Shurin, J.B.; Smith, J.E. Global analysis of nitrogen and phosphorus limitation of primary producers in freshwater, marine and terrestrial ecosystems. Ecol. Lett. 2007, 10, 1135–1142. [Google Scholar] [CrossRef] [Green Version]
  36. Liu, H.X.; Li, N.; Sheng, J.D.; Yan-Bo, F.U.; Wang, X.D. Effects of Phosphorus Fertilizer on the Growth and Seed Yield of Alfalfa. Acta Agrestia Sin. 2013, 21, 571–575. [Google Scholar]
  37. Mays, D.A.; Griffith, W.K. Satisfying the Nutritional Requirements of Established Legumes. Forage Fertil. 1974, 147–169. [Google Scholar] [CrossRef]
  38. Berg, W.K.; Cunningham, S.M.; Brouder, S.M.; Joern, B.C.; Johnson, K.D.; Santini, J.; Volenec, J.J. Influence of phosphorus and potassium on alfalfa yield and yield components. Crop Sci. 2005, 45, 297–304. [Google Scholar] [CrossRef]
  39. Hanson, R.G.; Macgregor, J.M. Soil and alfalfa plant characteristics as affected by a decade of fertilization. Agron. J. 1966, 58, 3–5. [Google Scholar] [CrossRef]
  40. Wen, Y. Effect of Phosphorus and Potassium Nutrition on Yield and Quality of Alfalfa (Medicago Sativa L.) and Related Mechanisms; Chinese Academy of Agricultural Sciences: Beijing, China, 2005. [Google Scholar]
  41. Lemaire, G.; Onillon, B.; Gosse, G.; Chartier, M.; Allirand, J.M. Nitrogen distribution within a lucerne canopy during regrowth: Relation with light distribution. Ann. Bot. 1991, 68, 483–488. [Google Scholar] [CrossRef]
  42. Wang, Y.H.; Li, D.F.; Qi, S.L.; Wang, C.Z.; Li, P.F. Effects of seeding rate and variety on branch number and plant height of alfalfa. Acta Pratacult. Sin. 2017, 26, 183. [Google Scholar]
  43. Suzuki, M. Effects of stand age on agronomic, morphological and chemical characteristics of alfalfa. Can. J. Plant 1991, 71, 445–452. [Google Scholar] [CrossRef] [Green Version]
  44. Sun, Y.M.; Liu, X.S.; Zhang, Q.B.; Wu, H.; Ma, C.H. Effects of phosphorus application on hay yield and phosphorus contents of alfalfa under drip irrigation. Acta Pratacult. Sin. 2019, 28, 154–163. [Google Scholar] [CrossRef]
  45. Singh, Y.; Winch, J.E. Morphological development of two alfalfa cultivars under various harvesting schedules. Can. J. Plant Sci. 1974, 54, 79–87. [Google Scholar] [CrossRef]
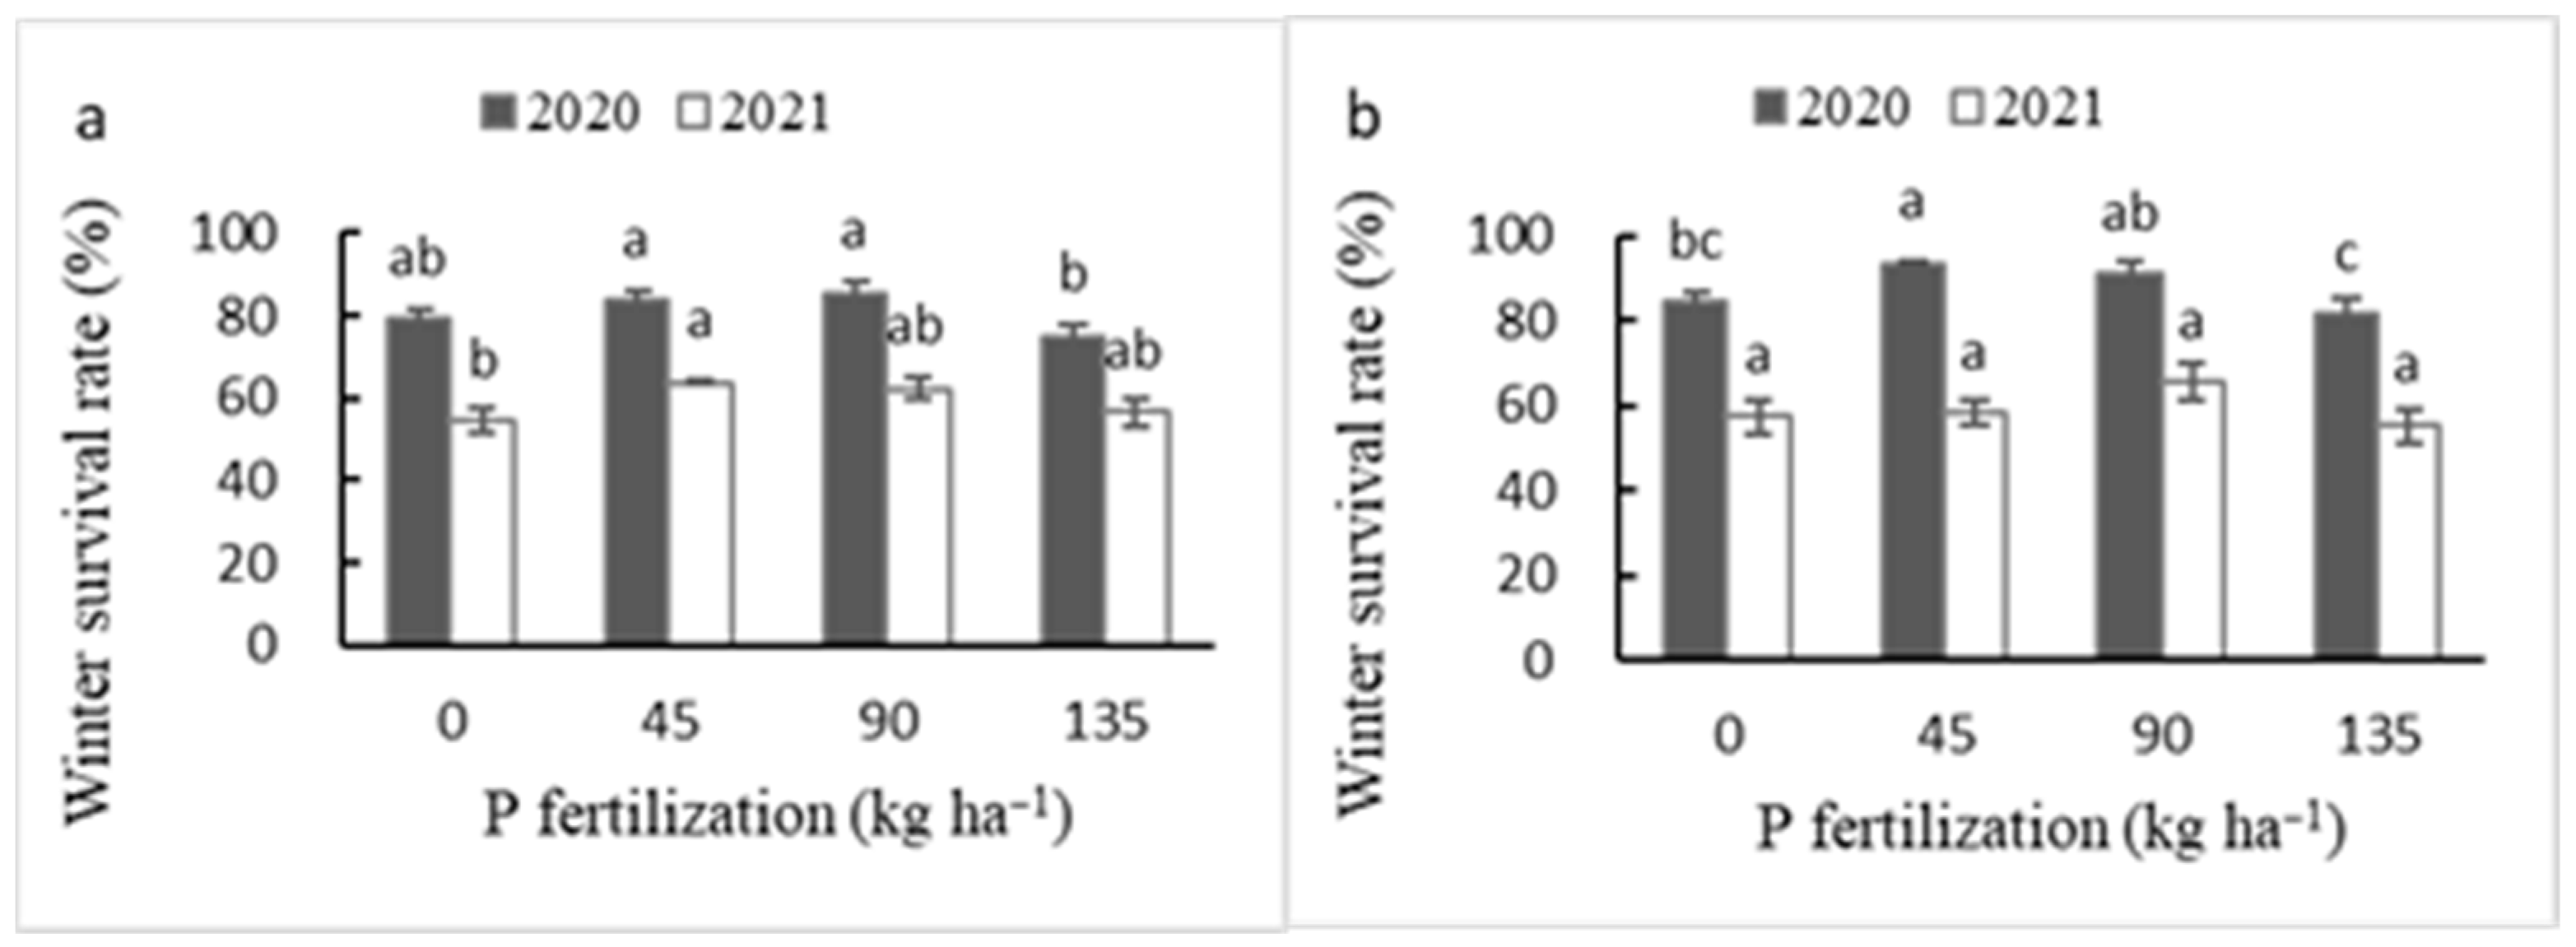
Figure 1. Effects of P fertilizer on winter survival in the two sites in 2020 and 2021. (a) Means the winter survival rate in Siziwang County, and (b) means the winter survival rate in Tuzuo County. Different letters indicate a significant difference between treatments (p < 0.05). Error bars indicate the standard deviation of the mean, n = 6.
Agronomy 13 01565 g001
Figure 2. Relationships between winter survival rate and P fertilization rate. (a,b) show the relationships between winter survival rate and P fertilization rate in the two sites. Each data point represents each replication of each cultivar. The figure includes data (n = 48) from four P fertilization treatments in the two sites.
Agronomy 13 01565 g002
Figure 3. Relationships between annual forage yield and P fertilization rate. (a) The mean forage yield of the two years in Siziwang County; (b) the mean forage yield of the two years in Tuzuo County. The figure includes data (n = 48) from four P fertilization treatments in the two sites.
Agronomy 13 01565 g003
Figure 4. Application of P fertilizer on alfalfa plant population density in the two sites. (a) Plant population density in Siziwang County; (b) plant population density in Tuzuo County. Error bars indicate the standard deviation of the mean, n = 6.
Agronomy 13 01565 g004
Figure 5. Application of P fertilizer on shoots per plant of alfalfa in the two sites. (a) Shoots per plant of alfalfa in Siziwang County; (b) shoots per plant of alfalfa in Tuzuo County. Error bars indicate the standard deviation of the mean, n = 6.
Agronomy 13 01565 g005
Figure 6. Application of P fertilizer on plant height of alfalfa in the two sites. (a) Plant height of alfalfa in Siziwang County; (b) plant height of alfalfa in Tuzuo County. Error bars indicate the standard deviation of the mean, n = 6.
Agronomy 13 01565 g006
Figure 7. Application of P fertilizer on alfalfa shoot mass in the two sites. (a) Shoot mass of alfalfa in Siziwang County; (b) shoot mass of alfalfa in Tuzuo County. Error bars indicate the standard deviation of the mean, n = 6.
Agronomy 13 01565 g007
Table 1. Initial soil characteristics (15 cm depth) for the two sites.
SiteSoil TypeOrganic C
(g kg−1)
Total N (g kg−1)Available P
(mg kg−1)
Available K
(mg kg−1)
Salt
(g kg−1)
pH
SiziwangAeolian sandy soil30.51.7121.4306.51.438.6
TuzuoSilt loam soil7.301.0913.3384.01.398.5
Table 2. The air temperatures (°C) and precipitation (mm) by month for each year.
MonthSiziwang CountyTuzuo County
Temperature (°C)Precipitation (mm)Temperature (°C)Precipitation (mm)
201920202021201920202021201920202021201920202021
Jan.−11.9−11.4−11.904.80−9.8−8.5−9.503.35.3
Feb.−10.8−5.8−4.14.402.0−8.0−406.314.50.1
Mar.−0.20.11.98.915.19.22.034.53.725.16.7
Apr.8.56.57.129.50.2010.98.58.517.23.70.1
May13.614.312.731.419.636.415.516159.829.223.5
June19.219.418.548.95162.721.42020.547.973.219.4
July19.919.620.8127.6176.881.921.42123102.389.1104.7
Aug.18.218.617.682.5103.167.319.8202091.368.9171.6
Sept.14.912.715.162.59.930.616.814.517.5101.42554.2
Oct.6.34.44.711.314.613.78.05.57.518.32310.2
Nov.−2.0−3.6−3.44.718.818.7−0.5−0.5−17.10.15.7
Dec.−9.9−13.7−8.61.600−9.7−11−6.56.80.10.3
Table 3. Analysis of variance for yield, plants m−2, shoots plant−1, height, shoot mass, annual yield and winter survival for site, harvest, year, cultivar and P treatment.
Sourcedf+YieldPlants m−2Shoots Plant−1HeightShoot Mass Annual YieldWinter Survival
Site1******************
Harvest2***************
Year1*********ns*********
Cultivar1*********nsns******
P3*********************
Site × harvest1***nsns***ns
Site × year1******ns***********
Site × cultivar1ns***ns****nsns
Site × P3******ns********ns
Harvest × year2***ns*****
Harvest × cultivar2ns****ns**
Harvest × P6**nsns******
Year × cultivar1nsns*ns*nsns
Year × P3***ns*****nsns
Cultivar × P3ns****nsnsns**
Site × harvest × year1**ns***ns***
Site × harvest × cultivar1nsnsnsns***
Site × harvest × P3nsnsnsnsns
Site × year × cultivar1nsnsnsnsnsnsns
Site × year × P3***nsns*********ns
Site × cultivar × P3****nsnsns*ns
Harvest × year × cultivar2nsns*ns**
Harvest × year × P6*nsns******
Harvest × cultivar × P6nsns**nsns
Year × cultivar × P3nsnsnsns**nsns
Site × harvest × year × cultivar1nsnsnsns*
Site × harvest × year × P3nsnsnsns*
Site × harvest × cultivar × P3nsnsnsns*
Site × year × cultivar × P3nsnsnsnsnsnsns
Harvest × year × cultivar × P6nsnsnsns*
Site × harvest × year × cultivar × P3nsnsns****
Note: *, **, and *** Significant at 0.05, 0.01, and 0.001 probability levels, respectively. df+: Degrees of freedom. ns: Not significant at the 0.05 probability level.
Table 4. Effects of P fertilization on the yield of alfalfa in the two sites.
SiteYearHarvestLevels of Applied P (kg ha−1)
04590135
Siziwang2020H1 3859.8 ± 367.6 b5508.8 ± 851.9 ab5809.2 ± 448.6 a5943.8 ± 598.3 a
H2 2038.7 ± 304.1 b2648.1 ± 264.9 b3242.3 ± 623.9 ab4348.4 ± 487.9 a
Annual5898.5 ± 564.2 b8206.9 ± 927.2 ab9101.5 ± 1006.1 a10,292.2 ± 934.1 a
2021H13882.5 ± 387.9 a4638.6 ± 401.5 a4537.5 ± 190.2 a4019.6 ± 210.3 a
H2 2142.6 ± 200.9 b2687.1 ± 245.8 b3849.4 ± 397.3 a2873.2 ± 405.3 b
Annual6025.1 ± 516.3 b7325.8 ± 487.3 ab8386.8 ± 487.9 a6892.8 ± 567.5 ab
Tuzuo2020H1 3078.0 ± 164.8 c4999.1 ± 354.1 b6562.2 ± 474.2 a2437.0 ± 161.5 c
H2 2321.2 ± 119.4 c3292.2 ± 327.5 b4064.4 ± 258.7 a2072.1 ± 154.4 c
H31625.3 ± 93.9 c2143.1 ± 152.5 b2709.1 ± 131.8 a1809.2 ± 227.1 bc
Annual7024.5 ± 313.6 c10,434.4 ± 645.5 b13,335.6 ± 320.8 a6318.3 ± 392.8 c
2021H1 3569.7 ± 563.0 c4498.7 ± 627.3 bc6331.7 ± 709.9 a5543.9 ± 320.8 ab
H23375.8 ± 296.1 b5327.0 ± 487.1 a4952.0 ± 293.1 a5535.7 ± 225.8 a
H3 2339.6 ± 214.3 ab2111.9 ± 130.9 b3003.4 ± 133.9 a2624.4 ± 379.9 ab
Annual9285.1 ± 866.6 b11,937.6 ± 977.5 a14,287.2 ± 846.2 a13,704.0 ± 697.1 a
Note: Different letters in the same row indicate a significant difference among P fertilization treatments (p < 0.05).
Table 5. Regression equations, R2 values, and p values for the influence of plants m−2 on forage yield at each harvest in 2020 and 2021.
SiteHarvest20202021
Plants m−2R2p ValuePlants m−2R2p Value
SiziwangH1y = 2875 + 42.76x0.0870.163y = 3948 + 7.83x0.0060.720
H2y = 2879 + 4.14x0.0010.880y = 7816 − 401.7x + 7.66x20.2320.063
TuzzuoH1y = 1038 + 30.125x0.1120.110y = 14,351 − 250.92x + 1.606x20.0700.467
H2y = 601 + 23.041x0.2220.020y = 3266 + 21.53x0.0600.248
H3y = 360 + 17.849x0.3800.001y = 4846 − 61.041x + 0.374x20.0600.552
Table 6. Regression equations, R2 values, and p values for the influence of shoots per plant on forage yield at each harvest in 2020 and 2021.
SiteHarvest20202021
Shoots Plant−1R2p ValueShoots Plant−1R2p Value
SiziwangH1y = 2955 + 266.348x0.0700.213y = 2030 + 224.385x0.1700.045
H2y = −503 + 275.734x0.2310.017y = 1462 + 112.16x0.0410.345
TuzzuoH1y = 3388 + 94.746x0.0310.411y = 3811 + 142.593x0.0190.519
H2y = −1556 + 1085x − 61.508x20.2190.075y = 3148 + 125.969x0.0640.233
H3y = 10.632 + 0.0002x0.0010.883y = −524 + 298.51x − 6.312x20.2740.035
Table 7. Regression equations, R2 values, and p values for the influence of plant height on forage yield at each harvest in 2020 and 2021.
SiteHarvest20202021
Plant HeightR2p ValuePlant HeightR2p Value
SiziwangH1y = −804 + 94.459x0.2770.008y = −21,333 + 966.187x − 9.014x20.2330.061
H2y = −1830 + 94.493x0.3540.002y = −30,635 + 1514.672x − 16.894x20.2210.072
TuzzuoH1y = −1656 + 92.598x0.4970.000y = −37,232 + 1289.212x − 9.692x20.2770.033
H2y = −1027 + 32.13x0.2560.012y = 3264 + 21.577x0.0230.483
H3y = 575 + 40.027x0.1840.036y = −9035 − 311.448x + 3.618x20.3480.011
Table 8. Regression equations, R2 values, and p values for the influence of shoot mass on forage yield at each harvest in 2020 and 2021.
SiteHarvest20202021
Shoot MassR2p ValueShoot MassR2p Value
SiziwangH1y = −3378 + 1378.802x0.0920.151y = −4078 + 293.026x − 83.432x20.0110.892
H2y = −92 + 3305.794x0.4420.000y = −1799 + 1283.273x − 317.444x20.0680.478
TuzzuoH1y = −2450 + 1533.601x0.2410.015y = −2850 + 697.666x0.2440.014
H2y = −1381 + 1379.479x0.3970.001y = 3899 + 649.409x0.1000.133
H3y = 1664 + 566.934x0.0320.403y = −1521 + 1192.632x0.1630.051
Table 9. Path coefficient analysis at each harvest and year in Siziwang County.
SiziwangH1 aH2Year 2020 bYear 2021
Plants m−2 → yield c------------
Shoots plant−1 → yield c0.38---------
Plant height → yield c0.650.460.580.55
Shoot mass → yield c------0.440.45
a By each harvest n = 48. b By year n = 48. c Direct effect of yield components on forage yield. --- Not significant at the 0.05 level.
Table 10. Path coefficient analysis at each harvest and year in Tuzuo County.
TuzuoH1 aH2H3Year 2020 bYear 2021
Plants m−2 → yieldc---------------
Shoots plant−1 → yield c---0.47---------
Plant height → yield c0.330.480.520.560.36
Shoot mass → yield c0.29------0.240.43
a By each harvest n = 48. b By year n = 48. c Direct effect of yield components on forage yield. --- Not significant at the 0.05 level.
Disclaimer/Publisher’s Note: The statements, opinions and data contained in all publications are solely those of the individual author(s) and contributor(s) and not of MDPI and/or the editor(s). MDPI and/or the editor(s) disclaim responsibility for any injury to people or property resulting from any ideas, methods, instructions or products referred to in the content.