Abstract
Rare earth elements (REEs) and 18 other elements in the vegetables (carrot, parsley, cabbage, potato, onion) and soils from two villages near tailings management facilities in the Baia Mare area, NW Romania, were measured. The soil-to-plant transfer and the health risks posed by the consumption of these vegetables were also assessed. The pseudo-total concentrations of elements varied widely in the soil and vegetables, with the lowest concentrations being found for Ta (2.1 µg/kg) and the highest for Fe (9219 mg/kg). The concentration of total light REEs (LREEs) was considerably higher than that of heavy REEs (HREEs). The percentages of available elements were <20% of the pseudo-total concentration, except for Zn, Cd, and Pb, where the available fractions were much higher. Generally, the soil-to-plant transfer factors decreased in the following order: parsley > onion > cabbage > carrot > potato, and varied from element to element. The LREEs were less absorbed than the HREEs in all investigated vegetable species. Pearson correlations revealed strong positive correlations between the lanthanides, except for Eu, in the soil and vegetables. No important health risks following the consumption of vegetables were found for REEs, the estimated daily intake of REEs through vegetable consumption being much lower than the acceptable daily intake.
1. Introduction
Rare earth elements (REEs) have chemical properties that change gradually across the series from La to Lu [1,2]. Generally, REEs occur collectively in various minerals and are trivalent except for Ce3+, which can be oxidized to Ce4+ under typical surface conditions, and Eu3+, which can be reduced to Eu2+ under extremely reducing conditions and/or high temperature [3,4]. REEs have similar physicochemical properties and multiple applications, some of them being considered critical elements [2,5]. Due to their unique properties, such as luminescence, ferromagnetism, and superconductivity, REEs are important in the high-tech industry [6,7,8].
Plant uptake represents the major pathway for the migration of elements from soil to the human diet, posing potential human and environmental health risks [9]. High concentrations of REEs in the soil can enter the human body through the food chain and display adverse effects, namely structural changes in bone tissue and genotoxicity [2,5]. REEs can reach plants from the soil by uptake through the roots system and from the air through the leaves [10]. However, concentrations of REEs in plants are generally low, these elements being unessential for plant functioning [11,12,13]. Increased research on potential human health risks following exposure to REEs was noticed recently, yet there are currently no regulatory thresholds for foods and industrial emissions [12,14,15]. Low health risks following dietary REEs exposure of the population in China and the northeastern Qinghai-Tibet Plateau were reported [15,16]. The bioaccessible fractions of REEs estimated through selective single extractions and in vitro methods were less than 20% in Amazon soils and did not pose non-carcinogenic or carcinogenic risks for children and adults [17]. As a previous study reported, due to the trophic dilution of REEs in both terrestrial and aquatic food chains, the highest concentrations of REEs are found mainly in plants and, to a lesser extent, in foods of animal origin [18]. However, the exponentially growing use of REEs in electronics, clean energy production, aerospace, automotive and defense industry [6,7,8] may raise REEs’ environmental levels leading to toxicity concerns. The Gd in Gd-based contrast agents were found to migrate across the blood–brain barrier and accumulate in the brain, where they may cause severe neurological disorders. Some other potential human health effects of REEs include dysfunctional neurological disorders, oxidative stress, pneumoconiosis, bone alteration, genotoxicity, cytotoxicity, and fibrotic tissue injury [2,9,14].
The soil-to-plant transfer is a complex process that depends on various natural and anthropic factors. The soluble forms of elements are more prone to uptake than residual ones [19,20]. The total element content indicates the overall level of soil pollution, but it does not provide information on the element’s bioavailability or toxicity [21]. Moreover, the bioavailability and mobility of elements to plants depend on the climatic conditions, physicochemical properties of the soil (pH, organic matter content, redox potential, carbonate content, presence of other components), oxidation state of element species, and plant roots, etc. [22]. The bioavailable element fraction in soil offers valuable information about elemental concentrations in plant tissues [23]. The selective chemical extraction of targeted element fractions in the soil can offer information on the element’s availability to plants and their mobility, as well as the extent to which an element may be bound to a particular soil phase [17,24,25].
The intense mining and smelting activities of the past, as well as the high geological background in the Baia Mare region, Romania, led to the pollution of soils with Cd, Cu, Pb, and Zn [21]. Three decommissioned tailings management facilities are located in the peri-urban area of Baia Mare, near agricultural lands and household gardens. The winds displace the fine particulates from ponds’ walls and deposit them in the adjacent areas, where locals cultivate vegetables; moreover, the soils and waters are contaminated by water infiltration from the tailing impoundments [21,26]. The consumption of home-grown vegetables is the main route for the intake of toxic elements and REEs in this area [26,27,28].
The main objectives of this study were to evaluate (i) the concentrations of pseudo-total and available concentrations of REEs and other elements in soils and of total REEs and other elements in vegetables collected from gardens located in the proximity of three tailings management facilities near Baia Mare city, NW Romania; (ii) the transfer of REEs and other elements from soil to vegetables; and (iii) the human health risks following long-term exposure to REEs through vegetable consumption.
2. Materials and Methods
2.1. Samples Collection and Preparation
Cabbage (Brassica oleracea, L.), onion (Allium cepa, L.), carrot (Daucus carota, L.), parsley (Petroselinum crispum, L.) and potato (Solanum tuberosum, L.) samples, together with composite soil samples from the area adjacent to these vegetables, were collected in September 2021, from nine household gardens situated in Bozanta Mare and Sasar villages. These villages are located at about 2 km from several inactive tailings management facilities that store tailings resulting from the flotation of polymetallic ores mined in the Baia Mare mining area, NW Romania (Figure 1). The emission of airborne particulate matter historically polluted the two villages resulted from former non-ferrous ores processing that caused a diffuse pollution of soils with metals, in addition to the influence of the tailings [21]. The gardens were randomly selected at similar distances from the tailings management facilities. We assumed that the soils collected in the two villages were of the same soil types and properties since the villages’ areas were relatively small and subjected to the same pollution influences over the last century. Depending on the vegetables cultivated in each garden, 1–5 pieces of vegetables were collected and brought to the laboratory in paper bags. Soil samples were taken from 0–25 cm depth from the proximity of the studied plants and combined into a composite sample that characterized each garden’s soil.
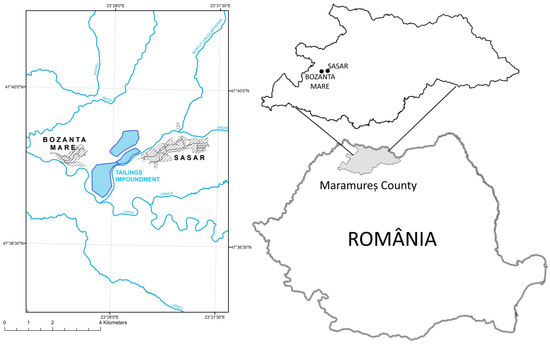
Figure 1.
Study area.
The edible parts of vegetables were washed under running water, rinsed with distilled water, and freeze-dried at 40 °C and 25 psi for 48 h using a FreeZone freeze dryer (Labconco, Kansas City, MO, USA). The freeze-dried samples were grounded using an agate mortar and pestle to obtain homogenized powders. The soil samples were air-dried, mechanically ground, and sieved with a 2 mm sieve.
2.2. Chemical Analysis
All the used chemicals were of analytical grade (Merck, Darmstadt, Germany), and were used as received without additional purification. A Direct Q3 Milli-Q system (Millipore, Molsheim, France) was used to produce ultrapure water to dilute the samples and prepare the standard solutions. To measure the pseudo-total element concentrations in the soil, dried soil samples were digested using a 37% HCl and 65% HNO3 mixture (3:1, v:v ratio, so-called aqua regia) [29]. The available concentrations of elements in the soil were determined after leaching, with a solution containing 0.005 mol L−1 DTPA, 0.01 mol L−1 CaCl2, and 0.1 mol L−1 triethanolamine (TEA) under continuous shaking for 2 h at 20 °C [30]. To measure the total element concentrations in the vegetables, the samples were digested using a 65% HNO3 and 30% H2O2 solution in a closed-vessel Speedwave Xpert microwave system (Berghof, Eningen, Germany), using the method described previously [26]. The element concentrations in the extracts were determined using an Agilent 7500 CX inductively coupled plasma mass spectrometer (Agilent Technologies, Santa Clara, CA, USA). The calibration solutions (0.01–100 μg L−1) were prepared by diluting multi-element standard solutions II and III (Perkin Elmer, Waltham, MA, USA). A mixed solution of Rh-Re was used as an internal standard to correct for general instrumental drift and potential matrix effects. The soil pH was determined in a 1:5 (m/v) suspension of soil in water using a 350i multiparameter (WTW, Weilheim, Germany). The soil’s total organic carbon (TOC) concentration was determined via catalytic combustion and non-dispersive infrared detection after carbonates dissolution with HCl, using a Multi N/C 2100 S analyzer (Analytic Jena, Jena, Germany).
The accuracy of the analysis was checked using CS ZC85006 Tomato (China National Analysis Center for Iron and Steel, Beijing, China), INCT-MPH-2 Mixed Polish Herbs (Institute of Nuclear Chemistry and Technology, Warsaw, Poland), ERM CC141 Loam soil (Institute for Reference Materials and Measurements, Geel, Belgium) and SRM 2709 San Joaquin Soil (National Institutes of Standards, Gaithersburg, MD, USA) certified reference materials (CRMs).
2.3. Health Risk Assessment for REEs
In order to evaluate the long-term potential health risks posed by REEs through the consumption of vegetables grown in the villages close to the tailing impoundments, the estimated daily intake (EDI) was calculated according to Equations (1) and (2):
where EDI is the estimated daily intake by vegetable category (µg kg−1 day−1), CREE is the average concentration of all REEs in vegetables (mg kg−1 ww), CREEO is the average concentration of all REE oxides (REEOs) in vegetables (mg kg−1 ww), FIR is the individual food ingestion rate of vegetable (g ww person−1 day−1), bw is the average body weight (kg). In order to convert the concentrations of REEs expressed as µg kg−1 dry weight (dw) in a concentration expressed as µg kg−1 ww (wet weight), we used dry-to-wet weight conversion factors, as follows: 0.2 for cabbage, and 0.25 for potato, carrot, parsley and onion [31]. To convert the REEs concentrations into concentration REEOs, the ƩREEs of each vegetable were multiplied with a coverage factor of 1.3 [32].
A total of 38 inhabitants (23 females and 15 males) between the ages of 18 and 83 that consumed vegetables grown in the study area were interviewed to establish the 24-h dietary recall further used to calculate the ingestion rate (FIR) of each vegetable.
3. Results and Discussion
3.1. Element Concentrations in Soil Samples
The instrument detection limits (0.003–0.025 µg L−1) were determined as three times the standard deviation of seven blank solutions. In the analysis of soil CRMs, recovery degrees between 93.0–105.9% and a relative standard deviation (RSD) of reproducibility between 2.7–16.5% were obtained for all elements.
The pseudo-total and available element concentrations in soil samples are presented in Table 1. The sum of La, Ce, Pr, Nd, Sm, Eu, and Gd concentrations represents the concentration of light REEs (LREEs), while the sum of Tb, Dy, Ho, Er, Tm, and Yb concentrations represents the concentration of heavy REEs (HREEs). The sum of the 14 naturally occurring REEs was expressed as total REEs (ΣREEs).

Table 1.
Pseudo-totals and available concentrations (average ± standard deviation) of elements in soil samples (n = 9, µg kg−1 dw).
Ce, La, and Nd were the most abundant REEs, accounting for 46, 20, and 17% of the total REEs concentration, respectively. The LREEs concentrations ranged from 95.4 to 167 mg kg−1, with an average of 127 mg kg−1. The LREEs represent 96% of the REEs concentrations in the studied soils. The HREEs concentrations ranged from 7.8 to 14.8 mg kg−1, with an average of 10.2 mg kg−1, representing only 4% of the REEs. The average available fraction represents 8–20% of the pseudo-total REEs concentration and 0.5–80% for the other elements. The lowest available REEs fraction was found for Ce (8%), and the highest was found for Er (20%). Extremely high available concentrations (>30%) were reported for Zn, Cd, and Pb. For each analyzed element, except for Zn and Cd, a significant difference between the available and pseudo-total concentration (p < 0.05) was indicated by Tukey’s test. A similar share of the potentially bioavailable fraction of REEs (10–16%) was reported in various soils from Germany using EDTA extraction [33].
The average LREEs concentration in the soils of the present study was lower than the value reported for China and higher than those for Cuba, Brazil, Japan, Sweden, Europe, the Earth’s crust [34] and Vancouver Island in British Columbia [35]. On the other hand, the average HREEs concentration was higher than in Cuban soils and comparable or slightly lower than elsewhere reported in the world (Spain, Italy, Greece, Norway, Portugal, Croatia, Poland, UK, Sweden, Germany, Austria, Slovakia, Brazil, Uganda, United States of America, China, Vancouver Island in British Columbia) [34,35,36,37]. The ΣREEs pseudo-total concentrations in soils ranged from 99.3 mg kg−1 to 175 mg kg−1, with an average value of 137 mg kg−1. Generally, the average concentration of ΣREEs in the soil is 165 mg kg−1, slightly higher than that in our study [38].
The average ΣREEs concentration in our study fell within the values reported in France, Germany, the Republic of Macedonia, Poland, Sweden, China, South Africa, Brazil, Japan, Australia [34,36,39], and in the residential area of Perak, Malaysia [40], and was lower than in the agricultural soil of Hezhang, in smelting and mining areas in China [41], in soils of the Langtang Himalaya, Nepal [34,42], and in soils collected in the ex-mining area in Perak, Malaysia [43]. In addition, the average concentration of ΣREEs was comparable with the median concentrations of REEs (except Yb, which was lower in our study) analyzed by the sodium peroxide fusion method in agricultural soils collected in Italy and Sweden [44]. Regarding the other elements investigated in our study, the average pseudo-total concentrations of Y were lower than in topsoils in Europe [37]; the Sc, Co, Ni, La, Ce, Pr, Nd, Sm, Eu, Gd, Tb, and Ho concentrations were comparable with those reported in different soil types in North Eastham, Massachusetts, USA [45]; the concentrations of Ge were significantly lower than in different regions of Germany [46]. Furthermore, the average concentrations of Co and Ni in our study were lower than those from the Langtang Himalaya and Nepal soils, while Cu, Zn, Cd, and Pb concentrations were higher in our study [40], but in the range of concentrations that were determined from agricultural soils along the Yellow River [47]. Many factors influence REEs concentrations in soil, e.g., adsorption and desorption processes, physical and chemical characteristics of the soil, pH, and the presence of organic material, explaining the high variability in REEs concentrations in soil reported in the literature worldwide [44].
3.2. Element Concentrations in Vegetables
For the plant CRMs, the recovery degrees and relative standard deviations of reproducibility ranged between 90.8–106%, respectively. The concentrations of various elements in vegetables are shown in Table 2. The concentrations of REEs in vegetables were very low compared to soil ones. However, they varied largely, with Lu having the lowest concentration and Ce with the highest concentration. Ce, the most abundant element among REEs in vegetables, recorded average concentrations of 24.2 ± 23.3 µg kg−1 in potato, 267 ± 204 µg kg−1 in carrot, 745 ± 720 µg kg−1 in onion, 445 ± 253 µg kg−1 in cabbage and 1382 ± 1329 µg kg−1 in parsley. For each investigated plant species, the LREEs concentrations were higher than the HREEs. The REEs concentrations in potato did not differ significantly from those in carrot, cabbage, and parsley, except for Eu and Tb, where these significantly differed from those in onion. The concentrations of most REEs in carrot significantly differed from those in onion but not from the other vegetable species.
Table 2.
Element concentrations (average ± standard deviation) in vegetables (µg kg−1, dw).
The concentrations of ƩREEs in vegetables depend on vegetable species [39,48], with the average concentrations of REEs decreasing in the following order: parsley > onion > cabbage > carrot > potato. In our study, the concentration of ƩREEs in vegetables was within the range reported in Chinese white cabbage, Chinese radish, water spinach, lettuce, long bean, pakchoi, and eggplant from a mining area in Fujian Province, southeast China [49], and in fresh vegetables (edible fungi, leafy vegetables, fruiting vegetables, legumes, brassica, and bulb vegetables) collected in different markets in China [32]. The concentration of ƩREEs was higher than in cereals (74.2 μg kg−1) and vegetables (94.1 μg kg−1) from Shandong, China [9], and in various plant species grown on sites with different land use types in the Freiberg (Germany) mining area [46]. In our study, the average concentrations of Sc and REEs in potatoes were comparable to those reported in North Eastham, Massachusetts, USA [45], and the average concentrations of Mn and REEs in carrots were comparable with those measured in carrots collected from Transylvania, Romania; however, the average concentrations of Fe, Sc, Zn, Cd, Pb, Th, Ga, Zr, and Mo were higher, while those of Co, Ni, Cu, Hf, and Ta were lower [50]. Regarding the other elements investigated in our study, Y and Sc were comparable to those reported in China’s fresh vegetables [32]. The Pb, Cd, and Zn concentrations were higher than in vegetables collected in a mining area of Daye City, Hubei Province, China, while Cu concentrations were comparable [51]. Moreover, the Pb, Cu, and Zn concentrations in our study were in the range of concentrations reported in vegetables (cucumber, pumpkin, capsicum, eggplant, cabbage, brassica napus, spinach and Chinese cabbage) grown in agricultural soils along the Yellow River, except for Cd, which was lower in our study [49]. The average concentrations of Pb, Cu, Cd and Zn were slightly higher than in vegetables collected from different villages near the same tailing facilities [26].
The concentrations of Cd and Pb exceeded the maximum levels set by European Legislation [52] in 17/50, 88/100, 100/67, 56/33, and 100/100% of potato, carrot, parsley, cabbage and onion samples, respectively.
3.3. Soil-Plant Transfer
The soil-to-plant transfer factors (TFs) were calculated as the ratio of the element concentration in the plant and the pseudo-total element concentration in the soil where the plant had grown (Table 3). The TFs allow for assessing the plant uptake intensity and phytoaccumulation of elements for the studied site. The average values of TFs for REEs ranged between 3.28 × 10⁻⁴ (Ce from soil to potato) and 588 × 10−4 (Tm from soil to parsley) over two orders of magnitude.
Table 3.
Transfer factors (TFs) for elements in vegetables (×10−4).
Additionally, the REEs transfer patterns seem to be species-specific; for instance, the lowest average TFs were recorded for potato and the highest for parsley. The TFs, increased in the following order: potato < carrot < cabbage < onion < parsley. The TFs for LREEs were lower than those for the HREEs, indicating that LREEs were less absorbed than the HREEs, for all the investigated vegetable species, in correlation with the data reported by Ichihashi et al. (1992) [48]. The mean values of the TF calculations for La, Ce, Pr, Nd, and Sm were similar, a fact observed for each vegetable species. Such values may indicate similar fractionation of these elements in the soil-plant system. The values of TFs for REEs were low, indicating that the investigated plant species were not good accumulators of these elements.
The average TFs of La, Ce, Pr, Nd, and Sm for potatoes were comparable, while the other vegetables were much higher than in rice grown in eastern Macedonia [53]. In a pot cultivation experiment, the average TFs of REEs in our study were comparable with those of the soybean [54]. Furthermore, our study’s TFs for Pb, Cu, Cd, and Zn were comparable with those of cucumber, pumpkin, capsicum, eggplant, cabbage, brassica napus, spinach, and Chinese cabbage grown in agricultural soils along the Yellow River [49].
3.4. Correlations Analysis between Element Concentrations in Soil and Vegetables
The soil pH ranged between 5.1 and 7.7, while the TOC content was 1.4–4.2%. The pseudo-total REEs were correlated except Ce with Eu, Yb with Lu, and La with Lu. However, no significant correlations were found between the pseudo-total REEs and pH. Moreover, the available REEs were significantly correlated with each other. The pH values in the soil were significantly and negatively correlated (α = 0.05) with all available REEs, indicating that the pH in the soil governs the transfer of available REEs; as the soil pH increases, the REEs are more likely to precipitate and less likely to be released from soil. Furthermore, the pH was significantly correlated (α = 0.05) with Sc-A, Y-A, Ga-A, Ge-A, Zr-A, Mo-A, Th-A, Hf-A, Ta-A, Mn-T, and Ni-T. None of the total or available REEs was correlated with the soil organic carbon content, and TOC was significantly correlated (α = 0.05) with Zn-A, Cd-A, Te-A, Pb-A, Ni-A, Cu-T, Zn-T, and Te-T. Pearson correlations between the pseudo-total (T) and available (A) LREEs in soil (Table S1) revealed that they were uncorrelated, while the total and available HREEs were significantly correlated.
All REEs in onion and parsley were significantly correlated (α = 0.05) to each other, except for Eu, which was correlated only with Lu in onion (Table S2). In the case of potato, all REEs were correlated with each other except for Eu and Er, which were not correlated to any of the REEs (Table S3). In carrot, all REEs were significantly correlated to each other, except for Sm with Tm, Yb and Lu; Eu with Pr, Er, Tm, Yb and Lu; Gd with Yb and Lu; Tb with Yb and Lu (Table S4). In cabbage, all REEs were significantly correlated to each other, except for Ce and Eu, which did not correlate with any of the other REEs; Yb and Lu correlated only with HREEs but not with LREEs, and Tm correlated only with some of the REEs (Table S5). The significant correlations between REEs in vegetables indicate their common geochemical origin [2].
The correlation matrices of total REEs concentrations in soil and REEs in vegetables (matrices not shown here) revealed that there were no significant correlations between the investigated element concentrations for the studied vegetables, except for Er significantly correlating with Dy, Ho, Er, Tm, Yb, and Lu in potato samples. Pearson correlation matrices between REEs concentrations in vegetables and available REEs in soil (matrices not shown here) indicated no significant correlations (α = 0.05) between these concentrations, except for Er in potatoes significantly correlating with Nd-A, Sm-A, and Gd-A in soil. Furthermore, the other elements in vegetables were not significantly correlated with available REEs in soil, except Ge in cabbage significantly correlating with available REEs (except La-A, Ce-A, Sm-A).
The lack of significant correlations (α = 0.05) between REEs concentrations in vegetables and soils extracted with aqua regia and DTPA suggested that the concentration of the investigated elements in vegetables was independent of that in the adjacent soil, following the observation reported by Ichihashi et al. (1992) [48], which indicated that the total concentration of REEs in soils could not predict plant REEs uptake, and that the concentrations of individual REEs were not a function of their total concentration in soils [2]. Usually, the concentrations of the individual REEs in plants are weakly related to the variability of the concentrations in the soil [41].
Pearson correlations were performed for all the investigated elements in soil in available (A) and pseudo-total (T) forms. The analysis revealed significant correlations (α = 0.05) for each element, except for Mn-A and Co-A, which showed no significant correlation with any investigated elements. Each available REEs was significantly correlated (α = 0.05) with the following elements: Sc-A, Fe-A (except La-A, Ce-A, Pr-A, Eu-A), Ga-A (except Nd-A, Yb-A, Lu-A), Ge-A, Y-A, Zr-A, Mo-A (except Pr-A, Nd-A, Tm-A, Yb-A, Lu-A), each available REEs, Th-A, Hf-A, Ta-A, and Mn-T (except Pr-A, Nd-A, Er-A, Tm-A, Yb-A, Lu-A), Co-T (except Nd-A), Ni-T (except Nd-A), Mo-T, Cd-T (except LREEs), and each pseudo-total HREEs (except Gd-T). The available elements Ni-A, Cd-A, Pb-A, Cu-A, Zn-A, and Te-A showed no significant correlation (α = 0.05) with any available and total REEs (Table 4).
Table 4.
Pearson correlations for REEs and other elements in soil.
3.5. Correlations of Transfer Factors and Atomic Numbers of REEs
The correlations between the average transfer factors (TF × 10−4) and REEs’ the atomic numbers (Z) were graphically represented. The linear equations and the regression coefficients (R2) for the studied vegetables are shown in Figure 2. In the graphics, the element Eu (Z = 63) was removed, due to its atypical behavior, with much higher values than the adjacent elements Sm (Z = 62) and Gd (Z = 64) [48]. Similar anomalies were reported in wheat and rice samples [55]. The regression curves suggested a similar behavior for all the investigated vegetables. The linearity of the correlations between TFs and Zs was high, except for cabbage samples.
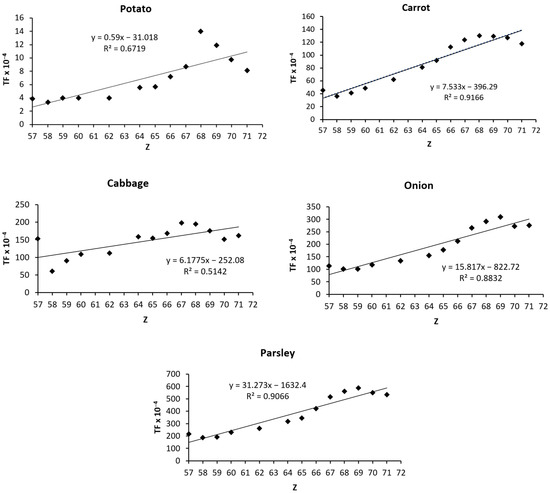
Figure 2.
Correlations between average transfer factors (TF × 10−4) and the atomic numbers (Z) of REEs in vegetables.
3.6. Risk Assessment
The EDI values of REEs and REEOs for each vegetable category, calculated based on the average consumption (FIR) of vegetables (dw and ww), are presented in Table 5.
Table 5.
Food ingestion rate (FIR, g ww person−1 day−1) and estimated daily intake (EDI, µg kg−1 day−1).
The average daily intake dose for adults in the investigated area of the vegetables varied in the following order: cabbage > parsley > onion > carrot > potato. The average estimated daily intake (1.80 µg kg−1 day−1 for REEs equivalent to 2.34 µg kg−1 day−1 for REEOs) through vegetable consumption was significantly lower than the acceptable daily intake (100–110 µg kg−1 day−1 for REEs) [49], or 70 µg kg−1 day−1 for REEOs [56], or the tolerable daily intake of 51.3 µg kg−1 day−1 for REEs, based on established and observed adverse effect levels (NOAEL) [57], thus not exceeding the value of EDI found to be damaging to human health.
4. Conclusions
The total and available REEs and other elements were determined from the soil and vegetables (cabbage, onion, carrot, parsley, and potato) homegrown near three tailings management facilities in the Baia Mare area, NW Romania. The REEs concentrations varied over a wide range, with the lowest values being recorded for Lu and the highest for Ce in each vegetable type. For the REEs, the lowest average TF values were found for potatoes, while the highest average values were for parsley. Different species of vegetables grown in the same soil absorbed different amounts of elements, apparently independent of the REEs concentrations in the soil. The LREEs were less absorbed than the HREEs for all the studied vegetable species. Generally, the Pearson correlation matrices showed that all REEs in soil extracted with aqua regia and DTPA were significantly correlated (α = 0.05). The pH values were significantly correlated (α = 0.05) with all available REEs concentrations in the soil. The TFs indicated that different vegetables accumulated different REEs in various concentrations. The average estimated daily intakes (1.80 µg kg−1 day−1 for REEs equivalent to 2.34 µg kg−1 day−1 for REEOs) through vegetable consumption were significantly lower than the acceptable daily intake and did not result in non-carcinogenic health effects.
Supplementary Materials
The following supporting information can be downloaded at: https://www.mdpi.com/article/10.3390/agronomy13051399/s1, Table S1. Pearson correlation matrix between REEs concentrations in soil, Table S2. Pearson correlation matrix between REEs concentrations in onion samples, Table S3. Pearson correlation matrix between REEs concentrations in potato samples, Table S4. Pearson correlation matrix between REEs concentrations in carrot samples, Table S5. Pearson correlation matrix between REEs concentrations in cabbage samples.
Author Contributions
Conceptualization, M.M.; methodology, M.M.; investigation, M.M., E.A.L., C.T. and O.C.; writing—original draft preparation, M.M., E.A.L. and O.C.; writing—review and editing, M.M., E.A.L. and O.C.; supervision, M.M. All authors have read and agreed to the published version of the manuscript.
Funding
This research received no external funding.
Data Availability Statement
The data that support the findings of this study are available on request from the corresponding author.
Conflicts of Interest
The authors declare no conflict of interest.
References
- Tsay, A.; Zajacz, Z.; Sanchez-Valle, C. Efficient mobilization and fractionation of rare-earth elements by aqueous fluids upon slab dehydration. Earth Planet. Sci. Lett. 2014, 398, 101–112. [Google Scholar] [CrossRef]
- Brouziotis, A.A.; Giarra, A.; Libralato, G.; Pagano, G.; Guida, M.; Trifuoggi, M. Toxicity of rare earth elements: An overview on human health impact. Front. Environ. Sci. 2022, 10, 948041. [Google Scholar] [CrossRef]
- Han, R.; Xu, Z. Geochemical behaviors of rare earth elements (REEs) in karst soils under different land-use types: A case in Yinjiang karst catchment, Southwest China. Int. J. Environ. Res. Public Health 2021, 18, 502. [Google Scholar] [CrossRef] [PubMed]
- Zhang, Y.; Gao, X.; Chen, C.T.A. Rare earth elements in intertidal sediments of Bohai Bay, China: Concentration, fractionation and the influence of sediment texture. Ecotox. Environ. Safe. 2014, 105, 72–79. [Google Scholar] [CrossRef]
- Li, W.; Zhuo, Y.; Wang, L.; Wan, X.; Yang, J.; Liang, T.; Song, H.; Weihrauch, C.; Rinklebe, J. Abundance, spatial variation, and sources of rare earth elements in soils around ion-adsorbed rare earth mining areas. Environ. Pollut. 2022, 313, 120099. [Google Scholar] [CrossRef]
- Mancheri, N.A.; Sprecher, B.; Bailey, G.; Ge, J.; Tukker, A. Effect of Chinese policies on rare earth supply chain resilience. Resour. Conserv. Recycl. 2019, 142, 101–112. [Google Scholar] [CrossRef]
- Zhou, B.; Bertinelli, L.; Poncin, S. The War of Rare Earth Elements: A Dynamic Game Approach, DEM Discussion Paper Series 19–11; Department of Economics at the University of Luxembourg: Luxembourg, 2019. [Google Scholar]
- Goodenough, K.M.; Schilling, J.; Jonsson, E.; Kalvig, P.; Charles, N.; Tuduri, J.; Deady, E.A.; Sadeghi, M.; Schiellerup, H.; Müller, A.; et al. Europe’s rare earth element resource potential: An overview of REE metallogenetic provinces and their geodynamic setting. Ore. Geol. Rev. 2016, 72, 838–856. [Google Scholar] [CrossRef]
- Gwenzi, W.; Mangori, L.; Danha, C.; Chaukura, N.; Dunjana, N.; Sanganyado, E. Sources, behaviour, and environmental and human health risks of high-technology rare earth elements as emerging contaminants. Sci. Total Environ. 2018, 636, 299–313. [Google Scholar] [CrossRef]
- Naccarato, A.; Tassone, A.; Cavaliere, F.; Elliani, R.; Pirrone, N.; Sprovieri, F. Agrochemical treatments as a source of heavy metals and rare Earth elements in agricultural soils and bioaccumulation in ground beetles. Sci. Total Environ. 2020, 749, 141438. [Google Scholar] [CrossRef]
- Mleczek, P.; Borowiak, K.; Budka, A.; Niedzielski, P. Relationship between concentration of rare earth elements in soil and their distribution in plants growing near a frequented road. Environ. Sci. Pollut. Res. 2018, 25, 23695–23711. [Google Scholar] [CrossRef]
- Pagano, P.P.; Thomas, P.J.; Nunzio, A.D.; Trifuoggi, M. Human exposures to rare earth elements: Present knowledge and research prospects. Environ. Res. 2019, 171, 493–500. [Google Scholar] [CrossRef] [PubMed]
- Herrmann, H.; Nolde, J.; Berger, S.; Heise, S. Aquatic ecotoxicity of lanthanum—A review and an attempt to derive water and sediment quality criteria. Ecotox. Environ. Safe. 2016, 124, 213–238. [Google Scholar] [CrossRef] [PubMed]
- Klingelhöfer, D.; Braun, M.; Dröge, J.; Bruggmann, D.; Groneberg, D.A. Environmental and health-related research on application and production of rare earth elements under scrutiny. Global Health 2022, 18, 86. [Google Scholar] [CrossRef] [PubMed]
- Yang, D.; Sui, H.; Mao, W.; Wang, Y.; Yang, D.; Zhang, L.; Liu, Z.; Yong, L.; Song, Y. Dietary exposure assessment of rare earth elements in the Chinese population. Int. J. Environ. Res. Public Health 2022, 19, 15583. [Google Scholar] [CrossRef] [PubMed]
- Li, L.; Wu, J.; Lu, J. Geochemical signatures and human health risk evaluation of rare earth elements in soils and plants of the northeastern Qinghai-Tibet Plateau, China. J. Arid Land 2022, 14, 1258–1273. [Google Scholar] [CrossRef]
- Da Silva Ferreira, M.; Ferreira Fontes, M.P.; Weitzel Dias Carneiro Lima, M.T.; Cordeiro, S.G.; Passamani Wyatt, N.L.; Lima, H.N.; Fendorf, S. Human health risk assessment and geochemical mobility of rare Earth elements in Amazon soils. Sci. Total Environ. 2022, 806, 151191. [Google Scholar] [CrossRef]
- Dai, Y.; Sun, S.; Li, Y.; Yang, J.; Zhang, C.; Cao, R.; Zhang, H.; Chen, J.; Geng, N. Residual levels and health risk assessment of rare earth elements in Chinese resident diet: A market-based investigation. Sci. Total Environ. 2022, 828, 154119. [Google Scholar] [CrossRef]
- Hoaghia, M.A.; Levei, E.A.; Cadar, O.; Senila, M.; Hognogi, G.G. Assessment of metal contamination and ecological risk in urban soils situated near a metallurgical complex. Environ. Eng. Manag. J. 2017, 16, 1623–1630. [Google Scholar] [CrossRef]
- Kubova, J.; Matus, P.; Bujdos, M.; Hagarova, I.; Medved, J. Utilization of optimized BCR three-step sequential and dilute HCl single extraction procedures for soil-plant metal transfer predictions in contaminated lands. Talanta 2008, 75, 1110–1122. [Google Scholar] [CrossRef]
- Levei, E.; Frentiu, T.; Ponta, M.; Senila, M.; Miclean, M.; Roman, C.; Cordos, E. Characterization of soil quality and mobility of Cd, Cu, Pb and Zn in the Baia Mare area Northwest Romania following the historical pollution. Int. J. Environ. Anal. Chem. 2009, 89, 635–649. [Google Scholar] [CrossRef]
- Sihlahla, M.; Mouri, H.; Nomngongo, P.N. Assessment of bioavailability and mobility of major and trace elements in agricultural soils collected in Port St Johns, Eastern Cape, South Africa using single extraction procedures and pseudo-total digestion. J. Environ. Health Sci. Eng. 2020, 18, 1615–1628. [Google Scholar] [CrossRef] [PubMed]
- Islam, M.D.; Hasan, M.M.; Rahaman, A.; Haque, P.; Islam, M.S.; Rahman, M.M. Translocation and bioaccumulation of trace metals from industrial effluent to locally grown vegetables and assessment of human health risk in Bangladesh. SN Appl. Sci. 2020, 2, 1315. [Google Scholar] [CrossRef]
- Borgese, L.; Federici, S.; Zacco, A.; Gianoncelli, A.; Rizzo, L.; Smith, D.R.; Donna, F.; Lucchini, R.; Depero, L.E.; Bontempi, E. Metal fractionation in soils and assessment of environmental contamination in Vallecamonica, Italy. Environ. Sci. Pollut. Res. Int. 2013, 20, 5067–5075. [Google Scholar] [CrossRef] [PubMed]
- Miclean, M.; Levei, E.; Cadar, O.; Senila, M.; Groza, I.S. Comparison of two empirical models for soil to ryegrass transfer of metals in Baia Mare mining area. Carpath. J. Earth Environ. Sci. 2013, 8, 93–100. [Google Scholar]
- Miclean, M.; Cadar, O.; Levei, L.; Senila, L.; Ozunu, A. Metal contents and potential health risk assessment of vegetables grown in a former mining district (Romania). J. Environ. Sci. Health B. 2018, 53, 595–601. [Google Scholar] [CrossRef]
- Augustsson, A.; Uddh-Söderberg, T.; Filipsson, M.; Helmfrid, I.; Berglund, M.; Karlsson, H.; Hogmalm, J.; Karlsson, A.; Alriksson, S. Challenges in assessing the health risks of consuming vegetables in metal-contaminated environments. Environ. Int. 2018, 113, 269–280. [Google Scholar] [CrossRef] [PubMed]
- Miclean, M.; Cadar, O.; Levei, E.A.; Roman, R.; Ozunu, A.; Levei, L. Metal (Pb, Cu, Cd, and Zn) transfer along food chain and health risk assessment through raw milk consumption from free-range cows. Int. J. Environ. Res. Public Health 2019, 16, 4064. [Google Scholar] [CrossRef] [PubMed]
- ISO 11466:1995; Soil Quality—Extraction of Trace Elements Soluble in Aqua Regia. ISO: Geneva, Switzerland, 1995.
- ISO 14870:2001; Soil Quality—Extraction of trace Elements by Buffered DTPA Solution. ISO: Geneva, Switzerland, 2001.
- Staven, L.H.; Rhoads, K.; Napier, B.A.; Strenge, D.L. A Compendium of Transfer Factors for Agricultural and Animal Products; Pacific Northwest National Laboratory: Richland, WA, USA, Prepared for the U.S. Department of Energy under Contract DE-AC06-76RL01830; 2003; Available online: https://www.pnnl.gov/main/publications/external/technical_reports/pnnl-13421.pdf (accessed on 25 January 2023).
- Jiang, D.G.; Yang, J.; Zhang, S.; Yang, D.J. A survey of 16 rare earth elements in the major foods in China. Biomed. Environ. Sci. 2012, 25, 267–271. [Google Scholar]
- Loell, M.; Albrecht, C.; Felix-Henningsen, P. Rare earth elements and relation between their potential bioavailability and soil properties, Nidda catchment (Central Germany). Plant Soil 2011, 349, 303–317. [Google Scholar] [CrossRef]
- Alfaro, M.R.; do Nascimento, C.W.A.; Biondi, C.M.; da Silva, Y.J.A.B.; de Aguiar Accioly, A.M.; Montero, A.; Muñiz Ugarte, O.; Estevez, J. Rare-earth-element geochemistry in soils developed in different geological settings of Cuba. Catena 2018, 162, 317–324. [Google Scholar] [CrossRef]
- Vermeire, M.L.; Cornu, S.; Fekiacova, Z.; Detienne, M.; Delvaux, B.; Cornélis, J.T. Rare earth elements dynamics along pedogenesis in a chronosequence of podzolic soils. Chem. Geol. 2016, 446, 163–174. [Google Scholar] [CrossRef]
- Ramos, S.J.; Dinali, G.S.; Oliveira, C.; Martins, G.C.; Moreira, C.G.; Siqueira, J.O.; Guilherme, L.R.G. Rare earth elements in the soil environment. Curr. Pollution Rep. 2016, 2, 28–50. [Google Scholar] [CrossRef]
- Sadeghi, M.; Petrosino, P.; Ladengberger, A.; Albanese, S.; Andersson, M.; Morris, G.; Lima, A.; Zomeni, Z. The GEMAS Project Team. Ce, La and Y concentrations in agricultural and grazing-land soils of Europe. J. Geochem. Explor. 2013, 133, 202–213. [Google Scholar] [CrossRef]
- Laveuf, C.; Cornu, S. A review on the potentiality of Rare Earth Elements to trace pedogenetic processes. Geoderma 2009, 154, 1–12. [Google Scholar] [CrossRef]
- Mihajlovic, J.; Rinklebe, J. Rare earth elements in German soils—A review. Chemosphere 2018, 205, 514–523. [Google Scholar] [CrossRef] [PubMed]
- Khan, A.M.; Behkami, S.; Yusoff, I.; Zain, S.B.M.; Abu Bakar, N.K.; Abu Bakar, A.F.; Alias, Y. Geochemical characteristics of rare earth elements in different types of soil: A chemometric approach. Chemosphere 2017, 184, 673–678. [Google Scholar] [CrossRef] [PubMed]
- Briki, M.; Ji, H.; Gao, Y.; Ding, H.; Li, C. Distribution of rare earth elements in agricultural soil and human body (scalp hair and urine) near smelting and mining areas of Hezhang, China. J. Rare Earth 2016, 34, 1156–1167. [Google Scholar]
- Tripathee, L.; Kang, S.; Rupakheti, D.; Zhang, Q.; Bajracharya, R.M.; Sharma, C.M.; Huang, J.; Gyawali, A.; Paudyal, R.; Sillanpaa, M. Spatial distribution, sources and risk assessment of potentially toxic trace elements and rare earth elements in soils of the Langtang Himalaya, Nepal. Environ. Earth Sci. 2016, 75, 1332–1344. [Google Scholar] [CrossRef]
- Khan, A.M.; Yusoff, I.; Abu Bakar, N.K.; Abu Bakar, A.F.; Alias, Y.; Mispan, M.S. Accumulation, uptake and bioavailability of rare earth elements (REEs) in soil grown plants from ex-mining area in Perak, Malaysia. Appl. Ecol. Env. Res. 2017, 15, 117–133. [Google Scholar] [CrossRef]
- Sadeghi, M.; Albanese, S.; Morris, G.; Ladenberger, A.; Andersson, M.; Cannatelli, C.; Lima, A.; De Vivo, B. REE concentrations in agricultural soil in Sweden and Italy: Comparison of weak MMI® extraction with near total extraction data. Appl. Geochem. 2015, 63, 22–36. [Google Scholar] [CrossRef]
- Laul, J.C.; Weimer, W.C.; Rancitelli, L.A. Biogeochemical distribution of rare earths and other trace elements in plants and soils. Phys. Chem. Earth 1979, 11, 819–827. [Google Scholar] [CrossRef]
- Wiche, O.; Zertani, V.; Hetschel, W.; Achtziger, R.; Midula, P. Germanium and rare earth elements in topsoil and soil-grown plants on different land use types in the mining area of Freiberg (Germany). J. Geochem. Explor. 2017, 175, 120–129. [Google Scholar] [CrossRef]
- Li, Y.; Wang, Y.B.; Gou, X.; Su, Y.B.; Wang, G. Risk assessment of heavy metals in soils and vegetables around non-ferrous metals mining and smelting sites, Baiyin, China. J. Environ. Sci.-China 2006, 18, 1124–1134. [Google Scholar] [CrossRef] [PubMed]
- Ichihashi, H.; Morita, H.; Tatsukawa, R. Rare earth elements in naturally grown plants in relation to their variation in soils. Environ. Pollut. 1992, 76, 157–162. [Google Scholar] [CrossRef] [PubMed]
- Li, X.; Chen, Z.; Chen, Z.; Zhang, Y. A human health risk assessment of rare earth elements in soil and vegetables from a mining area in Fujian Province, Southeast China. Chemosphere 2013, 93, 1240–1246. [Google Scholar] [CrossRef]
- Magdas, D.A.; Feher, I.; Dehelean, A.; Cristea, G.; Magdas, T.M.; Puscas, R.; Marincas, O. Isotopic and elemental markers for geographical origin and organically grown carrots discrimination. Food Chem. 2018, 267, 231–239. [Google Scholar] [CrossRef]
- Yang, J.; Lv, F.; Zhou, J.; Song, Y.; Li, F. Health risk assessment of vegetables grown on the contaminated soils in Daye City of Hubei Province, China. Sustainability 2017, 9, 2141. [Google Scholar] [CrossRef]
- The European Commission. Commission Regulation (EU) No. 488/2014 amending Regulation (EC) No. 1881/2006 as regards maximum levels of cadmium in foodstuffs. Off. J. Eur. Union 2014, 138, 0011. [Google Scholar]
- Rogan, N.; Serafimovski, T.; Dolenec, M.; Tasev, G.; Dolenec, T. The distribution of rare earth elements in paddy soil and rice seeds from Kocani Field (eastern Macedonia). Mat. Geoenviron. 2006, 53, 433–444. [Google Scholar]
- Nakamaru, Y.; Tagami, K.; Uchida, S. Effect of nutrient uptake by plant roots on the fate of REEs in soil. J. Alloy Compd. 2006, 408–412, 413–416. [Google Scholar] [CrossRef]
- Liang, T.; Li, K.; Wang, L. State of rare earth elements in different environmental components in mining areas of China. Environ. Monit. Assess. 2013, 186, 1499–1513. [Google Scholar] [CrossRef] [PubMed]
- Zhuang, M.; Zhao, J.; Li, S.; Liu, D.; Wang, K.; Xiao, P.; Yu, L.; Jiang, Y.; Song, J.; Zhou, J.; et al. Concentrations and health risk assessment of rare earth elements in vegetables from mining area in Shandong, China. Chemosphere 2017, 168, 578–582. [Google Scholar] [CrossRef] [PubMed]
- Kowalczyk, E.; Givelet, L.; Amlund, H.; Sloth, J.J.; Hansen, M. Risk assessment of rare earth elements, antimony, barium, boron, lithium, tellurium, thallium and vanadium in teas. EFSA J. 2022, 20, e200410. [Google Scholar] [CrossRef] [PubMed]
Disclaimer/Publisher’s Note: The statements, opinions and data contained in all publications are solely those of the individual author(s) and contributor(s) and not of MDPI and/or the editor(s). MDPI and/or the editor(s) disclaim responsibility for any injury to people or property resulting from any ideas, methods, instructions or products referred to in the content. |
© 2023 by the authors. Licensee MDPI, Basel, Switzerland. This article is an open access article distributed under the terms and conditions of the Creative Commons Attribution (CC BY) license (https://creativecommons.org/licenses/by/4.0/).