Article

Genome-Resolved Metagenomics of Nitrogen Transformations in the Switchgrass Rhizosphere Microbiome on Marginal Lands

by
Richard Allen White III
1,2,
Aaron Garoutte
3,
Emily E. Mclachlan
3,4,5,
Lisa K. Tiemann
6,
Sarah Evans
7,8 and
Maren L. Friesen
3,4,5,*
1
Computational Intelligence to Predict Health and Environmental Risks (CIPHER), Department of Bioinformatics and Genomics, The University of North Carolina at Charlotte, 9201 University City Boulevard, Charlotte, NC 28223, USA
2
North Carolina Research Center (NCRC), Department of Bioinformatics and Genomics, The University of North Carolina at Charlotte, 150 Research Campus Drive, Kannapolis, NC 28081, USA
3
Department of Plant Biology, Michigan State University, East Lansing, MI 48824, USA
4
Department of Crop and Soil Sciences, Washington State University, Pullman, WA 99164-6420, USA
5
Department of Plant Pathology, Washington State University, Pullman, WA 99164-6420, USA
6
Department of Plant, Soil and Microbial Sciences, Michigan State University, East Lansing, MI 48824, USA
7
Department of Integrative Biology, Michigan State University, East Lansing, MI 48824, USA
8
W. K. Kellogg Biological Station, Michigan State University, East Lansing, MI 48824, USA
*
Author to whom correspondence should be addressed.
Agronomy 2023, 13(5), 1294; https://doi.org/10.3390/agronomy13051294
Submission received: 8 March 2023 / Revised: 11 April 2023 / Accepted: 30 April 2023 / Published: 3 May 2023
(This article belongs to the Special Issue Plant–Microbiome–Climate Interactions and Biogeography)

Abstract

:
Switchgrass (Panicum virgatum L.) remains the preeminent American perennial (C4) bioenergy crop for cellulosic ethanol, that could help displace over a quarter of the US current petroleum consumption. Intriguingly, there is often little response to nitrogen fertilizer once stands are established. The rhizosphere microbiome plays a critical role in nitrogen cycling and overall plant nutrient uptake. We used high-throughput metagenomic sequencing to characterize the switchgrass rhizosphere microbial community before and after a nitrogen fertilization event for established stands on marginal land. We examined community structure and bulk metabolic potential, and resolved 29 individual bacteria genomes via metagenomic de novo assembly. Community structure and diversity were not significantly different before and after fertilization; however, the bulk metabolic potential of carbohydrate-active enzymes was depleted after fertilization. We resolved 29 metagenomic assembled genomes, including some from the ‘most wanted’ soil taxa such as Verrucomicrobia, Candidate phyla UBA10199, Acidobacteria (rare subgroup 23), Dormibacterota, and the very rare Candidatus Eisenbacteria. The Dormibacterota (formally candidate division AD3) we identified have the potential for autotrophic CO utilization, which may impact carbon partitioning and storage. Our study also suggests that the rhizosphere microbiome may be involved in providing associative nitrogen fixation (ANF) via the novel diazotroph Janthinobacterium to switchgrass.

1. Introduction

“Plants wear their guts on the outside” wrote Janzen (1985) [1], since the rhizosphere of terrestrial plants—the ~millimeter interface between plant roots and surrounding soil—plays critical roles in nutrient uptake, absorption, and degradation, via the diverse microbes it contains [2,3,4,5]. The rhizosphere connects plants to ecosystem processes including the cycling and sequestration of water, nitrogen (N), carbon, and other nutrients [6]. The rhizosphere represents one of the most dynamic and diverse interfaces on the planet, containing up to 1011 microbial cells per gram root, potentially representing over 30,000 bacterial species that also interact with fungi, picoeukaryotes, bacteriophages, and viruses [2,4,5]. The rhizosphere microbiome can alter the physical and chemical environment of plants by directly promoting plant growth via nutrient fixation (e.g., N fixation), increased bioavailability of soil nutrients (e.g., phosphorus, iron, zinc, and copper), and altered plant hormones and signaling [6,7]. Hence, the rhizosphere represents a critical interface of plant–microbial interactions that directly impacts plant and soil health, and harnessing it requires knowledge about the identities and functionality of rhizosphere microbial communities.
Metagenomics of the soil and rhizosphere can provide a direct measure of its metabolic capabilities, functional potential, and the genomes of individual members through ‘metagenome assembled genomes’ (MAGs) [4,5,8]. Soil and rhizosphere ecosystems have been considered the ‘grand challenge’ of metagenomics, due to the low coverage of individual organisms, uneven sampling, high genetic diversity, and large amounts of sequence data required [9,10]. In general, metagenomics in soil environments yield poor de novo assemblies; because often up to 80% of the data cannot be assembled, there is typically low read map coverage (<20%) and there are few contigs > 8 kbp (<10 contigs) [9,10]. Until recently, obtaining MAGs from soils was deemed impossible; however, multiple studies have been able to resolve MAGs directly without amendment in soil ecosystems [11,12,13,14,15,16,17,18,19]. MAGs and genome-resolved metagenomics have provided a wealth of knowledge on the vast candidate bacterial phyla, and their metabolic potential and functions that have never before been described due to their unculturability [20,21].
The activity of the rhizosphere microbiome, including community assembly, recruitment, uptake, and degradation of nutrients are driven by plant root exudates [22,23]. More than a century of research into the rhizosphere has revealed “the rhizosphere effect”, by which plants enhance the growth of soil microbes via the exudation of organic molecules, particularly the carbon compounds exuded [24]. This carbon fuels the metabolic processes of the rhizosphere microbiome, of which the nitrogen cycle is absolutely critical to plant growth. Carbon inputs directly impact nitrogen fixation, which is an energetically expensive process [25]. Carbon can also stimulate denitrification in parallel with nitrogen fixation, resulting in a net loss of N [26]. Denitrification stimulation occurs more strongly with simple substrates (e.g., glucose) versus complex substrates (e.g., cellulose and lignin) [26]. Understanding how the rhizosphere microbiome utilizes carbohydrates via carbohydrate-active enzymes (CAZy) can further elucidate the balance and interaction between C and N cycling.
The rhizosphere microbiome is primarily responsible for nitrogen transformations in soil. The nitrogen cycle consists of assimilation, fixation, denitrification, nitrate reduction, nitrification, anaerobic ammonium oxidation (ANAMMOX), dissimilatory nitrate reduction to ammonium (DNRA), and complete ammonium oxidation (COMMAMOX) [27]. Biological nitrogen fixation (BNF) is the reduction of atmospheric molecular nitrogen [N2] to ammonia [NH3] via nitrogenase (encoded by the nifHDK gene cluster); this reaction accounts for approximately two-thirds of the fixed nitrogen available to biology on the planet [28]. Soil denitrification occurs via three mechanisms: (1) nitrite [NO2] reduction to molecular nitrogen [N2] via dissimilatory nitrite reductase nirKS gene cluster, (2) nitric oxide [NO] reduction to molecular nitrogen [N2] via the norB nitric oxide reductase gene, and (3) nitrous [N2O] reduction to molecular nitrogen [N2] via the nitrous oxide reductase nosZ gene [29]. Soil nitrate reduction is the conversion of nitrate [NO3] to nitrite [NO2] via the napA/narG nitrate reductase genes. DNRA occurs via the transformation of nitrite [NO2] to ammonia [NH3], via the nrfA nitrite reductase gene [30]. ANAMMOX reaction converts nitrate [NO3] to ammonia [NH3], which occurs via the hzo hydrazine oxidoreductase gene [31]. COMMAMOX converts to ammonia [NH3] to nitrate [NO3], which requires the amoABC ammonium oxidase gene cluster, the hao hydroxylamine oxidoreductase gene, and nxr nitrite oxidoreductase gene [31]. The abundance and diversity of nitrogen cycling genes and their connection to carbohydrate utilization genes provide a window into the coupling of the C and N cycles within the rhizosphere.
Switchgrass (Panicum virgatum L.) is the principal United States bioenergy model C4 perennial crop for use in cellulosic ethanol production, biogas, and combustion [32], which could displace up to 30% of the current petroleum consumption [33]. Its high biomass productivity in low-nutrient soils common to marginal lands is key because growth on marginal land avoids competition with food crops on arable lands [34,35,36,37]. Switchgrass and other cellulosic ethanol sources could displace up to 30% of the current petroleum consumption [33].
Contrary to many cropping systems which show N limitation, N fertilization of switchgrass often has limited to no impact on productivity [36,38], and there is a resulting gap in the N budget [36]. This suggests that the rhizosphere microbiome could contribute to the N requirement [39] through free-living diazotrophic bacteria using associative nitrogen fixation (ANF) [25,40,41].
Studies to date have investigated the effect of N fertilizer on the switchgrass rhizosphere microbiome using 16S rRNA amplicon sequencing [39,40,42]. 16S rRNA amplicon studies typically fail to resolve novel ‘candidate’ phyla, representing vast portions of the tree of life [43,44]. These 16S rRNA amplicon approaches fail to measure metabolic capabilities directly, functional potential, gene–gene assortment on operons via long-range sequence contiguity, gene transfer via horizontal gene transfer (HGT), or the provision of MAGs. Shotgun metagenomics thus provides a powerful approach to characterize both diversity and functionality simultaneously [45].
Here, we use high-throughput metagenomic shotgun sequencing of the switchgrass rhizosphere on marginal lands to resolve its taxonomic composition and functional metabolic potential, and resolve community microbial genomes (MAGs). We further compare plots pre- and post-fertilization to determine how the microbiome responds to N addition and give insight into its responsiveness over a two-week interval. We first assess metagenome quality and overall diversity across our study, then we describe overall metabolic potential and shifts between timepoints, delving particularly into nitrogen cycling (e.g., ANF) and carbohydrate metabolism (i.e., CAZy pathways). Finally, we describe MAGs of abundant bacteria and use these to elucidate their potential roles in nitrogen cycling and coupling the N and C cycles in the rhizosphere.

2. Materials and Methods

2.1. Study Site Description and Management

Switchgrass rhizosphere soil was sampled (April to May 2016) from the Lux Arbor reserve (42.48 N–85.44 W) as part of the Great Lake Bioenergy Research Center’s (GLBRC) marginal land experiments. The Lux Arbor reserve marginal land soil is a sandy clay loam, mesic Hapludalf (Crum and Collins, 1995). The mean annual temperature (MAT) was 10.1 °C, with a mean annual precipitation of 1.005 m. Four blocks of switchgrass rhizosphere soil from the Cave-in-rock variety were sampled in a randomized block design, after a two-week pulse treatment of N amendment. The assigned blocks were 64 ft × 40 ft in size. Amended soil was approximately half a plot, with the other half receiving no amendment. The soil was classified as a Kalamazoo loam with a 2–6% slope. We sampled switchgrass rhizosphere within the G5 blocks, on the block half that was historically amended with N fertilizer, but not at the time of sampling called here pre-fertilized (i.e., I1–I4, pre-fertilized—initial samples). We sampled the same blocks two weeks post-nitrogen fertilizer amendment, which here is called post-fertilized (i.e., P1–P4, post-fertilized—post samples 1 to 4) (Figure S1). Blocking diagram and map of the location is provided (Figure S1).
The fertilizer treatment was pelleted lime (454 kg/A) and urea (53 kg/A or 24 kg/A N), applied on 5 April 2016 and then again on May 13th 2016. Our pre-fertilized—initial—samples were taken on 29 March 2016, prior to the first amendment on 5 April 2016, and our post-fertilized samples were taken 12 April 2016, two weeks post-fertilization. The urea fertilizer was SUPERU® (Koch Agronomic Services—KAS, Wichita, KS, USA) brand, which is 45.5% urea nitrogen, contains 0.06% (600 ppm) N-(n-butyl) thiophosphoric triamide (NBPT) (a urease inhibitor), and 0.85 % (8500 ppm) Dicyandiamide (DCD) (a nitrification inhibitor).
We collected soil cores (2 cm diameter × 15 cm deep) from near the centers of each half-block, ~50 g of soil per core, one sample taken per half-block. Cores from each half-block on each date were sieved through a 4 mm sieve to remove rocks and large roots, and then flash-frozen using liquid nitrogen until processed. The rhizosphere is typically considered to be the zone of soil that is influenced by roots, so, given that these soil cores were sampled at the base of a well-established perennial plant and that the cores themselves contained a sizeable amount of root material, we considered these samples to be indicative of the switchgrass rhizosphere. The “tightly bound” rhizosphere and rhizoplane are typically defined operationally by the particles of soil that are stuck to a root after shaking and the surface of a root after all soil particles are removed, respectively. We did not seek to partition these compartments, but noted that the tightly bound and rhizoplane microbes were captured in our samples.

2.2. DNA Extraction and Sequencing

Total DNA was extracted from ~2 g switchgrass rhizosphere from field flash-frozen samples using the MoBio PowerSoil DNA (Carlsbad, CA, USA), according to the manufacturer’s instructions. Samples were quantified using the Qubit Fluorometer 2.0 (Invitrogen, Carlsbad, CA, USA) and quality-checked using a Nanodrop-1000 (Thermo Fisher, Waltham, MA, USA). Michigan State University Research Technology Support Facility (RTSF) sequencing core completed Illumina library preparation, library quantification, and sequencing on HiSeq 4000 150 bp paired-end read format. We analyzed eight metagenomes from switchgrass rhizosphere within marginal lands of southern Michigan Lux Arbor Reserve, comprising four samples from each pre- and post-fertilizer application.

2.3. Metagenomic Assembly, Annotation, Differential Abundance Statistical Analysis, and Genome Reconstruction

Paired-end shotgun reads were quality-filtered, assembled, and decontaminated using ATLAS [46]. In short, the bbduk module quality-filtered, trimmed, and decontaminated for φX174 phage DNA, a common Illumina sequencing spike-in, and for all Illumina adapters. Metagenomic de novo assembly was performed using Megahit (k-mer 21–121, version 1.1.3) [47]. We used >5 kbp contigs only for all downstream analysis; this included taxonomic and functional annotation, and metagenomic binning. Protein-coding open reading frames (ORFs) and RNA prediction were completed using Prokka [48]. Eggnog-mapper (diamond mode, version 0.8.22.84) was used to obtain updated KEGG (KO) numbers for MAGs and contigs [49]. CAZy predictions were completed in diamond (version 0.8.22.84) [50], for MAGs and contigs (31 July 2018, database update) from dbcan2 [51].
DESeq2 R package (version 1.18.1) was used to obtain differential statistics on taxonomic composition and functional annotations from predicted ORFs from contigs using COG, CAZy, and KO annotation abundances [52]. The contig ORF counts’ abundances within DESeq2 followed a paired analysis, which blocked by sampling plot pre-/post-fertilization, then normalized with variance stabilizing normalization.
We pooled contigs from pre-/post-fertilization, then used the differential read abundances across all samples to obtain MAGs. Contigs were binned using Concoct [53], Maxbin2 [54], and Metabat2 [55], including the refinement program within metawrap [56]. Metawrap was used for refinement of MAGs, blobiology prediction, and quantification of bin (MAG) abundance via quant_bin module [56]. CheckM was used to evaluate completeness, contamination, redundancy, and genome properties of the MAGs [57]. All MAG qualities were reported according to the MIMAG standards [8]. We tested a variety of methods to resolve the taxonomy of the MAGs, including metawrap’s classifier, classify genomes (https://github.com/AlessioMilanese/classify-genomes, (accessed on 15 April 2023)), which uses the metagenomic operational taxonomic units (mOTU) v2 taxonomy, JSpeciesWS Tetra Correlation Search [58], GTDB-Tk [59], and blastp of ribosomal protein S9 gene (obtained from Prokka annotation). Only GTDB-Tk provided the taxonomic identifications that were supported by ribosomal protein S9 gene blastp results. GTDB-Tk provided all further taxonomy for the MAGs downstream.

2.4. Read-Based mOTU Picking and Statistical Analysis

mOTUs analysis of the quality-filtered and decontaminated reads (not contigs) used in the de novo metagenomic assembly were used as input mOTUs v2 [45], then parsed and further analyzed with the phyloseq (version 1.22.3) R package [60]. Alpha diversity measurements with statistical testing for mOTUs (including t-test, Wilcox, Kruskal, and ANOVA) were completed in the phyloseq (version 1.22.3) R package. Beta-diversity metrics were obtained for mOTUs using the UniFrac (weighted/unweighted) and Brays–Curtis distances in phyloseq (version 1.22.3) R package. DESeq2 R package (version 1.18.1) was used within phyloseq (version 1.22.3) R package for mOTU differential statistics using negative binomial distribution corrected with variance-stabilizing normalization.

2.5. Data and Analysis Code Availability

Raw sequence data, assembled contigs, and supplemental data are all available on NCBI Bioproject/BioSample/SRA as PRJNA954399—Lux Arbor Metagenome, and are also available at Open Science Framework, with code, at https://osf.io/mzrvj/ (accessed on 15 April 2023). All code for this study is available on www.github.com/friesenlab/MMPRNT_panicum_metagenome_mags/ (accessed on 15 April 2023).

3. Results

3.1. Assessment of Assembly and Metagenomic Assembled Genomes within Lux Arbor

The raw data represent 5.37 billion Illumina reads, with 805 Gbp in 490 gigabytes of compressed data, with ~100 gigabytes of uncompressed data per sample (Table 1). On average, 34.5% of the data were removed per sample due to quality, length, or adapters, or because they were phiX174 bacteriophage Illumina spike-in DNA library (Table 1). Upon metagenomic de novo assembly with MEGAHIT, each sample averaged 4.6 million total contigs (>200 bp) which contained, on average, 3.2 Gbp, with an average N50 of 737 bp (Table 1). However, the best assessment of a soil and rhizosphere metagenome de novo assembly is the number of contigs which are >1 kbp and are longer than 5 kbp [9,10]. On average, ~60,000 contigs per sample were contained on contigs > 1 kbp, with an average of 2.21 Gbp assembly size and an average N50 value of 1982 bp (Table 1). Across all samples, we obtained 190,172 contigs > 5 kbp, with an average of 23,771 contigs of 5 kbp per sample on a 1.19 Gbp assembly size with an average N50 value of 9254 bp (Table 1). Of those 190,172 > 5 kbp contigs, 44,171 of them were >10 kbp in length, and 237 were >100 Kbps. Max contig length was 697,599 across all samples.
We pooled all contigs, then used concoct, maxbin2, and metabat2, including the refinement program within metawrap. Concoct yielded no usable bins. When comparing metabat2 to maxbin2, metabat2 produced more raw MAGs than maxbin2 (435 vs. 319), the completeness was lower for metabat2 (39.7% vs. 48.0%), and higher contamination was present amongst the metabat2 bins (28.0% vs. 16.4%) (Figure S2). Pooling results in metawraps bin refinement yielded 29 MAGs in total (14 pre- and 15 post-fertilization) (Figure S2).

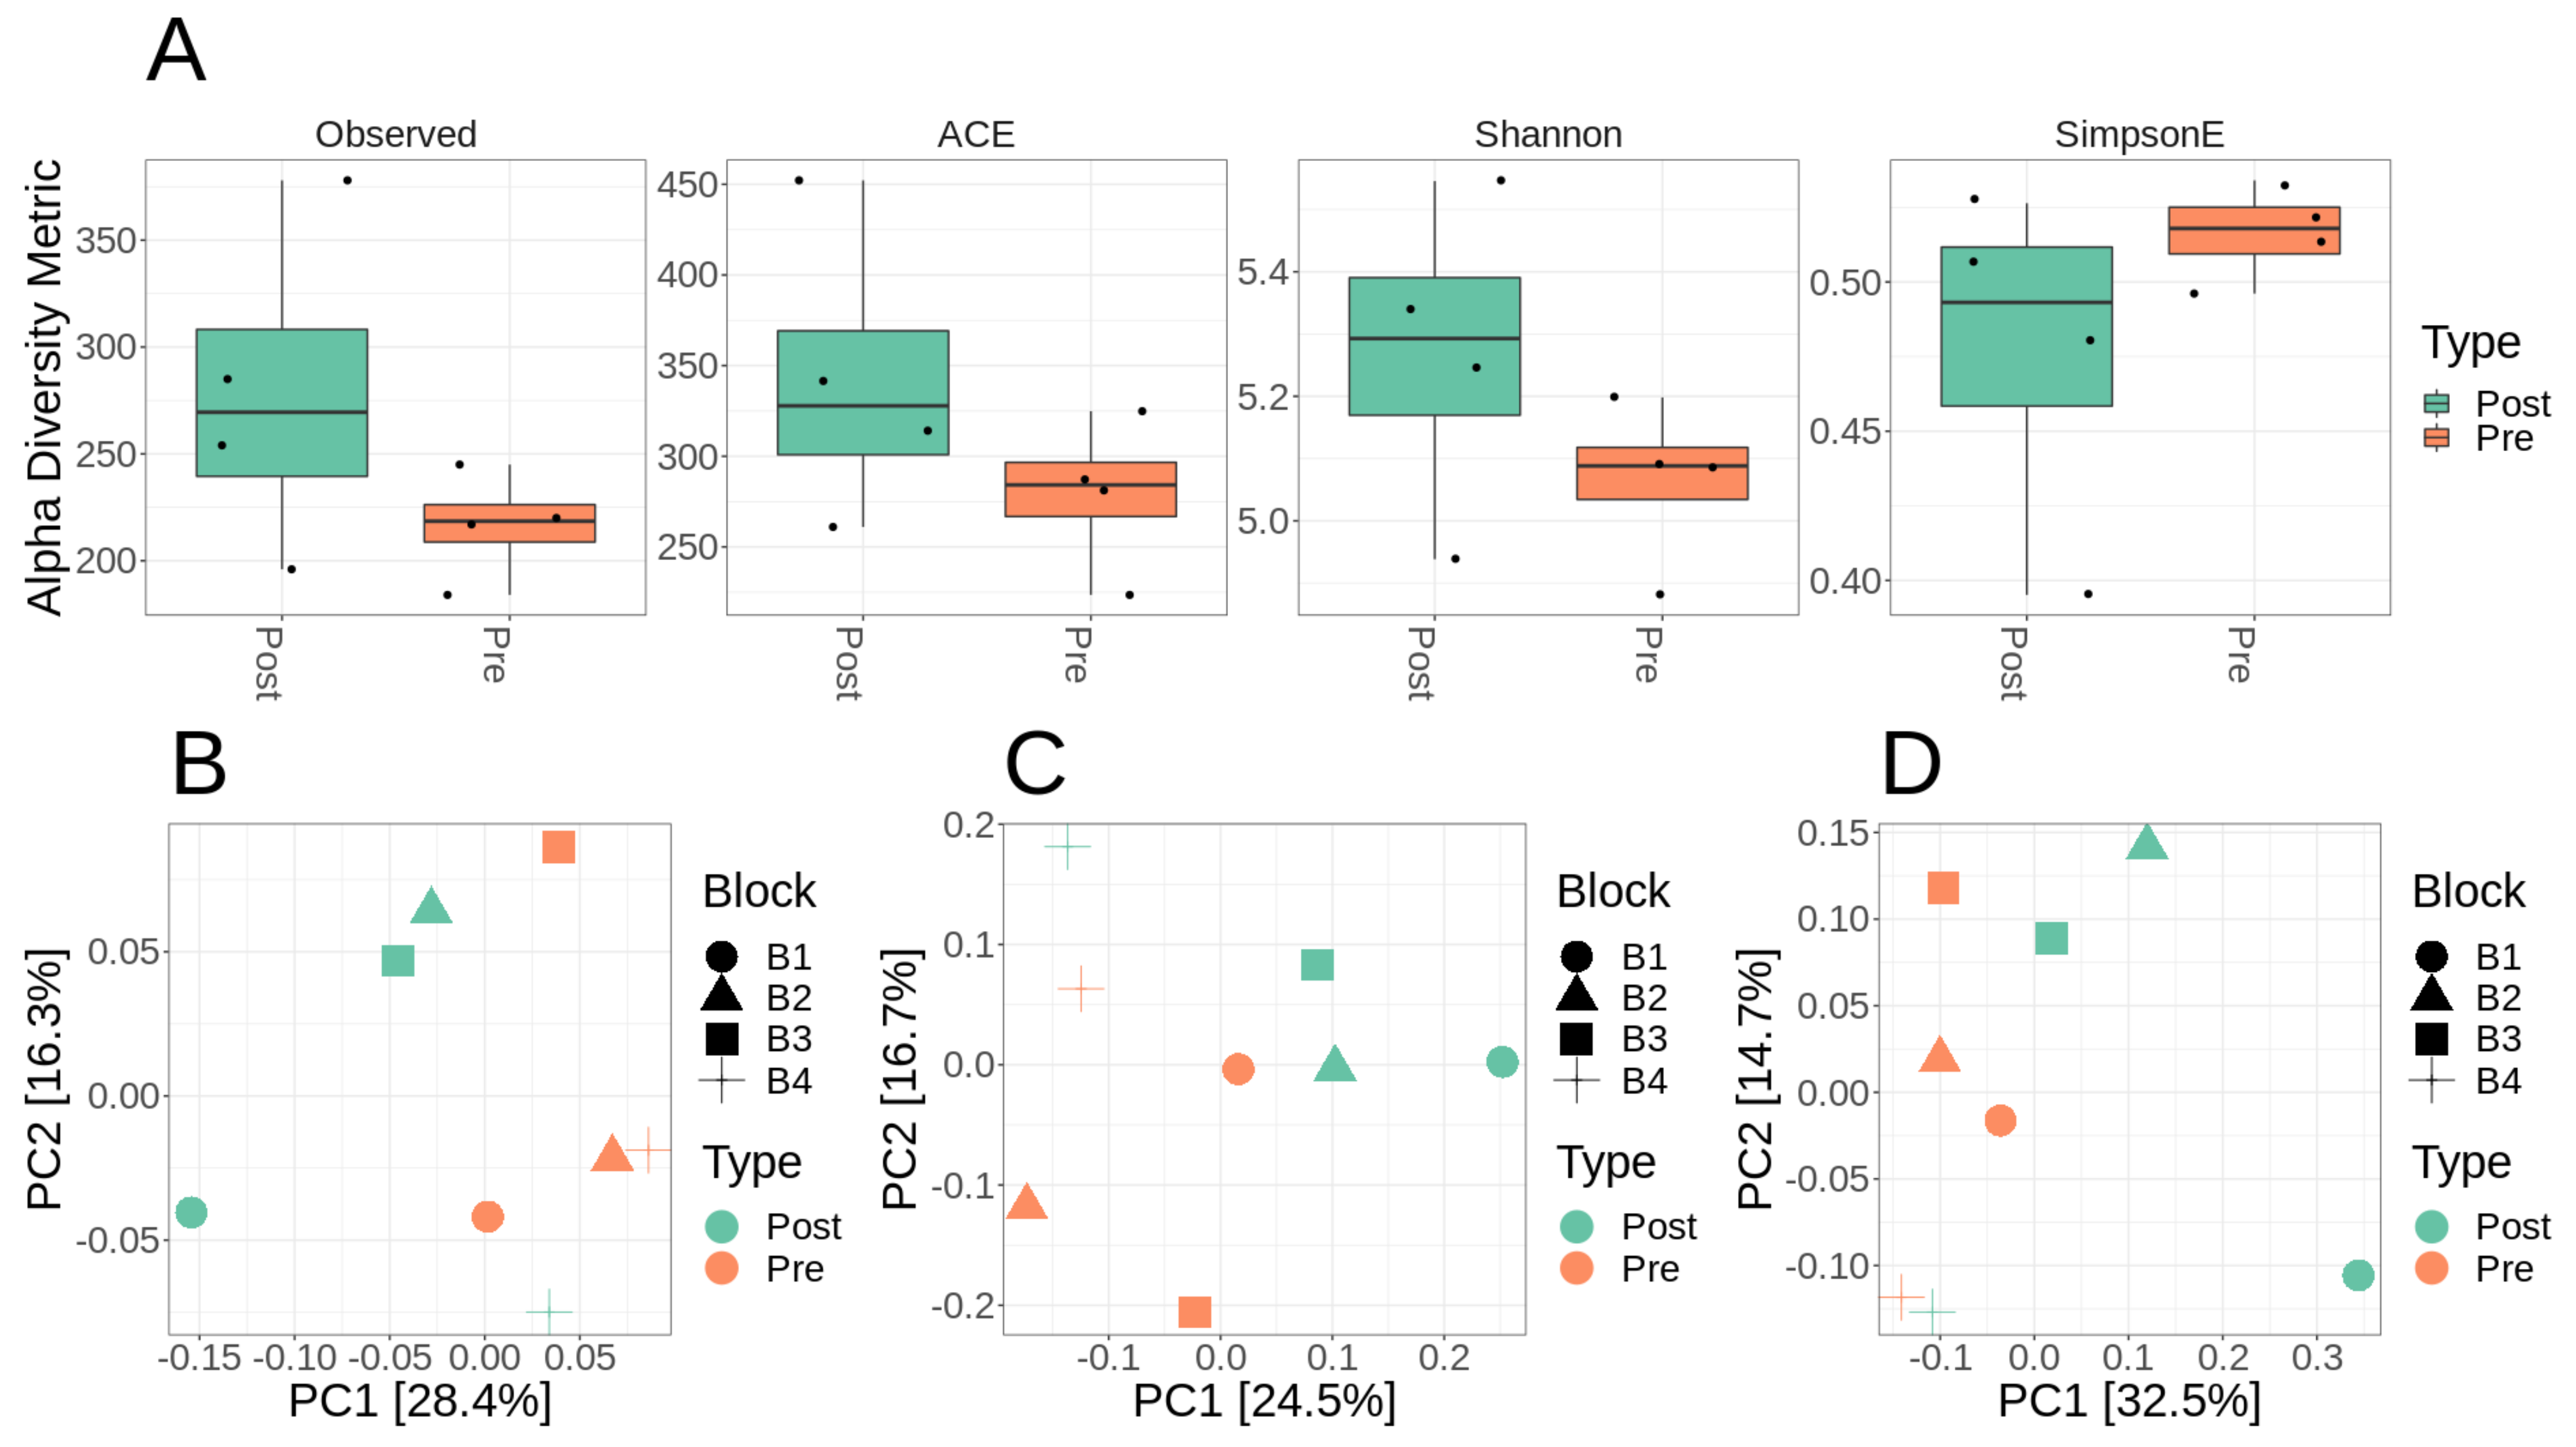
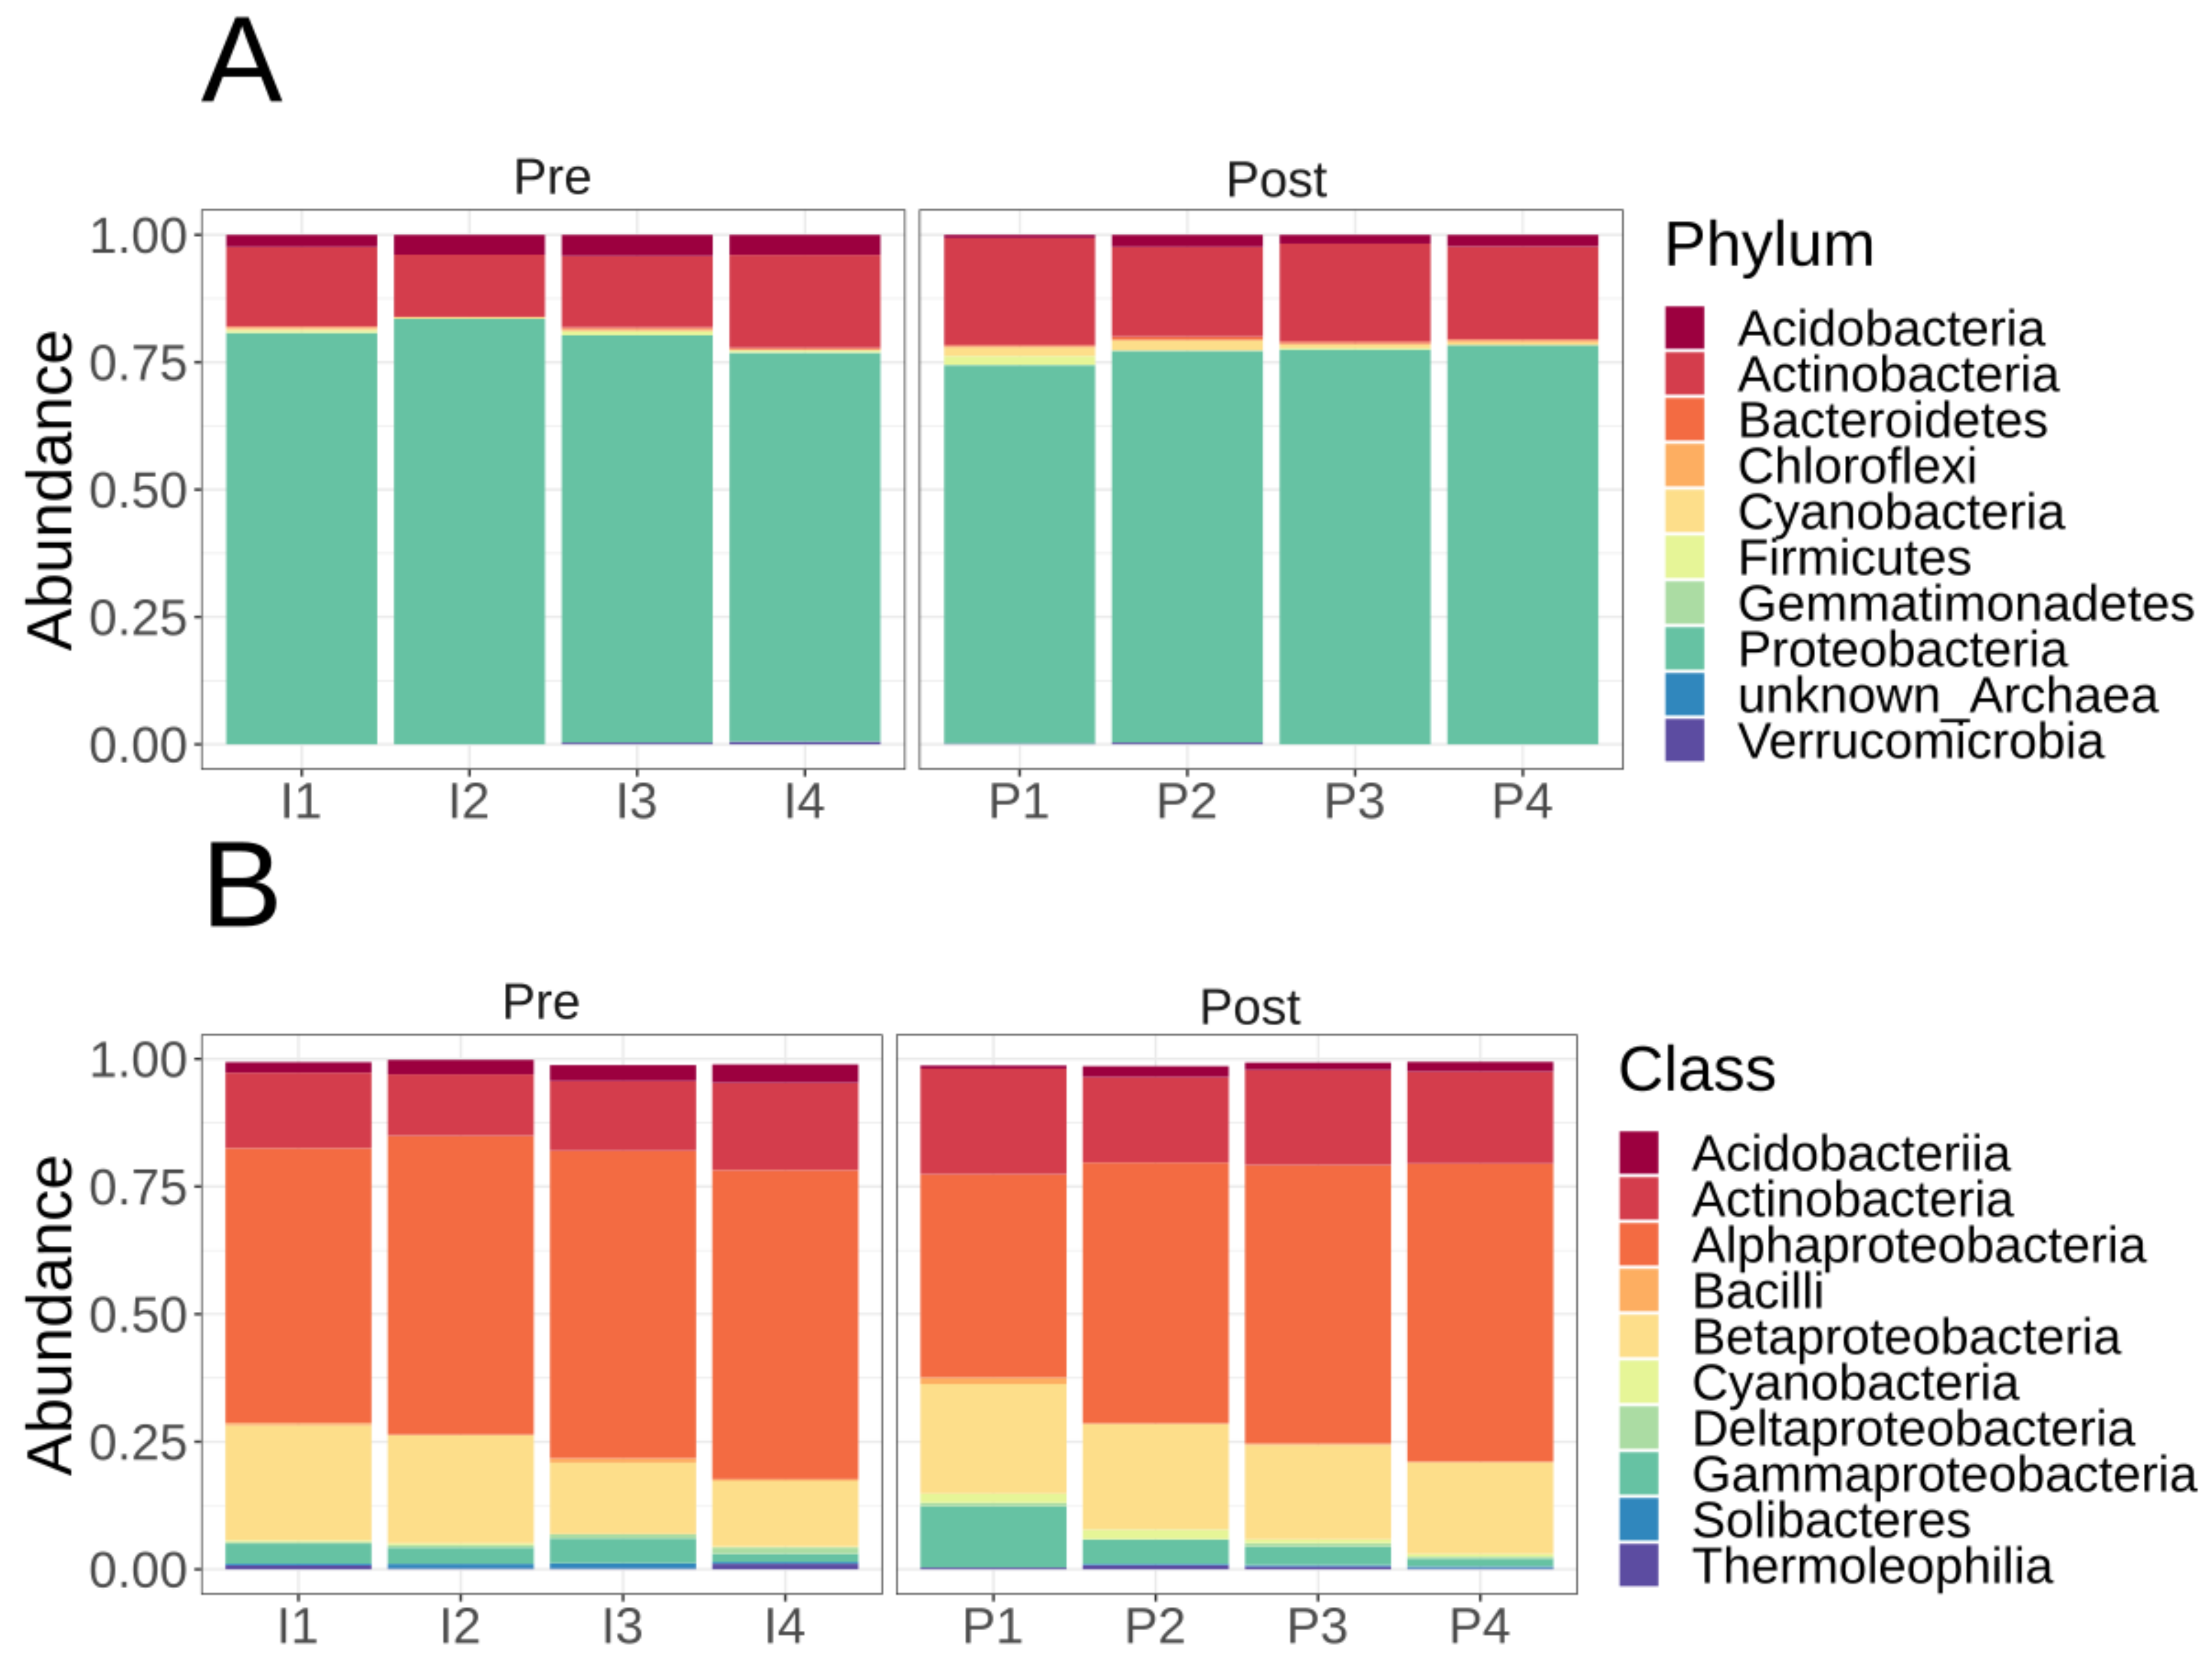
3.2. Microbiome Diversity and Composition of Lux Arbor Switchgrass Rhizosphere

Only 571 mOTUs were identified across all 8 samples combined. Comparing alpha diversity between pre- and post-fertilization samples showed no statistically significant difference between diversity metrics, which included observed mOTUs, ACE richness, Shannon diversity, or Simpson evenness (Figure 1A, Table S1). Qualitatively, the variances were more substantial and more variable for alpha diversity metrics within post-fertilized plots than pre-fertilized (Figure 1A). There was no statistically significant difference between alpha diversity metrics (Figure 1A) due to high variance observed post-fertilization. Using UniFrac (weighted and unweighted) (Figure 1B,C) and Bray–Curtis (Figure 1D) distance, samples using a paired analysis block effects with treatment were highly variable with slight clustering by pre- and post-fertilization treatment. Adonis testing (permanova) suggested no statistically significant difference by treatment using either the UniFrac (weighted and unweighted) or Bray–Curtis difference (Table S2).
The microbial taxonomic composition of the Lux Arbor switchgrass rhizosphere plots based on mOTUs were numerically dominated by Proteobacteria (>70% whether they were pre- or post-fertilizer), followed by Actinobacteria (>10% pre- or post-fertilizer), then the other phyla were <5% each, which included Acidobacteria, Bacteriodetes, Chloroflexi, Cyanobacteria/Melainabacteria, Firmicutes, Gemmatimonadetes, and Verrucomicrobia (Figure 2). A single taxon, OTU158, represented >50% of the mOTU abundance in all samples (Table S2). OTI158’s closest reference genome is the N-fixing Alphaproteobacteria Bradyrhizobium japonicum, based on mOTU taxonomy. OTU603 is the next-most abundant mOTU, representing >20% the bacterial composition; it is a Betaproteobacteria Paraburkholderia sp. [C caribensis/terrae] found in all samples (Table S2). The most numerically dominant non-proteobacteria was OTI3128, which is Blastococcus sp. URHD0036, an Actinobacteria in the family Geodermatophilaceae, at >10% abundance in all samples (Table S2).

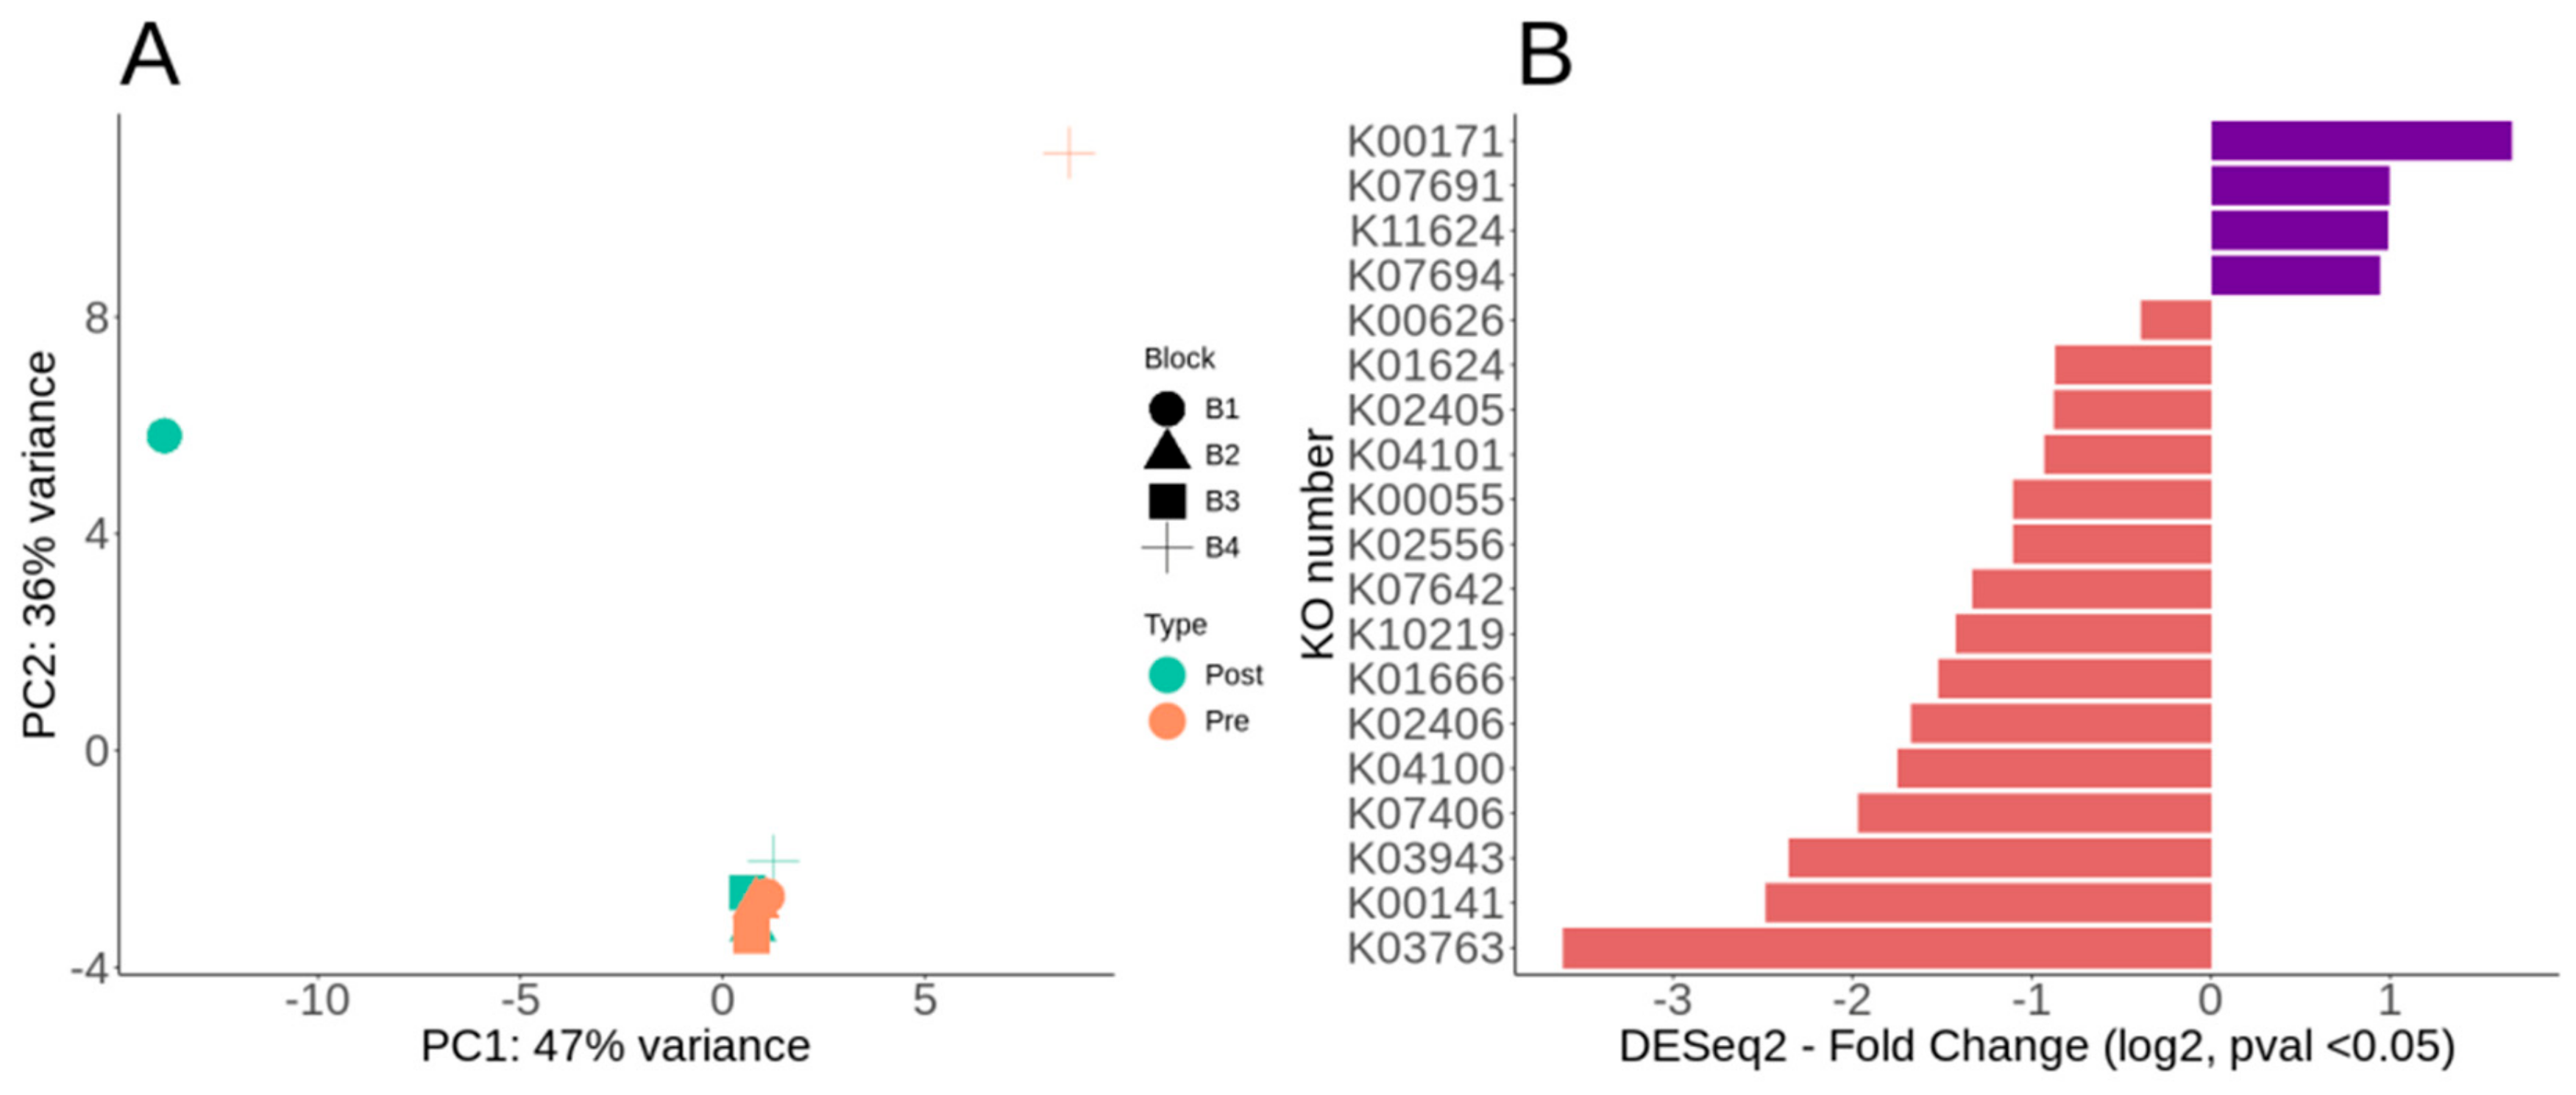
3.3. Overall Metabolic Potential and Differential Metabolic Genes of Lux Arbor Switchgrass Rhizosphere

Our primary annotation enlisted KEGG for pathway and gene level metabolic potential and functions. Amongst our KEGG annotations (KO), >75% of the metabolic potential was metabolism-based (KO level 1), which was followed by Environmental Information Processing (KO level 1) at ~11% (Table S3). Amongst the total metabolic potential of the Lux Arbor switchgrass rhizosphere, >15% of the metabolism-based (KO level 2) annotations were for amino acid and carbohydrate metabolism (Table S3).
We compared contig protein coding ORF functionality using DESeq2 via paired analysis post-fertilization using KEGG KO annotations. Using an MDS/PCoA ordination of the DESeq2 KO annotations, fertilization had minimal effect on blocks 2–3, but resulted in large shifts for blocks 1 and 4, though we lacked replicated samples to test this statistically (Figure 3A). Out of 3204 nonzero ORF counts, only 19 were significantly different in the paired DESeq2 analysis (Figure 3B, Table S3). Of those 19 differentially significant KO annotated ORFs, 15 were decreased whereas 4 were increased post-fertilization (Figure 3B, Table S3). The four that were differentially increased post-fertilization were K00171 (pyruvate ferredoxin oxidoreductase), K07691 (two-component system NarL family-ComA), KO11624 (two-component system, NarL family, response regulator YdfI), and K07694 (two-component system, NarL family, vancomycin resistance associated response regulator VraR) (Figure 3B, Table S3). The NarL is a two-component system involved in signal transduction and environmental information processing. While 15 annotated ORFs were differentially decreased post-fertilization, only 4 showed ~2 log2 fold change (Figure 3B, Table S3). Most of the KO ORFs that were significant by DESeq2 were depleted post-fertilization, including four that were >2 log2 fold change (Figure 3B, Table S3). These four which most depleted KOs post-fertilization were K03763 (DNA polymerase III subunit alpha), K00141 (benzaldehyde dehydrogenase (NAD) [EC:1.2.1.28]), K03943 (NADH dehydrogenase (ubiquinone) flavoprotein 2), and K07406 (alpha-galactosidase) (Figure 3B, Table S3). The K07406 is involved in carbohydrate metabolism and is linked to sphingo, glycerol, and glycoshingolipid metabolism and biosynthesis. The K00141 (also known as xylC) is involved with hydrocarbon degradation, including xylene, toluene, aminobenzoate, and steroids.

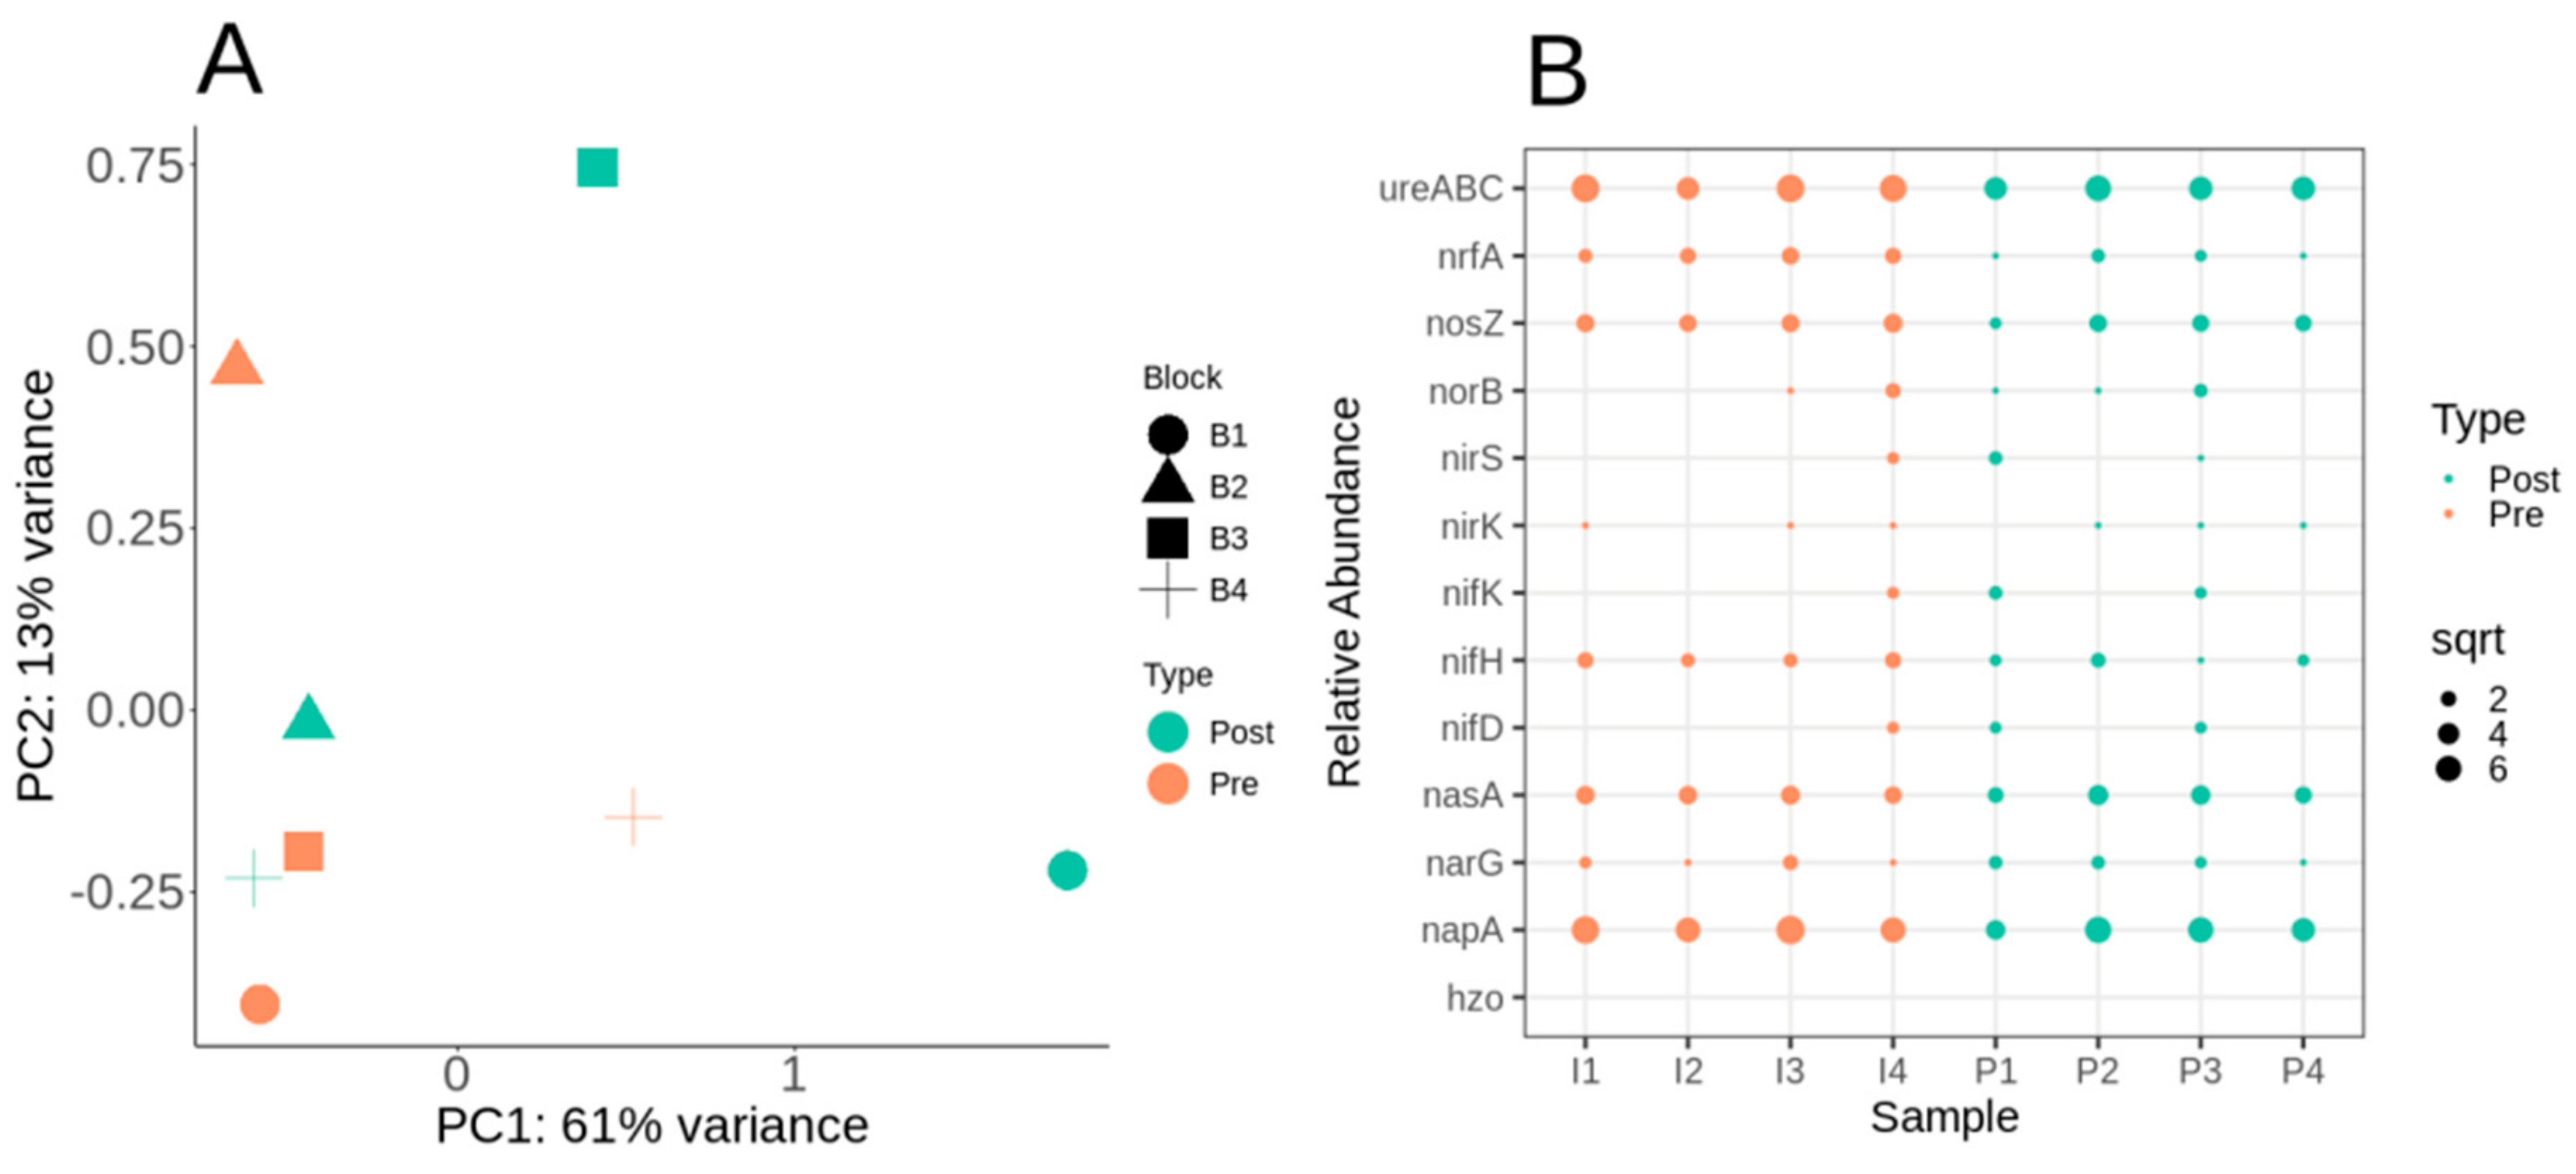
3.4. Nitrogen Cycle Metabolic Potential within the Switchgrass Rhizosphere Microbiome

Nitrogen-cycling metabolic potential in switchgrass is critical to understanding why switchgrass gains little benefit from N fertilizer addition. We compared the abundance of genes related to various steps in the N cycle including N fixation (nifDHK), denitrification (nirSK, norB and nosZ), ammonification (respiration/assimilation, nrfA, napA, narG, nasA), urea catabolism (ureABC), and anammox (hzo). The urea fertilization treatment also contained urease N-(n-butyl) thiophosphoric triamide (NBPT) and nitrification dicyandiamide (DCD) inhibitors. Ammonia monooxygenase enzyme, encoded by amoA, was not found in any samples. Anammox (hzo) was not detected in any of the samples.
We further compared the N-cycling functional ORFs’ impact on the whole functional metabolic potential profile using DESeq2 paired analysis, followed by MDS/PCoA ordination. Similar to the KO MDS/PCoA ordination, samples did not cluster by pre- and post-fertilization (Figure 4A). However, as with the KO analysis, blocks 1 and 4 had greatly separated linearly post-fertilization for N-specific functional ORFs (Figure 4A). Functionally, it appears that certain blocks were more differentiated by post-fertilization based on metabolic potential. Comparing relative abundance of N-cycling genes suggests similar abundance for ureABC, nosZ, nasA, and napA (Figure 4B).
Comparing N fixation, nifHDK gene cluster was detected in more post-fertilized samples than pre-fertilized (Figure 4B). Blast analysis of nifD, the molybdenum–iron nitrogenase alpha chain, found that all full-length sequences were Betaproteobacterial in origin (Table S4). Of the five nifD sequences found amongst the assembled contigs, two belonged to unclassified Betaproteobacteria, two were from Dechloromonas sp., one from Sulfuriferula sp, and, lastly, one from Herbaspirillum sp. (Table S4). All nifD sequences belonged to Betaproteobacteria, with none detected from Alphaproteobacteria, even amongst the high abundance of Bradyrhizobium detected in mOTU analysis. The N fixation gene nifH, on average, had 60% higher abundance in plots pre-fertilization (Figure 4B). Diverse members of proteobacteria contained nifHK genes, including Azonexus hydrophilus, Herbaspirillum frisingense, Herbaspirillum rubrisubalbicans, Herbaspirillum sp. HC18, Dechloromonas aromatica, Dechloromonas sp. HYN0024, Dechloromonas sp. Dech2017, and Rhodocyclaceae bacterium (Table S4). The alternative nitrogenase gene clusters anf (iron-containing nitrogenase) or vnf (vanadium-containing nitrogenase) were not detected. No rhizobium (e.g., Bradyrhizobium) nitrogenase genes were detected.
Nitric oxide reductase (norB) was detected in three out of four plots post-fertilization (Figure 4B). NBPT had little inhibition of the gene level counts of ureABC, which encoded all the major subunits of the urease enzyme, as all samples had high levels of ureABC (Figure 4B). Both ureABC and napA were the most abundant N cycle-related genes, regardless of the plot or timepoint (Figure 4B). DCD also inhibits nitrous oxide (N2O) production when applied to the soil [61], but nosZ, which encodes nitrous oxide reductase, had similar abundance across all plots (Figure 4B).

3.5. Differential CAZy Potential within the Switchgrass Rhizosphere Microbiome

We further examined CAZy to characterize carbon utilization, uptake, and degradation within pre- and post-fertilization in our switchgrass rhizospheres. Comparing fertilization effects paired by field plot, we identified 21 CAZy enzyme genes’ differentials pre- versus post-fertilization (Table 2). An MDS/PcoA plot of the DESeq2 paired analysis results again shows sample blocks 1 and 4 as having the largest effects post-fertilization (Figure 5A). Of the 21 differential CAZy predictions, 71% were depleted, with only 5 that were enriched ~2 log2 fold change post-fertilization (Figure 5B, Table 2). Complete CAZy families were not enriched, but individual CAZy enzymes from various taxa were (Figure 5B, Table 2). Those five CAZy that were enriched included GT41 (Geobacter sulfurreducens), GT28 (Singulisphaera acidiphila), GH9 (Uncultured bacterium BLR10), GT2 (Acidobacterium capsulatum), GT51 (Brevibacterium linens), and GH33 (Cyclobacterium amurskyense) (Figure 5B, Table 2). GT2, GT28, and GT41 are families of glycosyltransferases that function on substrates such as N-acetyl-α-D-glucosamine, glycerol, galactose, cellulose, chitin, and glucans by an inverting mechanism. GH9 are glycoside hydrolases that function to catabolize cellulose, lichenin, cellobiose, and other plant components. GH33 is specialized for glycogen, dextrin, and other aminosugars. Three CAZy predicted enzymes had ≥2 log2 fold change post-fertilization, which included a carbohydrate-binding module (CBM54), glycosyltransferase (GT4), and a multi-domain auxiliary activity (AA3_1/AA8) (Figure 5B, Table 2). CBM54 binds to xylan, yeast cell wall glucan, and chitin [62], but this family’s function is relatively unknown. The AA3_1/AA8 has a heme binding site, a cytochrome domain, a cellobiose dehydrogenase, and a choline dehydrogenase or flavoprotein, and is of Basidiomycota fungal origin (Table 2). The GT4 is another major transferase family for simple sugars, which operates via a retaining mechanism which includes sucrose synthase (EC 2.4.1.13), sucrose–phosphate synthase (EC 2.4.1.14), and α-glucosyltransferase (EC 2.4.1.52). Of the most significant CAZy enzymes, 52% are associated with plants, plant-associated zones (phyllosphere or rhizosphere), or are from soil directly (Table 2). CAZy enzymes that were significant represented three kingdoms (fungi, archaea, bacteria), seven bacterial phyla, and two uncultivated organisms (Table 2).

3.6. Genome-Resolved Metagenomics Elucidates Members of the Rare Biosphere

We obtained 190,172 > 5 kbp contigs in total from our 8 metagenomes and used the differential read abundance pre- and post-fertilization, which resulted in 29 MAGs from many phyla (e.g., Actinobacteria, Acidobacteria, Dormibacterota (formally candidate division AD3), Nitrospira, Gemmatimonadetes, Proteobacteria, and Verrucomicrobia). These MAGs represented high abundance (Actinobacteria, Acidobacteria, Proteobacteria, and Verrucomicrobia) and low abundance members (Nitrospira and Gemmatimonadetes) of common soil phyla, as well as members of the rare biosphere (Dormibacterota, Candidatus Eisenbacteria, and Candidate phyla UBA10199—formerly Deltaproteobacteria) (Figure 6A, Table 3). Acidobacteriota (Acidobacteria) phyla had the most representative MAGs with eight (Figure 6A, Table 3). The MAG genome sizes ranged from 2.5 to 11 Mbp, with a G + C content of 55 to 71.7% and a total contig range from 38 to 527 (Table 3). Amongst the 14 MAGs within the pre-fertilized samples, 2 are close to being high-quality drafts. High-quality drafts are defined by the minimum information about a metagenome-assembled genome (MIMAG) reporting guidelines at >90% complete, <5% contamination, and with the presence of one entire rRNA operon (5S, 16S, 23S) and 18 tRNAs [8]. The rest of the pre-fertilized MAGs were medium-quality drafts, and no low-quality drafts were used in downstream analysis. For the 15 MAGs within the post-fertilized plot, 8 were near high-quality drafts, with the rest being medium draft quality (Table 3).
We compared multiple methods to obtain taxonomic identity for MAGs, finding GTDB-Tk to be the most reliable. We classified MAG taxonomy by metawrap’s classifier, classify genomes (which uses the mOTU v2 taxonomy), JSpeciesWS Tetra Correlation Search (TCS) [10,58], GTDB-Tk, and blastp of ribosomal protein S9 gene. Only GTDB-Tk provided the taxonomic identifications that were supported by ribosomal protein S9 gene blastp results. Classify genomes supplied no identifications beyond “Bacteria.” (Table S5). JspeciesWS TCS misclassified candidate phyla such as Dormibacterota, which it classified incorrectly as “Mycobacterium.” (Table S5). Metawraps classifier also provided no identifications for candidate phyla such as Dormibacterota (Table S5). GTDB-Tk-based taxonomy was therefore used for all downstream MAG taxonomy.
While the presence of all 29 MAGs was detected in all samples, whether pre- or post-fertilization (Figure 6B), the abundance differed across the MAGs resolved. MAG P9 had the lowest average abundance across samples (Figure 6B), whereas MAG P11 had the highest average overall abundance (Figure 6B). Although we had limited replication (4 replicates), Acidobacteria and Actinobacteria phyla were also found amongst the top 10 mOTUs’ phyla based on composition. The samples pre-fertilization resolved MAGs from Gemmatimonadetes, Candidatus Eisenbacteria, Nitrospira, and Dormibacterota, but these were not as highly resolved or as abundant in the post-fertilization samples (Table 3). We had one MAG in the pre-fertilization samples belonging to the “Myxococcota,” formerly Deltaproteobacteria, but now its own phyla based on the GTDB. The post-fertilization samples yielded MAGs from Verrucomicrobia, Chlorflexota, and Candidate phyla UBA10199 that were not resolved well in the pre-fertilization samples (Table 3).
Gammaproteobacterial MAGs from the Lelliottia and Janthinobacterium genera (Table 3) were only found in the post-fertilization samples. MAG P6, a Lelliottia (Enterobacteriaceae), was poorly represented across all the samples except for one post-fertilization (P1) (Figure 6B). The high abundance of P6 in a single sample could suggest an infection of plant roots within the switchgrass rhizosphere. Lelliottia are opportunistic pathogens of roots and implicated in post-harvest onion rot [63].

3.7. Betaproteobacterial MAG with Molybdenum-Based Nitrogen Fixation Gene Cluster

We screened all our MAGs for N fixation genes, such as the dominant molybdenum-based (nif gene cluster), and the alternative N fixation clusters based on vanadium (vnf gene cluster) and iron (anf gene cluster). As mentioned above, nifD genes only have similarity to Proteobacteria, with no other phyla represented. We resolved four proteobacterial MAGs in the post-fertilization treatment only. MAG P10, which is classified as Janthinobacterium, has two copies of nifD and nifK, one nifH, and one nifW, arranged on a single gene cluster for molybdenum-based N fixation. The nifHDK was previously detected as HGW-Betaproteobacteria-11 and HGW-Betaproteobacteria-7 (Table S4), which are located on the same contig within our MAG P10 genome.

3.8. Acidobacteria Related to Rare Subdivision 23 with Utilization Nitrate

Acidobacteria represented eight of the total twenty-nine MAGs within our Lux Arbor switchgrass rhizosphere, with relations to Thermoanaerobaculia (subdivision 23), Koribacteraceae (subdivision 1), and unclassified Acidobacteriales (subdivision 1). Five MAGs were related to Thermoanaerobaculia (subdivision 23), with two in pre-fertilized and three in post-fertilized (Table 3). The resolved Thermoanaerobaculia genomes ranged from 4 to 5.4 Mbp, 56 to 66% G + C, 91 to 96% completeness, and 0.8 to 5.5% contamination (Table 3).
Our Thermoanaerobaculia appeared to utilize nitrate but not ammonium or urea, nor to have the ability to fix N. Ammonia monooxygenase (amoA or amoB), urease (alpha or gamma, ureA or ureC), nitrification genes (nxrAB), nitrous oxide reductase (nosZ), or nitrite reductases (nirK or nirS) were not detected in the Thermoanaerobaculia MAGs. The anaerobic nitric oxide reductase transcription regulator (NorR) was present in all Thermoanaerobaculia genomes with up to nine copies in I2. Nitrate reductase (1.7.99.4; napA and nasC), formate dehydrogenase nitrate-inducible (fdnH), and nitrate transporter (narT) was present amongst the genomes. The nasA nitrate reductase was not present in any of the MAGs. MAG P4, while not classified past Acidobacteriales, had nitrate utilization genes including narT transporter, nasC nitrate reductase, and the formate dehydrogenase nitrate-inducible gene (fdnH).
We further characterized the carbohydrate utilization in the Thermoanaerobaculia MAGs for potential carbon source utilization. The most abundant genes included major glycosyltransferases (GT2 and GT4) families that synthesize diverse substrates including cellulose, chitin, sucrose, sucrose–phosphates, and glucose–glycerol phosphates. The top glycoside hydrolases (GH) encoded by the Thermoanaerobaculia MAGs included GH23 and GH0 families. GH0 is the uncharacterized family of GH, which comprises completely novel and unknown enzymes. The GH23, a specific enzyme family, is a rather specific substrate family which contains lysozyme type G (EC 3.2.1.17), peptidoglycan lyase (EC 4.2.2.n1), and chitinase (EC 3.2.1.14). GH3 and GH18 were also numerically abundant amongst the Thermoanaerobaculia MAGs, which encode GH3 (β-glucosidase (EC 3.2.1.21); xylan 1,4-β-xylosidase (EC 3.2.1.37); β-glucosylceramidase (EC 3.2.1.45) and GH18 (chitinase (EC 3.2.1.14); lysozyme (EC 3.2.1.17); endo-β-N-acetylglucosaminidase (EC 3.2.1.96); and peptidoglycan hydrolase). Carbohydrate-binding module 50 (CBM50) was the most abundant CBM enzyme amongst the Thermoanaerobaculia MAGs, which contain 50 residues that have a LysM domain and works synergistically with GH23 or other enzymes that cleave chitin or peptidoglycan. CBM2 was the second-most abundant CBM enzyme present in the Thermoanaerobaculia MAGs, which has 100 residues with modules that bind cellulose, chitin, and xylan.

3.9. Nitrospira Hydrolysis of Urea, Nitrate Reduction with Limited Nitrite Reduction

Nitrospira MAGs were only well-resolved in the pre-fertilized plots. Four MAGs (I3, I8, I11, I14) in the pre-fertilized plots were classified as Nitrospira, and the genomes resolved ranged from 3 to 4.5 Mbp, 55 to 58% G + C, 82 to 96% completeness, and 4 to 8% contamination (Table 3). Nitrospira MAG I11 was the most complete at 96%, with the lowest contamination at ~4% (Table 3). Nitrospira MAG I11 MAG had up to 0.11% of all the reads in a pre-fertilized plot mapped directly to the genome, representing relatively high abundance.
We further examined the N metabolism of the Nitrospira-related MAGs within Lux Arbor to identify how N metabolism functioned for these recovered MAGs. None of the MAGs had genes related to ammonia monooxygenase (amoA or amoB), so no gene annotations supported the presence of ammonia oxidation metabolism. No nitrification genes (nxrAB), nitrous oxide reductase (nosZ), or nitrite reductase (nirK or nirS) genes were detected amongst the annotations for these MAGs. All the Nitrospira MAGs had urease subunits (alpha or gamma, ureA or ureC) and accessory proteins (ureDGF) present. As for denitrification, all Nitrospira MAGs had denitrification regulatory protein (nirQ), but that was the only nir gene found amongst the MAGs. Nitric oxide reduction pathway, which encodes an anaerobic nitric oxide reductase (norV/norW), was not found; however, the anaerobic nitric oxide reductase transcription regulator (norR) was found amongst the MAGs. All MAGs had assimilatory nitrite reductase (nasE), and MAG I14 had a copper-containing nitrite reductase, but no other genes for nitrite metabolism were found. MAG I14 had genes relating to nitrate influx and reduction to nitrite, and genes included the nitrate transporters (nasA, 3 copies) and nitrate reductase (napA, 1.7.99.4). MAG I11 had napA but did not have the nasA transporters. N fixation has never been found amongst the Nitrospira and was not found in any of our resolved MAGs.
Using CAZy, we compared the carbohydrate-active enzymes present within our Nitrospira MAGs related to carbon source metabolism. Glycosyltransferases (GT2 and GT4) were the most prevalent CAZy enzymes present in the Nitrospira MAGs, which metabolize cellulose, chitin, or simple sugars such as sucrose. As with the Thermoanaerobaculia MAGs, the most numerically abundant GHs were GH23 and GH0 in the Nitrospira MAGs. Carbohydrate esterases with the highest numerical abundance included CE11, CE1, and CE14. CE1 contains acetyl xylan esterase (EC 3.1.1.72), cinnamoyl esterase (EC 3.1.1.-), and feruloyl esterase (EC 3.1.1.73). The CE1 family also contains intracellular poly(3-hydroxybutyrate) (PHB) depolymerases. The CE14 family contains N-acetyl-1-D-myo-inosityl-2-amino-2-deoxy-α-D-glucopyranoside deacetylase (EC 3.5.1.89) and diacetylchitobiose deacetylase (EC 3.5.1.-). Diacetylchitobiose deacetylase is involved in chitin degradation and metabolism.

3.10. Dormibacterota MAGs’ Metabolic Potential within the Switchgrass Rhizosphere

Dormibacterota MAGs were resolved in the pre-fertilization samples only (MAGs I10 and I13). The two MAGs ranged from 3.7 to 4 Mbp, 71 to 72% G + C content, 88 to 98% completeness, and 0.9 to 2% contamination (Table 3). Dormibacterota I13 was a near high-quality genome at 98.6% complete and 0.92% contamination, and was the most resolved MAG in the pre-fertilized treatments (Table 3).
The two Dormibacterota MAGs contained no complete gene clusters for N fixation, urea, or nitrite utilization. Urea and nitrite utilization genes were also not found. I10 had a nifH nitrogenase but was missing the rest of the genes required for N fixation, such as nifDK. MAG I13 had no N fixation genes. Both had a nitrate-inducible formate dehydrogenase (fdnH) and the napA nitrate reductase. The nasC nitrate reductase and narT nitrate transporter were not found in I10 or I13 MAG. The I13 MAG lacked the nasA nitrate transporter, whereas I10 had the nasA transporter gene.
Carbon monoxide dehydrogenases were found amongst the I10 and I13 MAGs, which catalyze the oxidation of carbon monoxide to carbon dioxide using a quinone donor (EC:1.2.5.3). Carbon monoxide aerobic dehydrogenases have been named either cox or cut gene clusters under the same EC 1.2.5.3. I10 and I13 had cutL (large chain), cutM (medium chain), and cutS (small chain) genes present. I10 had one coxS (small chain) gene, but I13 had zero cox genes related to CO dehydrogenases. No ribulose-1,5-bisphosphate carboxylase (RuBisCO) (rbcL) was found.
Our Dormibacterota MAGs had similar high abundance of GT2, GT4, CBM2, CBM50, GH0, GH18, GH23, and CE14 in the top 10 of their CAZy repertoire, as did our Acidobacteria and Nitrospira MAGs. This suggests that our Dormibacterota MAGs, I10 and I13, can utilize cellulose, chitin, or simple sugars such as sucrose.

4. Discussion

Metagenomic assembly of soil and rhizosphere ecosystems has remained an enormous challenge due to the difficulty in obtaining long contigs to reconstruct high-quality MAGs. While metagenomics has improved since the original prairie soil assembly, which contained only a few contigs > 5 kbp [9], due to the development of better software [46,47], short reads still provide significant challenges. The Lux Arbor marginal land switchgrass rhizosphere metagenomes we report represent an excellent model system with very long contigs from short reads (150 bp paired-end), due to lower microbial community diversity and complexity. In prairie soils (e.g., Kansas or Iowa) [9,10], it is not possible to obtain long contigs with just short reads and computation alone [10], and only long read technologies (i.e., moleculo) have yielded similar results to our Lux Arbor short read assembly. To compare on average, a single sample from Lux Arbor had 23,771 contigs > 5 kbp, while a Kansas native prairie soil with a similar amount of data had 4683 (100 bp paired-end) and 8532 (250 bp paired-end) [10]. A single moleculo sequence library from a pooled Kansas prairie sample yielded 10,198 contigs > 10 kbp in length, and our Lux Arbor sample yielded 44,171 contigs > 10 kbp in length using only short reads. The maximum contig length obtained from a hybrid assembly of Kansas prairie was <63 kbp, whereas Lux Arbor had 237 contigs > 100 kbp in length, with a max contig of 697,599 bp [10]. Recently, a closed bacterial genome has been obtained from the Saccharibacteria, formerly candidate phyla TM7, from stable isotope-labeled rhizosphere metagenome, suggesting that binning complete genomes directly from soil is possible [16]. Our data suggest that Lux Arbor soils have lower microbial community complexity than Kansas prairie soil, based on the quality of metagenomic de novo assembly obtained. This nominates Lux Arbor and, possibly, other marginal soils to provide a testbed for soil and rhizosphere metagenomics.
Obtaining metagenomic bins to resolve individual microbial genomes within the soil and rhizosphere has remained problematic, as the common assumption is that the higher the microbial complexity, the harder it is to resolve genomes directly from a sample. Low-complexity permafrost soil has had great success in resolving genomes, with over 1500 individual MAGs resolved with expressed metabolisms using transcriptomics and proteomics [64], but we have yet to obtain this order of magnitude with ease in non-permafrost soil. The first genome-centric view of a soil ecosystem was in the Kansas native prairie, where 129 MAGs were obtained, but, on average, the genome completeness was quite low at ~40% [10]. The second grassland soil resolved 372 total genomic bins, with 181 that were partial to near-complete [11]. A recent study of Amazon soil (using MIMAG guidelines) had 29 MAGs that were medium quality in representing over ten phyla, including members of the Candidate phyla radiation [12]. A Mediterranean grassland soil MAG study obtained 793 MAGs that were near-complete [65]. We compared concoct, maxbin2, and metabat2 within metawrap, and found that, on average, maxbin2 provided higher quality and lower contamination MAGs than metabat2, resulting in the 29 MAGs that we described (Figure S2).
In this study, we resolved genomes in the Lux Arbor switchgrass rhizosphere that represented uncultivated phyla, including the Acidobacteria group (rare subgroup 23), Candidate phyla UBA10199, Candidatus Eisenbacteria, and Dormibacterota (AD3). Acidobacteria are dominant soil phyla, representing upwards of 20% of all soil bacteria, highly diverse, and physiologically active [66]. Acidobacteria MAGs from Kansas prairie soil were highly transcriptionally active [10], and genomes have been resolved from grassland [11] and Amazonian soil [12]. Lux Arbor Thermoanaerobaculia MAGs have previously never been described in soil, only in wastewater, sediments, and hot springs [67,68]. The Thermoanaerobaculia MAGs, we describe are the first representatives of Acidobacteria subgroup 23 from a soil or rhizosphere environment. The Acidobacteria and Dormibacterota phyla are on the ‘most wanted list’ of organisms from the soil and rhizosphere ecosystem for cultivation [69] and genome references via single-cell genomes or MAGs [70]. Thermoanaerobaculia and Dormibacterota MAGs have the potential to utilize nitrate, but not molecular N, urea, or ammonia. Their carbohydrate metabolism is similar to the other Lux Arbor MAGs in terms of utilization of cellulose, chitin, and simple sugars such as sucrose. The Dormibacterota have been previously implicated in carbon gas exchange (CO and CO2) in Antarctic soils, including RuBisCO and carbon monoxide dehydrogenases [71]. Recently, Dormibacterota MAGs have been resolved in subsurface soil horizons which have had genes identified to aid survival in low-nutrient environments [72]. We find the Lux Arbor MAGs lack RuBisCO for CO2 capture and utilization, but do have CO-dehydrogenases which may allow CO metabolism; CO metabolism may be thus conserved in Dormibacterota found in soil, rhizosphere, and permafrost ecosystems. Soil Dormibacterota lack both RuBisCo and dehydrogenases, meaning they lack autotrophic metabolism [72]. Dormibacterota may lose autotrophy under more stressful environmental conditions.
We resolved only the third representative from the elusive candidate phyla Eisenbacteria. Our MAG is the first to be found amongst soil or rhizosphere ecosystems. The previous two were found via genome resolved metagenomics in the Atlantic Ocean deep vent sample (BioSample: SAMN09287800), named Candidatus Eisenbacteria bacterium SZUA-252, and Rifle, Colorado, USA background sediment (BioSample: SAMN04313721), named Candidatus Eisenbacteria bacterium RBG_16_71_46 [73]. This phyla appears to be extremely rare, as 8000 MAG studies did not find any representatives across thousands of samples [68]. Here, we add another representative of this rare phyla for further comparative genome analysis.
In contrast to previous studies, the metagenomes we report nominate the betaproteobacterium Janthinobacterium as a candidate organism for association nitrogen fixation in the switchgrass rhizosphere. Nitrogen fixation (nif gene cluster) was present within the bulk metagenome amongst diverse Betaproteobacterial members: Azonexus, hydrophilus, Herbaspirillum, Dechloromonas, Rhodocyclaceae, and Sulfuriferula. No other nitrogenase (nif/anf/vnf) genes outside of betaproteobacterial class were discovered. Our reconstruction of the Janthinobacterium P10 MAG demonstrated that this genome contains a complete nif gene cluster. A related Janthinobacterium lividum V30-G6 isolated from permafrost showed low levels of N fixation via the acetylene reduction assay [74]. Bradyrhizobium spp. are highly represented in our Lux Arbor mOTU data and previous nifH data from switchgrass rhizosphere soils [40,41]. However, we were unable to find Bradyrhizobium nifDKH genes or resolve a Bradyrhizobium MAG in our study. Longer read sequencing or further depth seems to be required to address the Bradyrhizobium in Lux Arbor. Many Bradyrhizobium lack nif genes, as previously described in soils from North America and England [75,76]
Two inhibitors included in the N fertilizer (SuperU) by the manufacturer inhibit nitrate reduction and urease: dicyandiamide (DCD) and N-(n-butyl) thiophosphoric triamide (NBPT), respectively. We measured the potential effects of these inhibitors at the community, individual, and gene level. Ammonium oxidation (amo) genes were not present in the bulk metagenome or associated with a resolved MAG. Dicyandiamide (DCD) limits the conversion of ammonium to nitrite via the ammonium monooxygenase (amo), but has no effect on urea hydrolysis [77,78]. DCD has been shown to sharply reduce amo gene copy numbers in ammonium oxidizing bacteria (AOB), but has relatively little effect on ammonium oxidizing archaea (AOA) amo gene copy number [78]. The AOB community is strongly shifted by DCD, with impacts on function, namely nitrification, regardless of whether it is an AOB or AOA amo [78]. This could be the reason why we were unable to detect any amo genes in post-fertilized plots, but cannot explain the lack of amo in our untreated plots. The AOB and AOA communities may be limited in abundance in these marginal lands due to lack of available ammonium that is rapidly fixed then utilized by plant roots. This could be due to rapid utilization of ammonium or its loss by volatilization, leaving little ammonium available for microbes with ammonium oxidation capabilities. In addition, lack of ammonia oxidation would lead to lower levels of nitrate available for denitrification and thus reduce potential N2O emissions. Indeed, DCD has been shown to mitigate N2O emissions [61], and other studies without DCD have observed lower N2O emission under switchgrass compared to other bioenergy crops. We find that the abundance of nitrous oxide reductase (nosZ) genes to be similar pre- and post-fertilization, suggesting that inhibition occurs beyond the gene level, either at an enzymatic level or due to substrate (nitrate) limitation. This is supported by previous work that found DCD did not affect nosZ gene presence or abundance [79].
Urease genes were numerically abundant both pre- and post-fertilization and were prevalent within the Nitrospira MAGs that we assembled. This points to the importance of Nitrospira in transforming urea to ammonium, and these organisms showed high abundance both pre- and post-fertilization. In another system, Nitrospira was enriched five-fold after N fertilizer treatment in agricultural soils under corn and soybean rotation, and Nitrospira MAGs were resolved with complete ammonia oxidization (comammox) [80]. Our Nitrospira MAGs lack the genes required for comammox, including the amo gene. The Nitrospira of Lux Arbor have the metabolic potential for urease, and the urease inhibitor N-(n-butyl) thiophosphoric triamide (NBPT) did not alter the ure gene copy number present pre- versus post-fertilization. However, it is unknown from our data whether urease enzyme function was altered in the post-fertilized plots, but NBPT is the most successful urease inhibitor on the market, reducing ammonium volatilization loss by 53% [81]. Further analysis of urease gene expression and urease enzyme function is needed to validate that NBPT inhibition occurs on the expression or functional level.
Carbon substrate metabolism, predicted using CAZy in the switchgrass roots of Lux Arbor, appears to be limited in terms of both the bulk metabolic potential and the individual genome level. CAZy abundances were differential under fertilizer treatment, and most were depleted in post-fertilized plots, including genes related to cellobiose, cellulose, xylan, wood-degradation, chitin, and N-acetylglucosamine. This may be due to increases in exudation of simpler carbon sources by switchgrass roots, either stimulated by fertilization or through other shifts in the system between sampling timepoints. Fertilizer treatment has been previously reported to impact CAZy enzyme function [82]. Enzyme assays could be used to validate CAZy function shifts in Lux Arbor. The MAG metabolic potentials based on CAZy had similar genes in very high abundance, with limited diversity relating to cellulose, chitin, or simple sugars.
The soils sampled here were from the same sample block, sampled just two weeks apart, immediately before and two weeks after fertilization. We found strong fertilizer effects in some blocks and little-to-no effect in others, suggesting resilience of the rhizosphere microbiome or variation in the timescales of these responses. Even with this variation, we were able to better resolve individual MAG communities present within the switchgrass rhizosphere. We are also not able to definitively conclude that the shifts we observe are due to N fertilization, since it is confounded with the time of sampling, but the functional relationships we characterize suggest that they are due to varying inputs of nitrogen and carbon in this system.

5. Conclusions

The Lux Arbor marginal land switchgrass plots provide an excellent model system to study a low-complexity and -diversity (<400 mOTUs) rhizosphere soil ecosystem. Due to this lower diversity, metagenomic assemblies yielded longer contigs and many MAGs at medium quality, based on MIMAG. We have described a snapshot of how a N fertilization event impacts the bulk metabolic potential of carbon and N metabolism. KO and CAZy relating to carbon and carbohydrate metabolism varied post -fertilization treatment. The two inhibitors included in the N fertilizer, DCD and NBPT, directly lowered ammonium monooxygenase (amo) gene copy number, which limits AOB but not AOA; however, our results do not confirm the impact on either functional group. AOB/AOA may have been limited in abundance in these marginal lands due to lack of available ammonium that is rapidly fixed then utilized by plant roots. We have also characterized the potential roles of several ‘most wanted taxa’ in the soil, resolving genomes from Candidatus Eisenbacteria, Thermoanaerobaculia, and Dormibacterota. To the best of our knowledge, our Candidatus Eisenbacteria MAG is the first described in soil at the time of this writing. Eisenbacteria are very rare in general, not being found amongst 8000 MAGs within a global survey [68]. The Thermoanaerobaculia MAGs we describe are the first representatives of Acidobacteria subgroup 23 from the rhizosphere. Our Thermoanaerobaculia MAGs utilize nitrate but not ammonium or urea, and cannot fix N. Dormibacterota have the potential for autotrophic CO utilization, which may impact carbon partitioning and storage. Furthermore, we resolved MAGs relating to ANF (Janthinobacterium) and nitrate utilization (Nitrospira). Further culture-dependent and multiomics studies are needed to evaluate the use of Janthinobacterium diazotrophs for ANF in switchgrass grown on marginal lands. Enhancing microbial ANF within marginal land sites will decrease fertilizer usage, lowering N needs for biofuel productions. Using ANF over industrial N fertilizer will require less energy overall, produce less carbon dioxide emissions, and provide a potential greener future of energy.

Supplementary Materials

The following supporting information can be downloaded at: https://www.mdpi.com/article/10.3390/agronomy13051294/s1, Figure S1: Field site map with sampling blocks in Lux Arbor. Figure S2: Comparison of metabat2 and maxbin2 binning statistics. Table S1: mOTU adonis statistical testing within phyloseq R results. Paired analysis using sample block (B1–B4) “Block,” and post-fertilization. Table S2: Top-10 mOTU abundance table from phyloseq R. This includes taxonomy of mOTUs and sample metadata. Table S3: KEGG KO contig protein-coding ORF count table. This includes level I to level II raw counts for KEGG KO. The DESeq2 KO paired analysis significant table out of 3204 KO’s with nonzero total orf count (p-value < 0.05). Table S4: Nitrogenase molybdenum–iron protein alpha chain gene (nifD) blast table. This was blastp analysis against genbank/refseq, with score, accession, and taxonomy. Table S5: Comparison of MAG taxonomy annotation. Comparing metawraps MAG taxonomy tool, Classify genomes tool, Jspecies, and ribosomal gene S9 with genbank/refseq, with score, accession, and taxonomy.

Author Contributions

A.G. and M.L.F. conceived and designed the experiments. A.G. and E.E.M. completed measurements and experiments of metagenomics. R.A.W.III conducted data analysis, metagenomic assemblies, metagenomic annotation, and cowrote the paper with M.L.F., L.K.T. and S.E. All authors contributed to editing and read and approved the manuscript. All authors have read and agreed to the published version of the manuscript.

Funding

The U.S. Department of Energy provided support for this research, Office of Science, Office of Biological and Environmental Research (Award DE-SC0018409 to SEE, LKT, MLF); the Great Lakes Bioenergy Research Center, U.S. Department of Energy, Office of Science, Office of Biological and Environmental Research (Award DE-FC02-07ER64494); the National Science Foundation Long-term Ecological Research Program (DEB 1637653) at the Kellogg Biological Station; and Michigan State University AgBioResearch.

Data Availability Statement

Raw sequence data, assembled contigs, and supplemental data are all available on https://osf.io/mzrvj/ (accessed on 15 April 2023). All code for this study is available on www.github.com/friesenlab/MMPRNT_panicum_metagenome_mags/ (accessed on 15 April 2023).

Acknowledgments

We would also like to thank the Kellogg Biological Station and Michigan State University AgBioResearch. Special thanks to H. Vander Stel, L. Bell-Dereske, G. Davis, M. Rabbitt, D. Marinas, J. Priebe, C. Landis, and Z. Ye for experimental assistance.

Conflicts of Interest

The authors declare that there are no conflict of interest. RAWIII is the CEO of RAW Molecular Systems (RAW), LLC, but no financial, IP, or other assistance from RAW INC was used or contributed to the study.

References

  1. Janzen, D.H. The natural history of mutualisms. In The Biology of Mutualism; Boucher, D.H., Ed.; Croom Helm: London, UK, 1985; Volume 3, pp. 40–99. [Google Scholar]
  2. Berendsen, R.L.; Pieterse, C.M.J.; Bakker, P.A.H.M. The rhizosphere microbiome and plant health. Trends Plant Sci. 2012, 17, 478–486. [Google Scholar] [CrossRef] [PubMed]
  3. Ramírez-Puebla, S.T.; Servín-Garcidueñas, L.E.; Jiménez-Marín, B.; Bolaños, L.M.; Rosenblueth, M.; Martínez, J.; Rogel, M.A.; Ormeño-Orrillo, E.; Martínez-Romero, E. Gut and Root Microbiota Commonalities. Appl. Environ. Microbiol. 2013, 79, 2–9. [Google Scholar] [CrossRef] [PubMed]
  4. White, R.A., III; Rivas-Ubach, A.; Borkum, M.I.; Köberl, M.; Bilbao, A.; Colby, S.M.; Hoyt, D.W.; Bingol, K.; Kim, Y.-M.; Wendler, J.P.; et al. The state of rhizospheric science in the era of multi-omics: A practical guide to omics technologies. Rhizosphere 2017, 3, 212–221. [Google Scholar] [CrossRef]
  5. White, R.A., III; Borkum, M.I.; Rivas-Ubach, A.; Bilbao, A.; Wendler, J.P.; Colby, S.M.; Köberl, M.; Jansson, C. From data to knowledge: The future of multi-omics data analysis for the rhizosphere. Rhizosphere 2017, 3, 222–229. [Google Scholar] [CrossRef]
  6. Ahkami, A.H.; White, R.A., III; Handakumbura, P.P.; Jansson, C. Rhizosphere engineering: Enhancing sustainable plant ecosystem productivity. Rhizosphere 2017, 3, 233–243. [Google Scholar] [CrossRef]
  7. Friesen, M.L.; Porter, S.S.; Stark, S.C.; von Wettberg, E.J.; Sachs, J.L.; Martinez-Romero, E. Microbially Mediated Plant Functional Traits. Annu. Rev. Ecol. Evol. Syst. 2011, 42, 23–46. [Google Scholar] [CrossRef]
  8. Bowers, R.M.; Kyrpides, N.C.; Stepanauskas, R.; Harmon-Smith, M.; Doud, D.; Reddy, T.B.K.; Schulz, F.; Jarett, J.; Rivers, A.R.; Eloe-Fadrosh, E.A.; et al. Minimum information about a single amplified genome (MISAG) and a metagenome-assembled genome (MIMAG) of bacteria and archaea. Nat. Biotechnol. 2017, 35, 725–731. [Google Scholar] [CrossRef]
  9. Howe, A.C.; Jansson, J.K.; Malfatti, S.A.; Tringe, S.G.; Tiedje, J.M.; Brown, C.T. Tackling soil diversity with the assembly of large, complex metagenomes. Proc. Natl. Acad. Sci. USA 2014, 111, 4904–4909. [Google Scholar] [CrossRef]
  10. Iii, R.A.W.; Bottos, E.M.; Chowdhury, T.R.; Zucker, J.D.; Brislawn, C.J.; Nicora, C.D.; Fansler, S.J.; Glaesemann, K.R.; Glass, K.; Jansson, J.K. Moleculo Long-Read Sequencing Facilitates Assembly and Genomic Binning from Complex Soil Metagenomes. Msystems 2016, 1, e00045-16. [Google Scholar] [CrossRef]
  11. Butterfield, C.N.; Li, Z.; Andeer, P.F.; Spaulding, S.; Thomas, B.C.; Singh, A.; Hettich, R.L.; Suttle, K.B.; Probst, A.J.; Tringe, S.G.; et al. Proteogenomic analyses indicate bacterial methylotrophy and archaeal heterotrophy are prevalent below the grass root zone. PeerJ 2016, 4, e2687. [Google Scholar] [CrossRef]
  12. Kroeger, M.; Delmont, T.O.; Eren, A.M.; Meyer, K.M.; Guo, J.; Khan, K.; Rodrigues, J.L.M.; Bohannan, B.J.M.; Tringe, S.G.; Borges, C.D.; et al. New Biological Insights Into How Deforestation in Amazonia Affects Soil Microbial Communities Using Metagenomics and Metagenome-Assembled Genomes. Front. Microbiol. 2018, 9, 1635. [Google Scholar] [CrossRef]
  13. Nelkner, J.; Henke, C.; Lin, T.W.; Pätzold, W.; Hassa, J.; Jaenicke, S.; Grosch, R.; Pühler, A.; Sczyrba, A.; Schlüter, A. Effect of Long-Term Farming Practices on Agricultural Soil Microbiome Members Represented by Metagenomically Assembled Genomes (MAGs) and Their Predicted Plant-Beneficial Genes. Genes 2019, 10, 424. [Google Scholar] [CrossRef]
  14. Li, Z.; Yao, Q.; Guo, X.; Crits-Christoph, A.; Mayes, M.A.; Iv, W.J.H.; Lebeis, S.L.; Banfield, J.F.; Hurst, G.B.; Hettich, R.L.; et al. Genome-Resolved Proteomic Stable Isotope Probing of Soil Microbial Communities Using 13CO2 and 13C-Methanol. Front. Microbiol. 2019, 10, 2706. [Google Scholar] [CrossRef]
  15. Nayfach, S.; Roux, S.; Seshadri, R.; Udwary, D.; Varghese, N.; Schulz, F.; Wu, D.; Paez-Espino, D.; Chen, I.-M.; Huntemann, M.; et al. A genomic catalog of Earth’s microbiomes. Nat. Biotechnol. 2020, 39, 499–509. [Google Scholar] [CrossRef]
  16. Starr, E.P.; Shi, S.; Blazewicz, S.J.; Koch, B.J.; Probst, A.J.; Hungate, B.A.; Pett-Ridge, J.; Firestone, M.K.; Banfield, J.F. Stable-Isotope-Informed, Genome-Resolved Metagenomics Uncovers Potential Cross-Kingdom Interactions in Rhizosphere Soil. Msphere 2021, 6, e00085-21. [Google Scholar] [CrossRef]
  17. Xu, L.; Dong, Z.; Chiniquy, D.; Pierroz, G.; Deng, S.; Gao, C.; Diamond, S.; Simmons, T.; Wipf, H.M.-L.; Caddell, D.; et al. Genome-resolved metagenomics reveals role of iron metabolism in drought-induced rhizosphere microbiome dynamics. Nat. Commun. 2021, 12, 1–17. [Google Scholar] [CrossRef]
  18. Mandro, J.A.; Nakamura, F.M.; Gontijo, J.B.; Tsai, S.M.; Venturini, A.M. Metagenome-Assembled Genomes from Amazonian Soil Microbial Consortia. Genome Announc. 2022, 11, e00804-22. [Google Scholar] [CrossRef]
  19. Wu, X.; Cui, Z.; Peng, J.; Zhang, F.; Liesack, W. Genome-resolved metagenomics identifies the particular genetic traits of phosphate-solubilizing bacteria in agricultural soil. ISME Commun. 2022, 2, 1–4. [Google Scholar] [CrossRef]
  20. Wrighton, K.C.; Thomas, B.C.; Sharon, I.; Miller, C.S.; Castelle, C.J.; VerBerkmoes, N.C.; Wilkins, M.J.; Hettich, R.L.; Lipton, M.S.; Williams, K.H.; et al. Fermentation, Hydrogen, and Sulfur Metabolism in Multiple Uncultivated Bacterial Phyla. Science 2012, 337, 1661–1665. [Google Scholar] [CrossRef]
  21. Kantor, R.S.; Wrighton, K.C.; Handley, K.M.; Sharon, I.; Hug, L.A.; Castelle, C.J.; Thomas, B.C.; Banfield, J.F. Small Genomes and Sparse Metabolisms of Sediment-Associated Bacteria from Four Candidate Phyla. mBio 2013, 4, e00708-13. [Google Scholar] [CrossRef]
  22. Philippot, L.; Raaijmakers, J.M.; Lemanceau, P.; van der Putten, W.H. Going back to the roots: The microbial ecology of the rhizosphere. Nat. Rev. Microbiol. 2013, 11, 789–799. [Google Scholar] [CrossRef] [PubMed]
  23. Zhalnina, K.; Louie, K.B.; Hao, Z.; Mansoori, N.; da Rocha, U.N.; Shi, S.; Cho, H.; Karaoz, U.; Loqué, D.; Bowen, B.P.; et al. Dynamic root exudate chemistry and microbial substrate preferences drive patterns in rhizosphere microbial community assembly. Nat. Microbiol. 2018, 3, 470–480. [Google Scholar] [CrossRef] [PubMed]
  24. Hartmann, A.; Rothballer, M.; Schmid, M. Lorenz Hiltner, a pioneer in rhizosphere microbial ecology and soil bacteriology research. Plant Soil 2007, 312, 7–14. [Google Scholar] [CrossRef]
  25. Smercina, D.N.; Evans, S.E.; Friesen, M.L.; Tiemann, L.K. To Fix or Not To Fix: Controls on Free-Living Nitrogen Fixation in the Rhizosphere. Appl. Environ. Microbiol. 2019, 85, e02546-18. [Google Scholar] [CrossRef]
  26. deCatanzaro, J.B.; Beauchamp, E.G. The effect of some carbon substrates on denitrification rates and carbon utilization in soil. Biol. Fertil. Soils 1985, 1, 183–187. [Google Scholar] [CrossRef]
  27. Pajares, S.; Bohannan, B.J.M. Ecology of Nitrogen Fixing, Nitrifying, and Denitrifying Microorganisms in Tropical Forest Soils. Front. Microbiol. 2016, 7, 1045. [Google Scholar] [CrossRef]
  28. Masson-Boivin, C.; Giraud, E.; Perret, X.; Batut, J. Establishing nitrogen-fixing symbiosis with legumes: How many rhizobium recipes? Trends Microbiol. 2009, 17, 458–466. [Google Scholar] [CrossRef]
  29. Demanèche, S.; Philippot, L.; David, M.M.; Navarro, E.; Vogel, T.M.; Simonet, P. Characterization of Denitrification Gene Clusters of Soil Bacteria via a Metagenomic Approach. Appl. Environ. Microbiol. 2009, 75, 534–537. [Google Scholar] [CrossRef]
  30. Giles, M.E.; Morley, N.J.; Baggs, E.M.; Daniell, T.J. Soil nitrate reducing processes—Drivers, mechanisms for spatial variation and significance for nitrous oxide production. Front. Microbiol. 2012, 3, 407. [Google Scholar] [CrossRef]
  31. Koch, H.; van Kessel, M.A.H.J.; Lücker, S. Complete nitrification: Insights into the ecophysiology of comammox Nitrospira. Appl. Microbiol. Biotechnol. 2018, 103, 177–189. [Google Scholar] [CrossRef]
  32. McLaughlin, S.B.; Kzos, L.A. Development of switchgrass (Panicum virgatum) as a bioenergy feedstock in the United States. Biomass Bioenergy 2005, 28, 515–535. [Google Scholar] [CrossRef]
  33. Schmer, M.R.; Vogel, K.P.; Mitchell, R.B.; Perrin, R.K. Net energy of cellulosic ethanol from switchgrass. Proc. Natl. Acad. Sci. USA 2008, 105, 464–469. [Google Scholar] [CrossRef]
  34. Wright, L.L. Historical Perspective on How and Why Switchgrass Was Selected as a “Model” High-Potential Energy Crop; U.S. Department of Energy Office of Scientific and Technical Information: Washington, DC, USA, 2007. [Google Scholar] [CrossRef]
  35. Wright, L.; Turhollow, A. Switchgrass selection as a “model” bioenergy crop: A history of the process. Biomass Bioenergy 2010, 34, 851–868. [Google Scholar] [CrossRef]
  36. Ruan, L.; Bhardwaj, A.K.; Hamilton, S.K.; Robertson, G.P. Nitrogen fertilization challenges the climate benefit of cellulosic biofuels. Environ. Res. Lett. 2016, 11, 064007. [Google Scholar] [CrossRef]
  37. Emery, I.; Mueller, S.; Qin, Z.; Dunn, J.B. Evaluating the Potential of Marginal Land for Cellulosic Feedstock Production and Carbon Sequestration in the United States. Environ. Sci. Technol. 2016, 51, 733–741. [Google Scholar] [CrossRef]
  38. Duran, B.E.L.; Duncan, D.S.; Oates, L.G.; Kucharik, C.J.; Jackson, R.D. Nitrogen Fertilization Effects on Productivity and Nitrogen Loss in Three Grass-Based Perennial Bioenergy Cropping Systems. PLoS ONE 2016, 11, e0151919. [Google Scholar] [CrossRef]
  39. Singer, E.; Bonnette, J.; Kenaley, S.C.; Woyke, T.; Juenger, T.E. Plant compartment and genetic variation drive microbiome composition in switchgrass roots. Environ. Microbiol. Rep. 2019, 11, 185–195. [Google Scholar] [CrossRef]
  40. Roley, S.S.; Duncan, D.S.; Liang, D.; Garoutte, A.; Jackson, R.D.; Tiedje, J.M.; Robertson, G.P. Associative nitrogen fixation (ANF) in switchgrass (Panicum virgatum L.) across a nitrogen input gradient. PLoS ONE 2018, 13, e0197320. [Google Scholar] [CrossRef]
  41. Roley, S.S.; Xue, C.; Hamilton, S.K.; Tiedje, J.M.; Robertson, G.P. Isotopic evidence for episodic nitrogen fixation in switchgrass (Panicum virgatum L.). Soil Biol. Biochem. 2018, 129, 90–98. [Google Scholar] [CrossRef]
  42. Chen, H.; Yang, Z.K.; Yip, D.; Morris, R.H.; Lebreux, S.J.; Cregger, M.A.; Klingeman, D.M.; Hui, D.; Hettich, R.L.; Wilhelm, S.W.; et al. One-time nitrogen fertilization shifts switchgrass soil microbiomes within a context of larger spatial and temporal variation. PLoS ONE 2019, 14, e0211310. [Google Scholar] [CrossRef]
  43. Rinke, C.; Schwientek, P.; Sczyrba, A.; Ivanova, N.N.; Anderson, I.J.; Cheng, J.-F.; Darling, A.; Malfatti, S.; Swan, B.K.; Gies, E.A.; et al. Insights into the phylogeny and coding potential of microbial dark matter. Nature 2013, 499, 431–437. [Google Scholar] [CrossRef] [PubMed]
  44. Hug, L.A.; Baker, B.J.; Anantharaman, K.; Brown, C.T.; Probst, A.J.; Castelle, C.J.; Butterfield, C.N.; Hernsdorf, A.W.; Amano, Y.; Ise, K.; et al. A new view of the tree of life. Nat. Microbiol. 2016, 1, 16048. [Google Scholar] [CrossRef]
  45. Milanese, A.; Mende, D.R.; Paoli, L.; Salazar, G.; Ruscheweyh, H.-J.; Cuenca, M.; Hingamp, P.; Alves, R.; Costea, P.I.; Coelho, L.P.; et al. Microbial abundance, activity and population genomic profiling with mOTUs2. Nat. Commun. 2019, 10, 101. [Google Scholar] [CrossRef] [PubMed]
  46. White, R.A., III; Brown, J.; Colby, S.; Overall, C.C.; Lee, J.; Zucker, J.D.; Glaesemann, K.R.; Jansson, C.; Jansson, J.K. ATLAS (Automatic Tool for Local Assembly Structures)—A comprehensive infrastructure for assembly, annotation, and genomic binning of metagenomic and metatranscriptomic data. PeerJ 2017, 5, e2843v1. [Google Scholar]
  47. Li, D.; Liu, C.-M.; Luo, R.; Sadakane, K.; Lam, T.-W. MEGAHIT: An ultra-fast single-node solution for large and complex metagenomics assembly via succinct de Bruijn graph. Bioinformatics 2015, 31, 1674–1676. [Google Scholar] [CrossRef]
  48. Seemann, T. Prokka: Rapid Prokaryotic Genome Annotation. Bioinformatics 2014, 30, 2068–2069. [Google Scholar] [CrossRef]
  49. Huerta-Cepas, J.; Forslund, K.; Coelho, L.P.; Szklarczyk, D.; Jensen, L.J.; von Mering, C.; Bork, P. Fast genome-wide functional annotation through orthology assignment by eggNOG-Mapper. Mol. Biol. Evol. 2017, 34, 2115–2122. [Google Scholar] [CrossRef]
  50. Buchfink, B.; Xie, C.; Huson, D.H. Fast and sensitive protein alignment using DIAMOND. Nat. Methods 2014, 12, 59–60. [Google Scholar] [CrossRef]
  51. Zhang, H.; Yohe, T.; Huang, L.; Entwistle, S.; Wu, P.; Yang, Z.; Busk, P.K.; Xu, Y.; Yin, Y. dbCAN2: A meta server for automated carbohydrate-active enzyme annotation. Nucleic Acids Res. 2018, 46, W95–W101. [Google Scholar] [CrossRef]
  52. Love, M.I.; Huber, W.; Anders, S. Moderated estimation of fold change and dispersion for RNA-seq data with DESeq2. Genome Biol. 2014, 15, 550. [Google Scholar] [CrossRef]
  53. Alneberg, J.; Bjarnason, B.S.; de Bruijn, I.; Schirmer, M.; Quick, J.; Ijaz, U.Z.; Lahti, L.; Loman, N.; Andersson, A.; Quince, C. Binning metagenomic contigs by coverage and composition. Nat. Methods 2014, 11, 1144–1146. [Google Scholar] [CrossRef]
  54. Wu, Y.-W.; Simmons, B.A.; Singer, S.W. MaxBin 2.0: An automated binning algorithm to recover genomes from multiple metagenomic datasets. Bioinformatics 2015, 32, 605–607. [Google Scholar] [CrossRef]
  55. Kang, D.; Li, F.; Kirton, E.S.; Thomas, A.; Egan, R.S.; An, H.; Wang, Z. MetaBAT2: An adaptive binning algorithm for robust and efficient genome reconstruction from metagenome assemblies. PeerJ 2019, 7, e27522v1. [Google Scholar] [CrossRef]
  56. Uritskiy, G.V.; DiRuggiero, J.; Taylor, J. MetaWRAP—A flexible pipeline for genome-resolved metagenomic data analysis. Microbiome 2018, 6, 158. [Google Scholar] [CrossRef]
  57. Parks, D.H.; Imelfort, M.; Skennerton, C.T.; Hugenholtz, P.; Tyson, G.W. CheckM: Assessing the quality of microbial genomes recovered from isolates, single cells, and metagenomes. Genome Res. 2015, 25, 1043–1055. [Google Scholar] [CrossRef]
  58. Richter, M.; Rosselló-Móra, R.; Oliver Glöckner, F.; Peplies, J. JSpeciesWS: A web server for prokaryotic species circumscription based on pairwise genome comparison. Bioinformatics 2016, 32, 929–931. [Google Scholar] [CrossRef]
  59. Chaumeil, P.-A.; Mussig, A.J.; Hugenholtz, P.; Parks, D.H. GTDB-Tk: A toolkit to classify genomes with the Genome Taxonomy Database. Bioinformatics 2020, 36, 1925–1927. [Google Scholar] [CrossRef]
  60. McMurdie, P.J.; Holmes, S. phyloseq: An R package for reproducible interactive analysis and graphics of microbiome census data. PLoS ONE 2013, 8, e61217. [Google Scholar] [CrossRef]
  61. Lan, T.; Han, Y.; Roelcke, M.; Nieder, R.; Cai, Z. Effects of the nitrification inhibitor dicyandiamide (DCD) on gross N transformation rates and mitigating N2O emission in paddy soils. Soil Biol. Biochem. 2013, 67, 174–182. [Google Scholar] [CrossRef]
  62. Dvortsov, I.A.; Lunina, N.A.; Chekanovskaya, L.A.; Schwarz, W.H.; Zverlov, V.V.; Velikodvorskaya, G.A. Carbohydrate-binding properties of a separately folding protein module from beta-1,3-glucanase Lic16A of Clostridium thermocellum. Microbiology 2009, 155, 2442–2449. [Google Scholar] [CrossRef]
  63. Liu, S.Y.; Tang, Y.X.; Wang, D.C.; Lin, N.Q.; Zhou, J.N. Identification and characterization of a new Enterobacter onion bulb decay caused by Lelliottia amnigena in China. App. Micro. 2016, 2, 114. [Google Scholar] [CrossRef]
  64. Woodcroft, B.J.; Singleton, C.M.; Boyd, J.A.; Evans, P.N.; Emerson, J.B.; Zayed, A.A.F.; Hoelzle, R.D.; Lamberton, T.O.; McCalley, C.K.; Hodgkins, S.B.; et al. Genome-centric view of carbon processing in thawing permafrost. Nature 2018, 560, 49–54. [Google Scholar] [CrossRef] [PubMed]
  65. Diamond, S.; Andeer, P.F.; Li, Z.; Crits-Christoph, A.; Burstein, D.; Anantharaman, K.; Lane, K.R.; Thomas, B.C.; Pan, C.; Northen, T.R.; et al. Mediterranean grassland soil C-N compound turnover is dependent on rainfall and depth, and is mediated by genomically divergent microorganisms. Nat. Microbiol. 2019, 4, 1356–1367. [Google Scholar] [CrossRef] [PubMed]
  66. Naether, A.; Foesel, B.U.; Naegele, V.; Wüst, P.K.; Weinert, J.; Bonkowski, M.; Alt, F.; Oelmann, Y.; Polle, A.; Lohaus, G.; et al. Environmental Factors Affect Acidobacterial Communities below the Subgroup Level in Grassland and Forest Soils. Appl. Environ. Microbiol. 2012, 78, 7398–7406. [Google Scholar] [CrossRef] [PubMed]
  67. Losey, N.A.; Stevenson, B.S.; Busse, H.-J.; Damsté, J.S.S.; Rijpstra, W.I.C.; Rudd, S.; Lawson, P.A. Thermoanaerobaculum aquaticum gen. nov., sp. nov., the first cultivated member of Acidobacteria subdivision 23, isolated from a hot spring. Int. J. Syst. Evol. Microbiol. 2013, 63, 4149–4157. [Google Scholar] [CrossRef]
  68. Parks, D.H.; Rinke, C.; Chuvochina, M.; Chaumeil, P.-A.; Woodcroft, B.J.; Evans, P.N.; Hugenholtz, P.; Tyson, G.W. Recovery of nearly 8,000 metagenome-assembled genomes substantially expands the tree of life. Nat. Microbiol. 2017, 2, 1533–1542. [Google Scholar] [CrossRef]
  69. Carini, P. A “cultural” renaissance: Genomics breathes new life into an old craft. Msystems 2019, 4, e00092-19. [Google Scholar] [CrossRef]
  70. Choi, J.; Yang, F.; Stepanauskas, R.; Cardenas, E.; Garoutte, A.; Williams, R.; Flater, J.; Tiedje, J.M.; Hofmockel, K.S.; Gelder, B.; et al. Strategies to improve reference databases for soil microbiomes. ISME J. 2016, 11, 829–834. [Google Scholar] [CrossRef]
  71. Ji, M.; Greening, C.; Vanwonterghem, I.; Carere, C.R.; Bay, S.K.; Steen, J.A.; Montgomery, K.; Lines, T.; Beardall, J.; Van Dorst, J.; et al. Atmospheric trace gases support primary production in Antarctic desert surface soil. Nature 2017, 552, 400–403. [Google Scholar] [CrossRef]
  72. Brewer, T.E.; Aronson, E.L.; Arogyaswamy, K.; Billings, S.A.; Botthoff, J.K.; Campbell, A.N.; Dove, N.C.; Fairbanks, D.; Rachel, E.G.; Hart, S.C.; et al. Ecological and genomic attributes of novel bacterial taxa that thrive in subsurface soil horizons. mbio 2019, 10, e01318-19. [Google Scholar] [CrossRef]
  73. Anantharaman, K.; Brown, C.T.; Burstein, D.; Castelle, C.J.; Probst, A.J.; Thomas, B.C.; Williams, K.H.; Banfield, J.F. Analysis of five complete genome sequences for members of the class Peribacteria in the recently recognized Peregrinibacteria bacterial phylum. PeerJ 2016, 4, e1607. [Google Scholar] [CrossRef]
  74. Hara, S.; Desyatkin, R.; Hashidoko, Y. Investigation of the mechanisms underlying the high acetylene-reducing activity exhibited by the soil bacterial community from BC2 horizon in the permafrost zone of the East Siberian larch forest bed. J. Appl. Microbiol. 2014, 116, 865–876. [Google Scholar] [CrossRef]
  75. VanInsberghe, D.; Maas, K.R.; Cardenas, E.; Strachan, C.R.; Hallam, S.J.; Mohn, W.W. Non-symbiotic Bradyrhizobium ecotypes dominate North American forest soils. ISME J. 2015, 9, 2435–2441. [Google Scholar] [CrossRef]
  76. Jones, F.P.; Clark, I.M.; King, R.; Shaw, L.J.; Woodward, M.J.; Hirsch, P.R. Novel european free-living, non-diazotrophic Bradyrhizobium isolates from contrasting soils that lack nodulation and nitrogen fixation genes—A genome comparison. Sci. Rep. 2016, 6, 25858. [Google Scholar] [CrossRef]
  77. Ning, J.; Ai, S.; Cui, L. Dicyandiamide has more inhibitory activities on nitrification than thiosulfate. PLoS ONE 2018, 13, e0200598. [Google Scholar] [CrossRef]
  78. Yang, W.; Wang, Y.; Tago, K.; Tokuda, S.; Hayatsu, M. Comparison of the Effects of Phenylhydrazine Hydrochloride and Dicyandiamide on Ammonia-Oxidizing Bacteria and Archaea in Andosols. Front. Microbiol. 2017, 8, 2226. [Google Scholar] [CrossRef]
  79. Di, H.J.; Cameron, K.C.; Podolyan, A.; Robinson, A. Effect of soil moisture status and a nitrification inhibitor, dicyandiamide, on ammonia oxidizer and denitrifier growth and nitrous oxide emissions in a grassland soil. Soil Biol. Biochem. 2014, 73, 59–68. [Google Scholar] [CrossRef]
  80. Orellana, L.H.; Chee-Sanford, J.C.; Sanford, R.; Löffler, F.E.; Konstantinidis, K.T. Year-Round Shotgun Metagenomes Reveal Stable Microbial Communities in Agricultural Soils and Novel Ammonia Oxidizers Responding to Fertilization. Appl. Environ. Microbiol. 2018, 84, e01646-17. [Google Scholar] [CrossRef]
  81. Cantarella, H.; Otto, R.; Soares, J.R.; de Brito Silva, A.G. Agronomic efficiency of NBPT as a urease inhibitor: A review. J. Adv. Res. 2018, 13, 19–27. [Google Scholar] [CrossRef]
  82. Zhang, L.; Chen, W.; Burger, M.; Yang, L.; Gong, P.; Wu, Z. Changes in Soil Carbon and Enzyme Activity As a Result of Different Long-Term Fertilization Regimes in a Greenhouse Field. PLoS ONE 2015, 10, e0118371. [Google Scholar] [CrossRef]
Figure 1. Alpha and beta diversity metrics for mOTUs (metagenomic OTUs) analysis. (A) mOTU alpha diversity statistics observed, ACE, Shannon diversity, and Simpson evenness completed in phyloseq R without rarefaction. (BD) mOTU beta diversity ordinations using MDS/PcoA in phyloseq R without rarefaction using unweighted UniFrac (B), weighted UniFrac (C), and Bray–Curtis distance (D). B1–B4 is the sampling block (see Figure S1).
Agronomy 13 01294 g001
Figure 2. mOTU taxonomic affiliation relative abundances. (A) Phyla level mOTU taxonomic relative abundance using phyloseq R without rarefaction. (B) Class level mOTU taxonomic relative abundance using phyloseq R without rarefaction. Samples are labeled P1–P4 for post-fertilization, whereas pre-fertilization are labeled I1–I4.
Agronomy 13 01294 g002
Figure 3. KEGG KO DESeq2 paired analysis for functional gene annotation. (A) DESeq2 MDS/PcoA ordination of the KO abundances paired by sample block (B1–B4) and post-fertilization. (B) Divergent barplot of the KO DESeq2 log2 fold changes post-fertilization, all with p-value < 0.05. Enriched (+ value) means more representation post-fertilization (purple), whereas depleted (− value) less representation post-fertilization (red).
Agronomy 13 01294 g003
Figure 4. Nitrogen cycling functional genes (Prokka-COG) DESeq2 paired analysis for functional gene annotation. (A) DESeq2 MDS/PcoA ordination of the nitrogen functional abundances paired by sample block (B1–B4) and tested for post-fertilization. (B) Dotplot of square root (sqrt normalized) relative abundances of nitrogen cycling functional genes. Samples are labeled P1–P4 for post-fertilization, whereas pre-fertilization are labeled I1–I4.
Agronomy 13 01294 g004
Figure 5. DESeq2 paired analysis of CAZy for carbohydrate active genes annotation. (A) DESeq2 MDS/PcoA ordination of the CAZy functional abundance paired by sample block (B1–B4) and post-fertilization. (B) Divergent barplot of the CAZy DESeq2 log2 fold changes post-fertilization, all with p-value < 0.05. Enriched (+ value) means more representation post-fertilization (purple), whereas depleted (− value) means less representation post-fertilization (orange).
Agronomy 13 01294 g005
Figure 6. Metagenomic assembled genome (MAG) statistics and sample relative abundances. (A) Barplot of the number of MAGs per phyla using the GTDB taxonomy. (B) Quantification of relative abundances of the MAGs using Metawraps tool (quant_bin), with values expressed in the heatmap as genome copies per million reads. The individual MAG taxonomy present in B is found in Table 3.
Agronomy 13 01294 g006
Table 1. Metagenome assembly statistics with pre- and post-fertilization processing read counts. # = number.
Sample_IDSample_Dis#Reads#Raw BasesTrim-Decon Reads#ContigsSizeN50
P1Post-fertilization6.78 × 1081.02 × 10114.60 × 1084.36 × 1062.62 × 109607
P2Post-fertilization7.49 × 1081.12 × 10114.98 × 1085.54 × 1093.88 × 109743
P3Post-fertilization6.64 × 1089.95 × 10104.47 × 1084.95 × 1093.31 × 109701
P4Post-fertilization5.48 × 1088.22 × 10103.41 × 1083.84 × 1092.66 × 109736
I1Pre-fertilization6.77 × 1081.02 × 10114.48 × 1084.83 × 1093.42 × 109754
I2Pre-fertilization6.45 × 1089.67 × 10104.43 × 1084.89 × 1093.35 × 109722
I3Pre-fertilization7.17 × 1081.08 × 10114.59 × 1084.77 × 1093.54 × 109825
I4Pre-fertilization6.93 × 1081.04 × 10114.22 × 1084.10 × 1093.01 × 109810
Average 5.37 × 1098.06 × 10113.52 × 1094.66 × 1093.22 × 109737
sample_ID#contigs_1Ksize_1KN50_1K#contigs_5Ksize_5kN50_5kGC%
P1387,2079.98 × 107174198647.01 × 10810,16962.30
P2721,6332.93 × 108203431,1951.45 × 109940262.76
P3595,0791.89 × 108191420,4041.14 × 109905862.22
P4504,7571.69 × 108195118,1739.84 × 108913962.55
I1649,3922.57 × 108202728,0561.30 × 109912361.98
I2618,3572.14 × 108196923,6481.21 × 109889160.92
I3726,1073.05 × 108214032,6601.50 × 109901361.35
I4613,4472.46 × 108208126,1721.25 × 109924361.37
Average601,9972.21 × 108198223,7711.19 × 109925461.93
Table 2. CAZy DESeq2 paired analysis statistical table. This includes the taxonomic accession from CAZy database, the genbank taxonomy with CAZy family (funtaxa), the genbank phyla and class taxonomy, the location of isolation from GenBank, the DESeq2 log2 fold change (which is paired by sample location block (B1–B4) then tested for post-fertilization), and p-value from DESeq2. Enriched (+ value) means more representation post-fertilization, whereas depleted (− value) means less representation post-fertilization.
AccessionFuntaxaPhylaClassHabitatlog2 Fold Changep-Value
ANY66681.1Paenibacillus sp. BIHB4019 (CBM54)FirmicutesBacilliRhizosphere−3.380.02
AKB38096.1Methanosarcina siciliae C2J (GT4)EuryarchaeotaMethanomicrobiaUnknown−3.030.04
ALJ82902.1Irpex lacteus (AA3_1|AA8)BasidiomycotaAgaricomycetesWood−3.020.04
AUD02463.1Spirosoma pollinicola (CBM6)BacteroidetesCytophagiaPollen−2.720.02
ANS78621.1Serinicoccus sp. JLT9 (CBM48|GH13_9)ActinobacteriaActinobacteriaThermal −2.220.05
AFY81829.1Oscillatoria acuminata PCC6304 (GH65)CyanobacteriaCyanophyceaeSoil−2.110.02
AAR38497.1Uncultured marine bacterium 583 (GT41)UnculturedUnculturedOcean−1.970.02
BAZ44095.1Chondrocystis sp. NIES-4102 (GT2)CyanobacteriaCyanophyceaeUnknown−1.820.04
BAL56682.1Uncultured Gammaproteobacteria (PL0)ProteobacteriaGammaproteobacteriaMicrobial mat−1.40.05
ARX88346.1Streptomyces alboflavus (GT2|CE4)ActinobacteriaActinomycetesRhizosphere−1.230.02
ATF41409.1Weissella paramesenteroides (CBM50)FirmicutesBacilliUnknown−1.070.02
ALG08540.1Kibdelosporangium phytohabitans (GH16)ActinobacteriaActinobacteriaPhyllosphere−0.840.04
ATU64527.1Rhizobacter gummiphilus (CBM41)ProteobacteriaGammaproteobacteriaSoil−0.520.05
AMG83817.1Microbacterium sp. PAMC 28,756 (CE14)ActinobacteriaActinobacteriaLichen0.260.04
ACL17090.1Methanosphaerula palustris E1–9c (CBM6)EuryarchaeotaMethanomicrobiaPeatland Soil0.690.03
AKP50194.1Cyclobacterium amurskyense (GH33)BacteroidetesFlavobacteriaOcean0.880.05
AMT93207.1Brevibacterium linens (GT51)ActinobacteriaActinomycetesSediment1.950.02
ACO33523.1Acidobacterium capsulatum (GT2)AcidobacteriaAcidobacteriaSoil2.160.02
ACN58963.1Uncultured bacterium BLR10 (GH9)UnculturedUnculturedSoil2.370.05
AGA24658.1Singulisphaera acidiphila DSM18658 (GT28)PlanctomycetesPlanctomycetaciaPeat bog wetland2.410.04
BBA71022.1Geobacter sulfurreducens (GT41)ProteobacteriaDeltaproteobacteriaSediment2.430.04
Table 3. Metagenomic assembled genome (MAG) assembly statistics with GTDB taxonomy. This includes the predicted taxonomy by the GTDB-Tk tool using the GTDB database, assembly statistics, completeness, contamination, and the metagenome-assembled genome (MIMAG) quality ranking. MAGs are labeled by rhizosphere soil type for pre-fertilization (I1–I14) and post-fertilization (P1–P15).
GTDB-Tk TaxonomySizeContigsN50GC CompletenessContaminationMIMAG Quality
magI1Actinobacteriota; Thermoleophilia; 20CM-4-69-9; 20CM-4-69-93,377,67716924,25069.9%811.293Medium
magI2Acidobacteriota; Thermoanaerobaculia5,321,06813166,77366.0%95.962.849Medium
magI3Nitrospirota; Nitrospiria; Nitrospirales; Nitrospiraceae; Nitrospira_C3,293,15730411,73458.7%87.877.929Medium
magI4Eisenbacteria; RBG-16-71-462,561,62521113,76867.9%84.841.098Medium
magI5Gemmatimonadota; Gemmatimonadetes; Gemmatimonadales; GWC2-71-93,461,98862148,82967.7%94.182.197Medium
magI6Acidobacteriota; Acidobacteriae; Acidobacteriales; Koribacteraceae4,052,64857120,17256.0%91.050.854Medium
magI7Acidobacteriota; Thermoanaerobaculia7,820,90352718,14267.6%80.653.703Medium
magI8Nitrospirota; Nitrospiria; Nitrospirales; Nitrospiraceae; GCA-27373454,109,39434112,46356.4%84.664.545Medium
magI9Myxococcota; Polyangia; Kofleriales; Kofleriaceae11,007,61123177,77969.0%81.931.474Medium
magI10Dormibacterota; Dormibacteria3,788,21318127,45471.7%881.851Medium
magI11Nitrospirota; Nitrospiria; Nitrospirales; Nitrospiraceae; Nitrospira_C4,541,99324324,85555.3%96.363.989Medium
magI12Gemmatimonadota; Gemmatimonadetes; Gemmatimonadales; GWC2-71-9; 40CM-2-70-72,649,94719316,82467.7%821.098Medium
magI13Dormibacterota; Dormibacteria4,029,2208569,21570.7%98.610.925Medium
magI14Nitrospirota; Nitrospiria; Nitrospirales; Nitrospiraceae; Nitrospira_C3,065,30317026,09456.7%82.016.363Medium
magP1Verrucomicrobiota; Verrucomicrobiae; Pedosphaerales; Pedosphaeraceae8,909,74826155,94657.6%98.648.108Medium
magP2Proteobacteria; Alphaproteobacteria; Sphingomonadales; Sphingomonadaceae2,721,54011937,36262.5%90.753.921Medium
magP3Acidobacteriota; Acidobacteriae; Acidobacteriales; Koribacteraceae4,391,22911763,67255.8%96.586.41Medium
magP4Acidobacteriota; Acidobacteriae; Acidobacteriales5,394,37225926,77354.9%92.021.994Medium
magP5Actinobacteriota; Acidimicrobiia; IMCC262564,337,49335514,27769.3%83.520.925Medium
magP6Proteobacteria; Gammaproteobacteria; Enterobacterales; Enterobacteriaceae; Lelliottia5,354,4509388,70355.2%99.060.715Medium
magP7Actinobacteriota; Thermoleophilia; Solirubrobacterales; 70-9; 70-92,620,6119238,94167.4%95.130.948Medium
magP8Proteobacteria; Gammaproteobacteria; Betaproteobacteriales; UKL13-23,375,34436414,63665.7%84.824.31Medium
magP9UBA10199; UBA10199; UBA101993,108,33322217,36957.6%83.871.29Medium
magP10Proteobacteria; Gammaproteobacteria; Betaproteobacteriales; Burkholderiaceae; Janthinobacterium4,309,61233715,50266.0%87.652.613Medium
magP11Chloroflexota; Ellin6529; CSP1-4; CSP1-4; UBA51892,799,98710520,93570.5%95.831.157Medium
magP12Acidobacteriota; Thermoanaerobaculia5,401,73714756,39663.2%97.535.47Medium
magP13Acidobacteriota; Thermoanaerobaculia5,296,37238193,92066.0%99.143.703Medium
magP14Proteobacteria; Alphaproteobacteria; Sphingomonadales; Sphingomonadaceae; Sphingomonas_A2,439,97210932,05862.8%96.52.507Medium
magP15Acidobacteriota; Acidobacteriae; Acidobacteriales; Koribacteraceae3,923,51823522,36257.5%92.463.019Medium
Disclaimer/Publisher’s Note: The statements, opinions and data contained in all publications are solely those of the individual author(s) and contributor(s) and not of MDPI and/or the editor(s). MDPI and/or the editor(s) disclaim responsibility for any injury to people or property resulting from any ideas, methods, instructions or products referred to in the content.

