Abstract
Rice yellow mottle virus (RYMV), transmitted by chrysomelids, is one of the major viral pathogens that has devastated rice production in Sub-Saharan Africa. RYMV is a member of the genus Sobemoviruses in the family Solemoviridae and harbors a positive-sense single-stranded RNA (+ssRNA). Here, we used 50 RYMV strains, applying the codon usage bias (CUB). Both base content and relative synonymous codon usage (RSCU) analysis revealed that GC-ended codons were more frequently used in the genome of RYMV. Further low codon usage bias was observed from the effective number of codons (ENC) value. The neutrality plot analysis suggested the dominant factor of natural selection was involved in the structuring of CUB in RYMV. Based on RSCU values, the RYMV and its host relationship indicate that the RYMV develops codon usage patterns similar to its host. Generally, both natural selection and mutational pressure impact the codon usage pattern of the protein-coding genes in RYMV. This study is important because it characterized the codon usage pattern in the RYMV genomes and provided the necessary data for a basic evolutionary study on them. Additionally, we recommend that experiments such as whole genome sequencing (WGS) or dual RNA sequencing (DRS) should be considered in order to correlate these in-silico findings with viral diseases in the future.
1. Introduction
The rice yellow mottle virus (RYMV) is a member of the Solemoviridae family, which belongs to the genus Sobemovirus. It has four ORFs for protein-coding and a positive-sense single-stranded RNA (ssRNA) molecule [1]. The ORF1, which encodes the small protein P1, is implicated in both the suppression of gene silencing and viral mobility [2]. The coat protein is fixed by ORF3 while ORFs 2a and 2b translate the central polyproteins P2a and P2ab [3]. The genome also has three non-coding regions at the 5′ and 3′ ends and between the first two ORFs [4]. The virus particles are highly infectious and mechanically transmissible [3,5].
Rice yellow mottle virus (RYMV) causes a vector-borne viral infection (Rice yellow mottle disease (RYMD)) that has a significant impact on rice production, particularly in Africa [6]. The major insect vectors are chrysomelids, which play an essential role in primary infection, while secondary infection is due mainly to plant-to-plant contact. The chrysomelids are also accountable for increasing the same virus in grass species such as Panicum repens L., Echinochloa colona L. Link, and Ischaemum rugosum Salisb [7,8]. Despite the fact that RYMV is not seed transmitted [9,10]. The symptoms of RYMD include mottling, yellow to orange discoloration of the affected leaves, stunted growth, sterile panicles, and likely crop loss (depending on the cultivar). Usually, these signs appear at different developmental stages, including leaf initiation, early heading, tillering, and panicle initiation [6,11].
RYMD is a disease that could be lethal with an extensive past in rice production. RYMV infection was first identified in 1970 in the western part of Kenya, Nyanza province [5], and later spread to West, Central, and East Africa. From 1976 until late 1980, several incidents of RYMV infection were detected in Sierra Leone, Nigeria, Tanzania, and Liberia [12,13], and infections spread to several locations in Côte d’Ivoire (Ivory Coast) [14], Koba in Guinea and Ghana [15], Mali, and Burkina Faso, along with in Malawi [16] and Rwanda, producing a global economic emergency [6]. The severity of the infection has been increasing since 1989, when rice tilling was uncontrolled in Lake Alaotra and at Marovoay [6,17]. At the beginning of the 21st century, the virus infection had been described in Chad and Cameroon [18]. Recently, the virus’s occurrence has been restricted to Africa. The prevalence and detrimental effects of the disease change depending on rice variety, location, and vegetation zones [19].
Besides the transmission through insects, other ways of RYMV transmission include plant-to-plant, contaminated soil and water, and infected rice plants. The RYMV is also transmitted through donkeys, grass rats, and cows in watered rice fields [8]. Restrictions on the spread of the RYMV include limited vector movement, a narrow host variety, and a lack of seed spread. Highly and moderately challenging varieties have been discovered. Nonetheless, the infection is currently not adequately operated, and its prevalence in Africa is rising significantly [20].
To explore the molecular and evolutionary research of the virus, we may need to implement the phenomenon called codon usage bias (CUB) [21]. Apart from tryptophan and methionine, distinct synonymous codons encode all the other 18 amino acids (aa). This is codon degeneracy, in which the synonymous codons occurring in the genome are not in an equal number and follow a proper codon usage pattern [22,23]. There are several factors which impact the configuration of CUB. Natural selection and mutational pressure, on the other hand, were two major factors that shaped CUB [24,25]. Despite notable advancements made in scientific research, the CUB’s evolutionary progression is still an arguable subject [22,26,27].
Several previous studies on codon usage using viruses have revealed that mutational pressure is the most important factor influencing the shape of codon usage associated with selection pressure [24,26]. However, as our understanding of codon usage increases, it becomes clear that, while mutational pressure is a major force, it is not the only one when various types of DNA and RNA viruses are studied [27]. Comparison of the genomes of prokaryotes and eukaryotes with viruses and highlights such as dependance on the host environment for major procedures comprising the synthesis of protein, replication, and spreading, based on codon usage, the interaction between hosts and viruses is supposed to influence general viral suitability, existence, or evasion of host cell retorts and evolution [28,29,30]. So, study on viruses related to codon usage not only supports information on evolution at the molecular level but also enhances knowledge of viral gene expression regulation and helps in designing a vaccine, wherever the effective appearance of viral proteins might be required to cause resistance.
In this study, we analyzed 50 RYMV strains associated with African and European families. Presently, the virus infection poses a serious threat to a rice health concern. The goal of this study was to determine the effects of viral relationships with their hosts on viral capability, as well as to investigate factors that influence the patterns of codon usage in the RYMV genome.
2. Materials and Methods
2.1. Sequences
A total of 50 coding sequences (CDS) of the RYMV were retrieved from the National Centre for Biotechnology Information (NCBI). The number of nucleotides in the coding sequence was an exact multiple of three [31]. Complete information about the overall 50 RYMV isolates associated with African and European families is listed in Table S1. As the CDS for the Asian isolates is not available in GeneBank, they were excluded from the study. According to recent studies, the rice yellow mottle virus (RYMV) is only found in Africa [32,33].
2.2. Analysis of Nucleotide Composition
Here we employed CodonW software to determine the total base composition (G, C, A, and U%) and the contents of the nucleotide at the 3rd codon location (C3, U3, G3, and A3%) for all synonymous codons in this virus. The GC% contents of all three codon locations (GC1, GC2, and GC3%) were measured. Additionally, the average frequency of G/C at GC12 locations and the overall GC/AU compositions were also determined. Further, only 59 synonymous codons encoding 18 amino acids were considered for the present study, not including the 1st ATG codon, the codon (TGG) encoding tryptophan, and the three ended codons (TAG, TAA, and TGA), respectively [34].
2.3. Analysis of Relative Synonymous Codon Usage (RSCU)
RSCU values compare the observed codon occurrence to its random occurrence, indicating that the virus uses all the identical codons equally. The CDS contains both frequently occurring codons with RSCU values greater than one and rarely occurring codons with RSCU values lower than one [35]. Higher CUB or more frequently used codons were determined through high RSCU. In the coding sequence, the overrepresented codon represents the codon RSCU value greater than 1.6 and the underrepresented codon represents the codon RSCU value less than 0.6 in the coding sequence [36].
The RSCU value was determined for each codon by following the formula [37]:
Here, ni is the number of codons for the ith amino acid and Xij denotes the frequency of the jth codon for the ith amino acid.
2.4. Analysis of Codon Adaptation Index (CAI)
The CAI is applied to calculate the gene expression level depending on its codon-based sequence. The value of the CAI value varies from zero to one; a value near one indicates higher levels of codon usage bias [38]. The CAI was determined through an online tool used for CAI calculation, “CAIcal” [39], where the O. sativa genome was used as a reference source. Furthermore, the e-CAI (expected CAI) was analysed using the online tool “CAIcal”. The values of RSCU for the O. sativa genome were retrieved from the database of codon usage.
2.5. Indices of Codon Usage
To determine the proper measurement of codon bias, ENC (effective number of codons) was performed, which measures the total usage of the codon in a certain gene [27,40]. It clarifies the ratio of codon variation in a gene from the total even usage of codons which are synonymous. The ENC value varies from 20 (where one amino acid encodes one codon only) to 61 (where each amino acid is used randomly for all codons). ENC value <35 implies significant CUB [40,41]. A plot between ENC-GC3s is drawn out to determine the impact of GC3s composition on codon usage [40]. For each GC3, the expected ENC values were considered by using the following formula:
wherever ‘s’ is the GC3s content of each codon.
2.6. Correspondence Analysis (COA)
COA is a multidimensional critical method to resolve the important developments in the codon usage patterns of CDS through codon RSCU values [36,42,43]. To create the COA plot, RSCU values of 59 codons were considered. To study the tendencies in the deviation of the use of codon, relative inertia was used to hold a specific position in the graph.
2.7. Analysis of Neutrality Plot
GC12 and GC3 were studied for attaining a neutrality plot to identify the role of selection-mutation symmetry in the usage of codon discrepancy. In the graph, each point signifies a discrete gene. The line of regression slop between GC3 and GC12 indicates mutation pressure is the major factor in affecting CUB, i.e., for values coming close to 1, although if the value comes close to 0, it indicates selection pressure has been the main factor in defining CUB [44,45].
2.8. Correlation Analysis
To illustrate the relations between nucleotide content and codon usage patterns, RYMV correlation analysis was performed. These analyses were conducted by using Spearman’s rank correlation method [46]. All processes were executed using the R corrplot package. For codon usage index analysis, CodonW (1.4.4) software (http://codonw.sourceforge.net/) was applied [27,47].
3. Results
3.1. Base Compositional Analysis in RYMV Coding Sequences
CUB can be considerably predisposed by the general base composition of genomes. The nucleotide contents of 50 RYMV genes were studied, which are presented in Table 1. Here, our outcomes disclosed that the mean G (28.73%) and C (26.03%) were maximum, tailed by A (21.86%) and U (23.39%) across all genomes. The mean G3 (29.22%) and C3 (27.22%) occurred at a maximum level higher than the A3 (20.27%) and U3 (23.29%) (Figure 1, Table 1). The total GC and AU compositions were found to be 54.75% and 45.27%, respectively, suggesting RYMV strains have strong GC.

Table 1.
A nucleotide compositional analysis of RYMV coding sequences (%).
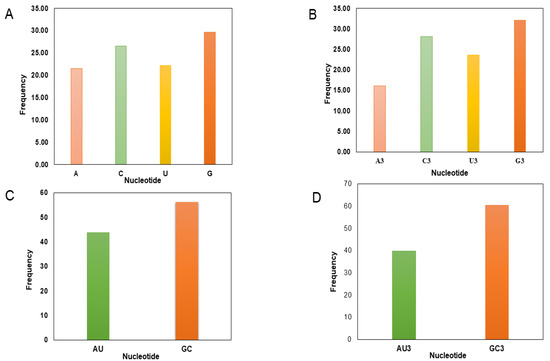
Figure 1.
A nucleotide composition analysis: (A) The average A, U, G, and C nucleotide composition of the entire viral genome. (B) The average values of the nucleotide composition at the third codon position, indicating G/C richness followed A/U richness. (C) The mean frequency for GC and AU composition (D) The mean frequency of AU and GC at the codon’s third position, indicating that GC3 is more common than AU3.
Nucleotide content analysis at the 1st, 2nd, and 3rd synonymous codon positions disclosed that the values of GC1 ranged from 47.45 to 60.28% (mean: 54.88%; SD: 2.76), while GC2 ranged from 46.50 to 61.70% (mean: 52.97%; SD: 3.63). Whereas the GC3 values ranged from 51.52 to 61.70% (mean: 56.44%; SD: 2.97), in contrast, the values of AU3 ranged from 38.40 to 51.72% (mean: 43.56%; SD: 2.97). These data further supported the notion that an extensive area of RYMV is self-possessed of C/G content (Table 1).
3.2. Defining Codon Usage Patterns
An RSCU analysis was used to regulate the identical pattern of codon usage in the RYMV CDS. Fifteen of the eighteen most abundantly used codons in RYMVs [UUC (Phe), CUC (Leu), AUC (Ile), GUG (Val), UCC (Ser), ACG (Thr), CAC (His), UAC (Tyr), CAG (Gln), AAC (Asn), AAG (Lys), GAC (Asp), GAG (Glu), CGG (Arg), and GGG (Gly)] ended with C or G (C: 8; G: 7). Despite this, the remaining three codons (CCA, GCU and UGU) had ended with A or U. Thus, the C or G-end codon bases are more shared in the genome of RYMV. Furthermore, from the RSCU analysis, we found that the over-represented (>1.6) codons are rarely seen in the genome of RYMV. Nearly all the ideal and non-ideal codons are in the range of 0.6 to 1.6. We observed that most codons ending in A were under-represented (<0.6), while codons ended in C were over-represented (>1.6) (Figure 2, Table 2), which was similar in O. sativa, where the C/G ending codons are preferred over the A/U ending codons.
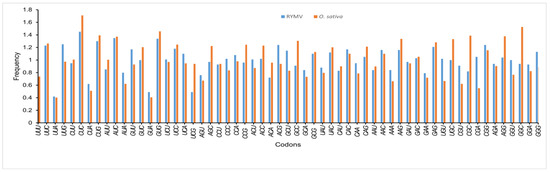
Figure 2.
A comparative analysis of RSCU patterns between Rice yellow mottle virus (RYMV), and its host O. Sativa. X-axis represents Codons. Y-axis represents Frequency.
Table 2.
The relative synonymous codon usage frequency of RYMV and its natural host.
From both the nucleotide content and RSCU analysis, we assumed that the selection of the preferred codons has been generally inclined by compositional restraints, which also determine the existence of mutational pressure. We are unsure that the compositional pressure could not be the single aspect related to RYMV patterns of codon usage, as although the total values of RSCU could disclose the pattern of codon usage for the genomes, it may conceal the codon usage variation amongst distinct genes in a genome [48]. Here, the patterns of codon usage and selection of the preferred codons in RYMV genomes showed complete synergism with those of the host, O. sativa (Figure 2).
3.3. Adaptation of RYMV to the Host Genome
The Codon adaptation index (CAI) analysis was executed to regulate the optimization of codon usage and RYMV adaptation to its host [49]. The values of CAI range from zero to one. For all codons, the CAI values were measured through the reference of O. sativa codon usage. We determined that, concerning O. sativa, the mean CAI value of RYMV coding regions was 0.78 (>0.5), which revealed that RYMV has a good adaptation to its host and a minimal translation pressure (Figure 3).
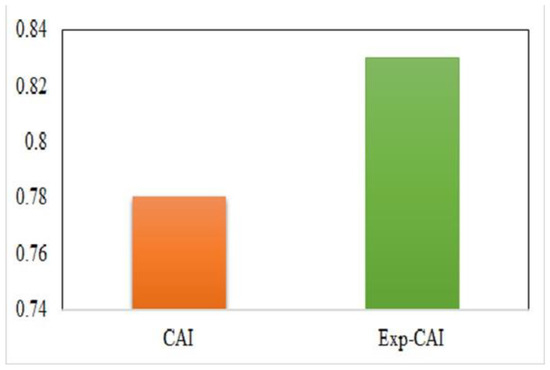
Figure 3.
A codon usage adaptation index of RYMV to its host. In the plot, x-axis represents CAI and Exp-CAI. Y axis represents CAI value.
To check the observed significant statistical differences arises in the values of CAI [40,50], the values of expected CAI (e-CAI) were considered for RYMV CDS with O. Sativa codon usage sets. The result of the e-CAI value was 0.83 (p < 0.05) in relation to O. sativa revealing that the generated sequences keep to a normal distribution (Figure 3).
3.4. Use of Codons Biases in RYMV
To know the strength of CUB within RYMV coding sequences, the genes’ ENC value was assessed and mapped next to the GC content at the 3rd codon position (GC3) (Table 1). To determine the codon usage of the genes, a plot of distribution was employed that deviated from the same usage of indistinguishable codons. The values of ENC were observed to vary from 55.92 to 59.93, indicating a high level of genetic differences in the codon’s usage. Nevertheless, the average value of ENC was 58.55 > 35, implying that the whole CUB was low (Figure 4).
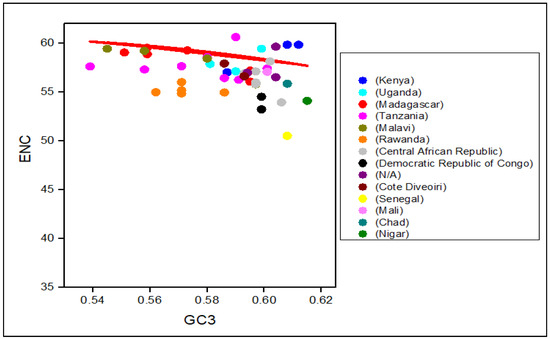
Figure 4.
ENC-GC3 plots of 50 RYMVs strains: The effective number of codons (ENC-values, Y-axis) was plotted against the GC-content at the third synonymous codon positions (GC3-values, X-axis). The ENC values ranged from 30 to 61. Interestingly, all the RYMV isolates were between the 55.92 and 59.93 range and slightly below the 61, suggesting that codon usage bias is caused by selection pressure. The continuous red line represents theoretical ENC values for random codon usage as a function of GC3.
3.5. Discrepancy in the Usage of Codon among RYMVs
Scattered data on the principle axis represents diverse geographical ancestries and their relationships. All the RYMV strains were found in groups using COA (Figure 5). RYMV isolates from Uganda and Madagascar were assembled into one clade, while isolates from Niger, Sierra Leone, Tanzania, and Mali were found in another. The Kenya (first epidemic site of RYMV) and Uganda isolates were assembled into one clade. Though isolates from France were assembled in another clade, they gathered with Togo. Moreover, Nigeria and Kenya separately were dispersed into distinct groups. Interestingly, the same genetic lineage was found in Kenya-Uganda, where both relatives were isolated from the same origin (Figure 5).
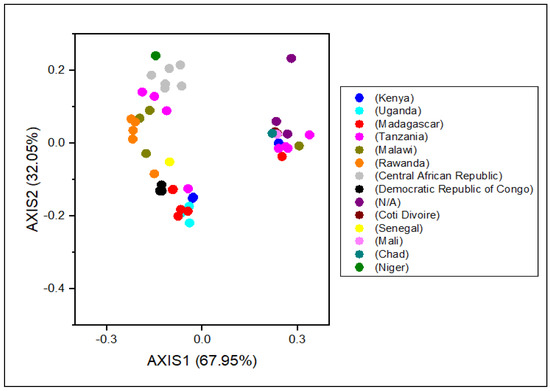
Figure 5.
A correspondence analysis (COA) of the genes in RYMV genomes. Each point represents a gene corresponding to the coordinates of the first and second axes of variation generated from the correspondence analysis.
The impact of evolutionary processes on the RYMV codon usage pattern was assessed using a phylogenetic analysis. All the RYMV strains were clustered into distinct groups, similar to the pattern detected in COA (Figure 5 and Figure 6).
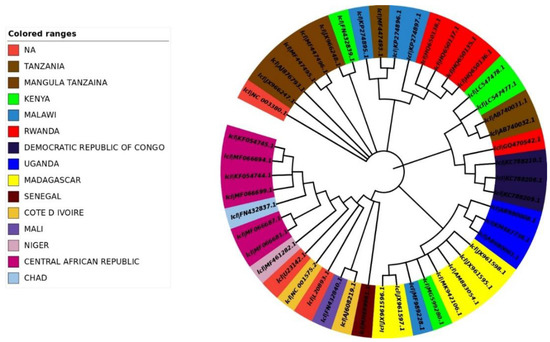
Figure 6.
Phylogenetic trees are based on the polyprotein-coding regions of 50 RYMV strains. The tree was generated by the maximum likelihood (ML) method using Clustal X2. The tree was designed by using the online tool “iTOL”.
3.6. Neutrality Plot Analysis
The plot of neutrality was performed, which implies the bond between GC1/2 and GC3 composition to determine the position of mutation and selection pressure that impact the codon usage bias form. To observe the association, we paradigm the plot of neutrality between GC3 and GC1/2 for the RYMV genome. Here the plot shows that no significant association was found between GC3 and GC1/2 contents for the reason that the regression value and link were p > 0.05 and r = −0.06 (Figure 7). Finally, we suggested that natural selection and mutational pressure both impact the codon usage shaping of RYMV.
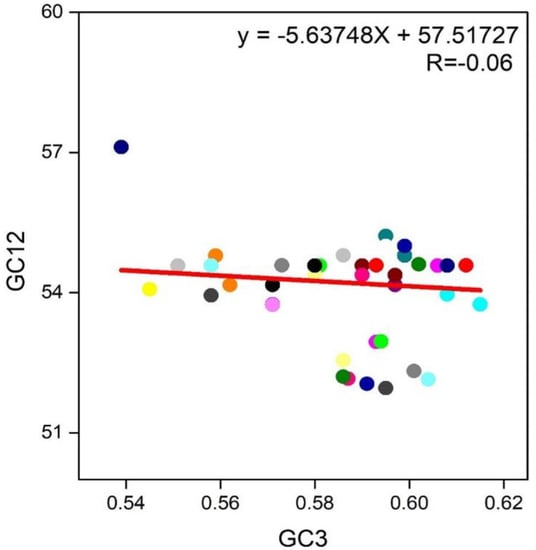
Figure 7.
A Neutrality Plot between (GC3 vs. GC1,2) for the entire coding sequence of RYMV. GC1,2 represent GC at 1st and 2nd of the codon. While GC3 represents GC at 3rd codon position. And the Red solid represents the Regression analysis of GC1,2 against GC3.
3.7. Codon Usage Pattern Dominating Effects on RYMV
Here we take two factors into consideration: natural selection and mutational pressure, in order to determine codon usage bias in RYMV. Accordingly, we performed a correlation analysis between ENC and CAI values. The CAI values of the RYMV sequences seemed to have a negative relationship between the RYMV sequences’ CAI values in relation to O. sativa with the ENC values that expected the effect of the RYMV codon usage pattern. Such impact was also observed among GC3s (−0.79), GC content (0.68), hydrophobicity (GRAVY) and aromaticity (AROMO) with ENC. This outcome imitates the impact of mutational pressure and natural selection on the RYMV codon usage pattern.
GRAVY and AROMO are also associated with the pattern of codon usage in different viruses [51]. It is clear from the assessment that the value of AROMO has a substantial negative relative to ENC. Likewise, GRAVY values had a significant negative association with ENC (r = −0.25, p < 0.01). The findings suggest that the level of protein AROMO and GRAVY are concerned with the discrepancy of codon usage in RYMV, implying the significance of selection pressure on getting the pattern of codon usage.
The study of correlation was also determined amidst the compositions of nucleotides and the first two-principles axis in RYMV genomes. Here the study revealed various significant relationships among the 2nd axes and the nucleotide compositions. The 1st axis exhibited a statistically significant association with GC3, T3, and G3, whereas the 2nd axis had a significant association with C, U, A, A3, G, G3 (r = 0.17, p < 0.001), T3 (r = 0.25, p < 0.001), AU (r = 0.53, p < 0.001), GC2 (r = 0.97, p < 0.001), AU3 (r = 0.7, p < 0.001), and GC (r = 0.59, p < 0.001) (Figure 8). These consequences suggest that the contents of a nucleotide impact the codon usage and synonymous pattern of RYMVs.
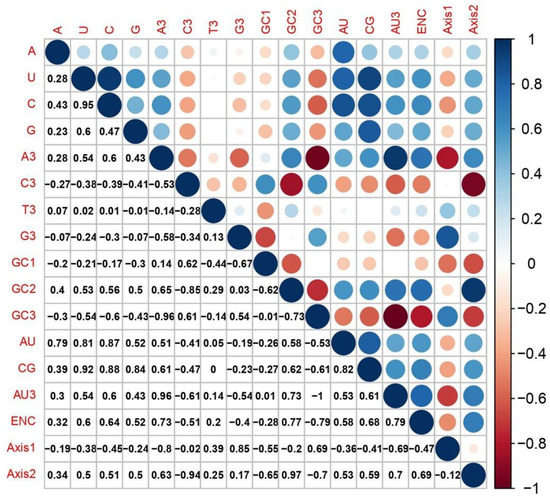
Figure 8.
Correlation analysis among different nucleotides contents of RYMVs, and the first two principal axes of COA. The dark blue means positive correlation, and the dark red means negative correlation; the value larger means more significant correlation.
4. Discussion
In this study, we examined the use of synonymous codons in coding sequences from 50 RYMV genomes to comprehend how the virus evolved molecularly under the influence of host, viral, and environmental factors. It has been demonstrated in the past that the overall genomic composition can have a significant impact on codon usage bias or the preference for one type of codon over another [52]. An analysis of the nucleotide composition of RYMV genomes revealed that G and C nucleotides constitute the majority of the total nucleotide composition. This result was inconsistent with previous studies on the genomes of dicot species, i.e., cotton [53], tomato [54], Arabidopsis thaliana [55], peas, tobacco [56], and rice tungro bacilliform virus (RTBV) [57], wherein A and U frequencies were higher than G and C frequencies [58]. However, this finding supports the previous reports [59,60,61,62]. Although the biotic causes for increased G and decreased A are unresolved, it is essential to verify the causes of these drifts in virus-related RNA genomes [57]. The RSCU study also revealed that the genome of RYMV demonstrates higher codon usage bias toward G and C-ended codons (Table 2), agreeing with the previous reports [63,64]. Therefore, once it is proved that there is codon bias toward G and C-ended codons in RYMV genomes, we next determined the patterns of codon usage and selection of the preferred codons in RYMV genomes showed complete synergism to those of the host, O. sativa (Figure 2), which is inconsistent with our recent studies on RTBV, which indicated complete antagonism with the host [57,65].
CAI is considered a measure of gene expression and is useful for determining how well viral genes have adapted to their hosts. It has been suggested that genes that are highly expressed show a larger preference for specific codons than genes that are less expressed. The CAI calculates the difference between a protein-coding sequence and a reference set of genes [63]. If the CAI score is high, then the influence of natural selection is dominant, and the codon usage bias is quite high [66]. Here, the high CAI value tendency of O. sativa suggests that selection pressure from O. sativa can impact the RYMV codon usage, and that the codon usage evolution in RYMV permits it to use the translation machinery of O. sativa more capably [29,67]. The outcomes of this study regarding the preferences of codon usage are comparable with the previous research that has indicated disparate Pseudomonas fuscovaginae, Xanthomonas oryzae, against O. sativa [68]. Here, our result was consistent with the published work [69]. The mean ENC value in RYMV coding sequences was found to be 58.55, indicating slightly biased, comparatively stable, and conserved genomic composition among various RYMV genomes. Studies have demonstrated an inverse relationship between ENC and gene expression, i.e., a lower ENC value indicates a higher codon use preference and higher gene expression [27]. Overall, it was observed that the gene expression and codon usage bias among various RYMV genomes were comparable and slightly biased. Our results were aided by the low codon usage bias that has been seen in prior studies relating to TEs genes, which are less biased (ENC: 57) than rice nuclear genes (ENC: 41) [70]. To estimate the variations in the usage of codons of AP2 genes in various species of plant, the CDS value of ENC was revealed with a mean value of 59.37, which suggested low CUB in various species of plant genome [71]. Previous studies focused on Herbaceous Peony and Z. mays, the value of ENC was also observed to be higher than 35. The analysis disclosed that low codon bias was seen along with the position of natural selection on the genes [46,72]. As a result, low codon bias within RYMV coding sequences has allowed RYMV presence in the host, despite the fact that the host’s codon usage preferences differ from those of RYMV. The low codon bias of RNA viruses may be favorable for effective replication in host cells by minimizing the competition between the virus and host, each of which may have different codon preferences for synthesis machinery. Following that, an ENC plot is commonly used to determine variation in codon usage among genes in different organisms [27,73]. When the RYMVs’ ENC and GC3 values were plotted, it was discovered that all the isolates clustered tightly below the curve, demonstrating the significant influence of mutation pressure on RYMV codon usage patterns as well as the influence of natural selection to some extent. Additionally, it has been previously reported that both natural selection and mutation pressure can affect the overall ENC and that this index may not be reliable for illustrating the respective contributions of selection and mutation to structuring codon usage patterns [73].
CO analysis describes the discrepancy in the usage of codons. The changes occur in the patterns of codon usage revealed through RSCU values. In the plot of CO analysis, axis 1 and 2 are the two main factors of general discrepancy [27,43,74]. Our results propose that the first axis signifies the virus strains, and the second axis signifies the countries where the virus arises. Using CO analysis, the RYMV isolates were found in clustered form (Figure 3). The mobility of RYMV’s natural host, O. sativa, has a significant influence on the grouping of distinct RYMV lineages that are thousands of miles apart inside one cluster, as well as in the clustering of closely related lineages into different clusters. In addition, it seems that geographic diversity and related factors, including the presence of a natural host in the infection zone, climatic features, and host susceptibility, play a major part in the evolution of RYMV and in a synonymous codon usage pattern, where in the future such investigations may assist in discovering the essence of rising RYMV strains. Furthermore, present outcomes also show that more than one widespread genetic lineage was found in every infected country. A phylogenetic study was used to determine how evolutionary processes have affected the codon usage pattern of RYMV, which shows similarity to the pattern observed in COA [62]. This supports the main outcome of evolutionary processes and topographical dispersal on codon usage patterns, which further exposed the signs of recombination and genome re-assortment during single host co-infection, signifying the potential for the upcoming arrival of the novel alternates [34,35,75,76,77].
Natural selection and mutation pressure are two of the main influencing factors that are thought to have a significant impact on codon usage patterns [39]. The majority of the codon usage among some RNA viruses would undoubtedly be explained by a general mutation pressure that affects the entire genome [52]. Previous studies suggested that the base compositions at the 3rd positions of the codon, mutational bias is mostly explained, whilst base compositions at the 1st and 2nd positions, selective pressure were mostly validated [61,62,78]. The results of the ENC and CAI analyses made clear how natural selection and mutation pressure both affected the codon use patterns of the RYMV genes. A neutrality plot analysis was carried out to assess the relative contributions of each component to the evolution of RYMV codon usage patterns, and the results revealed that the influence of mutation pressure predominates over natural selection [29]. Furthermore, using correlation and linear regression analyses between various nucleotide compositional constraints, ENC, and principal axes, we also investigated the impact of mutation pressure on RYMV codon usage. Strong and significant connections were found, which suggests that mutation pressure has a prevailing influence. This was further confirmed by the fact that significant, strong correlations were seen when these indices were plotted using PCA against the first two principal axes. However, in the case of RYMV genomes, the involvement of factors other than mutation pressure, such as natural selection, cannot be ignored. When viruses attempt to adapt to the host cell, natural selection may result in a weak codon usage bias [48,49,79]. Moreover, a correlation study between primary axes and GRAVY and ARO also demonstrated that, although natural selection has somewhat influenced RYMV codon usage patterns, it is far weaker than mutation pressure [61,62,80].
Virus genomes in general contain a considerable proportion of repetitive sequences and microsatellites. Recombination, nucleotide content, and coding region are all influenced by the presence of a repetitive sequence and microsatellite. Whole genome sequencing, which also explores microsatellites, is warranted for further comparative genomics and evolutionary biology studies in RYMV species [81,82].
Supplementary Materials
The following supporting information can be downloaded at: https://www.mdpi.com/article/10.3390/agronomy12091990/s1, Table S1: Detailed information of RYMV isolates studied in this study.
Author Contributions
S.U.R. and I.U.R.: Conceptualization, Methodology, Software, Data curation, Writing—Original draft preparation. M.A.K. and S.N.: Helped in write-up and editing, Validation. S.N. and S.U.: Methodology, Visualization, Validation. M.I.U.H. and M.A.K.: Reviewing-editing, Validation. A.A.A.-G., F.M.A.-H., R.M.A., W.A.E. and M.S.E.: Reviewing and Editing, Validation. All authors have read and agreed to the published version of the manuscript.
Funding
The authors would like to extend their sincere appreciation to the Researchers Supporting Project Number (RSP2022R483), King Saud University, Riyadh, Saudi Arabia.
Institutional Review Board Statement
Not applicable.
Informed Consent Statement
Not applicable.
Data Availability Statement
Not applicable.
Acknowledgments
The authors would like to extend their sincere appreciation to the Researchers Supporting Project Number (RSP2022R483), King Saud University, Riyadh, Saudi Arabia.
Conflicts of Interest
All the authors declare that they have no conflict of interest.
Ethical Approval
This article does not contain any studies with human participants performed by any of the authors.
References
- Rakotomalala, M.; Abera, B.; Rakotoarisoa, J.; Alemu, D.; Hébrard, E. Complete Genome Sequences of Rice Yellow Mottle Virus Isolates from the Federal Democratic Republic of Ethiopia. Microbiol. Resour. Announc. 2019, 8, e00589-19. [Google Scholar] [CrossRef] [PubMed]
- Voinnet, O.; Pinto, Y.M.; Baulcombe, D.C. Suppression of Gene Silencing: A General Strategy Used by Diverse DNA and RNA Viruses of Plants. Proc. Natl. Acad. Sci. USA 1999, 96, 14147–14152. [Google Scholar] [CrossRef] [PubMed]
- Koudamiloro, A.; Nwilene, F.E.; Togola, A.; Akogbeto, M. Insect Vectors of Rice Yellow Mottle Virus. J. Insects 2015, 2015, 721751. [Google Scholar] [CrossRef][Green Version]
- Fargette, D.; Abubakar, Z.; Traore, O.; Brugidou, C.; Choisy, M.; Se, Y.; Fauquet, C.; Konate, G. Inferring the Evolutionary History of Rice Yellow Mottle Virus from Genomic, Phylogenetic, and Phylogeographic Studies. J. Virol. 2004, 78, 3252–3261. [Google Scholar] [CrossRef]
- Bakker, W. Characterization and Ecological Aspects of Rice Yellow Mottle Virus in Kenya; Centre for Agricultural Publishing and Documentatio: Wageningen, The Netherlands, 1974. [Google Scholar]
- Kouassi, N.K.; N’Guessan, P.; Albar, L.; Fauquet, C.M.; Brugidou, C. Distribution and Characterization of Rice Yellow Mottle Virus: A Threat to African Farmers. Plant Dis. 2005, 89, 124–133. [Google Scholar] [CrossRef]
- Konate, G.; Traore, O.; Coulibaly, M.M. Characterization of Rice Yellow Mottle Virus Isolates in Sudano-Sahelian Areas. Arch. Virol. 1997, 142, 1117–1124. [Google Scholar] [CrossRef]
- Sarra, S.; Peters, D. Rice Yellow Mottle Virus Is Transmitted by Cows, Donkeys, and Grass Rats in Irrigated Rice Crops. Plant Dis. 2003, 87, 804–808. [Google Scholar] [CrossRef]
- Konate, G.; Sarra, S.; Traore, O. Rice Yellow Mottle Virus Is Seed-Borne but Not Seed Transmitted in Rice Seeds. Eur. J. Plant Pathol. 2001, 107, 361–364. [Google Scholar] [CrossRef]
- Hubert, J.; Lyimo, H.J.F.; Luzi-kihupi, A. Geographical Variation, Distribution and Diversity of Rice Yellow Mottle Virus Phylotypes in Tanzania. Am. J. Plant Sci. 2017, 8, 1264–1284. [Google Scholar] [CrossRef]
- Ayaka, U.; Naswiru, T.; Keiko, T.N.; Nobuhito, S.; Nobuaki, O. Characterization of Rice Yellow Mottle Virus in North-Eastern Tanzania. J. Agric. Sci. 2015, 60, 116–126. [Google Scholar]
- N’Guessan, P.; Pinel, A.; Caruana, M.L.; Frutos, R.; Sy, A.; Ghesquière, A.; Fargette, D. Evidence of the Presence of Two Serotypes of Rice Yellow Mottle Sobemovirus in Côte d’Ivoire. Eur. J. Plant Pathol. 2000, 106, 167–178. [Google Scholar] [CrossRef]
- Rossel, H.W.; Ayotade, K.A.; Thottapilly, G.; Adeoti, A.A.; Alluri, K.; Alam, M.S.; Zan, K. A new record of rice yellow mottle virus disease in Badeggi, Nigeria. Int. Rice Comm. Newsl. 1982, 31, 23–24. [Google Scholar]
- Fauquet, C.; Thouvenel, J.C. Isolation of the rice yellow mottle virus in Ivory Coast. Plant Dis. Report. 1977, 61, 4–7. [Google Scholar]
- Raymundo, S.A.; Konteh, I. Distribution, importance, screening methods and varietal reaction to rice pale yellow mottle disease [in West Africa]. Int. Rice Comm. Newsl. 1980, 29, 51–53. [Google Scholar]
- John, V.T.; Thottappilly Ibadan, G.; Awoderu, V.A. Occurrence of Rice Yellow Mottle Virus in Some Sahelian Countries in West Africa. FAO Plant Prot. Bull. 1984, 32, 86–87. [Google Scholar]
- Reckhaus, P.M.; Andriamasintseheno, H.F. Rice Yellow Mottle Virus in Madagascar and Its Epidemiology in the Northwest of the Island/Rice Yellow Mottle Virus in Madagaskar Und Seine Epidemiologie Im Nordwesten Der Insel. Z. Pflanzenkrankh. Pflanzenschutz/J. Plant Dis. Prot. 1997, 104, 289–295. [Google Scholar]
- Traoré, O.; Pinel, A.; Fargette, D.; Konaté, G. First Report and Characterization of Rice Yellow Mottle Virus in Central Africa. Plant Dis. 2001, 85, 920. [Google Scholar] [CrossRef] [PubMed]
- Awoderu, V.A. The Rice Yellow Mottle Virus Situation in West Africa. J. Basic Microbiol. 1991, 31, 91–99. [Google Scholar] [CrossRef]
- Asante, M.D.; Amadu, B.; Traore, V.S.E.; Oppong, A.; Adebayo, M.A.; Aculey, P.; Marfo, E.A.; Kang, K.-H. Assessment of Korean Rice Lines for Their Reaction to Rice Yellow Mottle Virus in Ghana. Heliyon 2020, 6, e05551. [Google Scholar] [CrossRef]
- Butt, A.M.; Nasrullah, I.; Qamar, R.; Tong, Y. Evolution of Codon Usage in Zika Virus Genomes Is Host and Vector Speci Fi C. Emerg. Microbes Infect. 2016, 5, 1–14. [Google Scholar] [CrossRef]
- Hershberg, R.; Petrov, D.A. Selection on Codon Bias. TL-42. Annu. Rev. Genet. 2008, 42, 287–299. [Google Scholar] [CrossRef] [PubMed]
- Andersson, S.G.; Kurland, C.G. Codon Preferences in Free-Living Microorganisms. Microbiol. Rev. 1990, 54, 198–210. [Google Scholar] [CrossRef] [PubMed]
- Cristina, J.; Moreno, P.; Moratorio, G.; Musto, H. Genome-Wide Analysis of Codon Usage Bias in Ebolavirus. Virus Res. 2015, 196, 87–93. [Google Scholar] [CrossRef] [PubMed]
- Rahman, S.U.; Mao, Y.; Tao, S. Codon Usage Bias and Evolutionary Analyses of Zika Virus Genomes. Genes Genom. 2017, 39, 855–866. [Google Scholar] [CrossRef]
- Sharp, P.M.; Li, W.H. Codon Usage in Regulatory Genes in Escherichia Coli Does Not Reflect Selection for “rare” Codons. Nucleic Acids Res. 1986, 14, 7737–7749. [Google Scholar] [CrossRef]
- Butt, A.M.; Nasrullah, I.; Tong, Y. Genome-Wide Analysis of Codon Usage and Influencing Factors in Chikungunya Viruses. PLoS ONE 2014, 9, e90905. [Google Scholar] [CrossRef]
- Sharp, P.M.; Emery, L.R.; Zeng, K. Forces That Influence the Evolution of Codon Bias. Philos. Trans. R. Soc. B 2010, 365, 1203–1212. [Google Scholar] [CrossRef]
- Rahman, S.U.; Abdullah, M.; Khan, A.W.; Haq, M.I.U.; Haq, N.U.; Aziz, A.; Tao, S. A Detailed Comparative Analysis of Codon Usage Bias in Alongshan Virus. Virus Res. 2022, 308, 198646. [Google Scholar] [CrossRef]
- Mueller, S.; Papamichail, D.; Coleman, J.R.; Skiena, S.; Wimmer, E. Reduction of the Rate of Poliovirus Protein Synthesis through Large-Scale Codon Deoptimization Causes Attenuation of Viral Virulence by Lowering Specific Infectivity. J. Virol. 2006, 80, 9687–9696. [Google Scholar] [CrossRef]
- Costafreda, M.I.; Pérez-Rodriguez, F.J.; D’Andrea, L.; Guix, S.; Ribes, E.; Bosch, A.; Pintó, R.M. Hepatitis A Virus Adaptation to Cellular Shutoff Is Driven by Dynamic Adjustments of Codon Usage and Results in the Selection of Populations with Altered Capsids. J. Virol. 2014, 88, 5029–5041. [Google Scholar] [CrossRef]
- Burns, C.C.; Shaw, J.; Campagnoli, R.; Jorba, J.; Vincent, A.; Quay, J.; Kew, O. Modulation of Poliovirus Replicative Fitness in HeLa Cells by Deoptimization of Synonymous Codon Usage in the Capsid Region. J. Virol. 2006, 80, 3259–3272. [Google Scholar] [CrossRef] [PubMed]
- Karumathil, S.; Raveendran, N.T.; Ganesh, D.; Kumar Ns, S.; Nair, R.R.; Dirisala, V.R. Evolution of Synonymous Codon Usage Bias in West African and Central African Strains of Monkeypox Virus. Evol. Bioinform. Online 2018, 14, 1176934318761368. [Google Scholar] [CrossRef] [PubMed]
- Odongo, P.J.; Onaga, G.; Ricardo, O.; Natsuaki, K.T.; Alicai, T.; Geuten, K. Insights Into Natural Genetic Resistance to Rice Yellow Mottle Virus and Implications on Breeding for Durable Resistance. Front. Plant Sci. 2021, 12, 671355. [Google Scholar] [CrossRef] [PubMed]
- Pidon, H.; Chéron, S.; Ghesquière, A.; Albar, L. Allele Mining Unlocks the Identification of RYMV Resistance Genes and Alleles in African Cultivated Rice. BMC Plant Biol. 2020, 20, 222. [Google Scholar] [CrossRef]
- Yao, X.; Fan, Q.; Yao, B.; Lu, P.; Rahman, S.U.; Chen, D.; Tao, S. Codon Usage Bias Analysis of Bluetongue Virus Causing Livestock Infection. Front. Microbiol. 2020, 11, 655. [Google Scholar] [CrossRef]
- Wong, E.H.M.; Smith, D.K.; Rabadan, R.; Peiris, M.; Poon, L.L.M. Codon Usage Bias and the Evolution of Influenza A Viruses. Codon Usage Biases of Influenza Virus. BMC Evol. Biol. 2010, 10, 253. [Google Scholar] [CrossRef]
- Liu, J.; Zhu, D.; Ma, G.; Liu, M.; Wang, M.; Jia, R.; Chen, S.; Sun, K.; Yang, Q.; Wu, Y.; et al. Genome-Wide Analysis of the Synonymous Codon Usage Patterns in Riemerella Anatipestifer. Int. J. Mol. Sci. 2016, 17, 1304. [Google Scholar] [CrossRef]
- Chakraborty, A.; Uechi, T.; Higa, S.; Torihara, H.; Kenmochi, N. Loss of Ribosomal Protein L11 Affects Zebrafish Embryonic Development through a P53-Dependent Apoptotic Response. PLoS ONE 2009, 4, e4152. [Google Scholar] [CrossRef]
- Puigbò, P.; Bravo, I.G.; Garcia-Vallve, S. CAIcal: A Combined Set of Tools to Assess Codon Usage Adaptation. Biol. Direct 2008, 3, 38. [Google Scholar] [CrossRef]
- Wright, F. The “effective Number of Codons” Used in a Gene. Gene 1990, 87, 23–29. [Google Scholar] [CrossRef]
- Cristina, J.; Fajardo, A.; Sonora, M.; Moratorio, G.; Musto, H. A Detailed Comparative Analysis of Codon Usage Bias in Zika Virus. Virus Res. 2016, 223, 147–152. [Google Scholar] [CrossRef] [PubMed]
- Greenacre, M. Theory and Applications of Correspondence Analysis; Academic Press: London, UK, 1984; ISBN 0122990501. [Google Scholar]
- Guan, D.L.; Ma, L.B.; Khan, M.S.; Zhang, X.X.; Xu, S.Q.; Xie, J.Y. Analysis of Codon Usage Patterns in Hirudinaria Manillensis Reveals a Preference for GC-Ending Codons Caused by Dominant Selection Constraints. BMC Genom. 2018, 19, 542. [Google Scholar] [CrossRef] [PubMed]
- Sueoka, N. Directional Mutation Pressure and Neutral Molecular Evolution. Proc. Natl. Acad. Sci. USA 1988, 85, 2653–2657. [Google Scholar] [CrossRef] [PubMed]
- Wu, Y.; Zhao, D.; Tao, J. Analysis of Codon Usage Patterns in Herbaceous Peony (Paeonia Lactiflora Pall.) Based on Transcriptome Data. Genes 2015, 6, 1125–1139. [Google Scholar] [CrossRef]
- Singh, N.K.; Tyagi, A. A Detailed Analysis of Codon Usage Patterns and Influencing Factors in Zika Virus. Arch. Virol. 2017, 162, 1963–1973. [Google Scholar] [CrossRef]
- Hassan, S.; Mahalingam, V.; Kumar, V. Synonymous Codon Usage Analysis of Thirty Two Mycobacteriophage Genomes. Adv. Bioinform. 2009, 2009, 316936. [Google Scholar] [CrossRef]
- Sharp, P.M.; Li, W.H. An Evolutionary Perspective on Synonymous Codon Usage in Unicellular Organisms. J. Mol. Evol. 1986, 24, 28–38. [Google Scholar] [CrossRef]
- Rahman, S.U.; Yao, X.; Li, X.; Chen, D.; Tao, S. Analysis of Codon Usage Bias of Crimean-Congo Hemorrhagic Fever Virus and Its Adaptation to Hosts. Infect. Genet. Evol. 2018, 58, 1–16. [Google Scholar] [CrossRef]
- Wang, Z.; Cao, R.; Taylor, K.; Briley, A.; Caldwell, C.; Cheng, J. The Properties of Genome Conformation and Spatial Gene Interaction and Regulation Networks of Normal and Malignant Human Cell Types. PLoS ONE 2013, 8, e58793. [Google Scholar] [CrossRef]
- Jenkins, G.M.; Holmes, E.C. The Extent of Codon Usage Bias in Human RNA Viruses and Its Evolutionary Origin. Virus Res. 2003, 92, 1–7. [Google Scholar] [CrossRef]
- Wang, L.; Xing, H.; Yuan, Y.; Wang, X.; Saeed, M.; Tao, J.; Feng, W.; Zhang, G.; Song, X.; Sun, X. Genome-Wide Analysis of Codon Usage Bias in Four Sequenced Cotton Species. PLoS ONE 2018, 13, e0194372. [Google Scholar] [CrossRef] [PubMed]
- Sablok, G.; Wu, X.; Kuo, J.; Nayak, K.C.; Baev, V.; Varotto, C.; Zhou, F. Combinational Effect of Mutational Bias and Translational Selection for Translation Efficiency in Tomato (Solanum Lycopersicum) Cv. Micro-Tom. Genomics 2013, 101, 290–295. [Google Scholar] [CrossRef] [PubMed]
- Ossowski, S.; Schneeberger, K.; Lucas-Lledó, J.I.; Warthmann, N.; Clark, R.M.; Shaw, R.G.; Weigel, D.; Lynch, M. The Rate and Molecular Spectrum of Spontaneous Mutations in Arabidopsis Thaliana. Science 2010, 327, 92–94. [Google Scholar] [CrossRef] [PubMed]
- Kawabe, A.; Miyashita, N.T. Patterns of Codon Usage Bias in Three Dicot and Four Monocot Plant Species. Genes Genet. Syst. 2003, 78, 343–352. [Google Scholar] [CrossRef] [PubMed]
- Nguyen, T.H.; Wang, D.; Rahman, S.U.; Bai, H.; Yao, X.; Chen, D.; Tao, S. Analysis of Codon Usage Patterns and Influencing Factors in Rice Tungro Bacilliform Virus. Infect. Genet. Evol. 2021, 90, 104750. [Google Scholar] [CrossRef]
- Anwar, A.M.; Aljabri, M.; El-soda, M. Patterns of Genome-Wide Codon Usage Bias in Tobacco, Tomato and Potato. Biotechnol. Biotechnol. Equip. 2021, 35, 657–664. [Google Scholar] [CrossRef]
- Wei, L.; He, J.; Jia, X.; Qi, Q.; Liang, Z.; Zheng, H.; Ping, Y.; Liu, S.; Sun, J. Analysis of Codon Usage Bias of Mitochondrial Genome in Bombyx Moriand Its Relation to Evolution. BMC Evol. Biol. 2014, 14, 262. [Google Scholar] [CrossRef]
- Li, N.; Li, Y.; Zheng, C.; Huang, J.; Zhang, S. Genome-Wide Comparative Analysis of the Codon Usage Patterns in Plants. Genes Genom. 2016, 38, 723–731. [Google Scholar] [CrossRef]
- Cardinale, D.J.; Derosa, K.; Duffy, S. Base Composition and Translational Selection Are Insufficient to Explain Codon Usage Bias in Plant Viruses. Viruses 2013, 5, 162–181. [Google Scholar] [CrossRef]
- He, Z.; Gan, H.; Liang, X. Analysis of Synonymous Codon Usage Bias in Potato Virus M and Its Adaption to Hosts. Viruses 2019, 11, 752. [Google Scholar] [CrossRef]
- Song, H.; Liu, J.; Song, Q.; Zhang, Q.; Tian, P.; Nan, Z. Comprehensive Analysis of Codon Usage Bias in Seven Epichloë Species and Their Peramine-Coding Genes. Front. Microbiol. 2017, 8, 1419. [Google Scholar] [CrossRef] [PubMed]
- van Hemert, F.; Berkhout, B. Nucleotide Composition of the Zika Virus RNA Genome and Its Codon Usage. Virol. J. 2016, 13, 95. [Google Scholar] [CrossRef]
- Yang, C.; Zhao, Q.; Wang, Y.; Zhao, J.; Qiao, L.; Wu, B.; Yan, S.; Zheng, J.; Zheng, X. Comparative Analysis of Genomic and Transcriptome Sequences Reveals Divergent Patterns of Codon Bias in Wheat and Its Ancestor Species. Front. Genet. 2021, 12, 732432. [Google Scholar] [CrossRef] [PubMed]
- Liu, H.; He, R.; Zhang, H.; Huang, Y.; Tian, M.; Zhang, J. Analysis of Synonymous Codon Usage in Zea Mays. Mol. Biol. Rep. 2010, 37, 677–684. [Google Scholar] [CrossRef] [PubMed]
- Subramanian, A.; Rup Sarkar, R. Data in Support of Large Scale Comparative Codon Usage Analysis in Leishmania and Trypanosomatids. Data Br. 2015, 4, 269–272. [Google Scholar] [CrossRef][Green Version]
- Vasanthi, S.; Dass, J.F.P. Comparative Genome-Wide Analysis of Codon Usage of Different Bacterial Species Infecting Oryza Sativa. J. Cell. Biochem. 2018, 119, 9346–9356. [Google Scholar] [CrossRef] [PubMed]
- Pan, X.; Welti, R.; Wang, X. Quantitative Analysis of Major Plant Hormones in Crude Plant Extracts by High-Performance Liquid Chromatography–Mass Spectrometry. Nat. Protoc. 2010, 5, 986–992. [Google Scholar] [CrossRef]
- Jia, J.; Xue, Q. Codon Usage Biases of Transposable Elements and Host Nuclear Genes in Arabidopsis Thaliana and Oryza Sativa. Genom. Proteom. Bioinform. 2009, 7, 175–184. [Google Scholar] [CrossRef]
- Qing, Y.; Cheng, L.; Li, R.; Liu, G.; Zhang, Y.; Tang, X.; Wang, J.; Liu, H.; Qin, Y. Potential Antibacterial Mechanism of Silver Nanoparticles and the Optimization of Orthopedic Implants by Advanced Modification Technologies. Int. J. Nanomed. 2018, 13, 3311–3327. [Google Scholar] [CrossRef]
- Ma, Y.P.; Liu, Z.X.; Hao, L.; Ma, J.Y.; Liang, Z.L.; Li, Y.G.; Ke, H. Analysing Codon Usage Bias of Cyprinid Herpesvirus 3 and Adaptation of This Virus to the Hosts. J. Fish Dis. 2015, 38, 665–673. [Google Scholar] [CrossRef]
- Nasrullah, I.; Butt, A.M.; Tahir, S.; Idrees, M.; Tong, Y. Genomic Analysis of Codon Usage Shows Influence of Mutation Pressure, Natural Selection, and Host Features on Marburg Virus Evolution. BMC Evol. Biol. 2015, 15, 174. [Google Scholar] [CrossRef] [PubMed]
- Kumar, N.; Bera, B.C.; Greenbaum, B.D.; Bhatia, S.; Sood, R.; Selvaraj, P.; Anand, T.; Tripathi, B.N.; Virmani, N. Revelation of Influencing Factors in Overall Codon Usage Bias of Equine Influenza Viruses. PLoS ONE 2016, 11, e0154376. [Google Scholar] [CrossRef] [PubMed]
- Chamberlain, J.; Cook, N.; Lloyd, G.; Mioulet, V.; Tolley, H.; Hewson, R. Co-Evolutionary Patterns of Variation in Small and Large RNA Segments of Crimean-Congo Hemorrhagic Fever Virus. J. Gen. Virol. 2005, 86, 3337–3341. [Google Scholar] [CrossRef] [PubMed]
- Zhang, Y.; Shen, Z.; Meng, X.; Zhang, L.; Liu, Z.; Liu, M.; Zhang, F.; Zhao, J. Codon Usage Patterns across Seven Rosales Species. BMC Plant Biol. 2022, 22, 65. [Google Scholar] [CrossRef]
- Hewson, R.; Gmyl, A.; Gmyl, L.; Smirnova, S.E.; Karganova, G.; Jamil, B.; Hasan, R.; Chamberlain, J.; Clegg, C. Evidence of Segment Reassortment in Crimean-Congo Haemorrhagic Fever Virus. J. Gen. Virol. 2004, 85, 3059–3070. [Google Scholar] [CrossRef]
- Cheng, X.; Wu, X.; Wang, H.; Sun, Y.; Qian, Y.; Luo, L. High Codon Adaptation in Citrus Tristeza Virus to Its Citrus Host. Virol. J. 2012, 9, 15–19. [Google Scholar] [CrossRef]
- Gupta, S.K.; Bhattacharyya, T.K.; Ghosh, T.C. Synonymous Codon Usage in Lactococcus Lactis: Mutational Bias versus Translational Selection. J. Biomol. Struct. Dyn. 2004, 21, 527–536. [Google Scholar] [CrossRef]
- Biswas, K.K.; Palchoudhury, S.; Chakraborty, P.; Bhattacharyya, U.K.; Ghosh, D.K.; Debnath, P.; Ramadugu, C.; Keremane, M.L.; Khetarpal, R.K.; Lee, R.F. Codon Usage Bias Analysis of Citrus Tristeza Virus: Higher Codon Adaptation to Citrus Reticulata Host. Viruses 2019, 11, 331. [Google Scholar] [CrossRef]
- George, B.; Alam, C.M.; Kumar, R.V.; Gnanasekaran, P.; Chakraborty, S. Potential Linkage between Compound Microsatellites and Recombination in Geminiviruses: Evidence from Comparative Analysis. Virology 2015, 482, 41–50. [Google Scholar] [CrossRef][Green Version]
- George, B.; Gnanasekaran, P.; Jain, S.K.; Chakraborty, S. Genome Wide Survey and Analysis of Small Repetitive Sequences in Caulimoviruses. Infect. Genet. Evol. 2014, 27, 15–24. [Google Scholar] [CrossRef]
Publisher’s Note: MDPI stays neutral with regard to jurisdictional claims in published maps and institutional affiliations. |
© 2022 by the authors. Licensee MDPI, Basel, Switzerland. This article is an open access article distributed under the terms and conditions of the Creative Commons Attribution (CC BY) license (https://creativecommons.org/licenses/by/4.0/).