Abstract
Crop breeding has been successful in increasing crop grain yield (GY; reproductive biomass) largely through reduced vegetative size, increased reproductive effort (RE = reproductive biomass/total biomass) and increased water-use efficiency (WUE) in grain production. Flowering time is an important life history trait that signifies the switch from vegetative to reproductive growth. The relationship between GY and time from sowing to flowering (Tsf) is unclear. We fit the relationships between GY and RE vs. Tsf to the logistic model using data from 18 spring wheat genotypes grown under simulated rainfed conditions. Tsf accounted for water use before and after flowering, root length density, total leaf area, and the time from flowering to harvest. Early flowering meant decreased water use before flowering and increased water use afterward. Soil water remaining at harvest was positively correlated with yield. Early flowering genotypes have a higher WUE of grain production, but there was no significant difference in the WUE of total biomass production. The relationship between grain yield and Tsf is described as a unimodal curve, as is the relationship between RE and Tsf. Higher yields and a higher RE have been achieved through earlier flowering, and both RE and Tsf reached their optimal values for maximizing GY. Crop breeding is unlikely to achieve further increases in GY through this route in the future. The results suggest that breeding does not improve biomass’s water-use efficiency, but causes changes in biomass allocation strategy, and this could be a new direction for genetically improving grain yield.
1. Introduction
Wheat (Triticum aestivum L.) yield is determined by biomass production and harvest index (grain biomass/total biomass). Since the green revolution in the 1960s, wheat grain yield increases have been associated with reduced plant height and increased harvest index [1,2]. There is a limit to this reduction, and highly dwarfed varieties do not produce high yields [3]. Wheat grain yield in arid and semiarid areas has increased less than in other climates [4,5,6]. Water shortages are a major constraint to wheat yield in these areas [7]; there is a need to improve water-use efficiency (WUE, yield per unit of water use) [8]. Some researchers have hypothesized that small root systems can improve water-use efficiency in water-limited conditions [7]. Smaller root systems could reduce water use before flowering and retain more water for reproduction [8,9,10]. Genotypes with small leaf areas at flowering are associated with high water-use efficiency [11]. Genotypes with high water-use efficiency generally have a high harvest index [8,9]. However, since high water-use efficiency in crops is driven by reduced water acquisition, it has been hypothesized that selection for high water-use efficiency for water-limited conditions may lead to a decrease in yield, because genotypes with small root systems may have a lower biomass [12,13] and yield [14,15] under drought conditions. There may be a trade-off between biomass allocation to roots and harvest index [16].
The time onset of flowering is an important ecological trait. It marks the switch from vegetative to reproductive growth and determines the plant’s ability to acquire additional resources. Changing the time onset of flowering may alter the development of vegetative organs, e.g., delayed flowering may result in more leaves and taller plants [17,18]. Thus, delayed flowering strengthens the plant’s capacity to capture additional resources, which may promote reproductive development later [19]. At the same time, if flowering is too late, reproduction will be constrained by the shorter time remaining for reproduction in the growing season [19,20]. Theoretically, the relationship between flowering time and reproduction is unimodal. There is an optimal flowering time that leads to maximum yield [19,20,21]. Therefore, flowering time is central to a plant’s capacity to acquire resources and allocate some of these to reproduction.
Over the past hundred years, selection for reduced vegetative growth, reflected in shorter plants and smaller root systems, has meant there are more resources available for reproductive growth, contributing greatly to higher yields. However, if too few resources are allocated to resource-acquiring vegetative structures, sufficient resources will not be accumulated to produce high yields, so we hypothesize that the relationship between flowering time and grain yield is unimodal. Here, we model the relationships among vegetative biomass, reproductive effort (RE, the ratio of reproductive biomass to total biomass), and grain yield to test this hypothesis using data on the time from sowing to flowering (Tsf) and grain yield in 18 spring wheat genotypes grown under simulation rainfed conditions and estimate the extent to which the vegetative growth period can be reduced to increase yield.
2. Material and Methods
The Model
Annual crops grow vegetatively, and then they stop growing vegetatively and allocate subsequent growth to reproduction. This is considered the optimal strategy for monocarpic reproduction [22]. Plants that flower at different times will have a different vegetative biomass when they flower [23]. Plant vegetative growth (such as plant height and leaf area index) is sigmoidal and can be modeled with the logistic function [19,24], one of the simplest and most widely used sigmoidal growth curves. We use a logistic function to model the effect of differences in vegetative biomass (VB) resulting from differences in the pre-flowering growth period (Supplementary Figure S1).
where M represents the maximum biomass the latest-flowering plant achieves, c and r are additional parameters, and t is Tsf.
Similarly, the growth of a whole plant is also sigmoidal and can be modeled with a logistic growth curve [25]; therefore, we also use the logistic equation to describe the relationship between the length of the growth period (T) and total biomass (TB) at the end of the growing season (Supplementary Figure S2). One would expect a positive relationship between Tsf and the length of the growth period (T), and several studies have shown them to be positively correlated [23,26]. Therefore, we can convert the relationship between TB vs. T to a relationship between TB vs. t if we assume that the total biomass achieved its maximum value if there was no allocation to reproduction due to the late flowering.
Based on the fact that reproductive biomass (RB) = TB − VB, the relationship between the RB and t can be modeled with the equation:
As reproductive effort (RE) = RB/TB, we derived the relationship between the RB and t:
We tested the model (Equations (1) and (2)) using data from 18 spring wheat genotypes grown under simulated rain-fed conditions.
3. Experimental Design
3.1. Plant Material
Based on the results of a field experiment in 2014, we selected 18 genotypes of spring wheat grown in western China, which differed in their pre-flowering growth period, ranging from 74 days to 90 days in the field (Supplementary Table S1).
3.2. Experimental Treatments
The experiment was carried out in the Plant Growth Research System of Lanzhou University under a rainwater shelter. The plants were grown in PVC cylinders (40 cm in diameter and 200 cm tall) filled with a mixture of loess soil and river sand (3:1, v:v). The bulk density was 1.16 g cm−3, field water-holding capacity 23%, pH 8.1, organic carbon 9.4 g kg−1, total N 0.78 g kg−1, available P 20.9 mg kg−1. Before sowing, 11.4 g nitrogen (N) and 3.9 g phosphorus (P) cylinder−1 were applied as urea and calcium superphosphate, respectively. The soil water content before sowing was 23%, which did not affect the seed germination.
Seeds were sown by hand at a depth of approximately 4 cm. Each cylinder accommodated 37 plants, equivalent to 300 plants m−2. The soil surface in the PVC cylinders was covered with a 2.0 cm thick layer of low-density polyethylene particles to minimize the evaporation of soil water. All the genotypes had four replicates except DURRA-5 and NABUQ-6, which had three replicates.
Soil water content was estimated gravimetrically every 10 days after sowing (DAS). Water was added to the surface of the soil every 10 days after sowing. The amount of watering was based on the long-term average of the accumulated local rainfall every 10 days during the same period. Up to 45 DAS, rainfall of less than 2 mm was ignored when determining the volume of irrigation because any water from that meager rainfall would have evaporated completely within a few hours. The total irrigation over a single growing season was equivalent to 70 mm of rainfall (Supplementary Figure S3).
The water use over a given period was the sum of irrigation and soil moisture change. Because of the layer of polyethylene particles on the soil surface, water use was almost equal to transpiration. Water-use efficiency for grain (WUEG) or total biomass (WUET) was calculated as grain yield or total biomass divided by the water use over the growing season.
The leaf area was estimated nondestructively in situ. Five seedlings were measured in each cylinder (leaf area = leaf length × leaf width × 0.83) [27] every 10 DAS. The flowering date was defined as the day anthers were visible on 50% of the spikelets in each PVC cylinder, while the date of maturity was defined as the date on which there was a complete loss of green color from the glumes. All the plants were harvested at maturity, and the harvest date was recorded. All aboveground parts were oven-dried for 72 h at 70 °C, weighed, and the grain yield and aboveground biomass were recorded. Roots were sampled from the soil profile to a depth of 180 cm, using a root auger with a diameter of 9 cm. Two cores from each depth were mixed to make one composite sample. Wheat roots were collected by washing the soil over a 0.15 mm nylon mesh bag. Root length was measured using an Epson Perfection V750 Pro scanner (Epson Inc., Los Alamitos, CA, USA) and WinRHIZO (Regent Instruments Inc., Quebec, QC, Canada). Root length density (RLD) was calculated as root length per unit soil volume. The roots were then oven-dried for 72 h at 70 °C and weighed.
3.3. Statistical Analyses
We calculated the time from sowing to flowering, biomass allocation, water use, and other parameters for all 18 genotypes. We ascertained whether the differences were significant with a one-way analysis of variance (ANOVA).
We used the structural equation model (SEM) to investigate both direct and indirect (via total root length and total leaf area) effects of the phenological traits (time from sowing to flowering and time from flowering to maturity) and water use before and after flowering on grain yield. We simplified the SEM by removing non-significant paths. We selected the model based on p values, Akaike Information Criterion (AIC), adjusted goodness-of-fit index (AGFI > 0.95), and the standardized root mean square residual (SRMR < 0.05). We used the R package ‘lavaan’ for the SEM.
Based on the experimental data from the 18 genotypes, we fitted Equations (1) and (2) using a non-linear least squares regression.
All the statistical analyses were performed in R ver. 3.5.3, and the plots were drawn using SigmaPlot ver. 12 (Systat Software Inc., San Jose, CA, USA).
4. Results
4.1. Water Use and Grain Yield
The mean total amount of water used throughout the growing season was 458 kg m−2, and the variation among the genotypes was not significant (p = 0.08). The cultivars varied in their patterns of water use (Figure 1A), and there was a negative relationship between yield and water use over the season (Figure 2A). Grain yield was negatively correlated with water use before flowering but positively correlated with water use after flowering (Figure 1B,C). At the end of the growing season, the water potentially available in the soil for plant growth (defined as soil moisture content greater than 5%) was positively correlated with grain yield (Figure 1D).
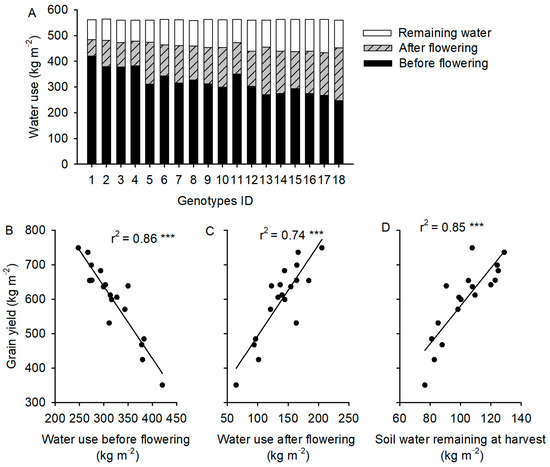
Figure 1.
(A) Water use by 18 spring wheat genotypes from sowing to flowering, from flowering to maturity, and available water remaining in soil at maturity. Relationship between water use during the three periods and grain yield above (B–D). Vertical bars in (A) represent 18 genotypes arranged in ascending order of grain yield. Black dots and lines in (B–D) represents experimental data and linear fitting, respectively. ***, significant at p < 0.001.
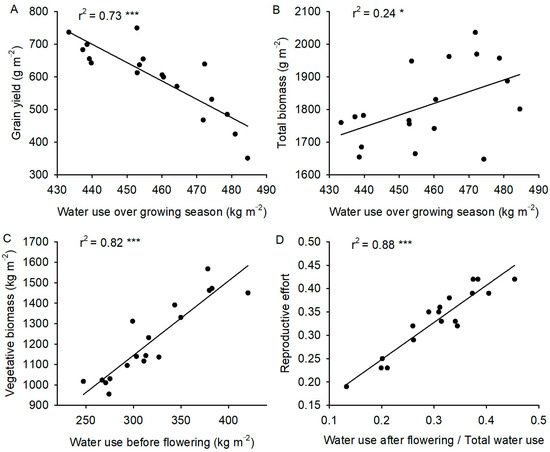
Figure 2.
(A) Relationship between grain yield and water use over the entire growing season. (B) Relationship between total biomass and water use during the entire growing season. (C) Relationship between vegetative biomass and water use before flowering. (D) The relationship between reproductive effort and the ratio of water use after flowering to total water use during the entire growing season. Black dots and lines represents experimental data and linear fitting, respectively. *** and * significant at p < 0.001 and p < 0.05, respectively.
Genotypes with higher water use over the growing season had more total biomass (Figure 2B). The water use efficiency of total biomass production did not vary significantly among the 18 genotypes (Figure 3B). Genotypes with greater water use over the growing season had lower grain yield (Figure 2A) and, therefore, lower water-use efficiency of grain production (Figure 3A). The genotypes that consumed the highest fraction of their water after flowering had a higher reproductive effort (Figure 2D), while those that consumed most of their water before flowering produced more vegetative biomass (Figure 2C).
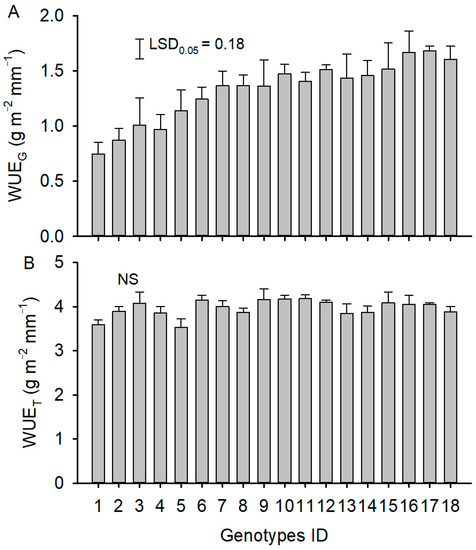
Figure 3.
Water-use efficiency of grain production (WUEG) and water-use efficiency of total biomass (WUET) of 18 genotypes. In panel (A), the vertical bar represents the least significant differences (LSD) at p = 0.05 level. In panel (B), NS represents that the difference was not significant among 18 genotypes (p > 0.05).
4.2. Phenology, Total Root Length, Leaf Area, and Water Use
The structural equation modeling (SEM) of the effects of phenology, total root length, total leaf area, and water-use pattern before and after flowering on grain yield showed that water use after flowering positively affected grain yield (path coefficient 0.86). Water use before flowering had a negative indirect effect (via a negative direct effect on water use after flowering) on grain yield (−0.59). Total root length and total leaf area also had negative indirect effects (via positive direct on water use before flowering) on grain yield. The total effect was −0.26 and −0.15, respectively (Figure 4B). Tsf has a negative indirect effect on grain yield, while days from flowering to maturity had a positive indirect effect on grain yield.
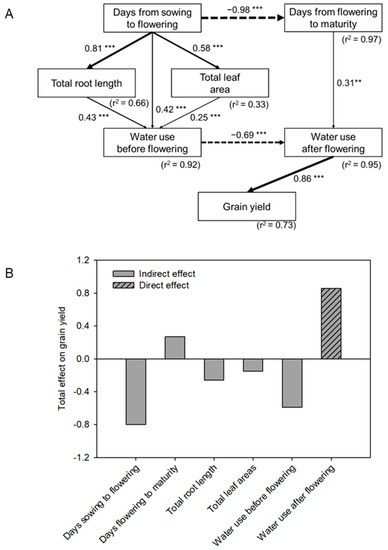
Figure 4.
(A) Structural equation model (SEM) accounting for direct and indirect effects of phenology (time before and after the onset of flowering), total root length, total leaf area, and water-use pattern on grain yield. Arrows indicate the direction of paths. Significant path coefficients, showing the strength and the sign of the relationships among the variables, are adjacent to arrows (**, p < 0.01; ***, p < 0.001). (B) Total (direct + indirect) effect of phenology, root length density, total leaf area, and water-use pattern on grain yield, based on SEM.
4.3. Time from Sowing to Flowering, Grain Yield, and Reproductive Effort
The range of flowering dates was 15 days (Supplementary Table S2). Genotypes differed significantly in total biomass (above- and underground biomass), vegetative biomass, grain yield, and reproductive effort (Supplementary Table S2).
The relationship between total biomass (TB) and vegetative biomass (VB) and Tsf (t) among different genotypes was consistent with the logistic equation (Figure 5A): T (r2 = 0.31, p = 0.06); (r2 = 0.68, p < 0.001). Based on RB = TB − VB, we derived the relationship between grain yield and t. The relationship between grain yield and Tsf was unimodal (Figure 5B), with an optimum t (topt) of 60 days after sowing. The maximum grain yield was 712 g m−2, and the optimum RE was 0.44. If t is less than topt, the delay in flowering will increase grain yield; if t is greater than topt, the delay in flowering will decrease grain yield, although our data show only the latter part of the relationship (Figure 5B). The relationship between RE and flowering time was also unimodal, with RE peaking at 0.48 when t was 54 days (Figure 5B). Grain yield increased with an increase in RE, but topt for RE and grain yield were not the same. The derived relationship between grain yield and RE was a closed curve (Figure 5C).
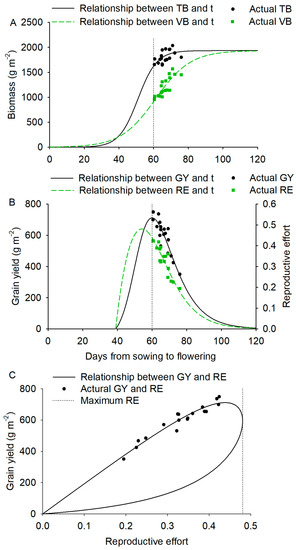
Figure 5.
(A) The relationship between total biomass (TB) and time from sowing to flowering (t) of spring wheat (solid black line, r2 = 0.31, p = 0.06) and between vegetative biomass (VB) and time from sowing to the flowering of spring wheat (green dotted line, r2 = 0.68). Parameters r1 and c1 were significant at p < 0.001). (B) The relationship between grain yield and time from sowing to flowering (black line, r2 = 0.78), and between reproductive effort and time from sowing to flowering (green dotted line, r2 = 0.75) derived from Equations (1) and (2). (C) The relationship between grain yield and reproductive effort (solid black line, r2 = 0.92) derived from Equations (1) and (2). Black dotted line represents maximum reproductive. Points are the experimental data.
5. Discussion
5.1. The Relationships among Resource Acquisition Capacity, Resource Allocation Strategy, and Reproductive Output
Tsf is a crucial phenological trait that regulates the size of vegetative organs (Figure 4 and Figure 5A). Later flowering increases the capacity of a plant to capture resources because more time is available to expand the leaf area [17] and grow a more extensive root system [28]. This greater capacity can support a higher grain yield being achieved later [29,30]. When water is limited, however, vegetative growth and reproductive growth compete for resources [31], and a greater vegetative biomass may come at the cost of reproductive output. This is why the relationship between reproductive output and the time until flowering is unimodal [19,20], as seen here (Figure 5B). The relationship between RE and Tsf was also unimodal (Figure 5B). Duan et al. [32] found that the relationship between aboveground biomass at flowering and harvest index was unimodal, consistent with our results. The Tsf that corresponds to maximum reproductive output is not the same as that which corresponds to maximum RE, which means both cannot be optimized simultaneously. Thus, maximizing the harvest index can result in a lower grain yield [16,33].
Plants need to attain a specific minimum size before they can reproduce. This threshold size was also observed in the present experiment (Figure 4B). After attaining this threshold size, vegetative growth continued as flowering was delayed. The larger vegetative biomass, whether shoots or roots, enabled the plant to capture more water to support a larger reproductive mass once the reproductive phase began. At that stage, reproductive growth outpaced vegetative growth, and RE increased with the delay in flowering. This pattern was similar to that reported by Echarte and Andrade [34], namely that HI increases with an increase in the size of plants. However, as vegetative biomass increases, so does the internal competition for resources at the expense of RE, which decreases as a result. For example, if larger below-ground organs capture more water, the decrease in RE can be compensated, and reproductive organs can also increase. This trade-off explains why maximum reproductive output does not always maximize RE. If vegetative biomass continues to increase, the remaining resources may not be able to support reproduction. Therefore, there is a limit to the higher grain yields that can be obtained by reducing vegetative biomass or by making water allocation more efficient. Above their optima, any further increase in either will result in lower grain yield.
5.2. Coordinated Changes in Traits Influencing Above- and Below-Ground Parts
Selection for increased yields has traditionally been based on easily visible traits such as plant height, leaf angle, and leaf area [2,35]. Roots are not easily visible, and the techniques to measure roots are time-consuming and destructive, which is why roots have received less attention from plant breeders, even though roots contribute greatly to yield [36,37]. The root system captures water and nutrients for the aboveground photosynthetic organs, which then provide photosynthate to roots. Traits that influence above- and below-ground organs are therefore not independent of one another. There is evidence that plant breeding may have favored smaller root systems [38], and modern varieties of wheat or maize tend to have more vertical roots and fewer lateral roots [39]. The decrease in plant height in rice also led to shallower roots [40]. These findings point to a trade-off between the growth of above- and below-ground parts [41]. On the other hand, variation in growing conditions and resource levels can result in positive correlations among plant fractions [12], masking the trade-offs achieved under similar conditions.
Traits associated with above- and below-ground parts influence the use of resources. Because root and shoot traits are not independent, plant-breeding researchers should focus on the whole plant’s strategy rather than on parts of the plant. In the present study, the time of flowering affected traits associated with both above- and below-ground parts. Early flowering resulted in a smaller RLD and smaller total leaf area. Flowering time also determined the duration of vegetative and reproductive growth, with delayed flowering resulting in a shorter time for reproductive growth. Flowering time determines part of the plant’s water uptake strategy by balancing the capacity to acquire water resources and the time available for growth. Flowering time can therefore serve as a proxy for that strategy. Soil water evaporation is an important part of the water loss in field crop production. Soil-surface shading by the crop canopy reduces this water loss [42]. Our experiment minimized evaporation by covering the soil with low-density polyethylene, which may have affected the results. Field experiments are needed to validate our results.
In some regions, climate limits the growth season’s length and growth rate. Such constraints may occur in the form of terminal drought or frost. In areas with a Mediterranean climate, early flowering is a strategy to escape drought towards the end of the growing season [43]. Our results apply to those regions as well. Plants that switch from growth to reproduction too early will have seeds that mature before the end of the growing season, but they may be small due to the limited resources invested in reproduction. At the same time, plants that switch late may have ample resources to support reproduction but may suffer or die before the seeds mature. Thus, there is an optimum flowering time in any given situation, which will maximize reproductive output.
5.3. Contribution of Plant Breeding to Yield Improvement
Our experimental data are confined to the right-hand side of yield vs. time from sowing to flowering, showing a negative correlation between yield and time from sowing to flowering and a positive correlation between yield and RE. Most studies on wild plants and crops report a negative correlation between reproductive output and flowering time [44,45,46]. Over the last century, a gradual shift towards early flowering has been observed in wheat-breeding areas with a Mediterranean climate and frequent terminal drought [43]. Early flowering is also observed in our study area, possibly resulting from selection for high yields. Early flowering genotypes may have low yields and therefore be eliminated in the breeding process. Our results suggest that current flowering time has reached the optimal value for maximizing GY, which may be why our results do not include the left-hand side of the model. Future studies should include early flowering genotypes to better describe the yield–Tsf relationship. In the present study, the maximum grain yield in spring wheat was 750 g m−2, close to the maximum grain yield of 712 g m−2 predicted by the model. Although RE failed to reach its theoretical maximum value of 0.48, it was not far from the predicted optimal value of 0.44. These figures show that breeding for higher yields by focusing on increasing resource allocation to reproduction is limited.
Our model suggests that maximum yield does not exhaust available water [47]. Similarly, early flowering decreased the total amount of water consumed during the growth season of Arabidopsis but did not reduce seed production [48]. Our results show a possible direction for reduced water use while maintaining maximal yields, which could increase farming sustainability.
6. Conclusions
The time of the onset of flowering represents the switch from vegetative to reproductive growth and regulates traits associated with both roots, leaves, and spikes. Tsf determined water use before and after flowering, root length density, total leaf area, and the time from flowering to harvest. Early flowering results in decreased water use before flowering and increased water use afterward. Early flowering genotypes have higher water-use efficiency fir grain production, but there was no significant difference in the water-use efficiency of total biomass production. The relationship between grain yield and Tsf is unimodal, as is the relationship between RE and Tsf. The pre-flowering growth period that results in maximum grain yield does not result in maximum RE. Wheat breeding has achieved high yields via early flowering, and maximum yield does not exhaust the available water resources. These findings offer a potential new direction for crop research, focusing on improving water-use efficiency for grain production via changes in biomass allocation over the course of the growing season.
Supplementary Materials
The following supporting information can be downloaded at: https://www.mdpi.com/article/10.3390/agronomy13051217/s1, Table S1: Origin, length of growing season, and flowering time of 18 genotypes of spring wheat used in field experiment; Table S2: Yield components and time until flowering (days after sowing) of 18 genotypes of spring wheat grown in pots; Figure S1: Relationship between the time from sowing to flowering and final vegetative biomass at flowering for genotypes with different pre-flowering growth periods; Figure S2: Relationship between the time from sowing to maturity and final total biomass at the end of the growing season for genotypes with different growth periods; Figure S3: Irrigation volume corresponding to average local rainfall during the same period from 2005 to 2014.
Author Contributions
Y.X., F.-M.L. and Y.-L.D. designed the research; Y.X. and D.W. performed the research; Y.X. analyzed the data; Y.X., J.W., F.-M.L., Y.-L.D. and D.W. wrote the paper. All authors have read and agreed to the published version of the manuscript.
Funding
This work was supported by the Gansu Provincial Fund for Distinguished Young Scholars (21JR7RA530), the National Natural Science Foundation of China (31670401), the ‘111′ Project (BP0719040), and the Fundamental Research Funds for the Central Universities (lzujbky-2021-sp42).
Data Availability Statement
Not applicable.
Conflicts of Interest
The authors declare no conflict of interest.
References
- Foulkes, M.J.; Slafer, G.A.; Davies, W.J.; Berry, P.M.; Sylvester-Bradley, R.; Martre, P.M.; Calderini, D.F.; Griffiths, S.; Reynolds, M.P. Raising yield potential of wheat. III. Optimizing partitioning to grain while maintaining lodging resistance. J. Exp. Bot. 2011, 62, 469–486. [Google Scholar] [CrossRef] [PubMed]
- Zhang, Y.; Xu, W.; Wang, H.; Dong, H.; Qi, X.; Zhao, M.; Fang, Y.; Gao, C.; Hu, L. Progress in genetic improvement of grain yield and related physiological traits of Chinese wheat in Henan Province. Field Crops Res. 2016, 199, 117–128. [Google Scholar] [CrossRef]
- Li, S.; Tian, Y.; Wu, K.; Ye, Y.; Yu, J.; Zhang, J.; Liu, Q.; Hu, M.; Li, H.; Tong, Y.; et al. Modulating plant growth-metabolism coordination for sustainable agriculture. Nature 2018, 560, 595–600. [Google Scholar] [CrossRef]
- Afzal, F.; Reddy, B.; Gul, A. Physiological, biochemical and agronomic traits associated with drought tolerance in a synthetic-derived wheat diversity panel. Crop. Pasture Sci. 2017, 3, 213. [Google Scholar] [CrossRef]
- Abinasa, M.; Ayana, A.; Bultosa, G. Genetic variability, heritability and trait associations in durum wheat (Triticum turgidum L. var. durum) genotypes. Afr. J. Agric. Res. 2011, 6, 3972–3979. [Google Scholar]
- AkÇUra, M. The relationships of some traits in Turkish winter bread wheat landraces. Turk. J. Agric. For. 2011, 35, 115–125. [Google Scholar] [CrossRef]
- Fang, Y.; Liang, L.; Liu, S.; Xu, B.; Siddique, K.H.M.; Palta, J.A.; Chen, Y. Wheat cultivars with small root length density in the topsoil increased post-anthesis water use and grain yield in the semi-arid region on the Loess Plateau. Eur. J. Agron. 2021, 124, 126243. [Google Scholar] [CrossRef]
- Hu, C.; Sadras, V.; Zhang, G.; Yang, R.; Zhang, X. Root pruning enhances wheat yield, harvest index and water-use efficiency in semiarid area. Field Crops Res. 2019, 230, 62–71. [Google Scholar] [CrossRef]
- Ma, S.C.; Xu, B.C.; Li, F.M.; Liu, W.Z.; Huang, Z.B. Effects of root pruning on competitive ability and water use efficiency in winter wheat. Field Crops Res. 2018, 105, 56–63. [Google Scholar] [CrossRef]
- Hu, C.; Ding, M.; Qu, C.; Sadras, V.; Yang, X.; Zhang, S. Yield and water use efficiency of wheat in the Loess Plateau: Responses to root pruning and defoliation. Field Crops Res. 2018, 179, 6–11. [Google Scholar] [CrossRef]
- He, J.; Du, Y.L.; Wang, T.; Turner, N.C.; Yang, R.P.; Jin, Y.; Xi, Y.; Zhang, C.; Cui, T.; Fang, X.W.; et al. Conserved water use improves the yield performance of soybean (Glycine max (L.) Merr.) under drought. Agric. Water Manag. 2017, 179, 236–245. [Google Scholar] [CrossRef]
- Blum, A. Effective use of water (EUW) and not water-use efficiency (WUE) is the target of crop yield improvement under drought stress. Field Crops Res. 2019, 112, 119–123. [Google Scholar] [CrossRef]
- Friedli, C.N.; Abiven, S.; Fossati, D.; Hund, A. Modern wheat semi-dwarfs root deep on demand: Response of rooting depth to drought in a set of Swiss era wheats covering 100 years of breeding. Euphytica 2019, 215, 2–15. [Google Scholar] [CrossRef]
- Chen, X.; Zhu, Y.; Pan, R.; Shen, W.; Yu, X.; Xiong, F. The relationship between characteristics of root morphology and grain filling in wheat under drought stress. PeerJ 2021, 9, e12015. [Google Scholar] [CrossRef]
- Hermanska, A.; Streda, T.; Chloupek, O. Improved wheat grain yield by a new method of root selection. Agron. Sustain. Dev. 2014, 35, 195–202. [Google Scholar] [CrossRef]
- Li, B.; Liu, Q.; Mao, X.; Li, A.; Wang, J.; Chang, J.; Jing, R. Overexpression of wheat gene TaMOR improves root system architecture and grain yield in Oryza sativa. J. Exp. Bot. 2016, 67, 4155–4167. [Google Scholar] [CrossRef]
- Rivera-Amado, C.; Trujillo-Negrellos, E.; Molero, G.; Reynolds, M.P.; Sylvester-Bradley, R.; Foulkes, M.J. Optimizing dry-matter partitioning for increased spike growth, grain number and harvest index in spring wheat. Field Crops Res. 2019, 240, 154–167. [Google Scholar] [CrossRef]
- Zhao, J.; Paulo, M.J.; Jamar, D.; Lou, P.; Eeuwijk, F.V.; Bonnema, G.; Vreugdenhil, D.; Koornneef, M. Association mapping of leaf traits, flowering time, and phytate content in Brassica rapa. Genome 2007, 50, 963–973. [Google Scholar] [CrossRef]
- Li, F.H.; Kitashiba Inaba, K.; Nishio, K. A Brassica rapa linkage map of EST-based SNP markers for identification of candidate genes controlling flowering time and leaf morphological traits. DNA Res. 2009, 16, 311–323. [Google Scholar] [CrossRef]
- Vermeulen, P.J. On selection for flowering time plasticity in response to density. New. Phytol. 2015, 205, 429–439. [Google Scholar] [CrossRef]
- Weis, A.E.; Wadgymar, S.M.; Sekor, M.; Franks, S.J. The shape of selection: Using alternative fitness functions to test predictions for selection on flowering time. Evol. Ecol. 2014, 28, 885–904. [Google Scholar] [CrossRef]
- Kudoh, H.; Kachi, N.; Kawano, S.; Ishiguri, Y. Intrinsic cost of delayed flowering in annual plants: Negative correlation between flowering time and reproductive effort. Plant Species Biol. 2010, 17, 101–107. [Google Scholar] [CrossRef]
- Cohen, D. Maximizing final yield when growth is limited by time or by limiting resources. J. Theor. Biol. 1971, 33, 299–307. [Google Scholar] [CrossRef]
- Du, Y.L.; Xi, Y.; Cui, T.; Anten, N.P.R.; Weiner, J.; Li, X.; Turner, N.C.; Zhao, Y.M.; Li, F.M. Yield components, reproductive allometry and the trade-off between grain yield and yield stability in dryland spring wheat. Field Crops Res. 2020, 257, 107930. [Google Scholar] [CrossRef]
- Sun, S.; Frelich, L.E. Flowering phenology and height growth pattern are associated with maximum plant height, relative growth rate and stem tissue mass density in herbaceous grassland species. J. Ecol. 2011, 99, 991–1000. [Google Scholar] [CrossRef]
- Deng, J.; Ran, J.; Wang, Z.; Fan, Z.; Wang, G.; Ji, M.; Liu, J.; Wang, Y.; Liu, J.; Brown, J.H. Models and tests of optimal density and maximal yield for crop plants. Proc. Natl. Acad. Sci. USA 2012, 109, 15823–15828. [Google Scholar] [CrossRef]
- Zaman-Allah, M.; Jenkinson, D.M.; Vadez, V. A conservative pattern of water use, rather than deep or profuse rooting, is critical for the terminal drought tolerance of chickpea. J. Exp. Bot. 2011, 62, 4239–4252. [Google Scholar] [CrossRef]
- Wang, J.Y.; Turner, N.C.; Liu, Y.X.; Siddique, K.H.M.; Xiong, Y.C. Effects of drought stress on morphological, physiological and biochemical characteristics of wheat species differing in ploidy level. Funct. Plant Biol. 2017, 44, 219–234. [Google Scholar] [CrossRef]
- Fletcher, R.S.; Mullen, J.K.; Heiliger, A.; Mckay, J.K. QTL analysis of root morphology, flowering time, and yield reveals trade-offs in response to drought in Brassica napus. J. Exp. Bot. 2015, 66, 245–256. [Google Scholar] [CrossRef]
- Badu-Apraku, B.; Yallou, C.G.; Obeng-Antwi, K.; Alidu, H.; Talabi, A.O.; Annor, B.; Oyekunle, M.; Akaogu, I.C.; Aderounmu, M. Yield Gains in Extra-Early Maize Cultivars of Three Breeding Eras under Multiple Environments. Agron. J. 2017, 109, 418–431. [Google Scholar] [CrossRef]
- El-Rawy, M.A.; Hassan, M.I. Effectiveness of drought tolerance indices to identify tolerant genotypes in bread wheat (Triticum aestivum L.). J. Crop. Sci. Biotechnol. 2014, 17, 255–266. [Google Scholar] [CrossRef]
- Herben, T.; Nováková, Z.; Klimešová, J.; Hrouda, L.; Rees, M. Species traits and plant performance: Functional trade-offs in a large set of species in a botanical garden. J. Ecol. 2012, 100, 1522–1533. [Google Scholar] [CrossRef]
- Duan, J.; Wu, Y.; Zhou, Y.; Ren, X.; Shao, Y.; Feng, W.; Zhu, Y.; He, L.; Guo, T. Approach to Higher Wheat Yield in the Huang-Huai Plain: Improving Post-anthesis Productivity to Increase Harvest Index. Front. Plant Sci. 2018, 9, 1457. [Google Scholar] [CrossRef]
- Aisawi, K.A.B.; Reynolds, M.P.; Singh, R.P.; Foulkes, M.J. The Physiological Basis of the Genetic Progress in Yield Potential of CIMMYT Spring Wheat Cultivars from 1966 to 2009. Crop. Sci. 2015, 55, 1749–1764. [Google Scholar] [CrossRef]
- Echarte, L.; Andrade, F.H. Harvest index stability of Argentinean maize hybrids released between 1965 and 1993. Field Crops Res. 2003, 82, 1–12. [Google Scholar] [CrossRef]
- Furbank, R.T.; Sharwood, R.; Estavillo, G.M.; Silva-Perez, V.; Condon, A.G. Photons to food: Genetic improvement of cereal crop photosynthesis. J. Exp. Bot. 2020, 71, 2226–2238. [Google Scholar] [CrossRef]
- Den Herder, G.; Isterdael, G.V.; Beeckman, T.; De Smet, I. The roots of a new green revolution. Trends Plant Sci. 2010, 15, 600–607. [Google Scholar] [CrossRef]
- Meister, R.; Rajani, M.S.; Ruzicka, D.; Schachtman, D.P. Challenges of modifying root traits in crops for agriculture. Trends Plant Sci. 2014, 19, 779–788. [Google Scholar] [CrossRef]
- Zhang, X.; Chen, S.; Sun, H.; Wang, Y.; Shao, L. Root size, distribution and soil water depletion as affected by cultivars and environmental factors. Field Crops Res. 2009, 114, 75–83. [Google Scholar] [CrossRef]
- Zhu, Y.H.; Weiner, J.; Yu, M.X.; Li, F.M. Evolutionary agroecology: Trends in root architecture during wheat breeding. Evol. Appl. 2019, 12, 733–743. [Google Scholar] [CrossRef]
- Yoshida, S.; Bhattacharjee, D.P.; Cabuslay, G.S. Relationship between plant type and root growth in rice. Soil. Sci. Plant Nutr. 1982, 28, 473–482. [Google Scholar] [CrossRef]
- Cheng, J.; Chu, P.; Chen, D.; Bai, Y.; Niu, S. Functional correlations between specific leaf area and specific root length along a regional environmental gradient in Inner Mongolia grasslands. Funct. Ecol. 2015, 30, 985–997. [Google Scholar] [CrossRef]
- Shavrukov, Y.; Kurishbayev, A.; Jatayev, S.; Shvidchenko, V.; Zotova, L.; Koekemoer, F.; de Groot, S.; Soole, K.; Langridge, P. Early Flowering as a Drought Escape Mechanism in Plants: How Can It Aid Wheat Production? Front. Plant Sci. 2017, 8, 1950. [Google Scholar] [CrossRef] [PubMed]
- Anderson, J.T.; Inouye, D.W.; McKinney, A.M.; Colautti, R.I.; Mitchell-Olds, T. Phenotypic plasticity and adaptive evolution contribute to advancing flowering phenology in response to climate change. Proc. R. Soc. B Biol. Sci. 2012, 279, 3843–3852. [Google Scholar] [CrossRef] [PubMed]
- Kenney, A.M.; McKay, J.K.; Richards, J.H.; Juenger, T.E. Direct and indirect selection on flowering time, water-use efficiency (WUE, delta (13)C), and WUE plasticity to drought in Arabidopsis thaliana. Ecol. Evol. 2014, 4, 4505–4521. [Google Scholar] [CrossRef]
- Mitchell-Olds, T. Pleiotropy causes long-term genetic constraints on life-history evolution in brassica rapa. Evolution 1996, 50, 1849–1858. [Google Scholar]
- Zhang, D.G.; Sun, G.J.; Jiang, X.H. Donald’s ideotype and growth redundancy: A game theoretical analysis. Field Crops Res. 1999, 61, 179–187. [Google Scholar] [CrossRef]
- Ferguson, J.N.; Meyer, R.C.; Edwards, K.D.; Humphry, M.; Brendel, O.; Bechtold, U. Accelerated flowering time reduces lifetime water use without penalizing reproductive performance in Arabidopsis. Plant Cell Environ. 2019, 42, 1847–1867. [Google Scholar] [CrossRef]
Disclaimer/Publisher’s Note: The statements, opinions and data contained in all publications are solely those of the individual author(s) and contributor(s) and not of MDPI and/or the editor(s). MDPI and/or the editor(s) disclaim responsibility for any injury to people or property resulting from any ideas, methods, instructions or products referred to in the content. |
© 2023 by the authors. Licensee MDPI, Basel, Switzerland. This article is an open access article distributed under the terms and conditions of the Creative Commons Attribution (CC BY) license (https://creativecommons.org/licenses/by/4.0/).