Article

Calculation Method of Canopy Dynamic Meshing Division Volumes for Precision Pesticide Application in Orchards Based on LiDAR

1
Intelligent Equipment Research Center, Beijing Academy of Agriculture and Forestry Sciences, Beijing 100097, China
2
School of Science, China University of Geosciences, Beijing 100083, China
3
Information Technology Research Center, Beijing Academy of Agriculture and Forestry Sciences, Beijing 100097, China
*
Authors to whom correspondence should be addressed.
These authors contributed equally to this work.
Agronomy 2023, 13(4), 1077; https://doi.org/10.3390/agronomy13041077
Submission received: 10 March 2023 / Revised: 5 April 2023 / Accepted: 6 April 2023 / Published: 7 April 2023

Abstract

:
The canopy volume of fruit trees is an important input for the precise and varying application of pesticides in orchards. The fixed mesh division method is mostly used to calculate canopy volumes with variable target-oriented spraying. To reduce the influence of the working speed on the detection accuracy under a fixed mesh width division, the cuboid accumulation of divided areas (CADAs), which is a light detection and ranging (LiDAR) online detection method for a fruit tree canopy volume based on dynamic mesh division, is proposed in this paper. In the method, the area is divided according to the number of unilateral nozzles of the sprayer in the canopy height direction of the fruit tree, and the mesh width is dynamically adjusted according to the change in the working speed in the moving direction of the sprayer. To verify the accuracy and applicability of the method, the simulation canopy and peach tree canopy detection experiments were carried out. The test results show that the CADA method can be used to calculate the contour and volume of the canopy. However, detection errors easily occur at the edge of the canopy, resulting in a detection error of 8.33% for the simulated canopy volume. The CADA method has a good detection accuracy under different moving speeds and fruit tree canopy sizes. At a speed of 1 m/s, the detection accuracy of the canopy volume reaches 99.18%. Compared with the existing canopy volume calculation methods based on the alpha-shape algorithm and canopy meshing-profile characterization (CMPC), the detection accuracy of the CADA method is 2.73% and 7.22% better, respectively. This method can not only reduce the influence of the moving speed on the detection accuracy of the canopy volume, but also improve the detection accuracy. Thus, this method can provide theoretical support for the research and development of target-oriented variable spraying control systems for orchards.

1. Introduction

The prevention and control of orchard diseases mainly rely on chemical pesticides. The traditional spraying method is continuous spraying; however, this method creates pesticide waste and environmental pollution caused by excessive spraying [1]. An accurate target-oriented variable application technology for orchards is an effective way to solve the above problems. It detects the orchard target characteristic information (position, volume, leaf area density, etc.) online through a sensor system, calculates target drug demand, and regulates the variability of drug supply to achieve the on-demand application of pesticides according to target-oriented variables [2]. The detection of target feature information of fruit trees is a prerequisite for achieving precise and variable spraying. Target feature information has been detected mainly via ultrasonic sensors [3,4,5], light detection and ranging (LiDAR) [6,7], and visual sensors [8,9,10]. LiDAR detection can obtain rich target feature information, is not affected by temperature or climate, and has flexible downstream processing methods [11]. It has become the main method for detecting canopy feature information [12].
The canopy volume is the basis for the calculation of the precise variable for the spraying amount [13,14,15]. The main canopy volume calculation methods are the regular geometry method [16,17], slice method [18,19,20], alpha-shape algorithm [21], convex hull algorithm [22], and voxel simulation method [23,24,25]. The regular geometry method describes the canopy as a stack of one or more regular geometries, a method which is more suitable for regularly shaped fruit trees. The slicing method divides the canopy into equal segments horizontally or vertically. The point cloud of each part is projected onto a two-dimensional plane to calculate its contour area, combined with the cumulative calculation of the slice thickness, to obtain a complete canopy volume. This method is suitable for wall-type orchards with small spacing between fruit trees. Both the alpha-shape algorithm and the convex hull algorithm calculate canopy volume by extracting the edge points of the point cloud to form a closed envelope volume. Unlike the convex hull algorithm, the alpha shape-algorithm allows the point cloud contour to have a concave shape, but the convex contour may increase the space and cause erroneous canopy volume calculations. When calculating canopy volumes, the true value of the α parameter for one tree is not necessarily the same for other trees. Thus, the alpha-shape algorithm is more suitable for evaluating the volume of a single fruit tree and is difficult to apply to an entire orchard. The voxel simulation method is a refined regular geometry accumulation method. Its core idea is to use countless small cubes to simulate the canopy to calculate its volume. This method fully considers the internal voids of the canopy, and it performs better than the convex hull algorithm [26]; however, the accuracy of this method is affected by the size of the voxel, the calculation is complicated, and the calculation burden is large, which is not conducive to the real-time detection of the target volume in orchards.
The above canopy volume detection methods are mainly used to calculate the canopy volume of a single fruit tree. To improve the calculation accuracy of the canopy volume and meet the flow control requirements of a single sprinkler during the spraying of a target-oriented variable, the fruit tree canopy needs to be meshed. Escolà [27] divided the canopy into multiple horizontal prisms along the tree row and with the height direction as 0.1 m × 0.1 m, and the depth of each horizontal prism was computed as the distance between the two most distant points. The canopy volume was calculated as the total of the horizontal prism volumes. In dense areas, it is difficult for LiDAR to detect deeper canopy layers due to the shielding effect of leaves and the fact that the depth calculation method needs to be optimized. Cai [28] divided the canopy into a mesh, divided the mesh into sub-meshes, and calculated the mesh volume as the total volume of sub-meshes. This canopy mesh volume detection method can improve the calculation accuracy but requires two sub-mesh divisions, has a high calculation burden, and has limited practical applications. Gu [29] proposed the canopy meshing-profile characterization (CMPC) method, which divides the canopy into meshes of a fixed size, 0.1 m × 0.1 m, and forms the outer contour of the canopy by finding the thickness of the canopy at the intersection of the meshes to calculate the contour volume. The method can accurately describe the contours of irregular fruit tree canopies, but when calculating the canopy volume, its accuracy is easily affected by the LiDAR moving speed: the larger the speed is, the larger the calculation error.
The purpose of this paper is to propose a LiDAR online detection method for fruit tree canopy volume based on dynamic meshing to reduce the influence of the scanning speed on the detection accuracy of canopy volume and facilitate the establishment of a dosage control relationship between the canopy meshing and the sprayer nozzle. To evaluate the accuracy and applicability of the method, simulation canopy and peach tree canopy detection experiments were carried out, and the detection accuracy errors between the existing canopy volume detection methods and this method were compared. Our results can provide theoretical support for the research and development of a precise, target-oriented, variable spraying control system for orchards.

2. Materials and Methods

2.1. Fruit Tree Canopy Point Cloud Data Acquisition System

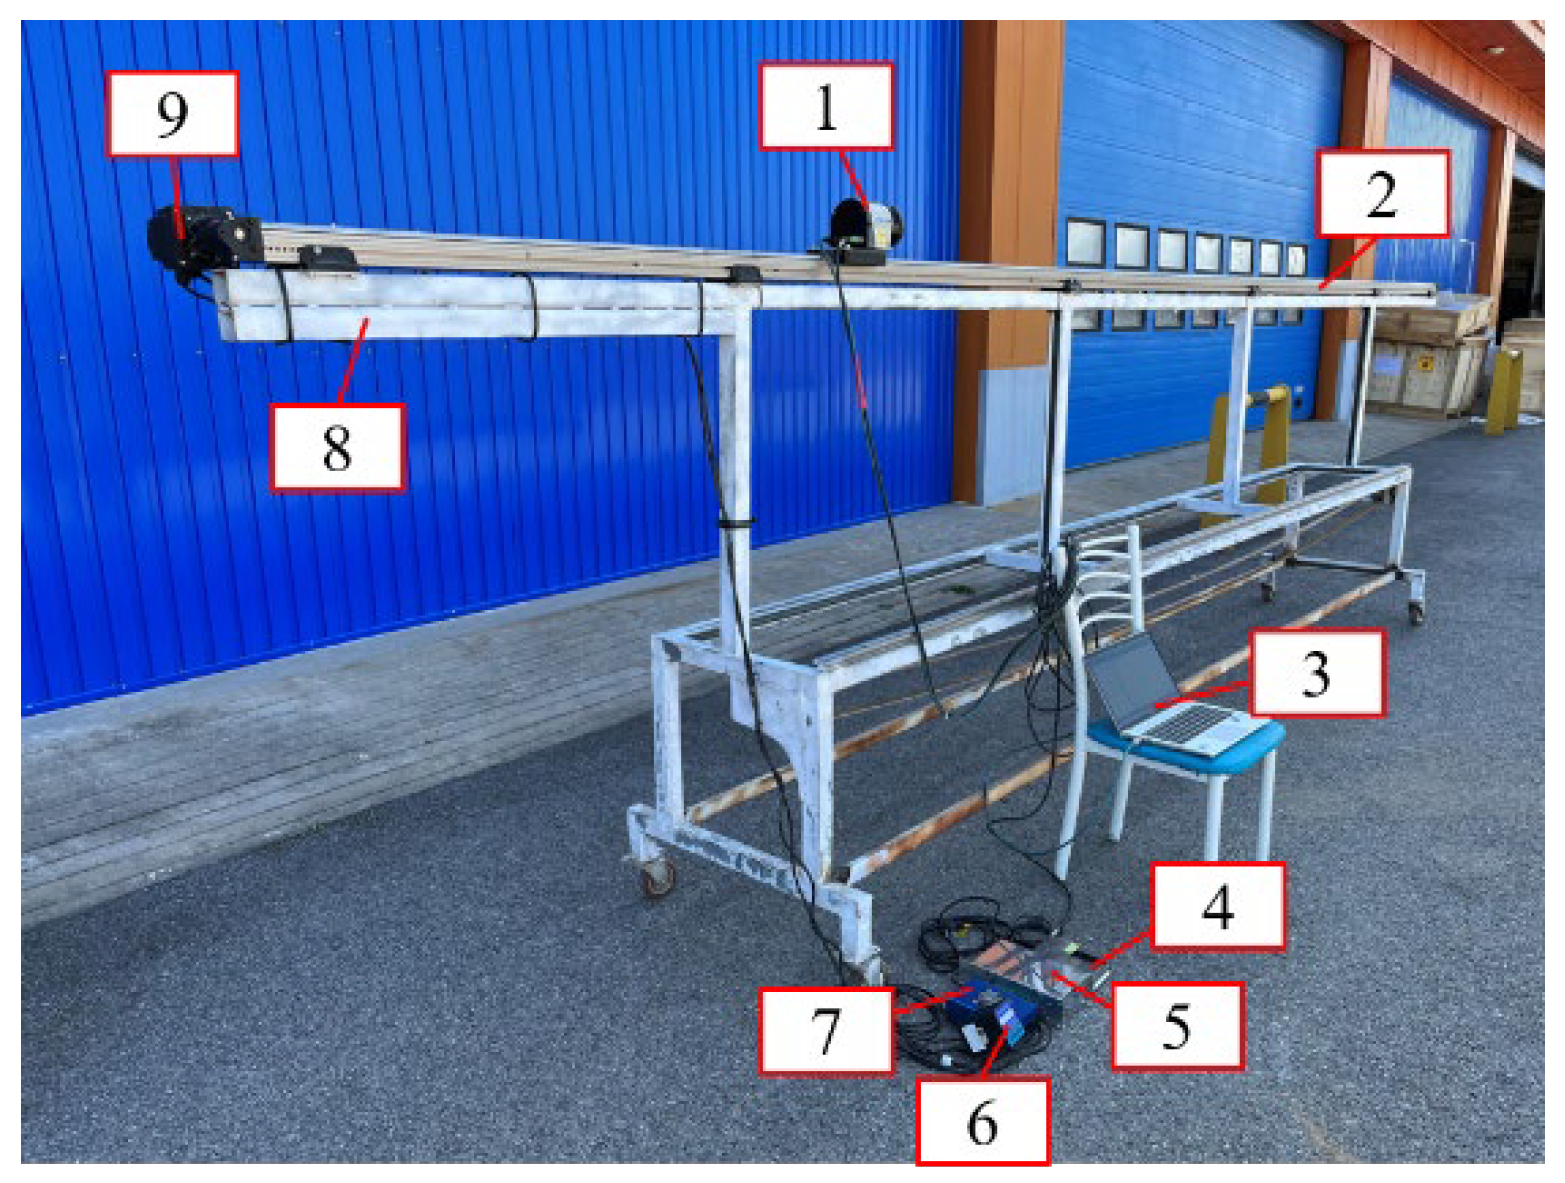
To obtain the LiDAR point cloud data of the fruit tree canopy and simulate a real spraying operation scene, a fruit tree canopy point cloud data acquisition system (Figure 1), which mainly consisted of a LMS111-10100 LiDAR, (Sick, Waldkirch, Germany), a guide rail, a laptop computer (HP ZHAN 66 Pro 14 G4), mobile platform, stepper motor (86HB250-80B), and driver (KH-Louis Martin). The basic parameters of LiDAR are shown in Table 1. The length of the slide rail is 4 m, the LiDAR device is fixed on the moving slider, and the centre of the LiDAR device is 1.6 m above the ground. During operation, the laptop is connected to the LiDAR device through the cable interface, and the moving speed of the slider is controlled by the stepper motor driver, thereby realizing the canopy scanning of fruit trees at different moving speeds.
LiDAR had a scanning frequency of 50 Hz and an angular resolution of 0.5° to continuously scan the unilateral canopy of fruit trees. The scanning frequency is the number of scans completed by LiDAR per second. There were 50 LiDAR scans per second, and each scan line contained 541 data points. The LiDAR communicates with the computer using the Ethernet port, uses SOPAS software to perform real-time visualization, records the real-time data stream, and stores it in the laptop as a .txt file.

2.2. Manual Measurement of Canopy Volume

Referring to the point net canopy (PNC) method proposed by Pagliai [30], the canopy volume was manually measured, and the half-side fruit tree was meshed, as shown in Figure 2. The mesh was arranged at a position 1.46 m away from the centre of the tree row, and the size was 0.1 m × 0.1 m. During the test, the mesh lines were first arranged on the centre plane of the tree row and the outermost plane of the canopy. Starting from the leftmost end of the canopy layer, each mesh line was marked at an interval of 0.1 m until the rightmost side of the canopy layer. The mesh plane consisted of a 0.1 m × 0.1 m mesh; then, for each mesh, we manually measured the vertical distance di between the outermost branches of all branches and leaves in the mesh and the mesh plane, using the maximum distance of 1.46 m minus di, yielding the canopy depth of each mesh. We multiplied this value by the area of the mesh (Ai = 0.01 m2), and obtained the canopy volume under a single mesh. Finally, the canopy volumes of all the meshes were added to obtain the canopy volume of the entire fruit tree, as shown in Formula (1):
V m a n u a l = i = 1 n A i × [ 1 . 46 d i ]
where V m a n u a l is the fruit tree canopy volume, m3; di is the distance between the outermost canopy and the mesh plane m; and Ai is the single mesh area in m2.

2.3. CADA Method

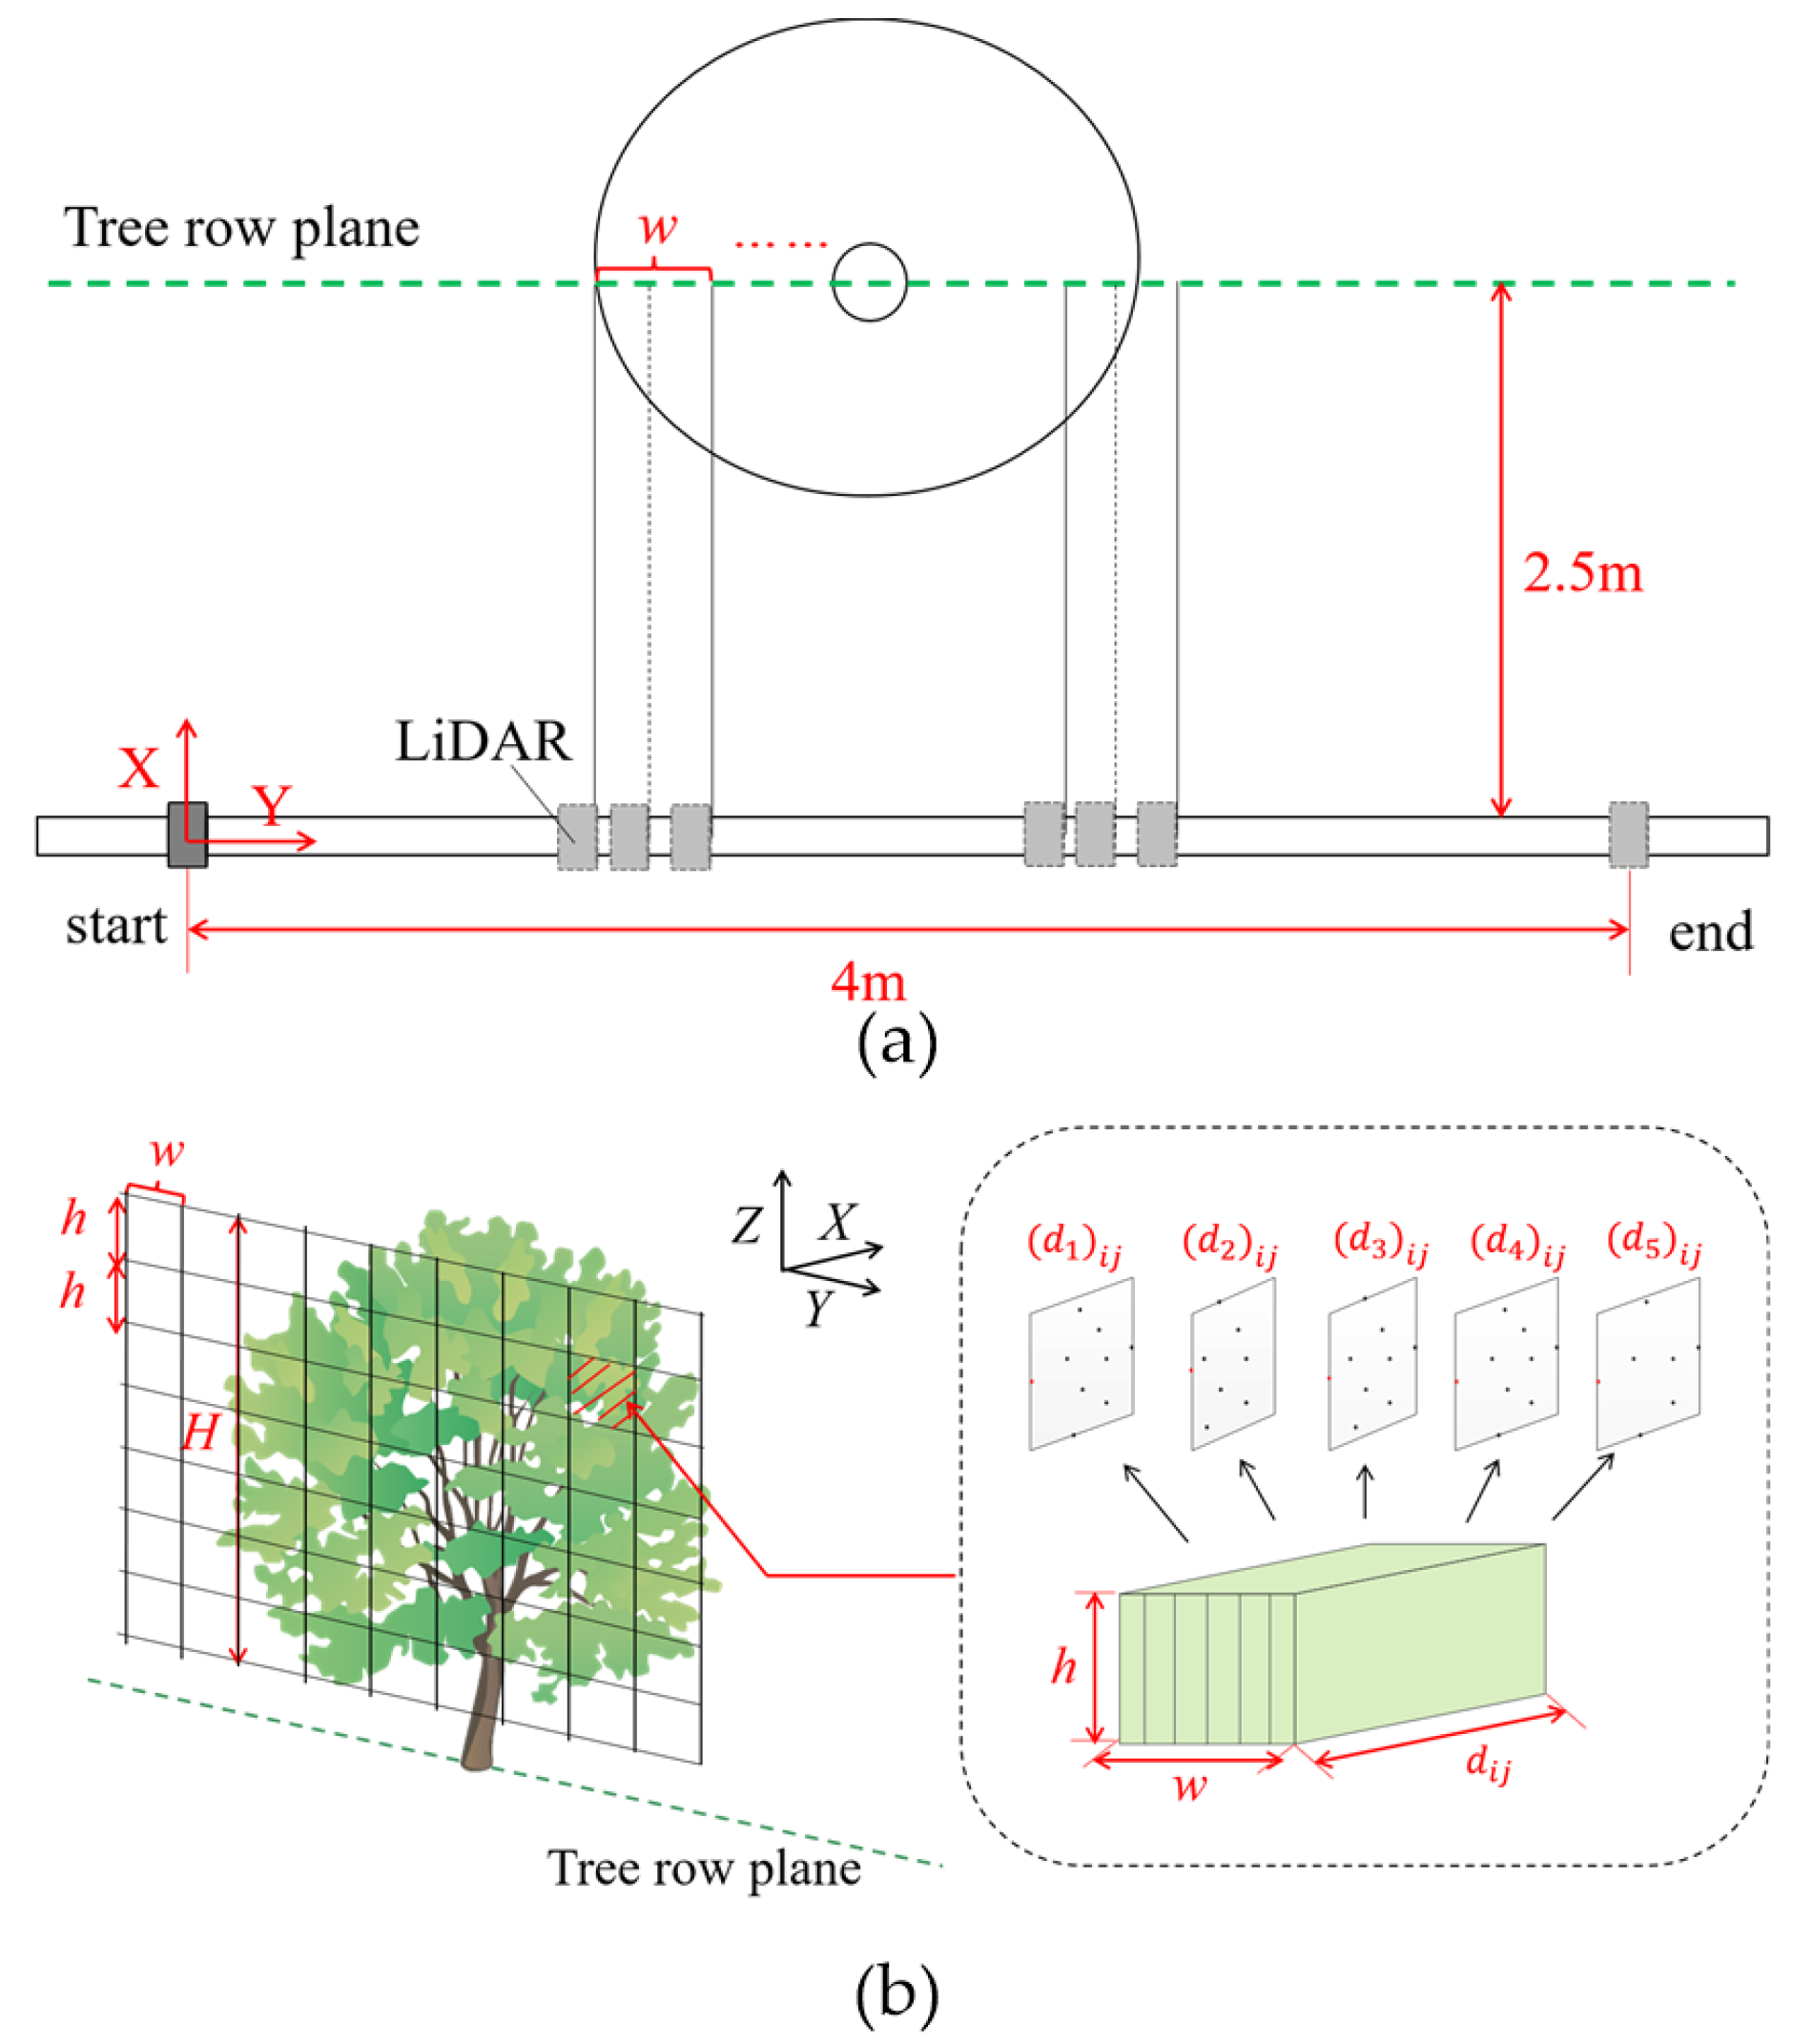
The CADA method divides the fruit tree canopy into regional meshes to establish a coordinate system with the spraying direction as the x-axis, the forward direction of the sprayer as the y-axis, and the vertical direction of the canopy as the z-axis. The specific implementation process is shown in Figure 3. The CADA method takes the plane in which the tree row (y–z plane) is located as the data plane and takes the canopy layer of the sprayed half-side of the fruit tree for mesh division. The z-axis direction is divided into m areas, which equals the number of unilateral nozzles of the orchard sprayer (m). The canopy is divided into m areas of equal height (many Chinese orchard sprayers have 5–7 unilateral nozzles, so we selected seven unilateral nozzles for mesh division) to facilitate the target-oriented variable regulation, accommodate different locations of the sprayer outlet, and provide the vertical direction of the mesh area a one-to-one correspondence. In the y-axis direction, the mesh width is divided into LiDAR scanning intervals of length k, and the mesh width changes dynamically with the operating speed.
For each mesh after area division, we detect the thickness of the canopy in the mesh, extract the point clouds of five slices at equal intervals in a single mesh, and detect the thickness of the slice point cloud. The distance between the outermost edge of the slice point cloud and the centreline of the tree row is the canopy thickness of the section. The average value of the canopy thickness of the five sections is the canopy thickness in the mesh, so the canopy in the mesh can be fitted with the length, width, and height of the mesh width, canopy thickness, and mesh height of the cuboid. The volume of the cuboid is regarded as the volume of the canopy in the mesh, and all the meshes are combined to obtain the volume of the target canopy. The canopy volume calculation equation is shown in Formula (2):
{ w = 1 f v k h = H / m d i j = 1 5 ( ( d 1 ) i j + ( d 2 ) i j + ( d 3 ) i j + ( d 4 ) i j + ( d 5 ) i j ) V L i D A R = i = 1 m j = 1 n w d i j h
where f is the scanning frequency of LiDAR, Hz; v is the moving speed of LiDAR, m/s; k is the number of LiDAR scanning intervals, positive integer; m is the number of mesh divisions in the vertical direction of the canopy; n is the mesh division in the moving direction of the sprayer number; w is the mesh width, m; dij is the canopy depth of the jth mesh in the ith area, m; (d1)ij, (d2)ij, (d3)ij, (d4)ij and (d5)ij are the canopy depths of the point clouds of five slices in the jth mesh of the ith area, m; H is the height of the canopy, m; h is the height of the mesh, m; and VLiDAR is the canopy volume, m3.

2.4. LiDAR Point Cloud Processing

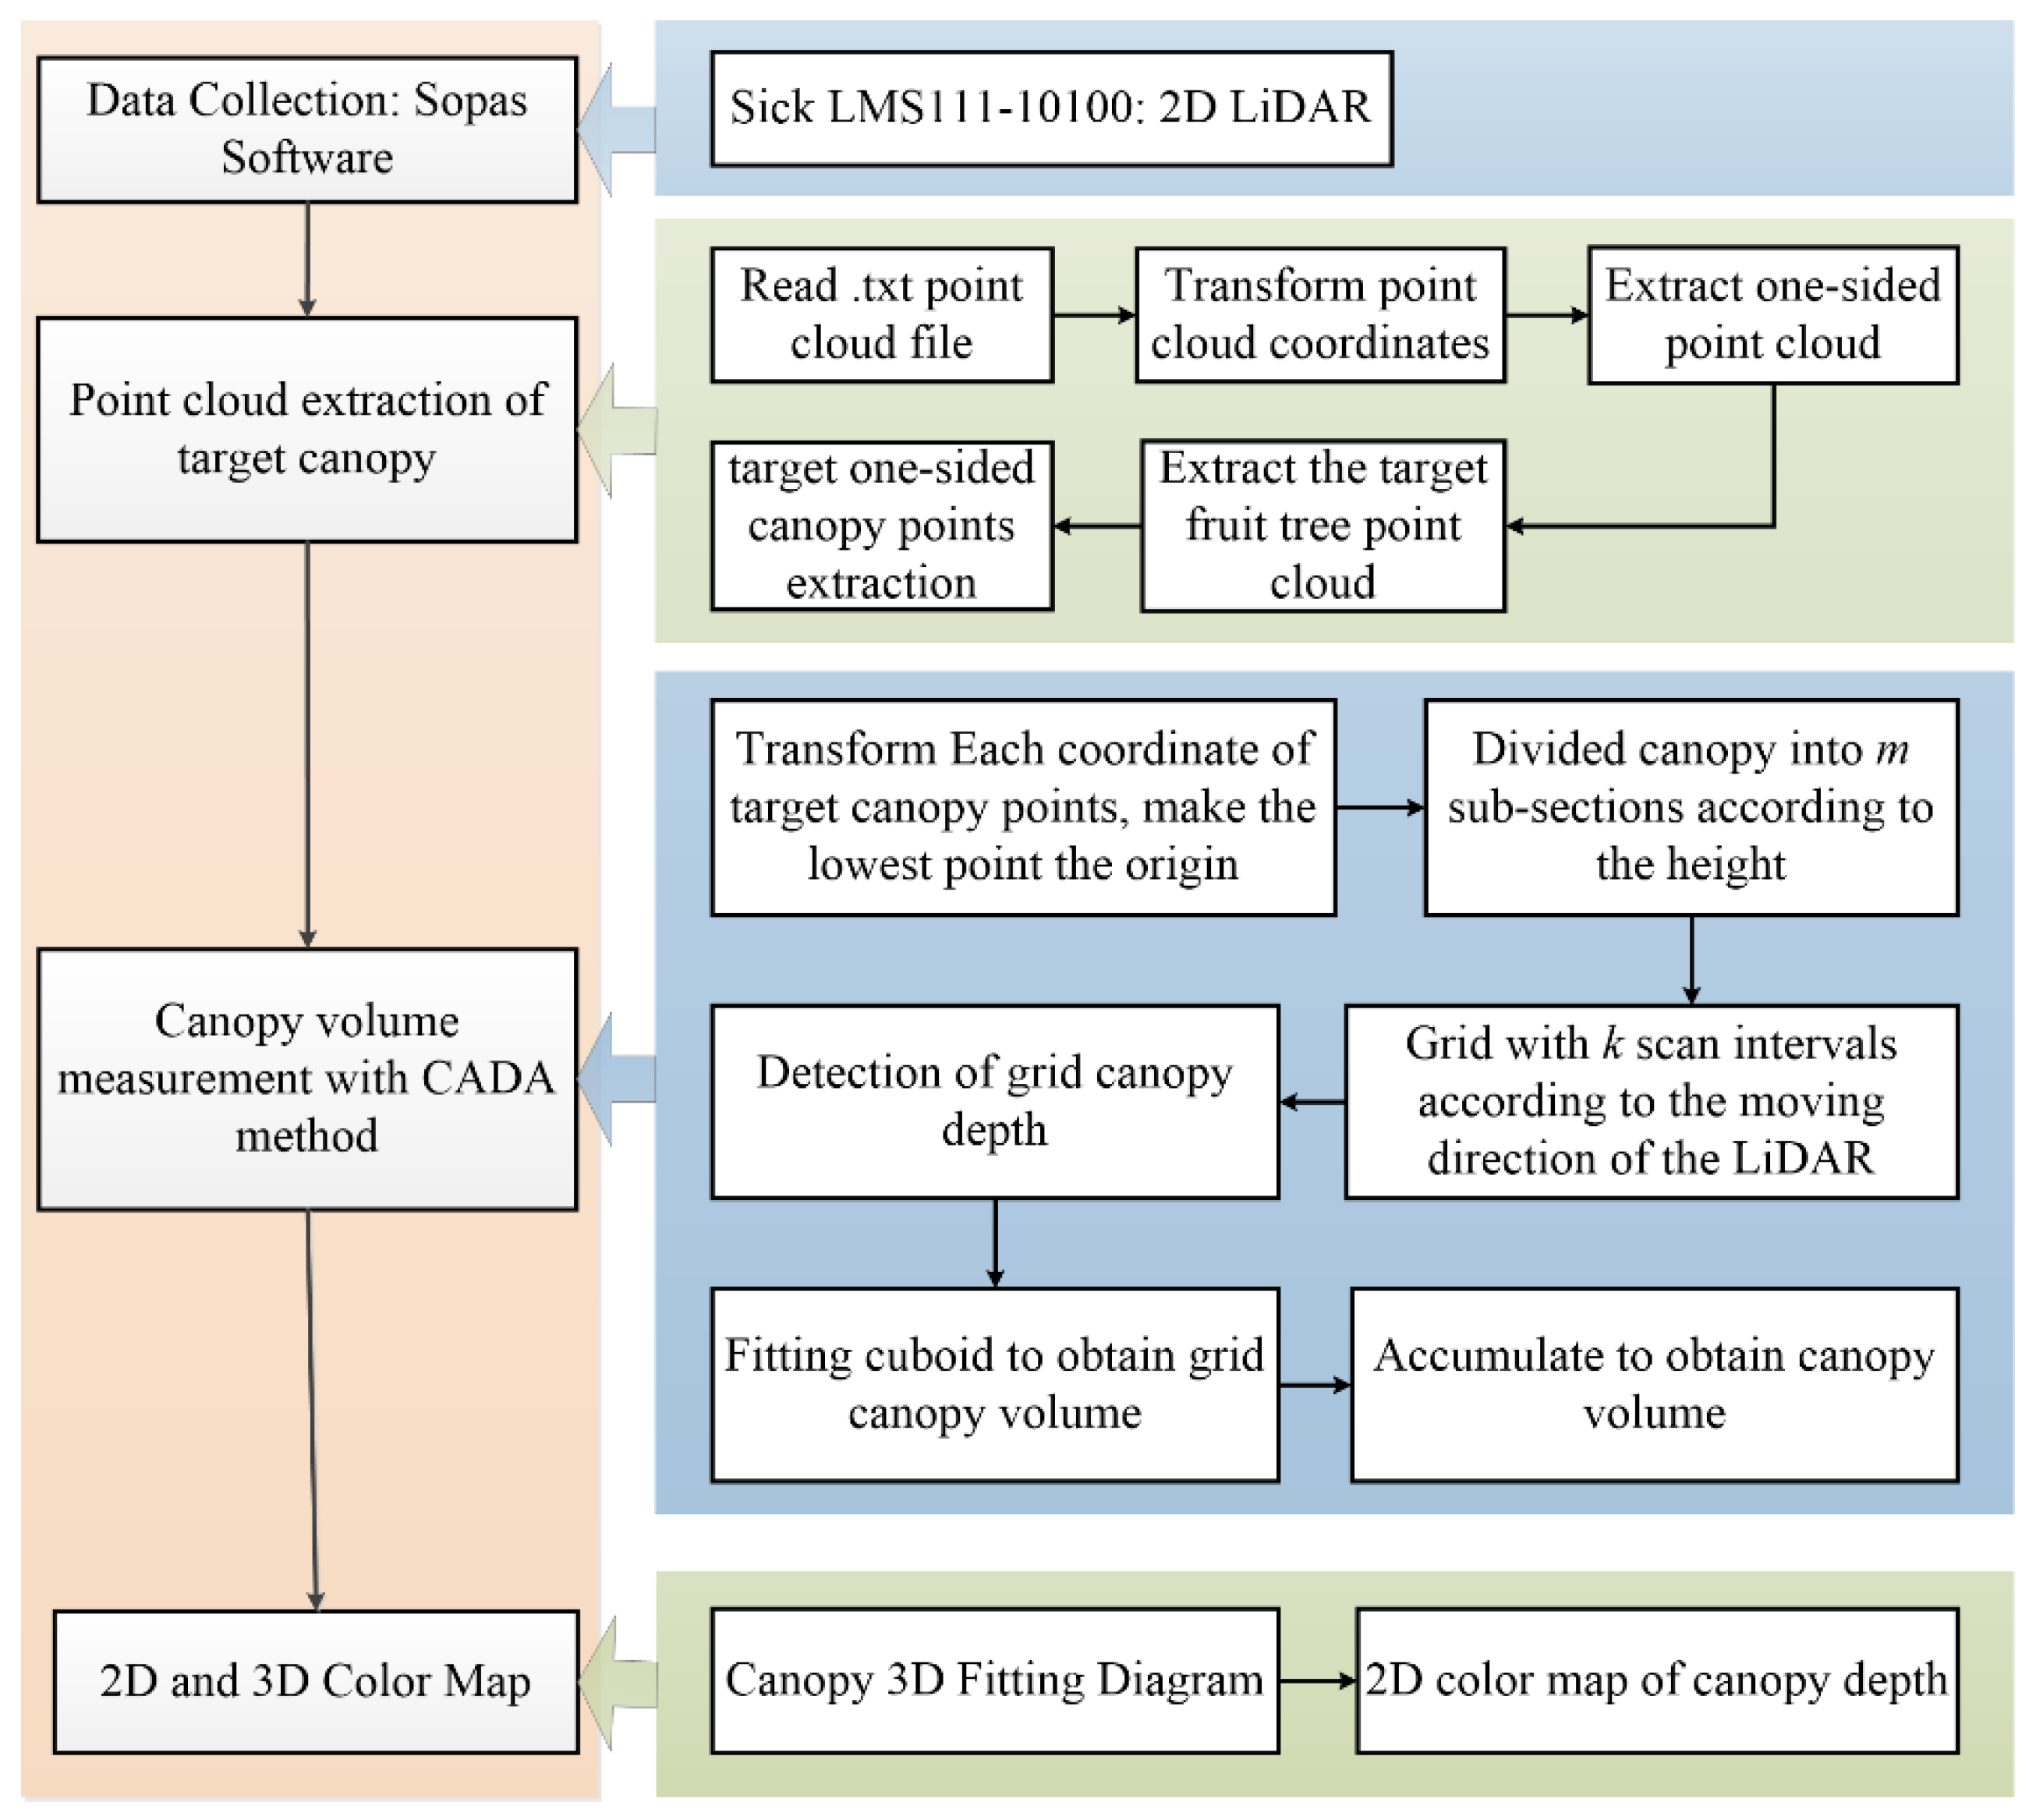
The point cloud processing process includes the extraction of the target canopy, the calculation of the canopy volume using the CADA method, and the generation of 3D and 2D color maps of the canopy thickness (Figure 4). Raw point cloud data from LiDAR scans were processed using MATLAB (R2021a, MathWorks Inc., Natick, MA, USA). By converting polar coordinates to Cartesian coordinates, pesticide application is usually carried out on one side of the orchard canopy; therefore, points beyond the horizontal stretch between the LiDAR device and the tree trunk (x > 2.5 m) are excluded from the dataset, and a region of interest is drawn to extract the target canopy point cloud. Setting the lowest point of the point cloud as the origin of the coordinate system, the coordinates of the point cloud are translated and transformed. The transformed canopy point cloud is meshed with the CADA method, and the volume is calculated. Finally, the bar3h() function and the imagesc() function are used to generate 3D and 2D color maps of the canopy depth.

2.5. Experimental Design of the Simulated Canopy

To simulate the canopy structure of the fruit tree, the simulated canopy was designed with a carton (Figure 5). The simulated canopy consists of 40 cartons of 0.3 m × 0.2 m × 0.1 m stacked into seven layers, each of which has the same height. The thickness of the first and second layers is 0.6 m, the thickness of the third and fourth layers is 0.4 m, the other thicknesses are 0.2 m, and the artificial canopy volume is 0.24 m3. During the test, the fruit tree canopy point cloud data acquisition system was placed at the innermost 2.5 m from the simulated canopy, and the control LiDAR moved at 1.0 m/s. The fruit tree canopy point cloud data were obtained based on LiDAR, and the simulated canopy volume was calculated based on the CADA method, which was compared with the manual measurement value to evaluate its detection accuracy.

2.6. Orchard Experimental Design

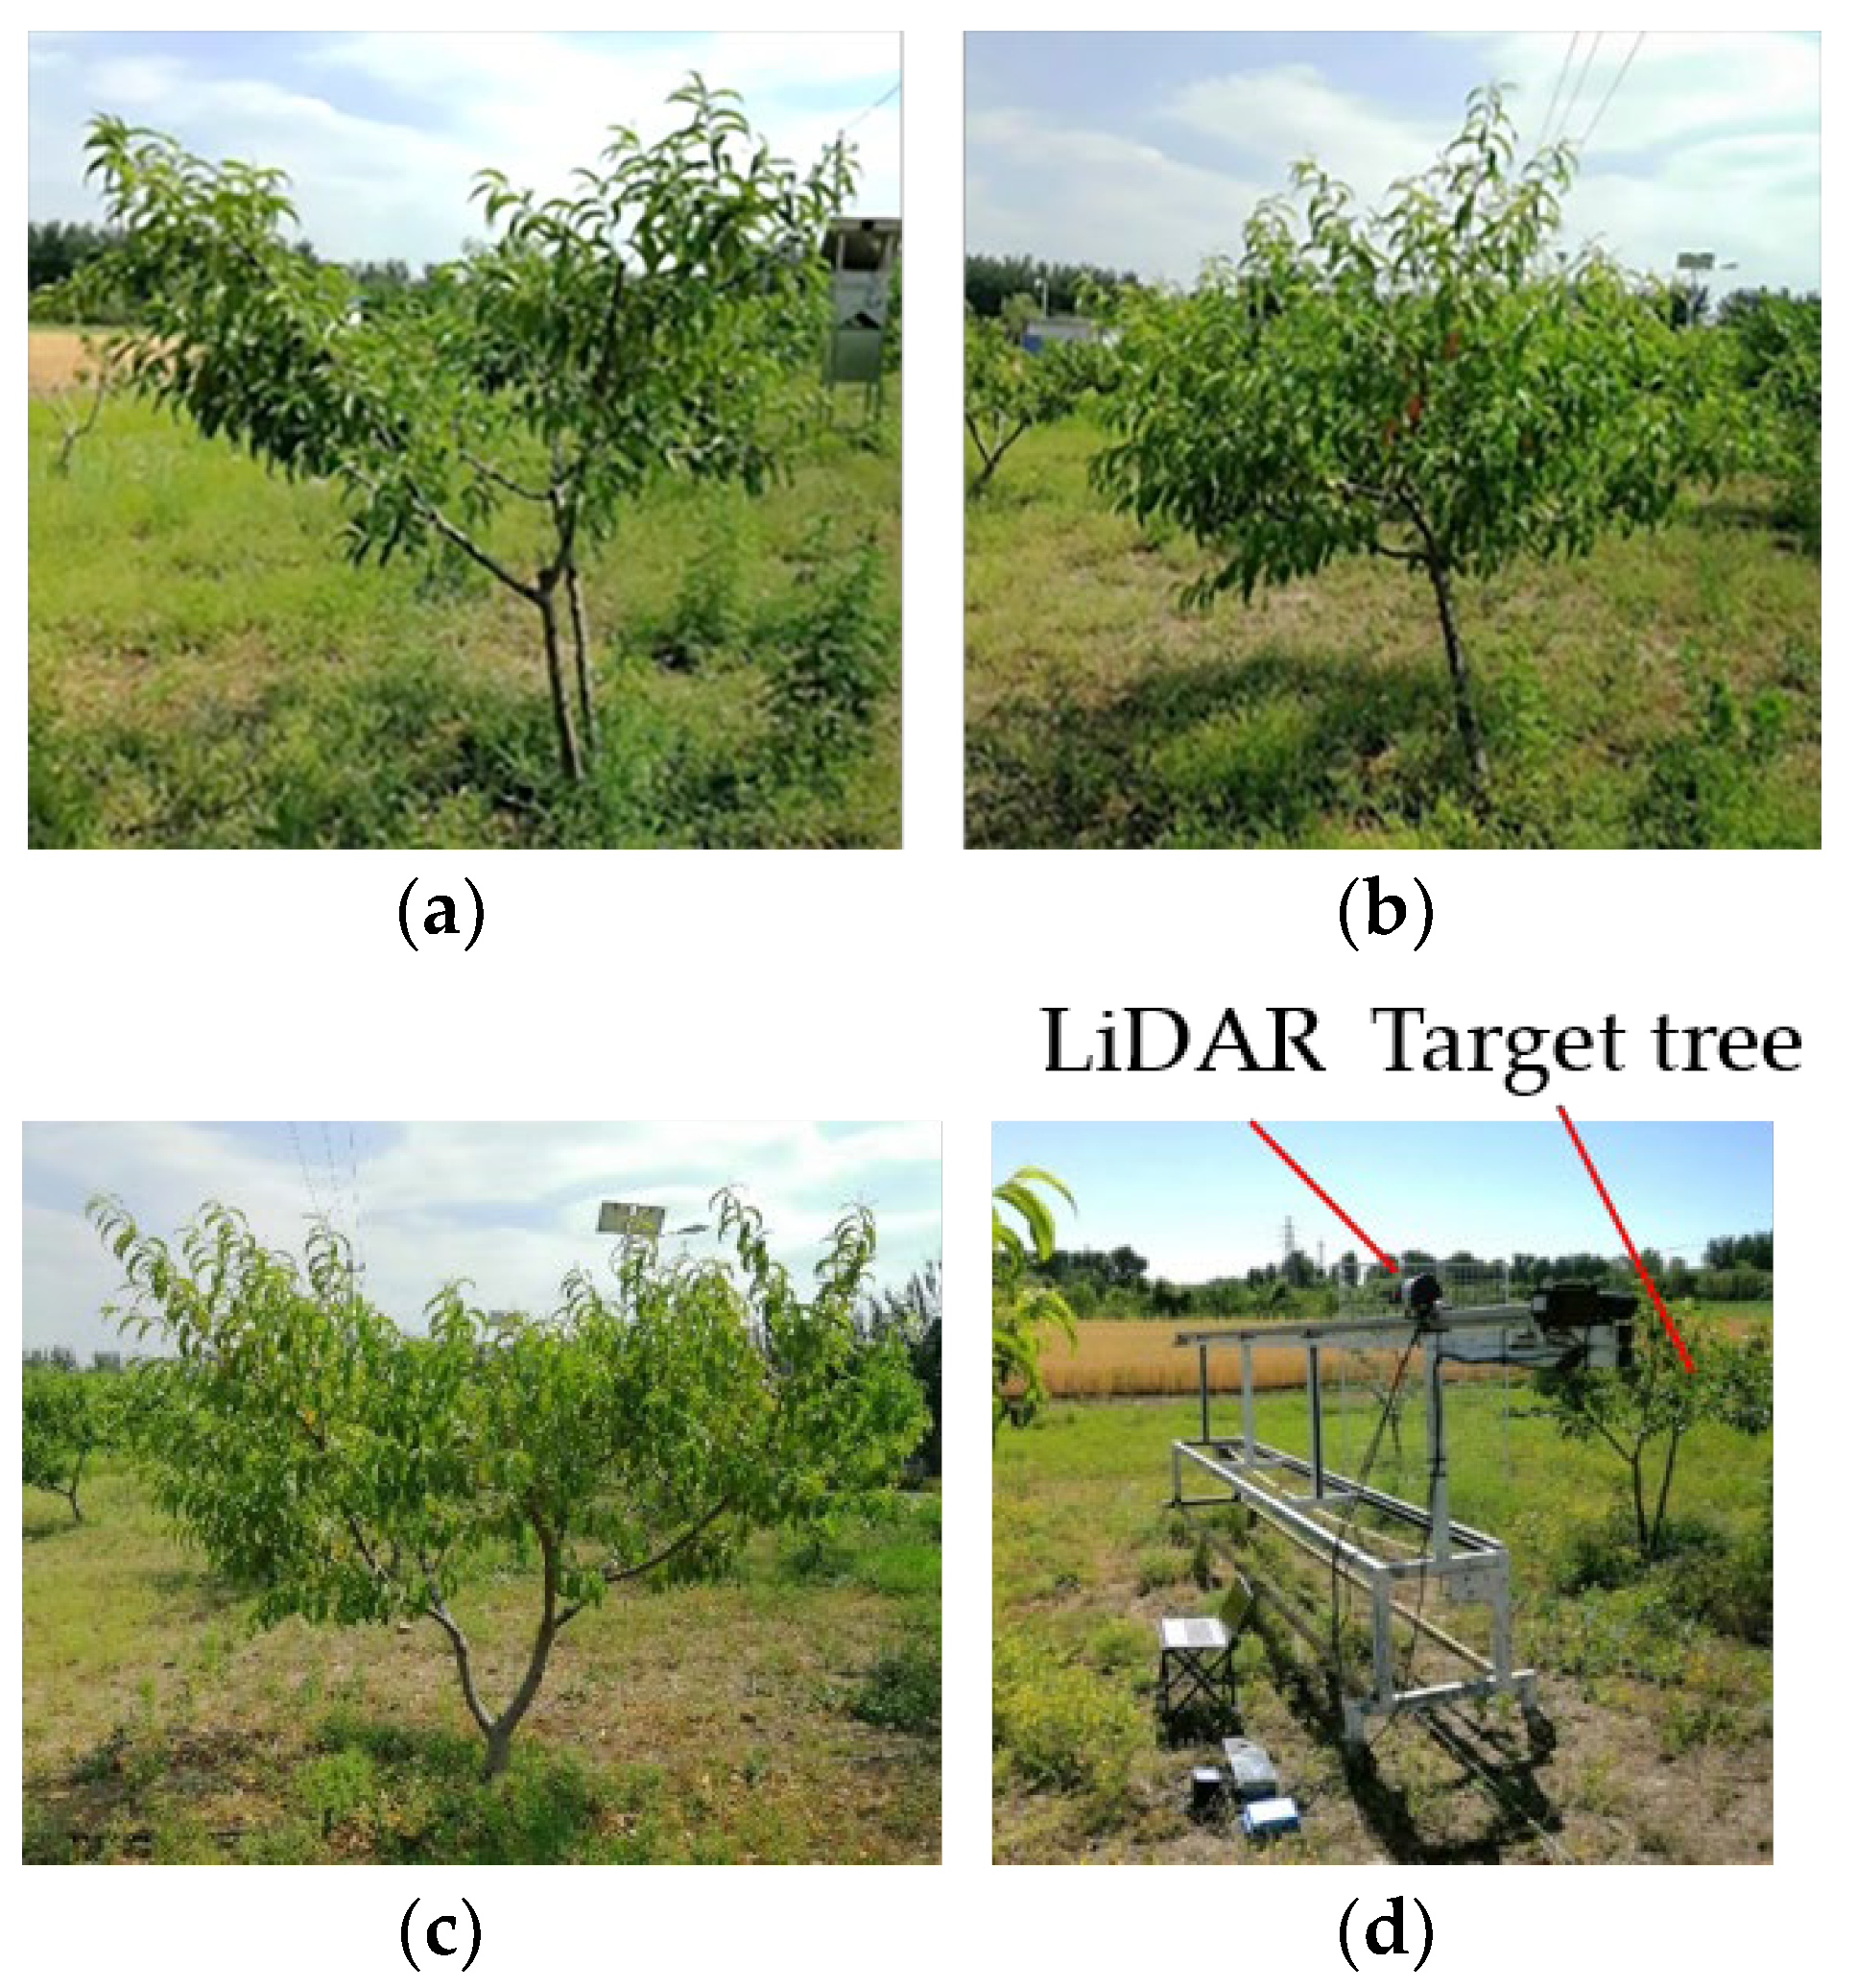
The test was carried out at the Xiaotangshan National Demonstration Base for Precision Agriculture Research (longitude 116° E, latitude 40° N) in Changping District, Beijing, on 5 June 2022. The climatic conditions were cloudy, and the temperature was 18–34 °C with a northwest wind speed of between 1 m/s–2 m/s. Three consecutive fruit trees with different growth shapes and sizes in the same tree row were selected as the detection objects. The fruit trees were 6-year-old peach trees, the spacing between the rows was 5 m, and the spacing between the plants was 4 m. The canopy size of the fruit tree is shown in Table 2, and the test fruit tree is shown in Figure 6. The canopy of Tree 1 was smallest, and its internal branches forked to produce large gaps. The canopy of Tree 2 grew evenly, its body was small, and it had no protruding branches or leaves. The inside of the canopy of Tree 3 grew evenly, without obvious gaps, with a larger body and prominent branches and leaves at the top of the canopy.
During point cloud data collection, LiDAR was detected at a distance of 2.5 m from the centreline of the tree row with a constant scanning frequency and angular resolution, and the mobile platform was always parallel to the tree row. The target-oriented variable of the spraying speed in orchards is usually 1 m/s [30]. The slower the LiDAR moving speed is, the greater the density of the acquired point cloud, and the more detailed the detected canopy contour. In this experiment, the LiDAR was controlled to collect canopy point clouds at speeds of 0.6 m/s, 0.8 m/s, and 1 m/s. The process was repeated four times for each detection speed. Before point cloud collection, the mesh lines were removed to prevent the mesh lines on the outer edge of the canopy from affecting the canopy. The effect of depth probing left only the two mesh lines at the centre and outer edge of the tree row at the bottom of the canopy as markers for point cloud processing.

3. Results and Analysis

3.1. Analysis of Simulation Canopy Detection

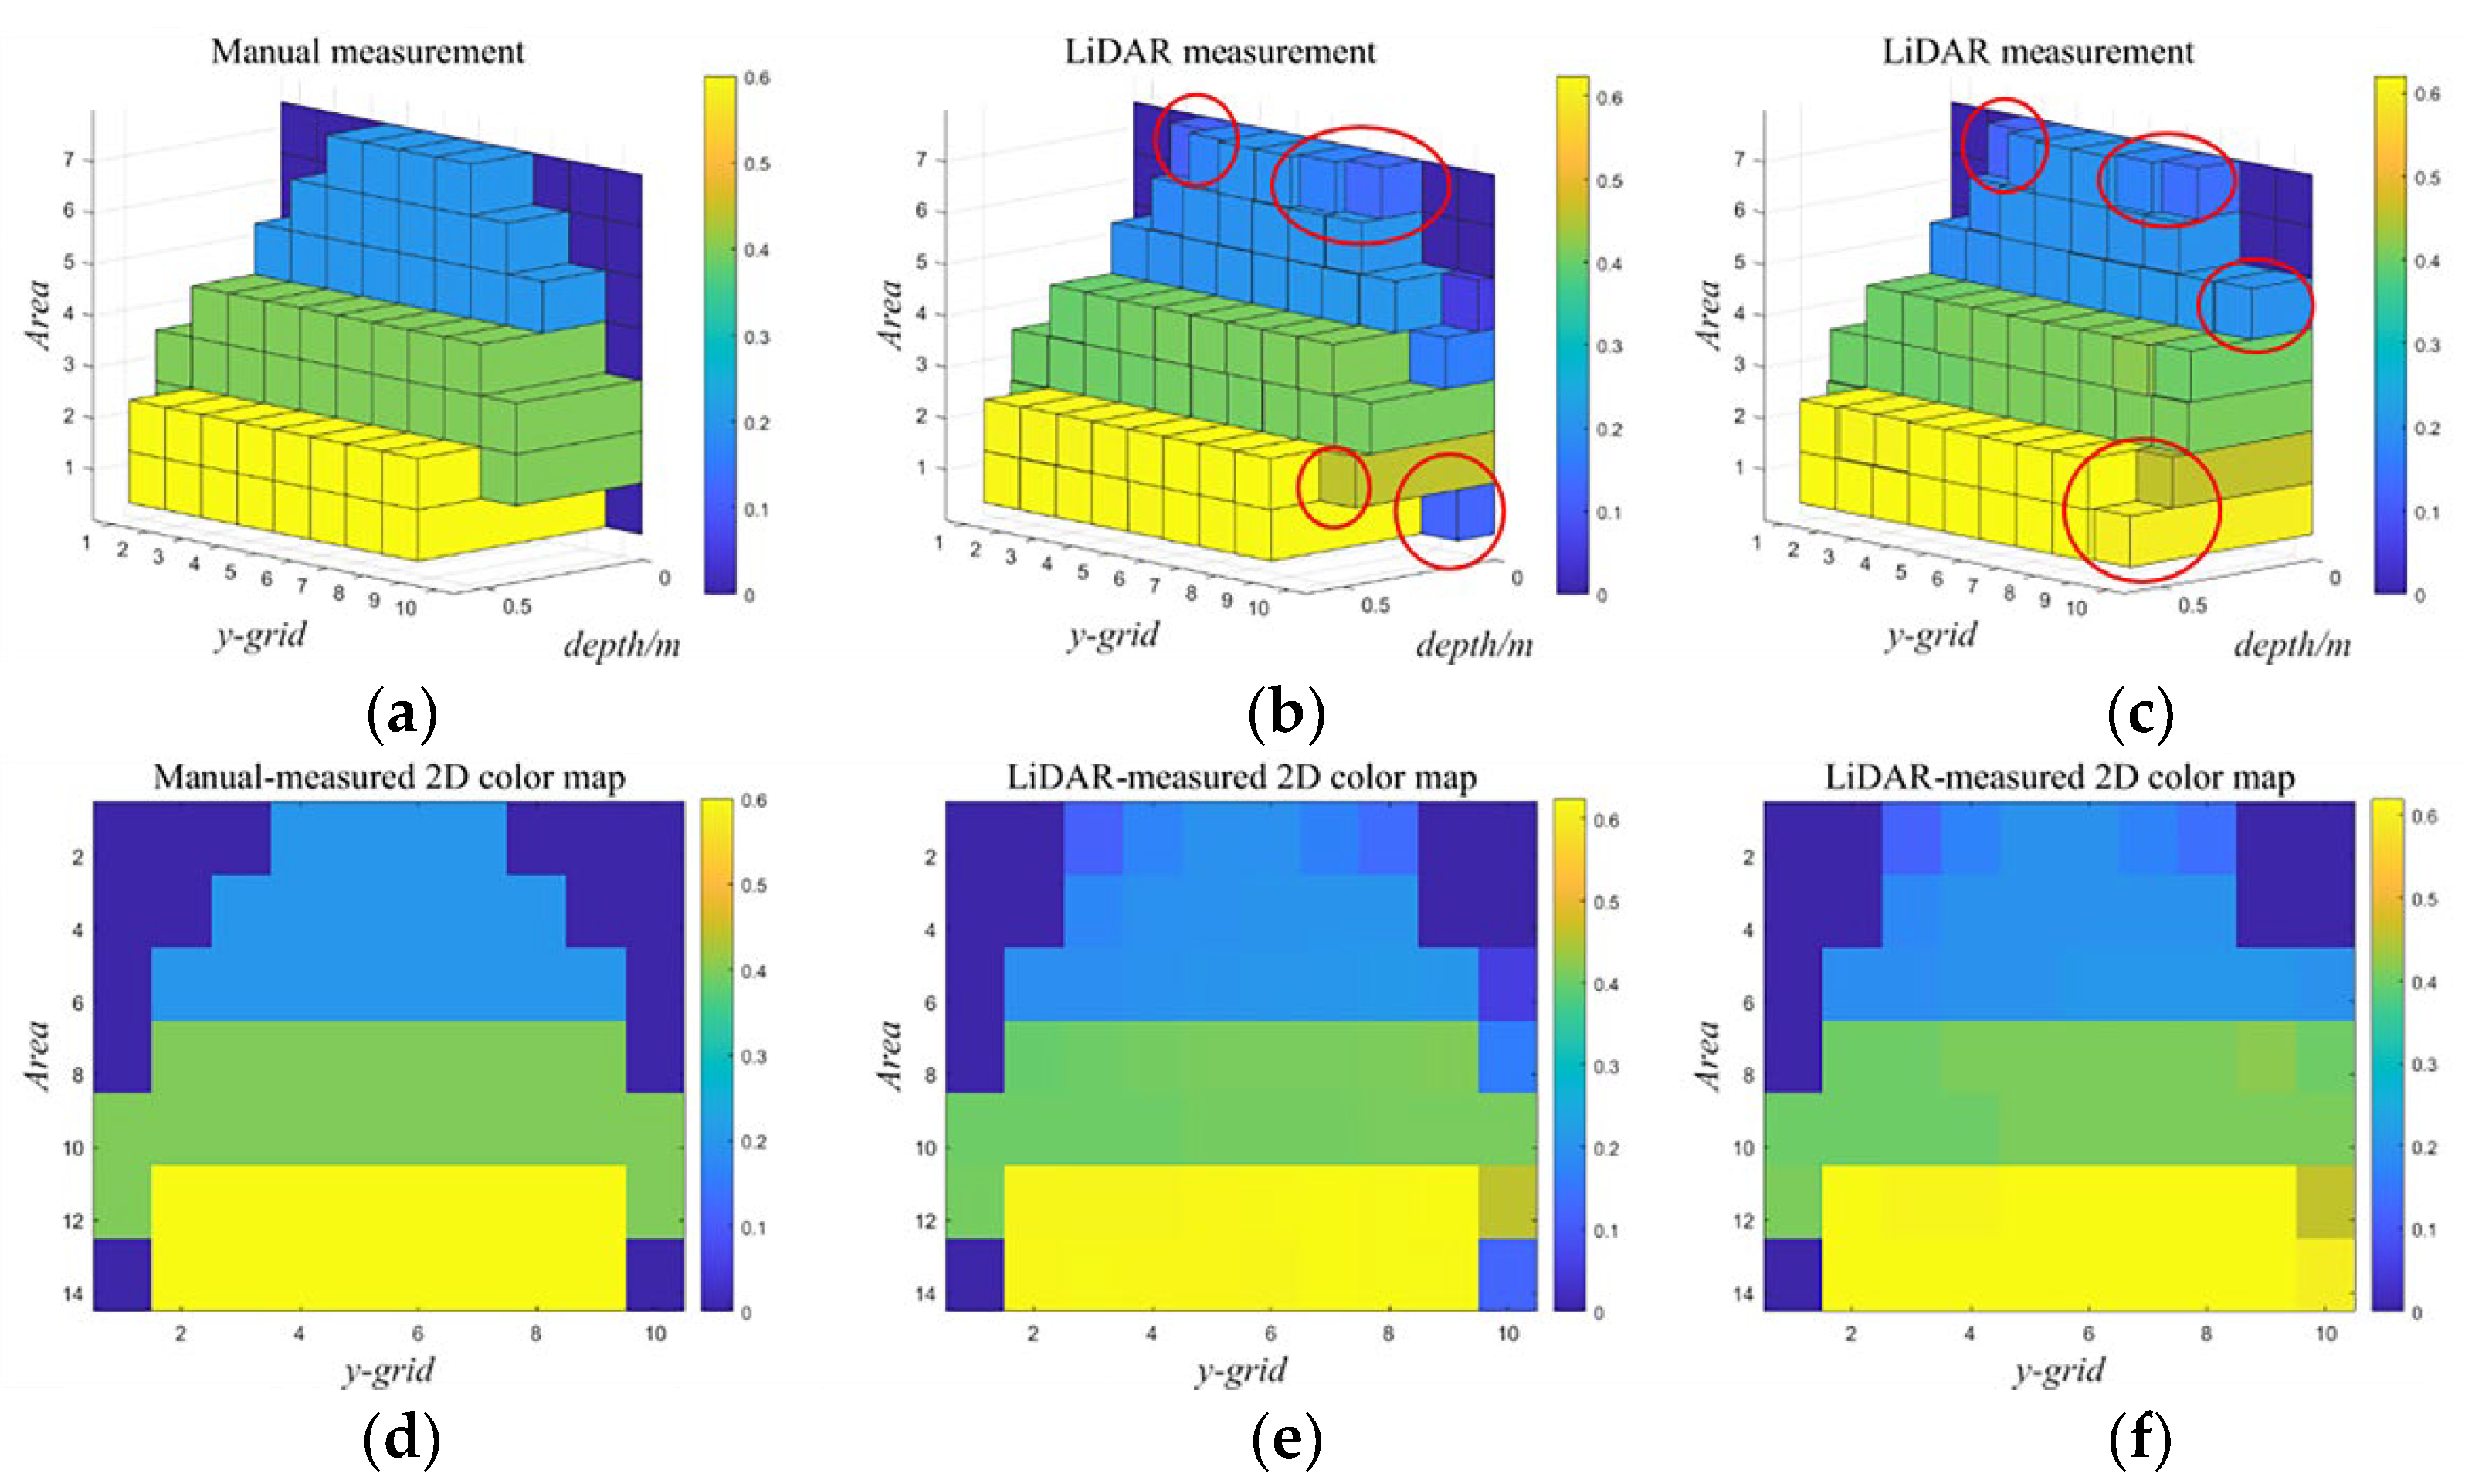
The real value of the simulated canopy volume and the value calculated using the CADA method were compared and analysed, as shown in Figure 7. The colour bar represents the canopy depth according to different numerical values in these maps. Moreover, the darker the colour is, the thinner the canopy. From the test results, the CADA method can simulate the canopy contour well, but the measured values and the detection values of some mesh positions appear too large or too small at positions where there is no carton at the edge of the simulated canopy (position in the red circle in Figure 7b). The calculated value of the simulated canopy volume using the CADA method is 0.26 m3, and the detection error is 8.33%.
To further analyse whether the edge position detection error is caused by extracting the point cloud of five slices at equal intervals in a single mesh and taking their average depth as the canopy depth, the maximum depth of the point cloud in a single mesh along the spray direction is set as the canopy depth (Figure 7c). It can be seen that there are similar problems, and the calculation error of the simulated canopy volume increases by 7.5% (Table 3). This shows that the detection error of the simulated canopy edge position is not caused by taking the average depth of five slices as the canopy depth of a single mesh, and the average value method reduces the edge position detection error and improves the detection accuracy of the simulated canopy volume.

3.2. Influence of the Horizontal Mesh Division on the Detection Accuracy of the CADA Method

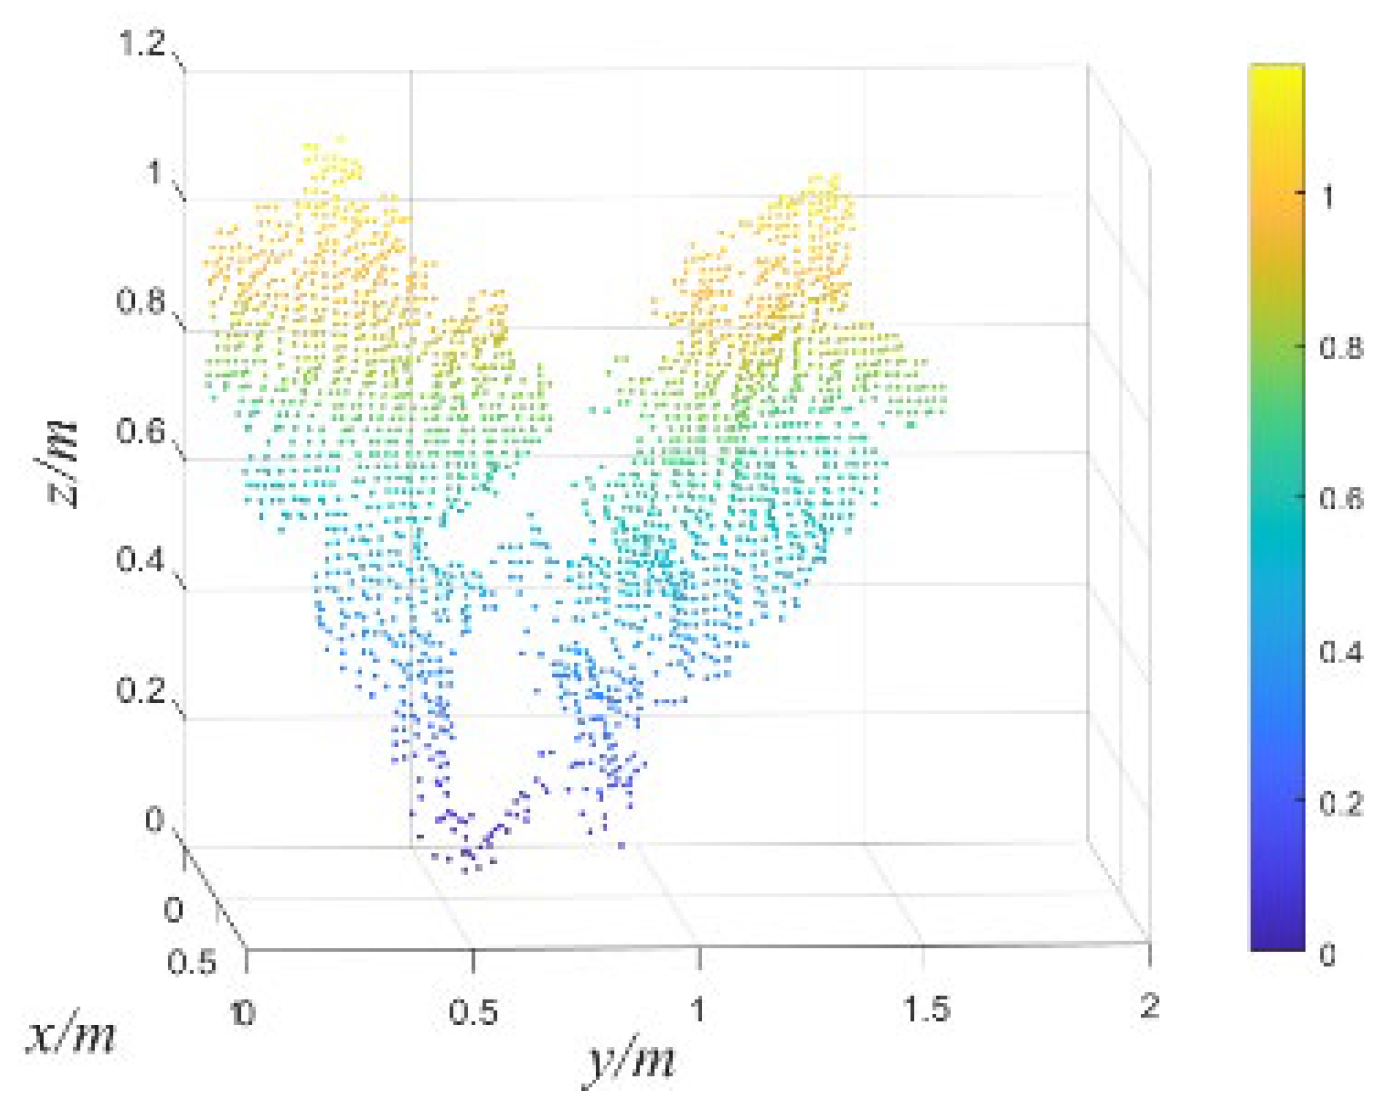
By analyzing the obtained canopy LiDAR point cloud data, the canopy contour of Tree 1 is generated (Figure 8). The colour bar represents the canopy height according to different numerical values. The lighter the colour is, the higher the height. Taking the measured value of the PNC method as the reference value, when the LiDAR scanning k value is 2, 4, 6, or 8, the detection error of the CADA method is as given in Table 4. The experimental results show that as the LiDAR scanning interval increases, the detection value of the fruit tree canopy volume first decreases and then increases. When k = 6, the canopy volume detection error is the smallest, at 0.82%; when k = 8, the measurement error is the largest, at 35.28%.
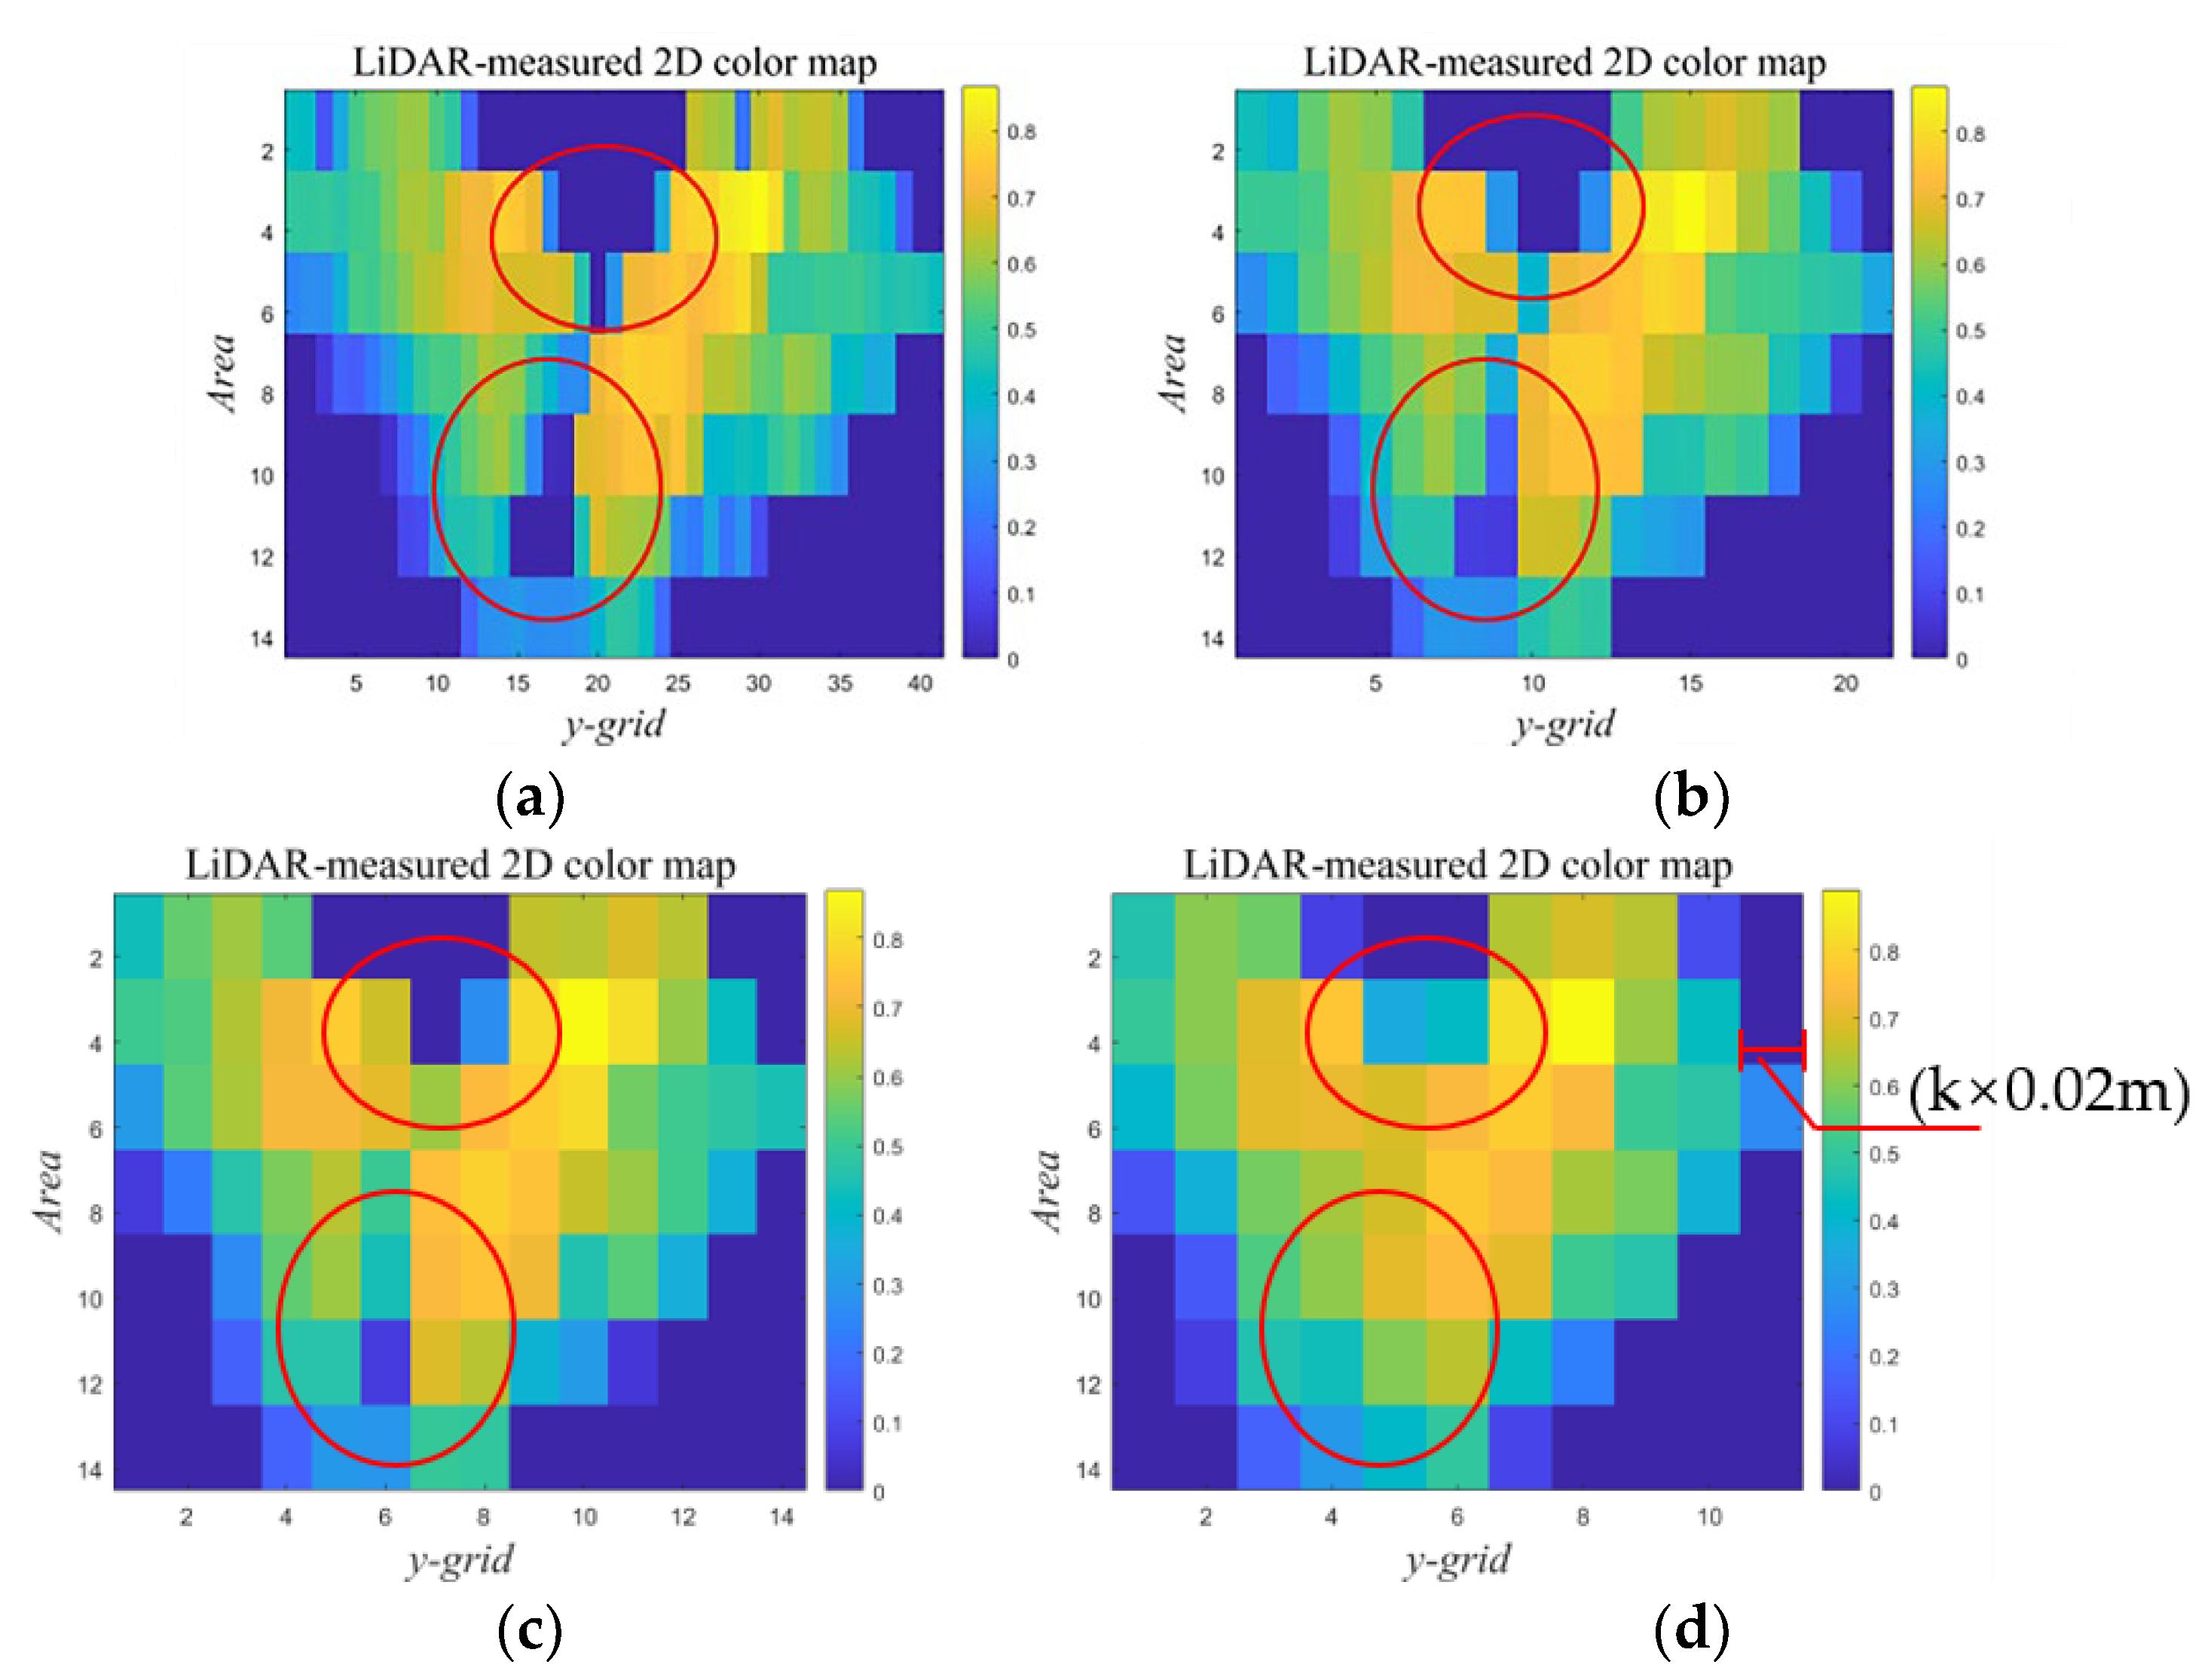
MATLAB software was used to generate a 2D canopy depth color map (Figure 9). The canopy of Tree 1 is divided into 41, 21, 14, and 11 meshes in the horizontal direction, and the four mesh widths can clearly obtain the outline of the fruit tree canopy. The division of the canopy becomes increasingly finer, and the fitted mesh cuboid becomes increasingly discrete (the red circle in Figure 9). The larger the mesh width is, the more canopy point clouds are contained in the mesh and the larger the error of the canopy mesh volume value calculated using the CADA method is. For example, when k = 8, the voids inside the canopy participate in the measurement of the mesh volume, resulting in a larger volume measurement than the true value. When k = 6, the canopy is reasonably divided, and the gap between the branches and leaves of the canopy has little effect on the volume detection results. Based on the above analysis, at a moving speed of 1.0 m/s, the CADA method for meshing at 0.12 m in the horizontal direction has a better detection effect.

3.3. Influence of the Moving Speed on the Detection Accuracy of the CADA Method

Dynamic meshing was performed at six LiDAR scanning intervals. Table 5 reports the number of point clouds, canopy height, canopy width, and relative error of the canopy volume calculated using the CADA method when the LiDAR scanning speeds are 0.6 m/s, 0.8 m/s, and 1.0 m/s, respectively. The effect of using the CADA method to measure canopy data collected four times has a small difference. The results show that with an increasing moving speed, the number of point clouds obtained by LiDAR decreases; the canopy height value and amplitude value obtained via point cloud calculation are similar to each other.
As the moving speed of LiDAR increased, the measurement error of the CADA method first increased first and then decreased. Thus, the detection error was the largest at 0.8 m/s. Compared with the canopy volume calculation with a fixed mesh width of 0.1 m, the canopy volume detection errors were reduced by 19.86%, 0.07%, and 6.97% at moving speeds of 0.6 m/s, 0.8 m/s, and 1.0 m/s, respectively. This result showed that the CADA method could reduce the influence of the LiDAR moving speed on the detection accuracy of the canopy volume.

3.4. Applicability of the CADA Method to Different Types of Canopies

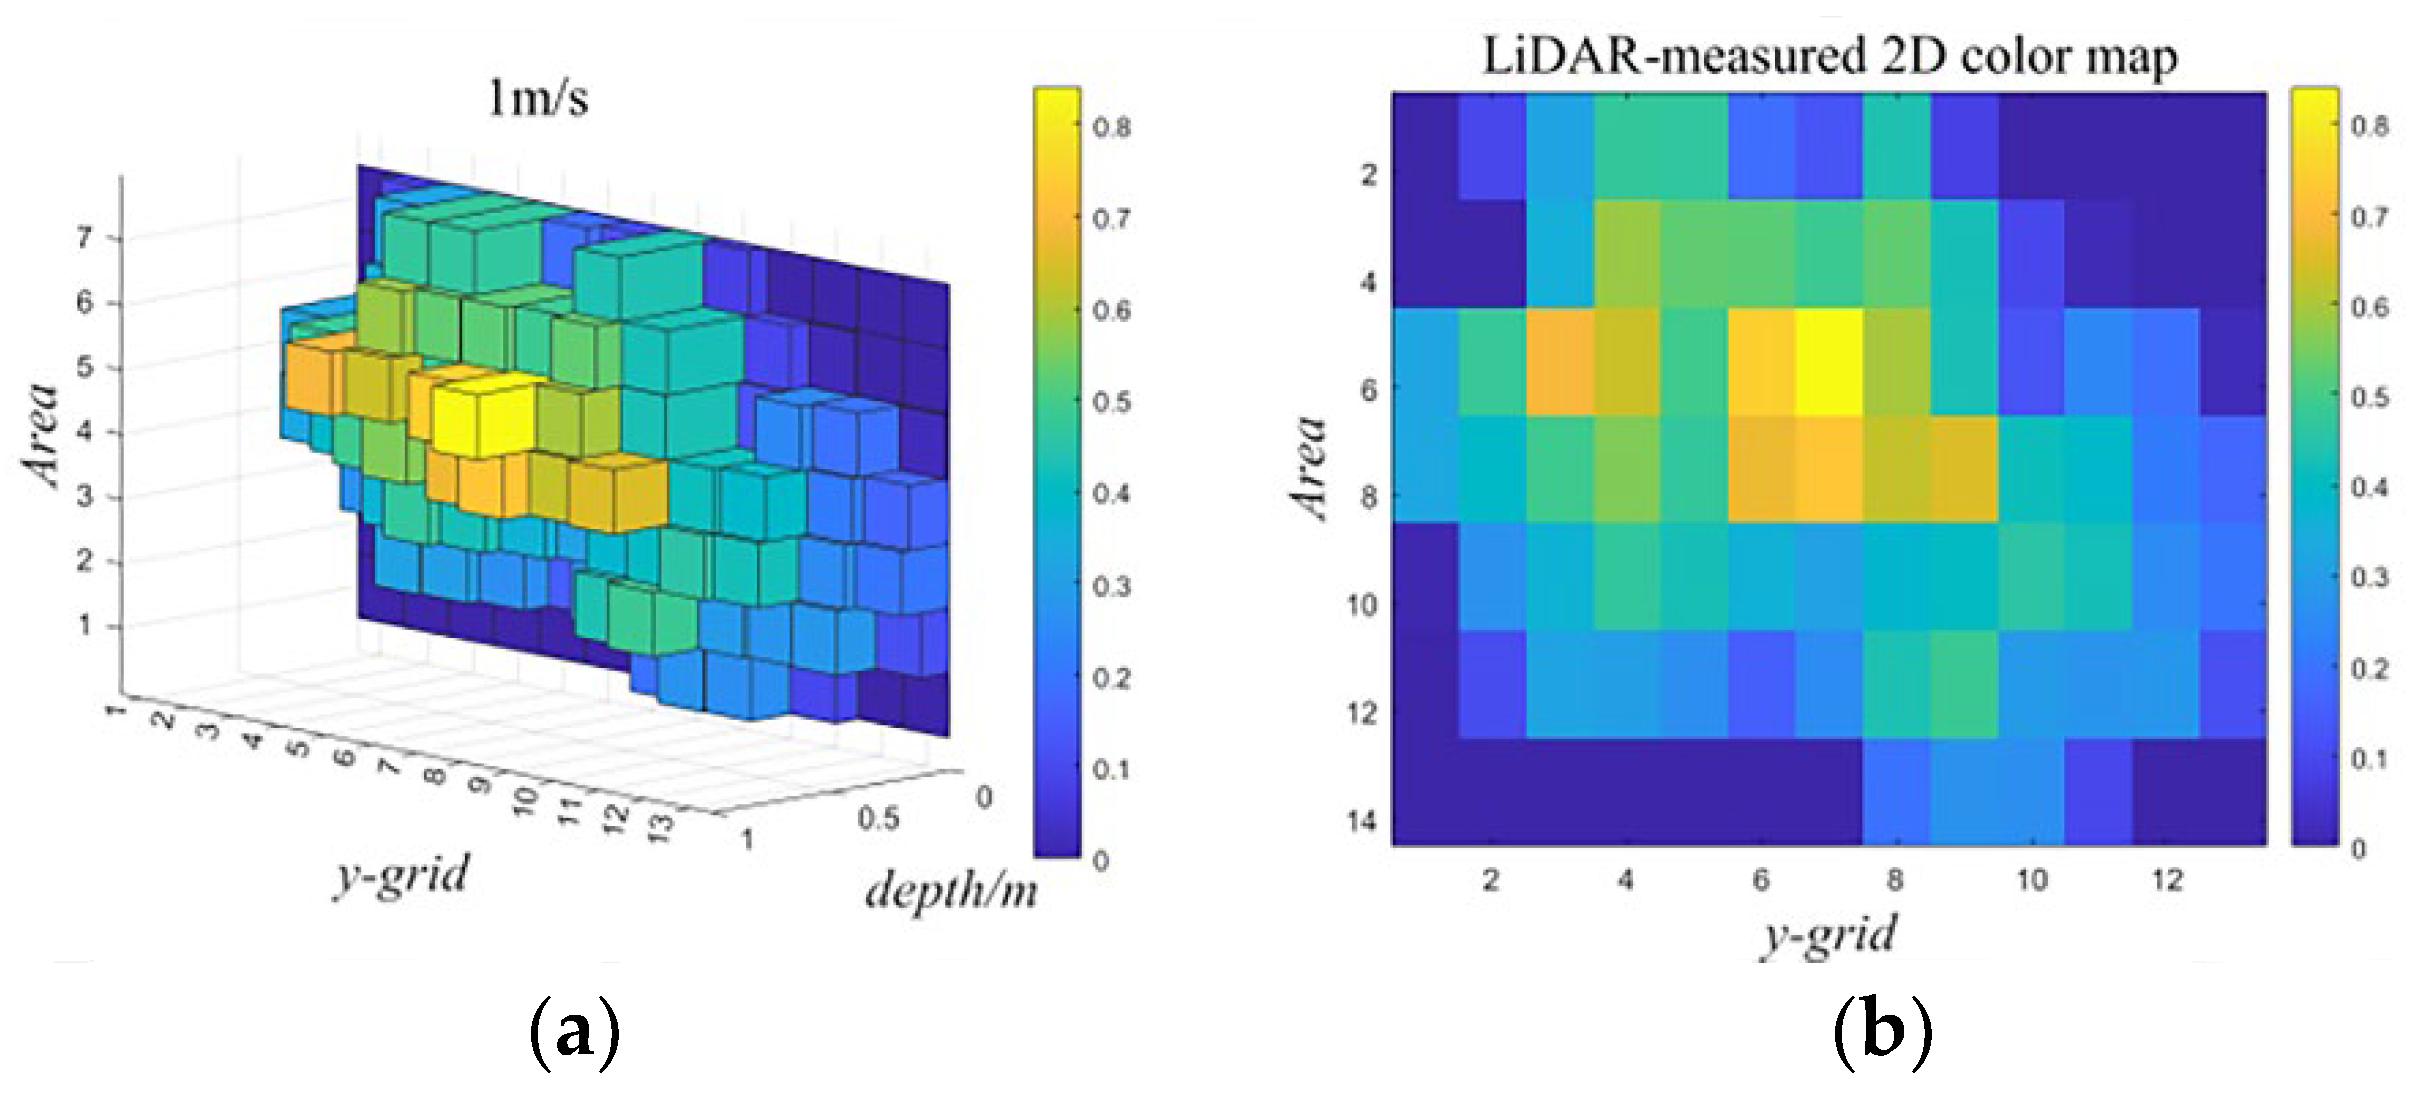
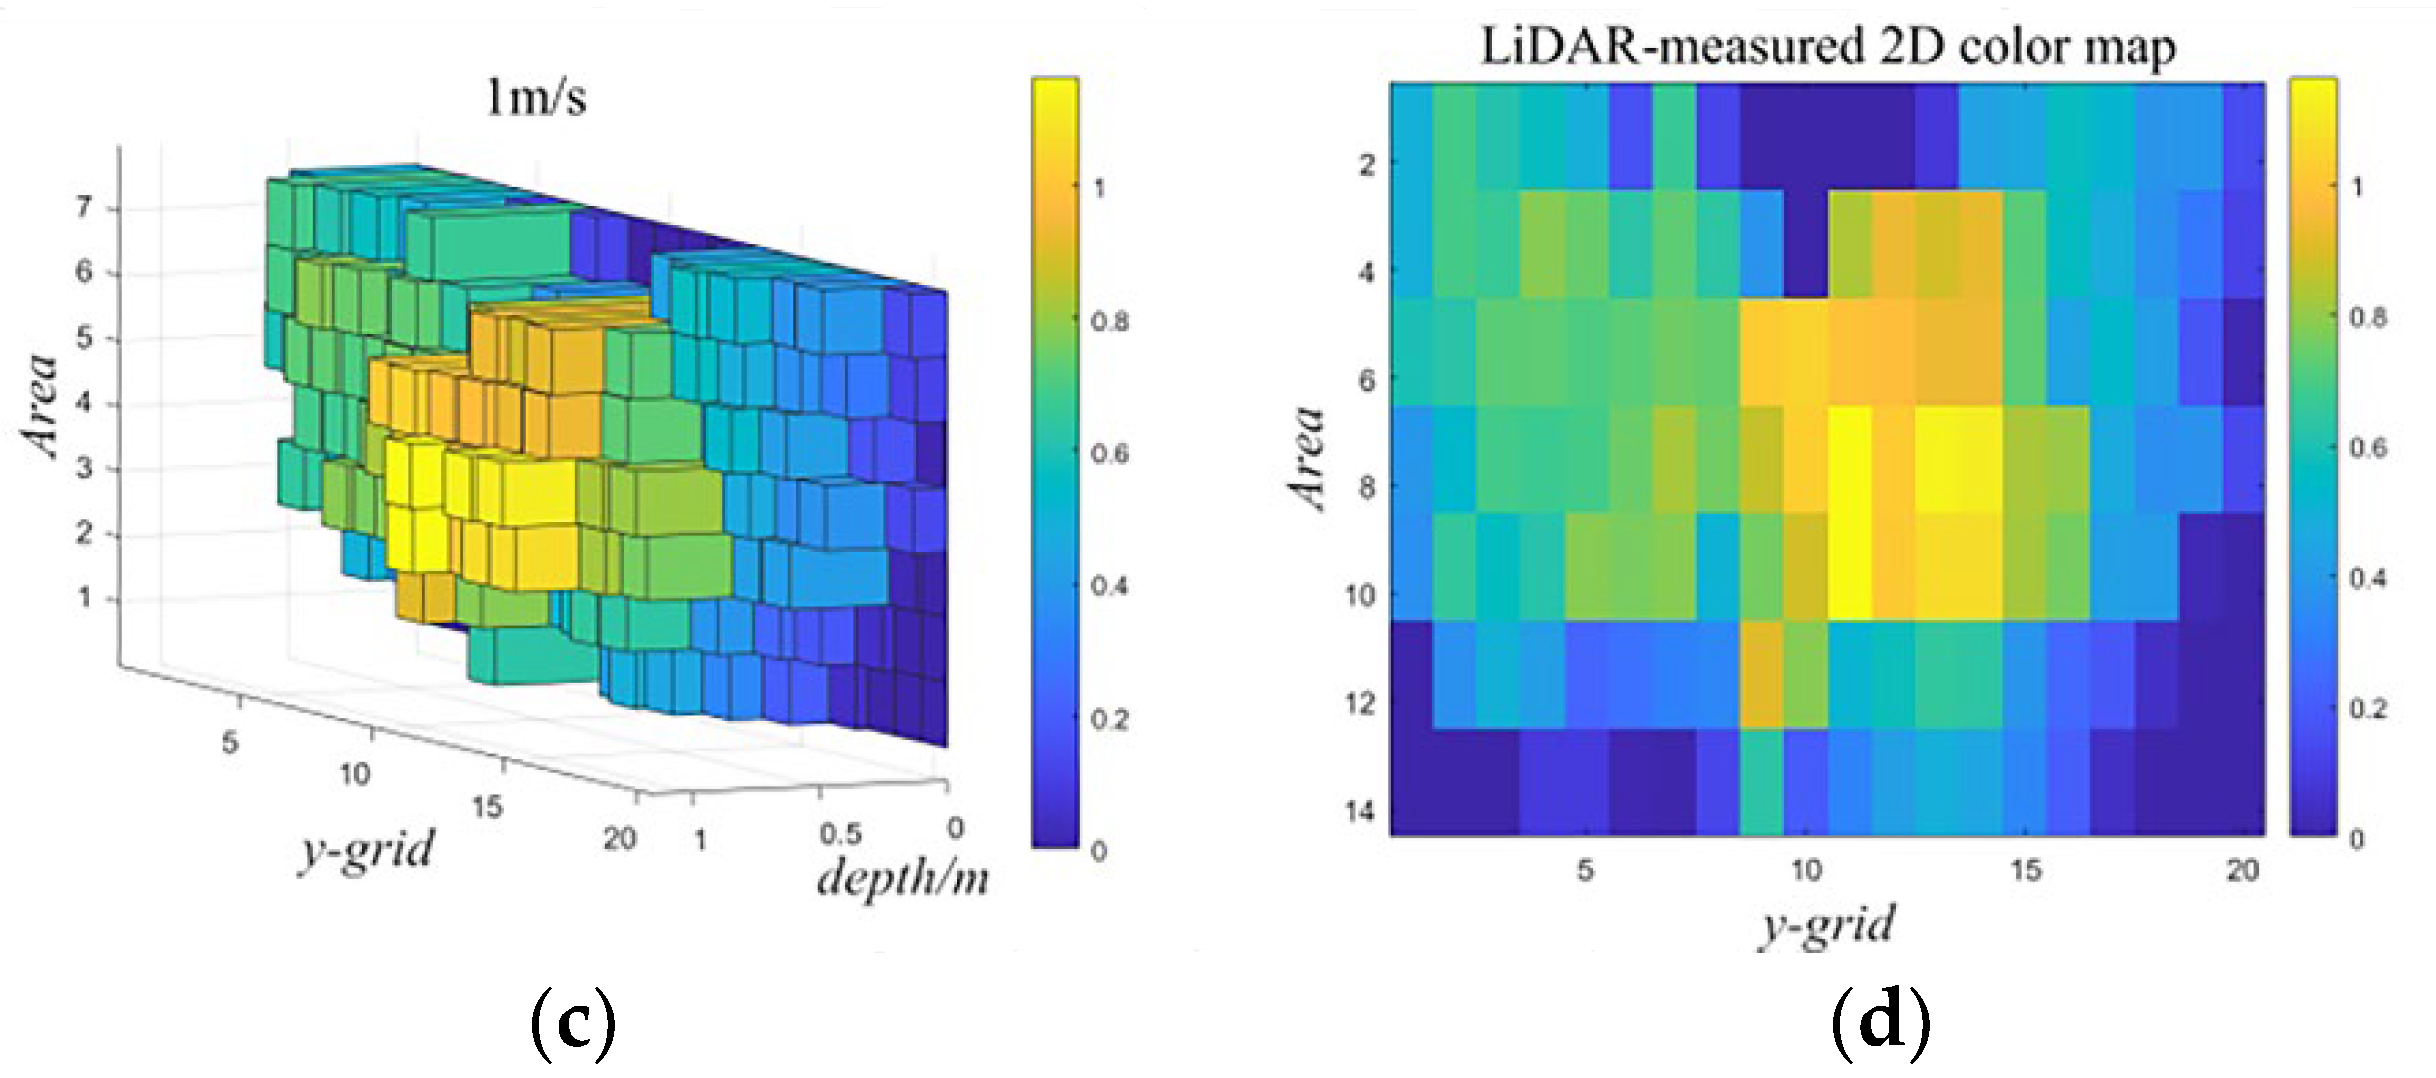
To verify the applicability of the CADA method to different canopy layers, the detection effects of the method on Trees 2 and 3 were analysed. Figure 10 shows the 3D and 2D canopy thickness colour maps of Tree 2 and Tree 3. The discrete cuboid fitted by the CADA method can reflect the contour change of the canopy well. To further analyse the detection error of the canopy volume, we compare it with the measured value of the PNC method. The detection error is shown in Table 6. As the moving speed increases, the detection errors of the canopy volume of Trees 2 and 3 show different trends, and the detection error of the trees is smaller. When the moving speed is 1.0 m/s, the detection errors of the CADA method are 2.14% and 11.75%, respectively. These detection errors are within the acceptable range, indicating that the CADA method has a certain applicability to different types of fruit trees.

3.5. Comparative Analysis of Different Canopy Volume Measurement Methods

We evaluated the detection accuracy of the CADA method compared with the existing canopy volume detection methods based on the alpha-shape algorithm [21] and CMPC [28]. The canopy volume detection errors of the three peach trees are listed in Table 7. When applied to all three fruit trees, the three detection methods showed different detection errors, and the CADA method had the smallest error. Compared with the alpha-shape algorithm (α = 1) and the CMPC method, the average error of the canopy volume detection using the CADA method was 2.73% and 7.22% lower, respectively. These findings show that the CADA method improves the detection accuracy of the canopy volume.
The mesh division and contour points of the canopy using the three methods are given in Table 8. When applying the alpha-shape algorithm to the three trees with α = 1, there are 256, 344, and 468 contour points. When calculating the volume using the CMPC method, the three trees are divided into 17 × 12, 16 × 16, and 24 × 16 grids. Using the CADA method, the three trees are divided into 14 × 7, 13 × 7, and 20 × 7 mesh areas. CADA not only reduces the complexity of mesh volume calculation, but also ensures accurate detection of the canopy volume.

4. Discussion

Simulated canopy detection tests found that the measured values and the detection values of some grid locations appeared large or small at the locations where there was no carton at the edge of the simulated canopy, and this phenomenon also appeared in Gu’s simulation canopy test [29]. Through the analysis of the test results, we excluded the influence of the depth values in the CADA method on these edge errors. From the perspective of LiDAR detection principles, the edge errors may be due to the movement-related distortion of the point cloud at the edge of the canopy during the movement of the LiDAR apparatus, resulting in a change in the coordinates of the point cloud and an error in the calculation of the canopy volume. This phenomenon may also exist at the edges of fruit trees. In fact, the LiDAR point cloud will also be affected by terrain and the position and posture of the sprayer to produce point cloud distortion in orchard spraying, which can be reduced by adding point cloud motion distortion compensation during point cloud data processing [31].
The moving speed affects the detection accuracy of the CADA method. When the LiDAR moving speed is 0.8 m/s, the CADA method has a larger detection error of the canopy of Tree 1, at 17.84%, but the detection accuracies of Tree 2 and Tree 3 are better. Tree 1 has forked canopy branches with large gaps (Figure 6a), which increases the likelihood of gaps contributing to the mesh volume calculation. Compared with the moving speeds of 0.6 m/s and 1.0 m/s, the mesh width at the moving speed of 0.8 m/s is closer to the width of the canopy gap of Tree 1, and the point cloud at the edge of the gap is prone to motion distortion. This leads to the presence of calculated values in the gaps when the canopy volume is calculated, which increases the detection error. These phenomena verify that the point cloud at the edge of the fruit tree will be distorted, causing detection errors. For the pores behind the outermost leaves in the grid, we included them in the calculating volume. In the future, the team will conduct leaf area detection experiments to evaluate the grid canopy by combining canopy coverage [26], leaf area, and volume.
The volume value calculated by constructing the canopy contour is larger than the actual value, which is reflected in the verification of the convex hull algorithm and alpha shape algorithm, as well as the methods proposed by Cai and Gu [21,22,27,28]. Comparative analysis shows that the CADA method reduces the amount counted in the outer margin voids and improves the detection accuracy. However, the calculated value is still larger than the real value, which will cause an increase in the spraying volume. Regarding pest control, this is more beneficial than in the case of a small spraying volume caused by a small detected value of the canopy volume.
The canopy volume calculation method based on mesh division adopts a fixed mesh width for the division [27], which not only lowers the calculation accuracy of the canopy volume due to the moving speed, but also makes it inconvenient to establish a corresponding relationship with the sprayer nozzle to meet the requirements of target-oriented variable spraying. In this paper, a method for calculating the fruit tree canopy volume based on dynamic mesh division is proposed, and a way of setting the sprayer moving direction and the mesh width in the vertical direction of the canopy is found. It not only reduces the influence of the movement speed on the accuracy of the canopy volume calculation under the fixed mesh width division, but also improves the accuracy over the existing canopy volume detection methods.

5. Conclusions

In this work, a calculation method of canopy dynamic meshing division volumes for precision pesticide application in orchards based on LiDAR was proposed. The feasibility, accuracy, and applicability of the method were verified by simulated canopy and fruit tree experiments with different shapes. The main conclusions were as follows.
(1) The CADA method is suitable for measuring the grid volume of fruit canopies. The accuracy of the CADA method reached 91.67% for the measurement of the simulated canopy and 99.18% for the measurement of the peach canopy at a detection speed of 1 m/s, which is a high accuracy.
(2) With increasing mesh width, the detection accuracy decreased first and then increased. Six LiDAR scanning intervals (0.12 m) were used as the optimal grid width for dynamic partitioning at a moving speed of 1 m/s. The CADA method can be applied to different sizes and shapes of fruit tree canopies, which extends the scope of computer analysis in terms of spraying applications.
(3) The CADA method can reduce the influence of the moving speed on the accuracy of canopy volume detection. Compared with the fixed grid width division method, the measurement accuracy of the CADA method increased by 19.86%, 0.07%, and 6.97%, at the detection speeds of 0.6 m/s, 0.8 m/s, and 1.0 m/s, respectively. Thus, this method can better adapt to the change in orchard operation speed.
(4) Compared with the alpha-shape algorithm and CMPC method, the average errors of the canopy volume detection increased by 2.73% and 7.22%, respectively. The method not only reduces the influence of the LiDAR moving speed on the detection accuracy of the canopy volume, but also improves the detection accuracy over the existing canopy volume detection methods.
The research results provide theoretical support for the research and development of target-oriented variable-rate spraying control systems for orchards. In the future, detection tests of fruit trees for the whole growth period could be conducted to verify the universality of this method. This method could be applied to the target-oriented variable-rate spraying control system to optimize the target-oriented variable spraying of orchards.
Author Contributions

Conceptualization, M.W. and H.D.; methodology, M.W., H.D. and C.Z.; validation, M.W. and H.D.; formal analyses, M.W. and H.D.; investigation, M.W. and H.D.; resources, M.W., H.S. and H.D.; data curation, M.W., F.Y. and Y.Z.; writing—original draft, M.W.; writing—review and editing, H.D. and C.Z.; funding acquisition, C.Z. and H.D.; supervision, H.D., C.Z. and H.S. All authors have read and agreed to the published version of the manuscript.

Funding

Support was provided by (1) the National Key Research and Development Plan Project, grant number 2022YFD1000102; (2) the Laboratory Construction Project of 2023 National Engineering Research Center for Intelligent Equipment in Agriculture, grant number PT2023-41; and (3) the Natural Science Foundation of China, grant number NSFC31971775.

Institutional Review Board Statement

Not applicable.

Informed Consent Statement

Not applicable.

Data Availability Statement

Not applicable.

Conflicts of Interest

The authors declare no conflict of interest.

References

  1. Asaei, H.; Jafari, A.; Loghavi, M. Site-Specific Orchard Sprayer Equipped with Machine Vision for Chemical Usage Management. Comput. Electron. Agric. 2019, 162, 431–439. [Google Scholar] [CrossRef]
  2. Zhai, C.; Zhao, C.; Wang, N.; John, L.; Wang, X. Research progress on precision control methods of air-assisted spraying in orchards. Trans. Chin. Soc. Agric. Eng. 2018, 34, 1–15. [Google Scholar]
  3. Giles, D.K.; Slaughter, D.C. Precision band spraying with machine-vision guidance and adjustable yaw nozzles. Trans. ASAE 1997, 40, 29–36. [Google Scholar] [CrossRef]
  4. Li, H.; Zhai, C.; Weckler, P.; Wang, N.; Yang, S.; Zhang, B. A Canopy Density Model for Planar Orchard Target Detection Based on Ultrasonic Sensors. Sensors 2016, 17, 31. [Google Scholar] [CrossRef] [PubMed] [Green Version]
  5. Maghsoudi, H.; Minaei, S.; Ghobadian, B.; Masoudi, H. Ultrasonic Sensing of Pistachio Canopy for Low-Volume Precision Spraying. Comput. Electron. Agric. 2015, 112, 149–160. [Google Scholar] [CrossRef]
  6. Cai, J.; Wang, X.; Gao, Y.; Yang, S.; Zhao, C. Design and Performance Evaluation of a Variable-Rate Orchard Sprayer Based on a Laser-Scanning Sensor. Int. J. Agric. Biol. Eng. 2019, 12, 51–57. [Google Scholar] [CrossRef]
  7. Auat Cheein, F.A.; Guivant, J.; Sanz, R.; Escolà, A.; Yandún, F.; Torres-Torriti, M.; Rosell-Polo, J.R. Real-Time Approaches for Characterization of Fully and Partially Scanned Canopies in Groves. Comput. Electron. Agric. 2015, 118, 361–371. [Google Scholar] [CrossRef] [Green Version]
  8. Yıldız, A.K.; Keles, H.; Aras, S. Estimation of Canopy Area of Fruit Trees Using Light Unmanned Aerial Vehicle (UAV) and Image Processing Methods. Turk. J. Agric.-Food Sci. Technol. 2020, 8, 1039–1042. [Google Scholar] [CrossRef]
  9. Chen, Y.; Hou, C.; Tang, Y.; Zhuang, J.; Lin, J.; He, Y.; Guo, Q.; Zhong, Z.; Lei, H.; Luo, S. Citrus Tree Segmentation from UAV Images Based on Monocular Machine Vision in a Natural Orchard Environment. Sensors 2019, 19, 5558. [Google Scholar] [CrossRef] [Green Version]
  10. Ding, W.; Zhao, S.; Zhao, S.; Gu, J.; Qiu, W.; Guo, B. Measurement methods of fruit tree canopy volume based on machine vision. Trans. Chin. Soc. Agri. Mac. 2016, 47, 1–10+20. [Google Scholar]
  11. Escolà, A.; Planas, S.; Rosell, J.R.; Pomar, J.; Camp, F.; Solanelles, F.; Gracia, F.; Llorens, J.; Gil, E. Performance of an Ultrasonic Ranging Sensor in Apple Tree Canopies. Sensors 2011, 11, 2459–2477. [Google Scholar] [CrossRef] [Green Version]
  12. Sanz, R.; Rosell, J.R.; Llorens, J.; Gil, E.; Planas, S. Relationship between Tree Row LIDAR-Volume and Leaf Area Density for Fruit Orchards and Vineyards Obtained with a LIDAR 3D Dynamic Measurement System. Agric. For. Meteorol. 2013, 171–172, 153–162. [Google Scholar] [CrossRef] [Green Version]
  13. Dou, H.; Zhai, C.; Chen, L.; Wang, X.; Zou, W. Comparison of Orchard Target-Oriented Spraying Systems Using Photoelectric or Ultrasonic Sensors. Agriculture 2021, 11, 753. [Google Scholar] [CrossRef]
  14. Zhou, H.; Zhang, J.; Ge, L.; Yu, X.; Wang, Y.; Zhang, C. Research on Volume Prediction of Single Tree Canopy Based on Three-Dimensional (3D) LiDAR and Clustering Segmentation. Int. J. Remote Sens. 2021, 42, 738–755. [Google Scholar] [CrossRef]
  15. Hejazipoor, H.; Massah, J.; Soryani, M.; Asefpour Vakilian, K.; Chegini, G. An Intelligent Spraying Robot Based on Plant Bulk Volume. Comput. Electron. Agric. 2021, 180, 105859. [Google Scholar] [CrossRef]
  16. Gil, E.; Llorens, J.; Llop, J.; Fàbregas, X.; Escolà, A.; Rosell-Polo, J.R. Variable Rate Sprayer. Part 2—Vineyard Prototype: Design, Implementation, and Validation. Comput. Electron. Agric. 2013, 95, 136–150. [Google Scholar] [CrossRef] [Green Version]
  17. Chen, Y.; Zhu, H.; Ozkan, H.E. Development of a Variable-Rate Sprayer with Laser Scanning Sensor to Synchronize Spray Outputs to Tree Structures. Trans. ASABE 2012, 55, 773–781. [Google Scholar] [CrossRef] [Green Version]
  18. Yu, L.; Hong, T.; Zhao, Z.; Huang, J.; Zhang, L. Laser measurement and experiment of hilly fruit tree canopy volume. Trans. Chin. Soc. Agric. Mach. 2013, 44, 224–228. [Google Scholar]
  19. Xu, W.; Su, Z.; Feng, Z.; Xu, H.; Jiao, Y.; Yan, F. Comparison of Conventional Measurement and LiDAR-Based Measurement for Crown Structures. Comput. Electron. Agric. 2013, 98, 242–251. [Google Scholar] [CrossRef]
  20. Xu, W.H.; Feng, Z.K.; Su, Z.F.; Xu, H.; Jiao, Y.Q.; Deng, O. An automatic extraction algorithm for individual tree crown projection area and volume based on 3D point cloud data. Spectrosc. Spectr. Anal. 2014, 34, 465–471. [Google Scholar]
  21. Sultan Mahmud, M.; Zahid, A.; He, L.; Choi, D.; Krawczyk, G.; Zhu, H.; Heinemann, P. Development of a LiDAR-Guided Section-Based Tree Canopy Density Measurement System for Precision Spray Applications. Comput. Electron. Agric. 2021, 182, 106053. [Google Scholar] [CrossRef]
  22. Colaço, A.F.; Trevisan, R.G.; Molin, J.P.; Rosell-Polo, J.R.; Escolà, A. Orange Tree Canopy Volume Estimation by Manual and LiDAR-Based Methods. Adv. Anim. Biosci. 2017, 8, 477–480. [Google Scholar] [CrossRef] [Green Version]
  23. Fernández-Sarría, A.; Martínez, L.; Velázquez-Martí, B.; Sajdak, M.; Estornell, J.; Recio, J.A. Different Methodologies for Calculating Crown Volumes of Platanus Hispanica Trees Using Terrestrial Laser Scanner and a Comparison with Classical Dendrometric Measurements. Comput. Electron. Agric. 2013, 90, 176–185. [Google Scholar] [CrossRef]
  24. Béland, M.; Widlowski, J.-L.; Fournier, R.A. A Model for Deriving Voxel-Level Tree Leaf Area Density Estimates from Ground-Based LiDAR. Environ. Model. Softw. 2014, 51, 184–189. [Google Scholar] [CrossRef]
  25. Seidel, D.; Fleck, S.; Leuschner, C. Analyzing Forest Canopies with Ground-Based Laser Scanning: A Comparison with Hemispherical Photography. Agric. For. Meteorol. 2012, 154–155, 1–8. [Google Scholar] [CrossRef]
  26. Chakraborty, M.; Khot, L.R.; Sankaran, S.; Jacoby, P.W. Evaluation of Mobile 3D Light Detection and Ranging Based Canopy Mapping System for Tree Fruit Crops. Comput. Electron. Agric. 2019, 158, 284–293. [Google Scholar] [CrossRef]
  27. Escolà, A.; Martínez-Casasnovas, J.A.; Rufat, J.; Arnó, J.; Arbonés, A.; Sebé, F.; Pascual, M.; Gregorio, E.; Rosell-Polo, J.R. Mobile terrestrial laser scanner applications in precision fruticulture/horticulture and tools to extract information from canopy point clouds. Precis. Agric. 2017, 18, 111–132. [Google Scholar] [CrossRef] [Green Version]
  28. Jichen, C.; Xiu, W.; Jian, S.; Songlin, W.; Shuo, Y.; Chunjiang, Z. Development of Real-Time Laser-Scanning System to Detect Tree Canopy Characteristics for Variable-Rate Pesticide Application. Int. J. Agric. Biol. Eng. 2017, 10, 155–163. [Google Scholar] [CrossRef] [Green Version]
  29. Gu, C.; Zhai, C.; Wang, X.; Wang, S. CMPC: An Innovative Lidar-Based Method to Estimate Tree Canopy Meshing-Profile Volumes for Orchard Target-Oriented Spray. Sensors 2021, 21, 4252. [Google Scholar] [CrossRef]
  30. Pagliai, A.; Sarri, D.; Lisci, R.; Lombardo, S.; Vieri, M.; Perna, C.; Pascale, V.D. Development of an algorithm for assessing canopy volumes with terrestrial LiDAR to implement precision spraying in vineyards. Agron. Res. 2022, 20, 389–403. [Google Scholar]
  31. Li, J.; Yang, B.; Cong, Y.; Cao, L.; Fu, X.; Dong, Z. 3D Forest Mapping Using A Low-Cost UAV Laser Scanning System: Investigation and Comparison. Remote Sens. 2019, 11, 717. [Google Scholar] [CrossRef] [Green Version]
Figure 1. Schematic diagram of the fruit tree canopy point cloud data acquisition system: 1. LiDAR; 2. guide rail; 3. computer; 4. LiDAR power supply; 5. stepper motor power supply; 6. stepper motor controller; 7. stepper motor driver; 8. mobile platform; 9. stepper motor.
Agronomy 13 01077 g001
Figure 2. Principle of artificial canopy volume measurement.
Agronomy 13 01077 g002
Figure 3. Detection principle of the CADA method: (a) Lidar data acquisition; (b) canopy volume calculation.
Agronomy 13 01077 g003
Figure 4. LiDAR point cloud processing flow.
Agronomy 13 01077 g004
Figure 5. Simulated canopy test: (a) canopy front; (b) canopy side; (c) LiDAR detection process.
Agronomy 13 01077 g005
Figure 6. Orchard experiment: (a) Tree 1; (b) Tree 2; (c) Tree 3; (d) canopy detection.
Agronomy 13 01077 g006
Figure 7. LiDAR measurement vs. ground truth: (a) manually measured 3D colour map; (b) LiDAR-measured 3D colour map (average depth); (c) LiDAR-measured 3D colour map (maximum depth); (d) manually measured 2D colour map; (e) LiDAR-measured 2D colour map (average depth); (f) LiDAR-measured 2D colour map (maximum depth). Note: The red circles in the figure refer to the edge grids that can detect the canopy depth.
Agronomy 13 01077 g007
Figure 8. Tree 1 canopy contour point cloud restoration.
Agronomy 13 01077 g008
Figure 9. 2D depth colour map of canopy LiDAR detection under different mesh widths: (a) k = 2; (b) k = 4; (c) k = 6; (d) k = 8. Note: The red circles in the figure refer to the grid with the depth of 0 inside the canopy.
Agronomy 13 01077 g009
Figure 10. Colour map of the canopy thickness of Trees 2 and 3: (a) LiDAR-measured 3D colour map (Tree 2); (b) LiDAR-measured 2D colour map (Tree 2); (c) LiDAR-measured 3D colour map (Tree 3); (d) LiDAR-measured 2D colour map (Tree 3).
Agronomy 13 01077 g010aAgronomy 13 01077 g010b
Table 1. Main parameters of LMS111-10100.
ParameterPerformance Specification
Measurement range (m)20
Scanning frequency25 Hz/50 Hz
Accuracy±30
Angular resolution (°)0.25/0.5
Response time (ms)20/40
Scanning angle (°)−45~225
Ambient temperature (°C)−30~70
Table 2. Target canopy dimensions.
Target CanopyCanopy Height/mCanopy Width/mCanopy Depth/m
Tree 11.21.80.85
Tree 21.51.60.8
Tree 31.552.51.2
Table 3. Effect of the mesh canopy thickness setting method on the volume measurement.
Selection MethodCanopy Volume (m3)Relative Error (%)
Real value0.24/
Average depth0.268.33
Maximum depth0.27815.83
Table 4. Effect of the mesh width on the canopy volume measurement.
Measurement MethodScanning IntervalMesh Width (m)Canopy Volume (m3)Relative Error (%)
PNC method//0.6961/
CADA method20.040.579216.79
40.080.75368.26
60.120.70180.82
80.160.941735.28
Table 5. Canopy volume detection results of the CADA method at different speeds.
Measurement MethodSpeed (m/s)Mesh Width (m)Point Clouds NumberCanopy Height (m)Canopy Width (m)Canopy Volume (m3)Relative Error (%)
PNC method///1.21.80.6961/
Fixed mesh width0.60.134851.171.660.872625.36
0.80.126301.171.650.820817.91
1.00.120851.171.620.75037.79
CADA methodNo. 10.60.07234851.171.660.73445.5
0.80.09626301.171.650.820317.84
1.00.1220851.171.620.70180.82
No. 20.60.07235181.131.660.72994.86
0.80.09626091.131.650.72844.64
1.00.1220501.141.660.71332.54
No. 30.60.07234991.131.660.75218.04
0.80.09626471.131.650.76499.88
1.00.1220841.171.620.68721.28
No. 40.60.07234821.171.660.72854.65
0.80.09625821.161.650.801115.08
1.00.1220571.141.660.73936.21
Table 6. Detection errors of different types of canopies.
Target CanopyMeasurement MethodSpeed (m/s)Canopy Volume (m3)Relative Error (%)
Tree 2PNC method/0.6491/
CADA method0.60.60137.36
0.80.64530.59
1.00.6632.14
Tree 3PNC method/1.7342/
CADA method0.61.83135.6
0.81.967413.45
1.01.938011.75
Table 7. Comparison of the measurement errors of different canopy volume detection methods.
Measurement MethodTree 1Tree 2Tree 3Average Relative Error (%)
Canopy Volume (m3)Relative Error (%)Canopy Volume (m3)Relative Error (%)Canopy Volume (m3)Relative Error (%)
Alpha-shape algorithmα = 0.50.568118.390.60846.271.73650.138.26
α = 10.614611.710.64430.741.91510.437.63
CMPC0.63648.580.545415.981.529411.8112.12
CADA0.70180.820.66302.141.938011.754.90
Table 8. Contour extraction using different methods.
Measurement MethodTree 1Tree 2Tree 3
Mesh division
(row × column)
Alpha-shape algorithm///
CMPC17 × 1216 × 1624 × 16
CADA14 × 713 × 720 × 7
Contour points NumberAlpha-shape algorithm256344468
CMPC234289425
CADA9891140
Disclaimer/Publisher’s Note: The statements, opinions and data contained in all publications are solely those of the individual author(s) and contributor(s) and not of MDPI and/or the editor(s). MDPI and/or the editor(s) disclaim responsibility for any injury to people or property resulting from any ideas, methods, instructions or products referred to in the content.