Article

CT-Based Phenotyping and Genome-Wide Association Analysis of the Internal Structure and Components of Maize Kernels

Beijing Key Laboratory of Digital Plant, Information Technology Research Center, Beijing Academy of Agriculture and Forestry Sciences, Beijing 100097, China
*
Author to whom correspondence should be addressed.
These authors contributed equally to this work.
Agronomy 2023, 13(4), 1078; https://doi.org/10.3390/agronomy13041078
Submission received: 10 February 2023 / Revised: 28 March 2023 / Accepted: 29 March 2023 / Published: 7 April 2023
(This article belongs to the Special Issue Micro Phenotyping for Plant Breeding)

Abstract

:
The structure of the maize kernels plays a critical role in determining maize yield and quality, and high-throughput, non-destructive microscope phenotypic characteristics acquisition and analysis are of great importance. In this study, Micro-CT technology was used to obtain images of maize kernels. An automatic CT image analysis pipeline was then developed to extract 20 traits related to the three-dimensional structure of kernel, embryo, endosperm, and cavity. The determination coefficients for five volume-related traits (embryo, endosperm, silty endosperm, embryo cavity, and endosperm cavity) were 0.95, 0.95, 0.77, 0.73, and 0.94, respectively. Further, we analyzed the phenotypic variations among a group of 303 inbred lines and conducted genome-wide association studies (GWAS). A total of 26 significant SNP loci were associated with these traits that are closely related to kernel volume, and 62 candidate genes were identified. Functional analysis revealed that most candidate genes corresponding to cavity traits encoded stress resistance proteins, while those corresponding to embryo and endosperm traits encoded proteins involved in regulating plant growth and development. These results will improve the understanding of the phenotypic traits of maize kernels and will provide new theoretical support for in-depth analysis of the genetic mechanism of kernel structure traits.

1. Introduction

Maize is one of the field crops with the highest yield in the world and one of the three major staple foods in China. The maize kernel contains internal structures such as embryo, endosperm, and cavity, among which endosperm can be divided into silty endosperm and horny endosperm according to hardness. Quantitative analysis of maize kernel structure and components is crucial for the precise breeding of maize varieties and for improving the edible and market value of maize varieties. Different types of maize kernels have significant differences in morphology and internal structure. For example, the endosperm of popped maize kernels is larger, the specific surface area of sweet maize is larger, while the embryo volume of ordinary maize is smaller [1]. In the process of kernel development, the size and proportion of the internal structure and components of maize kernel constantly change. For example, 4 days after maize pollination, maize kernels consist of ovules, pericarp, endosperm, and embryo; therein, the endosperm and embryo are embedded in the nucleus. As the kernel gradually develops to maturity, the nucleus recedes, and the embryo and endosperm gradually diverge. At the same time, the pericarp becomes thinner [2]. Embryo, endosperm, and cavity are important components and structures of maize kernels. The embryo develops into a seedling, and the endosperm provides nutrients for the development of the embryo. There is a complex nutrient exchange between the embryo and the endosperm [3]. The cavity is related to mechanical properties such as hardness and crushability [4]. Thus, the high-throughput, non-destructive micro phenotypic characteristics acquisition and analysis of kernels are of great importance.
The traditional maize kernel testing work is measured by manual counting and measurement, and it is costly, subjective, and error-prone. In recent decades, image processing and machine vision technologies have been widely used to solve the problem of object detection, recognition, and measurement; size-related traits such as kernel length and kernel width can be calculated from RGB images of kernels. However, this kind traits of maize kernel are difficult to represent the internal structures and components. Micro-CT is a non-destructive 3D imaging technology that can clearly, accurately, and intuitively reveal the internal structure, composition, material, and defect status of maize kernels in the form of two-dimensional or three-dimensional images. At present, Micro-CT has been widely used in phenotyping research of maize kernel to achieve non-destructive detection of the internal structure of the kernel. Micro-CT was used to obtain CT images of different varieties of maize kernels, and it found that the distribution of embryo, endosperm, and cavity of different varieties of maize was significantly different [1]. The embryo, endosperm, cavity, and other structural components of kernels on different ear positions were obtained through Micro-CT and used to explore the effect of ear kernel position [5]. Moreover, Micro-CT was utilized to study the relationship between kernel structure parameters and kernel cultivar breakage and revealed the breakage rate is closely related to subcutaneous cavity volume as well as kernel density [6]. Among the above-mentioned studies, CT is becoming a powerful tool for non-destructively imaging the internal structure of kernels. However, manually processing these images using contouring or semi-automatic software can be time-consuming and labor-intensive. Automatic image analysis is of great significance for the accurate identification of kernel anatomical structure.
With the rapid development of various imaging sensors, multidimensional phenotype data resulting from spectroscopy, UAV images, and point clouds are more and more widely applied for genome-wide association analysis (GWAS). Some morphological traits by manual measurement or image-based traits are usually used for GWAS analysis of crop phenotypes. The geometrical parameters of maize kernel by manual measurement [7] consisted of kernel length, kernel width, kernel thickness, etc. To measure the true embryo volume, it is necessary to carefully dissect the embryo from the kernel using a razor blade, followed by measurement using a centrifuge tube [8]. Image-based traits extracted from RGB images were used to calculate the color traits of maize kernel [9], geometrical traits of sorghum ear [10], and leaf traits (such as leaf curl, water content, and drought resistance coefficient) of rice [11].
In this study, Micro-CT technology was used to obtain images of maize kernels. In addition, we developed an automated CT image analysis pipeline to extract three-dimensional traits of kernel structure and components. Based on the abundant phenotypic indicators of kernel, embryo, endosperm, and cavity, we analyzed the phenotypic variations among a group of 303 inbred lines and further conducted GWAS to reveal the genetic architecture of kernel structure traits.

2. Materials and Methods

2.1. Experimental Materials and Data Acquisition

The experimental materials used in this study were derived from inbred lines of the maize association analysis population, which were previously described by Yang et al. [12]. A total of 303 inbred lines were selected for this study (Table S1). According to the Q-matrix of population structure, the 303 inbred maize lines were divided into four subgroups: Stiff stalk (SS) with 19 lines, non-stiff stalk (NSS) with 89 lines, tropical-subtropical (TST) with 130 lines, and an admixed group (Mixed) with 65 lines. These materials were planted at the Sanya Experimental Station of the Beijing Academy of Agriculture and Foresting Sciences in Hainan, China, in 2018. After harvesting, three plump kernels of similar size from the middle of the ear (one ear per inbred line) were used for CT scanning.
These kernels were fixed onto a foam board using double-sided tape and spaced apart as much as possible. During scanning, a projection image was generated at each rotation angle, and CT tomographic images were generated using Skyscan recon software (version 1.6.9.4). Each scan produced 700 tomographic images with a resolution of 2000 × 2000 pixels.

2.2. Kernel Phenotyping Pipeline

To improve the efficiency of kernel scanning and imaging, we conducted one-time scanning and imaging for multiple kernels. Then, a simple image processing strategy was used to extract each independent kernel (there is no contact between kernels). First, the average threshold of the CT image was calculated and applied to the binary CT image sequence. Second, the region growth technology was performed to assign an individual label and color for each connected volume of the 3D image. Finally, the bounding box of each connected volume was calculated and used to extract each individual kernel from the original 3D data.
We constructed a phenotyping pipeline based on a two-dimensional U-Net network to segment the embryo structure of kernels (Figure 1). The feature extraction backbone was VGG16 without the fully connected layer that enhances the feature extraction performance of U-Net. A data set that contained a total of 428 images of 30 kernel scanning was used for annotation (Figure 1a). Then effective interactive segmentation (EISeg) was used to outline embryo regions of these images manually. After the U-Net segmentation network was trained 100 epochs, the dice accuracy of the model reached 97.6%.
Based on this U-Net model, the original CT images were segmented slice by slice into embryo masks (Figure 1b). The entire kernel masks were generated by the Otsu algorithm and used to extract each individual kernel and its embryo from the original images (Figure 1c). Then, the kernel and embryo masks were used to generate the endosperm mask by an XOR operation. It’s worth noting that it is a challenge to accurately separate silty endosperm and horny endosperm from endosperm images using the Otsu threshold due to the ambiguous pixel boundaries between them (Figure 1d). In this study, the gray-level image of the endosperm was first enhanced by the contrast ratio by a Gaussian filter and then binarized by the Otsu algorithm to obtain a silty endosperm mask. Due to the very low intensity of the cavity, a simple threshold operation based on the gray-level image was used to identify the cavities from these masks (Figure 1e). Thus, the extracted cavities could be divided into four types according to their positions for phenotypic analysis, i.e., the cavities of the embryo, endosperm, whole kernel, and subcutaneous cavity. Further, these masks of endosperm, embryo, and cavities could be reconstructed as three-dimensional surface models using the Marching Cube algorithm (Figure 1f). Therefore, some basic morphological parameters, such as length, surface area, and volume, were calculated based on these three-dimensional models. The developed pipeline can extract 20 phenotypic traits (Table 1) from CT images of an individual kernel within 5 s.

2.3. Genome-Wide Association Analysis

The FarmCPU (Fixed and random model Circulating Probability Unification) method [13] was used to perform GWAS analysis on kernel structure traits using the GAPIT3 R package [14]. This method iterates between fixed-effect and random-effect models to maintain computational efficiency while controlling false positives and negatives. The kinship matrix and PCA covariates were also calculated using GAPIT3. Maize genotype data were obtained from MaizeGO (http://www.maizego.org/Resources.html, https://pan.baidu.com/s/1E65xZP4ChSspGy_0Sft6wQ#list/path=%2F), and after quality control, 839,375 SNPs with MAF (minimum allele frequency) >0.05 and call rate >0.9 were used for GWAS with a genome-wide threshold of p = −log(0.05/total number of SNPs) = 7.22. Results were visualized using QQ and Manhattan plots, and genes within 50 kb upstream or downstream of significant SNPs were identified as candidate genes.

2.4. Functional Analysis of Candidate Genes

Functional annotation of candidate genes was performed through the NCBI GENE database (https://www.ncbi.nlm.nih.gov/gene), and candidate gene codes were queried through the STRING database (https://www.string-db.org/) protein interaction network. GO enrichment analysis was performed on all genes in the protein interaction network by the clusterProfiler package of R. The GO annotation file used by the clusterProfiler package is downloaded from AnnotationHub, and the index number is AH55736.

3. Result

3.1. Phenotypes Accuracy Evaluation

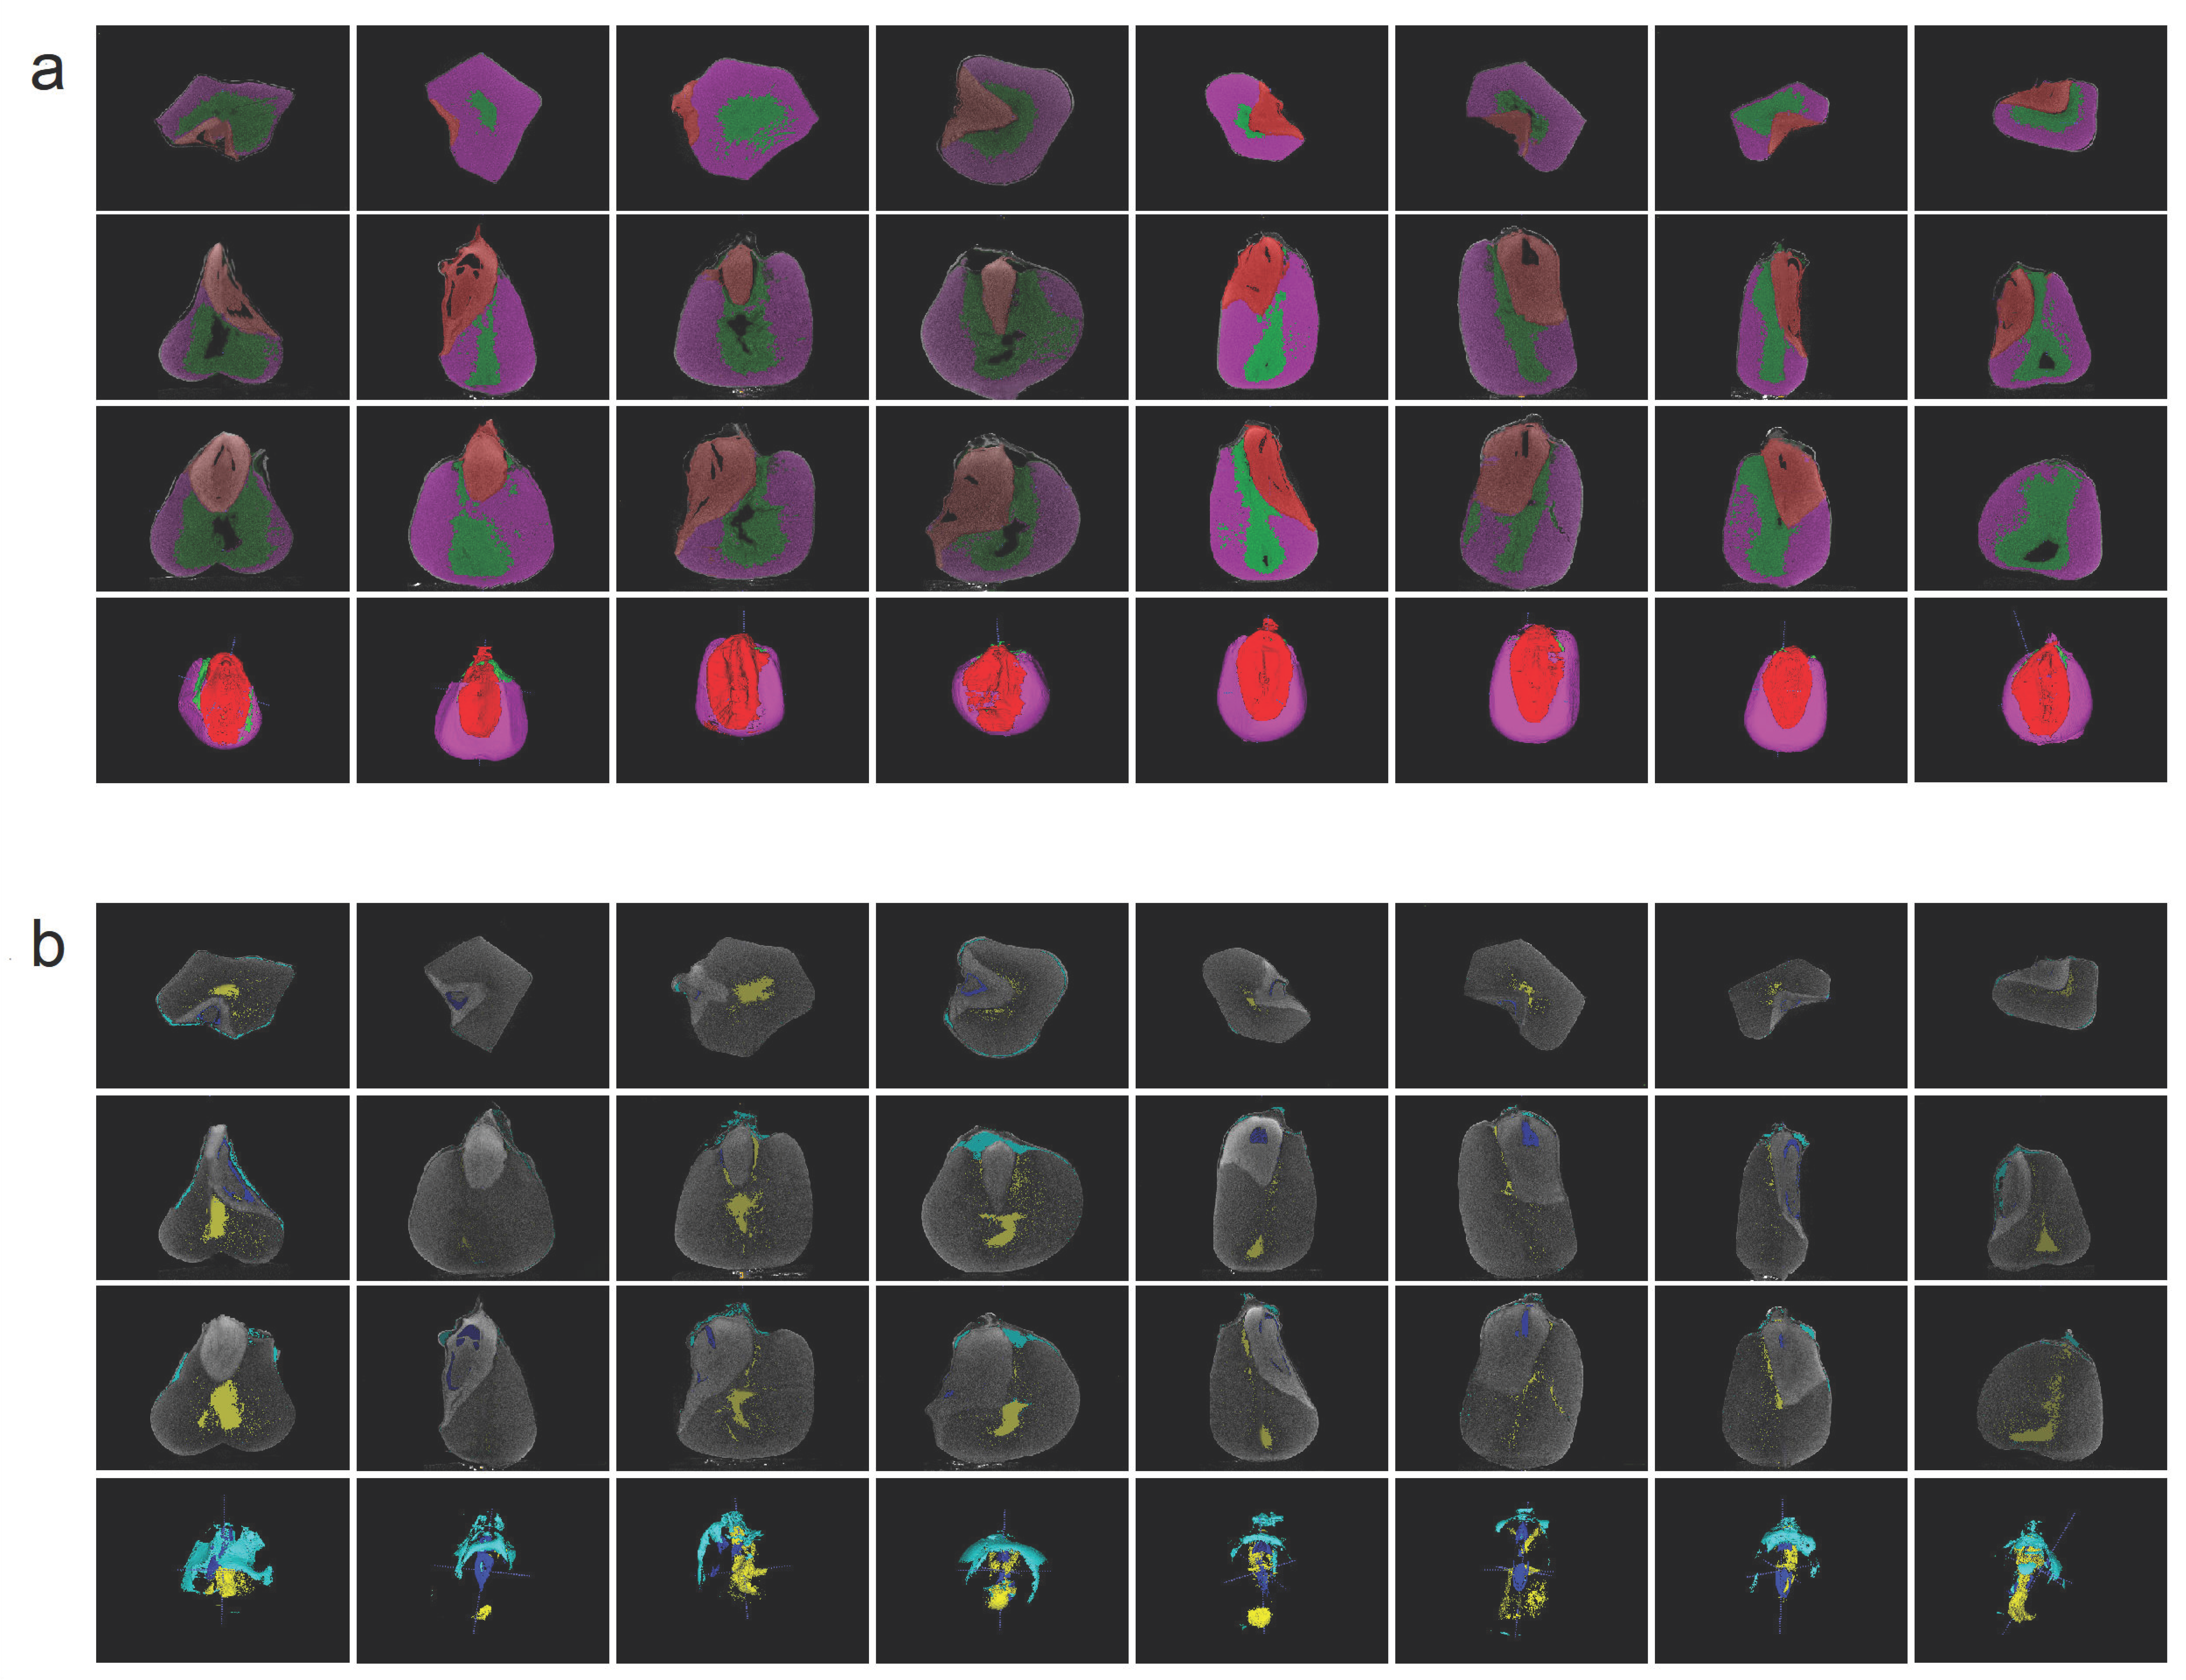
The accuracy of the phenotyping pipeline’s segmentation was evaluated by manually segmenting the embryo, endosperm, and cavity structures of 48 kernel samples using ITK-SNAP (3.6.0) [15] to calculate their volumes from CT images. Figure 2 shows several visualizations of the embryo, endosperm, and cavity segmentation results produced by the phenotyping pipeline. The computation accuracy of volumes was evaluated using R2 (Coefficient of Determination; Formula (1)) and RMSE (Root Mean Square Error; Formula (2)).
R 2 = 1 i ( x i y i ) 2 i ( x i y ¯ ) 2
RMSE = i ( x i y i ) 2 n
Therein, x represents the volumes calculated using ITK-SNAP, and y represents the volumes calculated using the phenotyping pipeline.
To evaluate the measurement accuracy of the phenotyping pipeline, the volumes of the silty endosperm, embryo, endosperm cavity, endosperm, and embryo cavity were manually measured using the ITK-SNAP. Correlation analysis was performed to compare the measurement results of five traits (EN_S, EM_Volume, C_EN_V, EN_Volume, and C_EM_V) by the presented method and manual measurement. The coefficient of determination was 0.77, 0.95, 0.94, 0.95, and 0.73, respectively, and RMSE was 33.68, 1.36, 0.35, 87.03, and 0.08 mm3, respectively. The embryo cavity and silty endosperm had relatively lower R2, most likely due to their smaller proportion of voxels relative to the whole kernel.

3.2. Statistical Analysis of Kernel Phenotypes

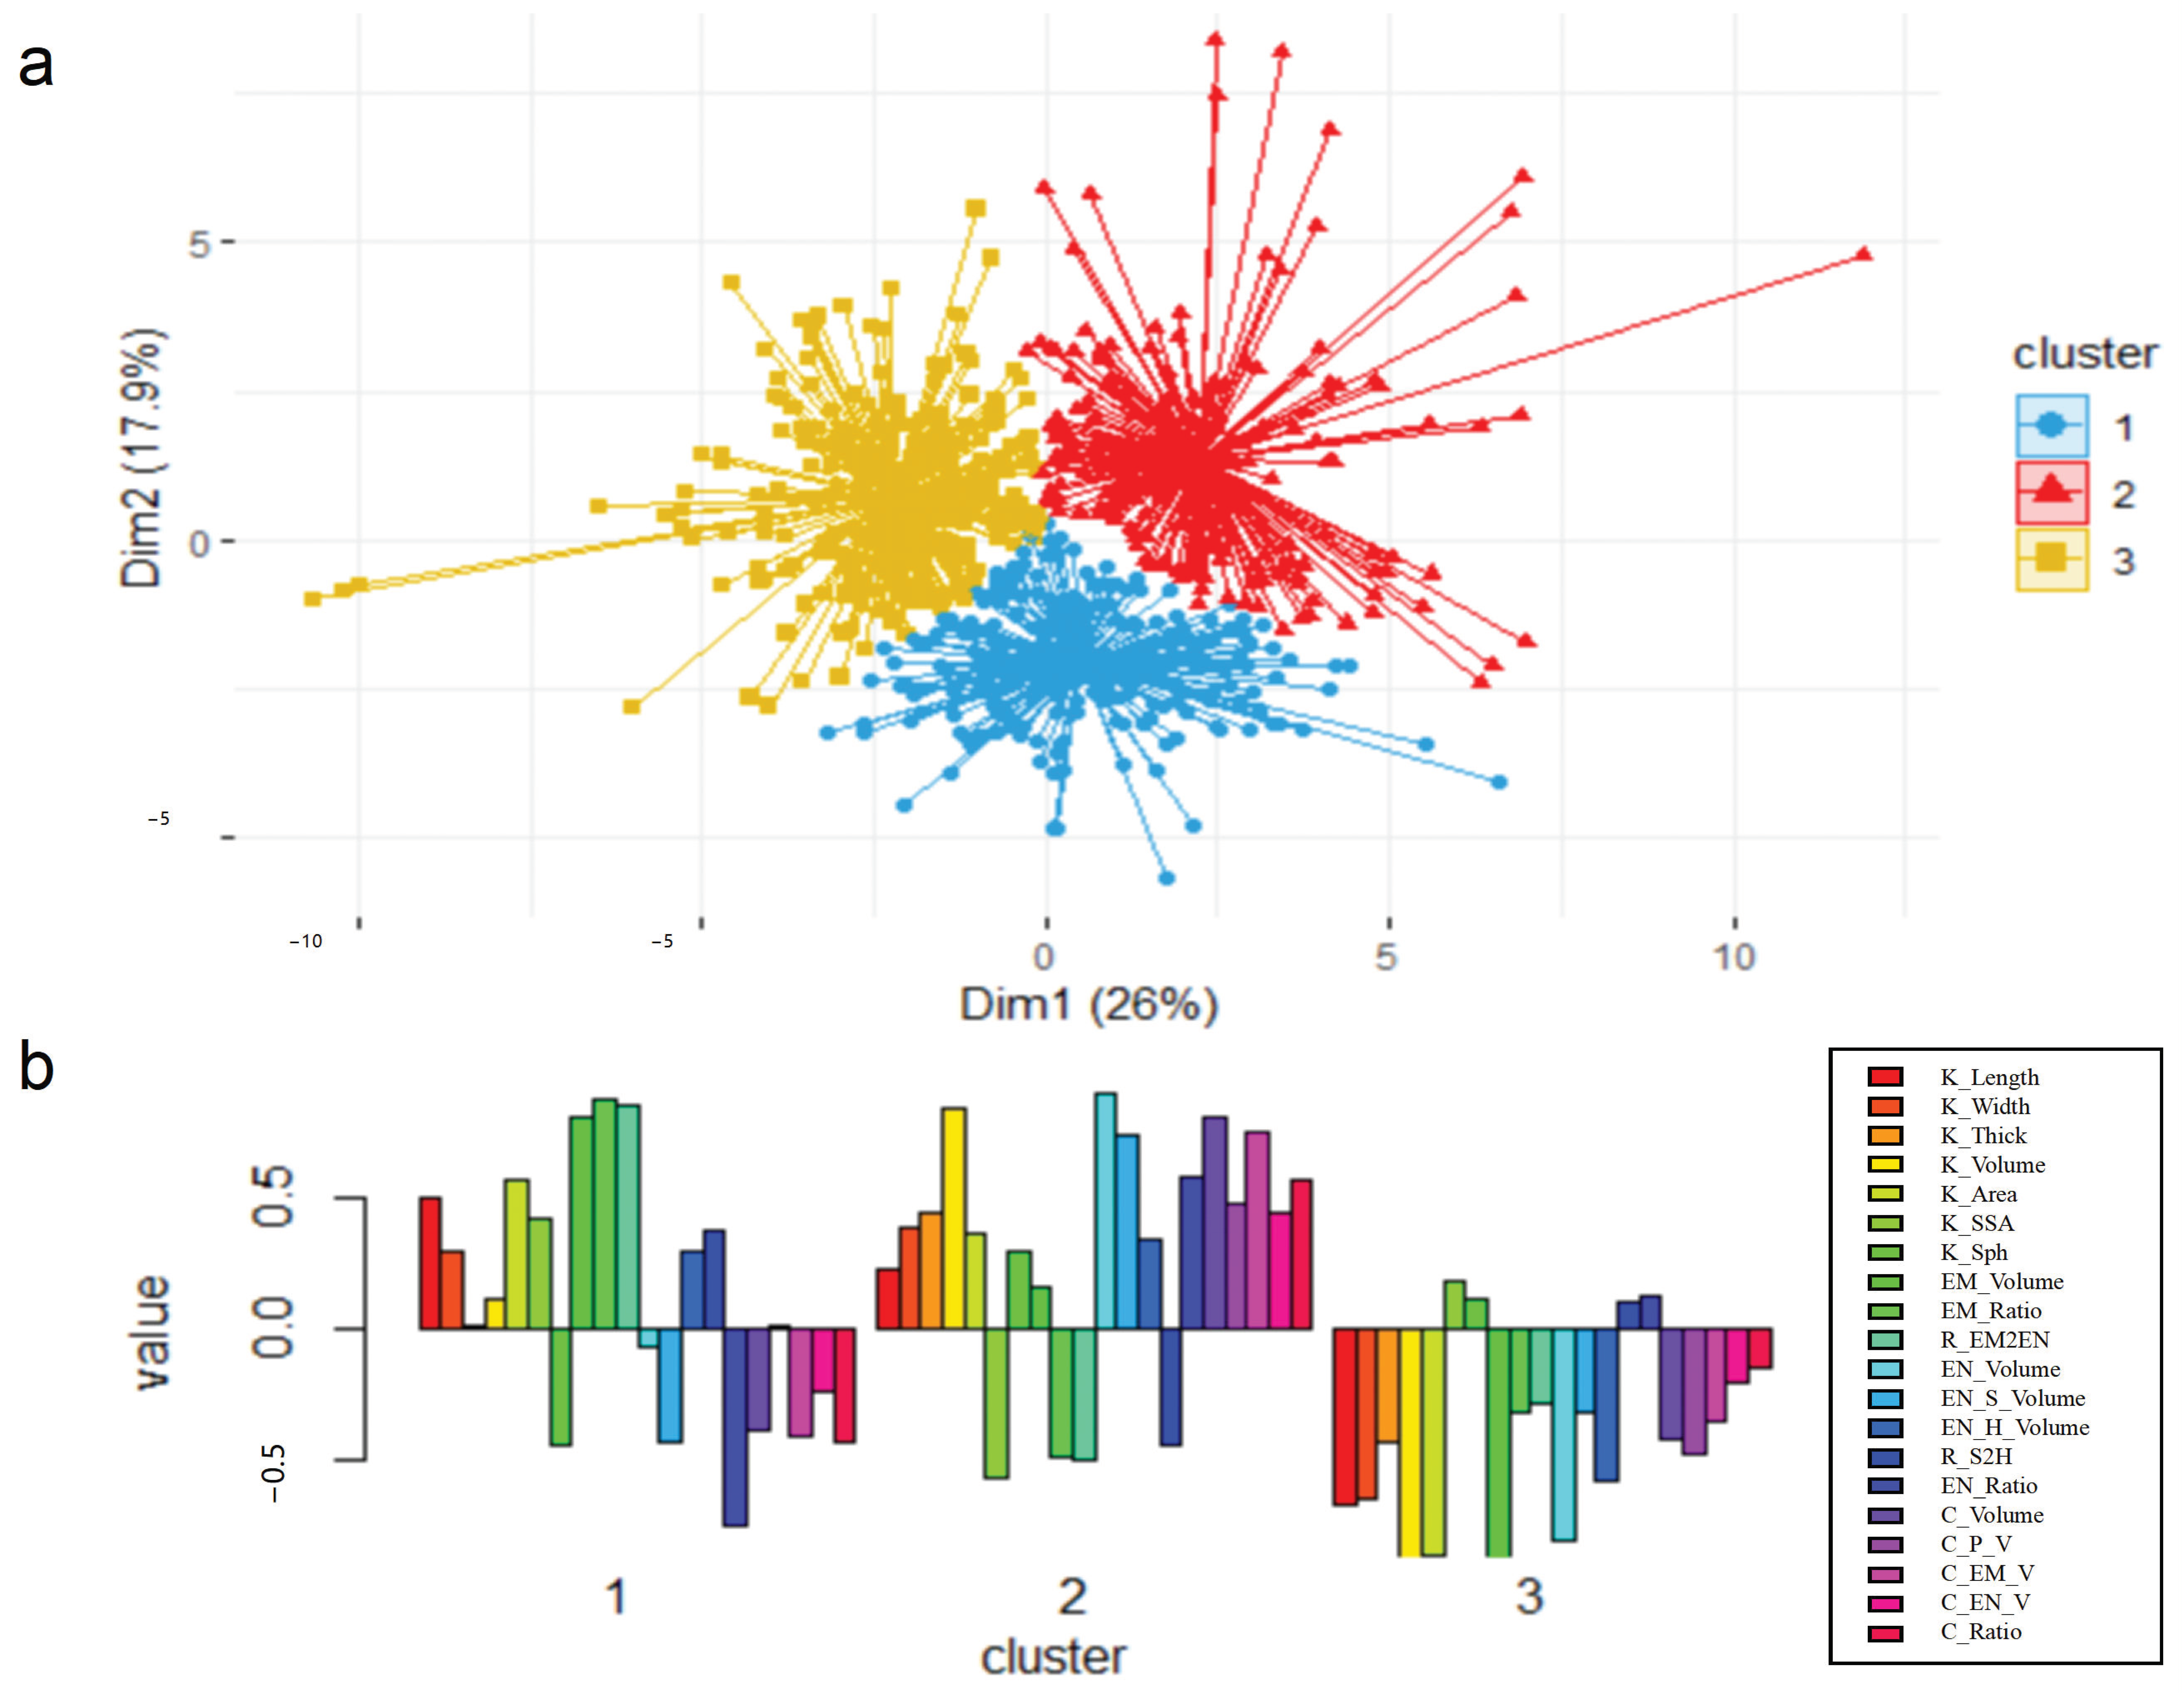
The kernel phenotypic traits of the maize population were analyzed statistically. Z-SCORE normalization was applied to all maize kernel phenotypic traits before performing KMEANS cluster analysis. Our experiments showed that setting the cluster number to 3 resulted in better clustering with clear boundaries between the three categories (Figure 3a). The three types of kernels had distinct clustering centers, and each clustered kernel was characterized by the same traits with different weights. These weights largely determined the characteristics of each kernel type (Figure 3b).
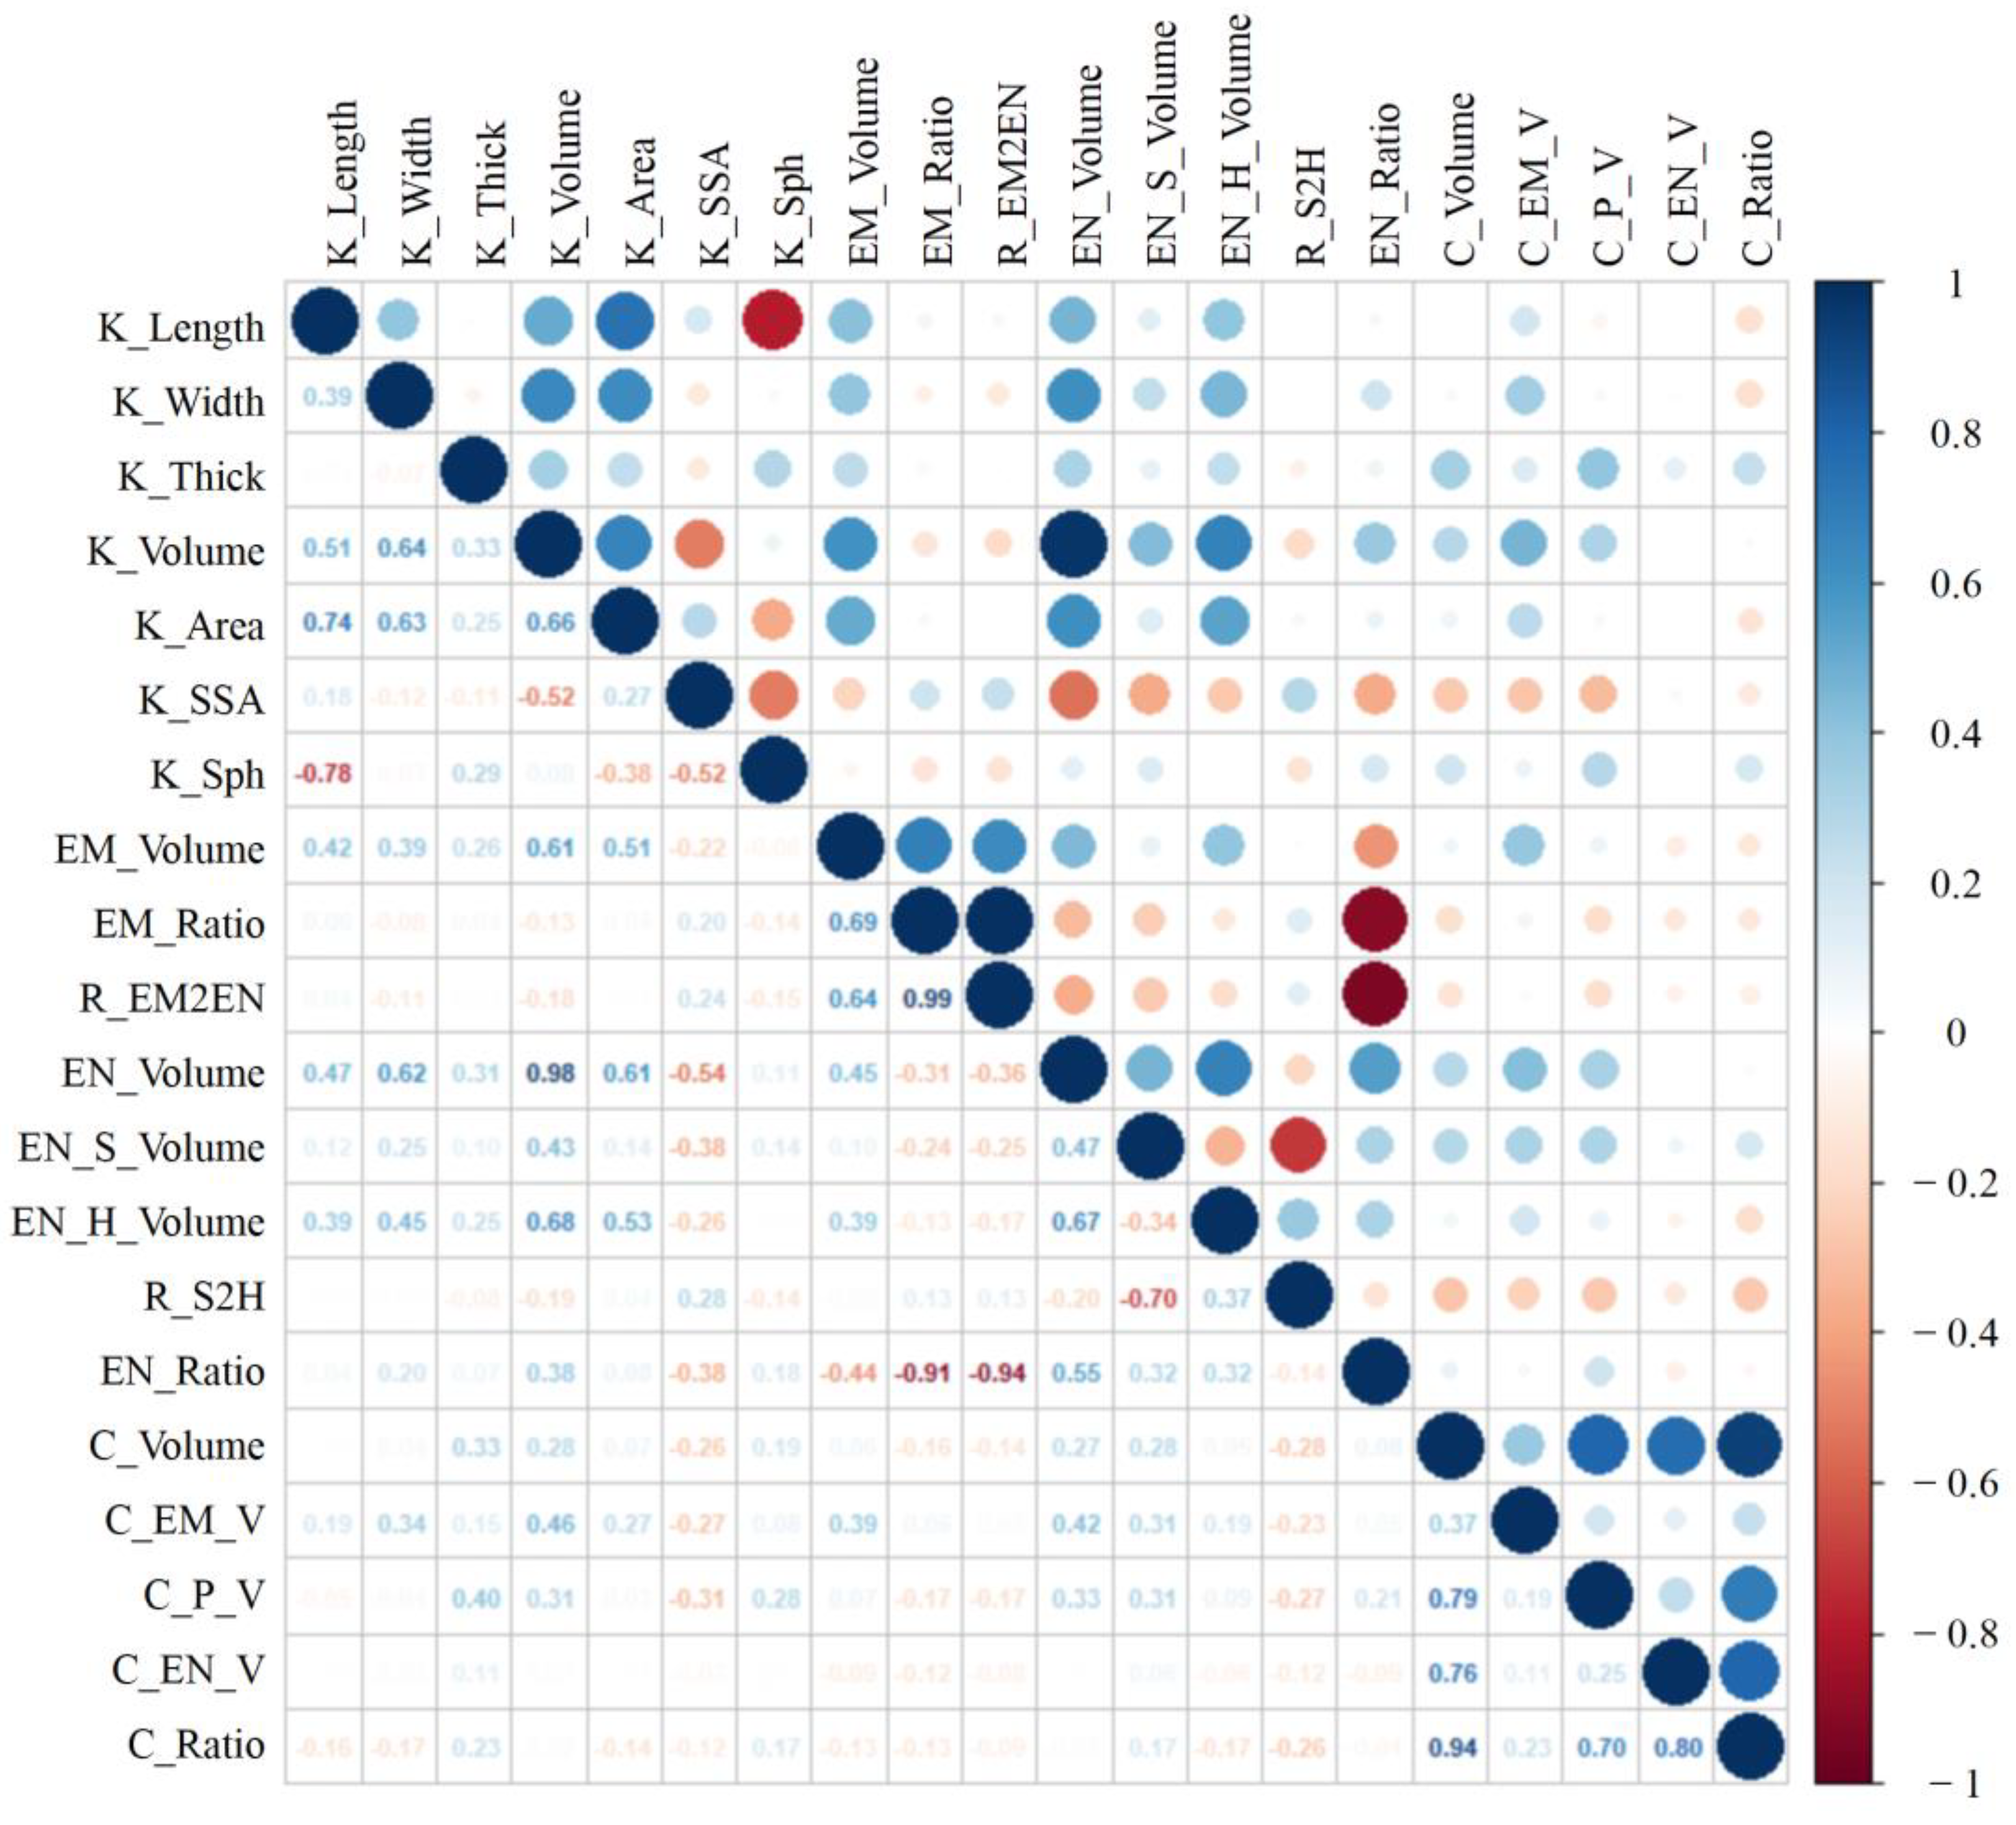
Figure 4 shows the correlation analysis of kernel phenotypic traits. The results revealed that the volumes of the entire kernel and its components (embryo, endosperm, and cavity) were positively correlated with correlation coefficients of 0.61, 0.9, and 0.28, respectively. The correlation between the kernel and endosperm volumes was the strongest, while the correlation between the kernel and cavity volumes was the weakest, indicating that cavity volume probably has a distinct role in characterizing kernel features. Kernel geometry descriptors (length, width, and thickness) were positively correlated with volumes (kernel, embryo, and endosperm). Total cavity volume had a high positive correlation with the subcutaneous cavity and endosperm cavity (0.79 and 0.76, respectively) but was almost irrelevant to the endosperm cavity (0.06). In the entire kernel, subcutaneous and endosperm cavities accounted for most of the total cavity volume, while the proportion of embryo cavities was very low.
Then, statistical analysis was performed on the phenotypic traits of maize kernels for the maize association analysis population (Table 2). There are abundant phenotypic variations in the structural traits of individual kernels. According to the degree of variability, the 20 kernel traits are divided into three categories according to the variability degrees: the first category (variability degrees are larger than 50%) includes all cavity-related traits, endosperm hardness, and silty endosperm volume; the second category (variability degrees are between 15 and 50) consists of kernel volume, surface area, specific surface area, sphericity, embryo volume, embryo fraction, endosperm ratio, endosperm volume, and horny endosperm Volume; the third category (variability degree are less than 15) contains kernel length, kernel width, kernel thickness, and endosperm ratio. To visually observe the variation of the entire kernel and its components, the ray-casting algorithm was used to visualize typical maize kernels of different varieties in the association analysis population, as shown in Figure S3. The frequency distribution of each phenotypic trait is also shown in Figure S2. Most of the frequency distributions are bell-shaped and approximately normal distribution.
Statistical analysis was conducted on the phenotypic traits of maize kernels for the maize association analysis population (Table 2). There were abundant variations in individual kernel structural traits. Based on the degree of variability, the 20 kernel traits were divided into three categories: the first category (with variability degrees larger than 50%) included all cavity-related traits, endosperm hardness, and silty endosperm volume; the second category (with variability degrees between 15 and 50) consisted of kernel volume, surface area, specific surface area, sphericity, embryo volume and fraction, endosperm ratio and volume, and horny endosperm volume; the third category (with variability degrees less than 15) contained kernel length, width, and thickness as well as endosperm ratio. To visually observe variations in entire kernels and their components, a ray-casting algorithm was used to visualize typical maize kernels of different varieties in the association analysis population (Figure S3). The frequency distribution of each phenotypic trait is shown in Figure S2. Most frequency distributions were bell-shaped and approximately normal.

3.3. Significant SNPs and Candidate Genes Identified by GWAS

Six kernel structure traits closely related to volume, i.e., EM_Volume, EM_Ratio, EN_Volume, EN_Ratio, C_Volume, and C_Ratio, were selected as key kernel traits for GWAS. As a consequence, a total of 26 significant SNPs were identified for these six traits (Figure S1, Table S2). Among them, eight SNPs located on chromosomes 4, 5, 6, 7, 8, and 9 were associated with EM_Volume (Figure S1a), one SNP located on chromosome 8 was associated with EM_Ratio (Figure S1b), seven SNPs located on chromosome 3, 4, 5 and 8 were associated with C_Volume (Figure S1c), four SNPs located on chromosome 1, 3, 5 and 10 were associated with C_Ratio (Figure 1d), and six SNPs located on chromosome 3, 5, 7, 8 and 9 were associated with EN_Ratio (Figure 1f). However, there was no SNP identified that was significantly associated with EN_Volume (Figure S1e).
Based on the significant SNPs of six kernel structure traits, a total of 62 candidate genes were obtained. Among them, the candidate genes for EM_Volume, EM_Ratio, EN_Ratio, C_Volume, and C_Ratio were 19, 3, 18, 16, and 6, respectively. These Genes were further retrieved in the NCBI Gene database, and 15, 3, 15, 11, and 4 candidate genes were functionally annotated for EM_Volume, EM_Ratio, EN_Ratio, C_Volume, and C_Ratio, respectively (Table S3).

3.4. Functional Enrichment and Network Analysis of Candidate Genes

Protein–protein interaction (PPI) network of candidate genes was analyzed by STRING (Figure S2). In the network analysis results, a total of 24 protein interaction networks of candidate genes for embryo- and endosperm-related traits were obtained in the STRING database. Among them, there were three protein interaction networks interacting with each other. The first network consisted of Simk1, tdsgR56G10, and GRMZM2G021624 played a role in signal transduction and protein phosphorylation; the second network consisted of GRMZM2G173684 and GRMZM2G411956 played a role in ribosome synthesis and protein metabolism, and the third network consisted of GRMZM2G374309 and GRMZM2G009045 played a role in ion transmembrane transport and ATP transport. Moreover, two protein interaction networks composed of 12 candidate genes for cavity-related traits were obtained. One of them consisted of GRMZM2G048763 and CID11, and genes in this network played a role in mRNA splicing, protein folding, and transport. The other network consisted of GRMZM2G099483 and pco129760 mainly played a role in protein metabolism and ion transmembrane transport.
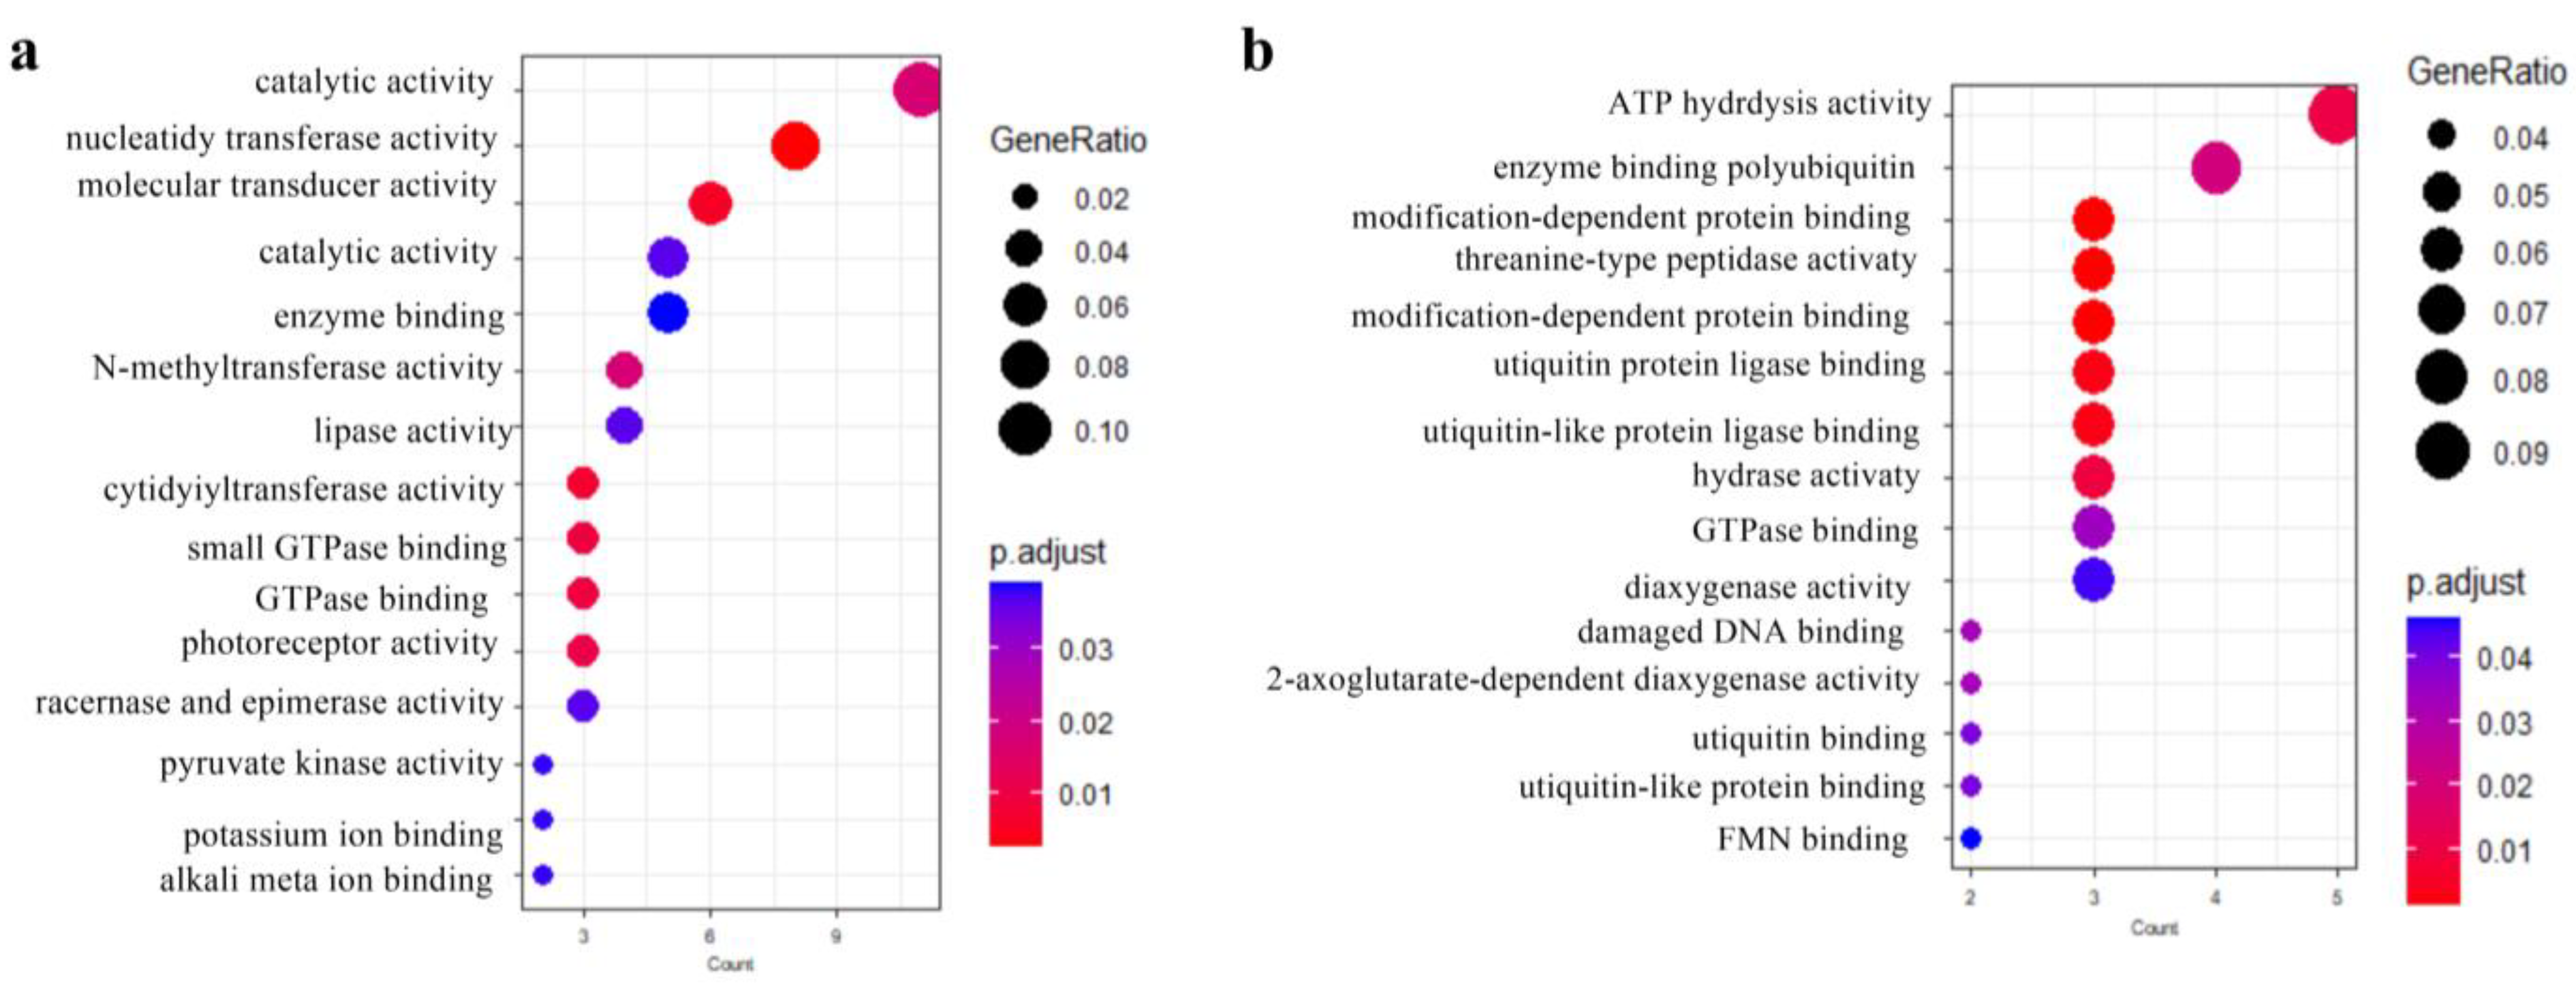
In order to further explore the function of candidate genes, GO enrichment analysis was conducted for candidate genes and their related genes in the PPI network. For embryo- and endosperm-related traits networks (Figure 5a), multiple candidate genes enriched in the transferase activities of various bases in substrate metabolism, such as Si605019d10 and GRMZM2G411956. Among them, GRMZM2G149617, GRMZM2G039919, GRMZM2G470010, and GRMZM2G374309 were enriched in the hexosyltransferase process (GO: 0016758, p < 0.05), Simk1, GRMZM2G149662, and GRMZM2G149639 were enriched in phosphoric ester hydrolase activity of energy metabolism (GO: 0042578, p < 0.05), GRMZM2G173684 and GRMZM2G167892 were enriched in RNA and DNA catalytic activities in transcription and translation processes (GO: 0140098, p < 0.05, GO: 0140640, p < 0.01), gigz1A, Si946084h12, GRMZM2G077008 and GRMZM2G149639 were enriched in signaling receptor activity (GO: 0038023, p < 0.05) and small GTPase binding process (GO: 0031267, p < 0.05). For cavity-related traits networks (Figure 5b), GRMZM2G048763 and co129760 were enriched in the energy generation-related ATP hydrolysis activity (ATP hydrolysis activity, GO: 0016887, p < 0.01), pyrophosphatase (GO: 0017111, p < 0.05) and nucleoside triphosphatase activity (GO: 0016462, p < 0.05). In addition, GRMZM2G099483 and GRMZM2G083394 were enriched in polyubiquitin modification-dependent protein binding (GO: 0031593, p < 0.01) and damaged DNA binding (GO: 0003684, p < 0.01). Notably, Pco085810 and EREB185 were enriched in processes such as oxidoreductase activity, acting on NAD(P)H (GO: 0016651, p < 0.05) that caused cell and tissue damage. These processes were related to intracellular energy, protein metabolism, and cell damage, suggesting that genes involved in this GO term might be involved in the formation of cavities within maize kernel endosperm.

4. Discussion and Conclusions

The structure of the maize kernels plays a critical role in determining maize yield and quality, and high-throughput, non-destructive microscope phenotypic characteristics acquisition and analysis are of great importance. Micro-CT has a significant advantage in the nondestructive acquisition of kernel internal structure information. However, methods and tools for the automatic extraction of valuable traits from CT images are still lacking. The quality of kernel CT images can often be compromised by the presence of significant noise, characterized by gray values between 0–50. Thus, it is a challenge to determine the optimal threshold for noise removal is a challenge that prevents accurate identification of complete kernel boundaries. In this study, we developed a semantic segmentation model based on U-Net architecture to extract maize kernels and embryo structures accurately. However, it is still difficult to identify a clear boundary between the silty and horny endosperm components due to their similar intensity values. Our research has shown that the silty endosperm can be effectively approximated by applying Gaussian filtering to the endosperm regions, followed by binarization using the Otsu method. Additionally, by utilizing a thresholding technique on the structures of the embryo and endosperm, it is possible to extract the total cavity, embryo cavity, and endosperm cavity of the kernel from the CT images. As a result, 20 traits related to individual maize kernels and internal embryos, endosperm, and cavity structures could be obtained with an efficiency of 5 s per kernel. The coefficients of determination for silty endosperm, embryo, endosperm cavity, endosperm, and embryo cavity volumes were 0.77, 0.95, 0.94, 0.95, and 0.73, respectively. The presented method can greatly improve the accuracy and efficiency of kernel phenotyping analysis and provide novel and valuable anatomical traits of the kernel for phenotype–genotype analysis. However, it is no denying that acquiring data using CT technology is relatively expensive, and the specific traits often require customized development of the phenotyping analysis pipeline.
The development of the embryo and endosperm of maize kernel is a complex dynamic process and is influenced by abiotic stresses and hormones. Most of the candidate genes associated with them are signaling receptors that play a role in adversity stress and regulation of growth and development. For example, the bHLH-transcription factor had been reported to control seed development and size in wheat [16], and GRMZM2G114873 was identified as a candidate gene of EN_Ratio in our study. In addition, another EN_Ratio candidate gene GRMZM2G359397, the GDP-L-galactose phosphorylase [17], was reported that catalyzed the synthesis of ascorbic acid in Arabidopsis, which was essential for the development of Arabidopsis seeds and seedlings. For EM_Volume, candidate gene GRMZM2G167892 coding the seed maturation protein [18] had been reported that abundantly expressed at the late stage of seed development, GRMZM2G065696 coding PLAC8 family protein [19] was shown that could increase plant and organ size when overexpressed in plants, GRMZM2G077008 as an ethylene receptor [20] coding gene was revealed that could induce endosperm cell death in maize kernels, protect embryos and promote embryo development, and GRMZM2G040161 coding 2-oxoglutarate (2OG) and Fe(II)-dependent oxygenase superfamily protein [21] had been reported to be involved in multiple metabolic processes of plant growth and development, such as gibberellin biosynthesis and catabolism, ethylene processes of biosynthesis, steroid glycoalkaloid biosynthesis, and flavonoid metabolism. For EN_Ratio, candidate genes LOC109945391 and GRMZM2G058954 regulated RNA transcription and protein synthesis, such as transfer RNA isoleucine and DNA recombination family protein.
It’s worth noting that kernel cavities are influenced not only by environmental factors such as external temperature and moisture but also by seed water content and cellular state. It has been reported that candidate genes associated with cavity traits were mostly related to stress resistance and cell death, such as polyadenylate-binding domain-containing proteins that cause chlorosis and growth inhibition of tobacco leaves when expressed in tobacco [22]. In this study, GRMZM2G069816 as a candidate gene of C_Volume, coding Polyadenylate-binding protein-interacting protein might lead to the necrosis of endosperm cells, which in turn leads to the formation of endosperm cavity. In addition to C_Volume, LOC103654295, the LOR family genes in soybean played a role in abiotic stress, such as salt stress. GRMZM2G069687 coding SCAR-like protein [23] could regulate the metabolism of water loss in rice, and knocking out the gene can lead to leaf drought and premature senescence. LOC100286109, coding the dehydration-responsive element-binding protein [24], is abundantly expressed in maize under drought and salt stress, and this gene could be transferred to Arabidopsis to improve drought tolerance. LOC113687179, coding DCD domain protein, that proteins containing this domain can control cell development and apoptosis [25]. In addition, GRMZM2G028969, an AP2/EREBP transcription factor gene, can improve drought tolerance in Arabidopsis. For C_Ratio, GRMZM5G896731, coding peptidyl-tRNA hydrolase [26], it had been reported that it inactivated at temperatures higher than 43 °C, affecting protein synthesis. These results will provide new theoretical support for in-depth analysis of the genetic mechanism of kernel structure traits. Our work demonstrates the feasibility of using CT-characterized three-dimensional information on maize kernel internal structures for gene mining. While GWAS can identify genes with strong statistical associations to traits, further biological experiments are necessary for validation. In the future, we will conduct gene editing and validation work for these valuable traits.

Supplementary Materials

The following supporting information can be downloaded at: https://www.mdpi.com/article/10.3390/agronomy13041078/s1, Table S1: 303 inbred lines of the maize association analysis population used in this study. Table S2: SNP loci significantly correlated with kernel structure phenotype. Table S3: Candidate genes and functional annotation of kernel structure phenotype. Figure S1: GWAS analysis of six key kernel traits. Note: a GWAS analysis of EM_Volume. b GWAS analysis of EM_Ratio. c GWAS analysis of C_Volume. d GWAS analysis of C_Ratio. e GWAS analysis of EN_Volume. f GWAS analysis of EN_ Ratio. Figure S2: Map of the protein encoded by candidate genes of six key kernel traits. Figure S3: Variation of kernels and embryos of different inbred lines. Note: For the kernels visualized by the ray casting algorithm, the shades with heavier colors represent the embryos; the first row is the front view of the embryo surface, and the second row is the side view of the embryo surface; the kernel varieties from left to right are cuan48-2, LXN, CF3, Zhi41, Dan4245, TY1, Dan340, and Jing725.

Author Contributions

Conceptualization, X.G.; methodology, D.L. and J.W.; software, D.L.; validation, D.L. and J.D.; formal analysis, D.L.; resources, Y.Z. and X.G.; data curation, Y.Z. and X.L.; writing—original draft preparation, D.L. and J.W.; writing—review and editing, J.D.; visualization, D.L.; supervision, J.D. and X.G.; funding acquisition, J.D. and X.G. All authors have read and agreed to the published version of the manuscript.

Funding

This study was supported by the Construction of Collaborative Innovation Center of Beijing Academy of Agriculture and Forestry Science (KJCX201917), the National Natural Science Foundation of China (U21A20205), the National Key Research and Development Program (2022YFD1900701), the Heilongjiang Province “Enlisting and Leading” Science and Technology Research Projects (20212XJ05A02), and Beijing Academy of Agriculture and Forestry Sciences Grants (QNJJ202124).

Institutional Review Board Statement

Not applicable.

Informed Consent Statement

Not applicable.

Data Availability Statement

The datasets generated and/or analyzed during the current study are available from the corresponding author upon reasonable request.

Acknowledgments

We gratefully acknowledge the Maize Research Center, Beijing Academy of Agriculture and Forestry Sciences, for preparing the seeds and materials. We also thank Yan’s lab from Huazhong Agricultural University and Yang’s lab from China Agricultural University for providing seeds of the maize inbred lines.

Conflicts of Interest

The authors declare no conflict of interest.

References

  1. Zhao, H.; Wang, J.; Liao, S.; Zhang, Y.; Lu, X.; Guo, X.; Zhao, C. Study on the micro-phenotype of different types of maize kernels based on Micro-CT. Smart Agric. 2021, 3, 16–28. [Google Scholar]
  2. Rousseau, D.; Widiez, T.; Di Tommaso, S.; Rositi, H.; Adrien, J.; Maire, E.; Langer, M.; Olivier, C.; Peyrin, F.; Rogowsky, P.M. Fast virtual histology using X-ray in-line phase tomography: Application to the 3D anatomy of maize developing seeds. Plant Methods 2015, 11, 1–10. [Google Scholar] [CrossRef] [PubMed]
  3. Dai, D.; Ma, Z.; Song, R. Maize endosperm development. J. Integr. Plant Biol. 2021, 63, 613–627. [Google Scholar] [CrossRef] [PubMed]
  4. Guelpa, A.; du Plessis, A.; Kidd, M.; Manley, M. Non-destructive Estimation of Maize (Zea mays L.) Kernel Hardness by Means of an X-ray Micro-computed Tomography (μCT) Density Calibration. Food Bioprocess Technol. 2015, 8, 1419–1429. [Google Scholar] [CrossRef]
  5. Yin, X.; Ming, B.; Hou, J.; Ming, B.; Zhang, Y.; Guo, X.; Gao, S.; Wang, K.; Hou, P.; Li, S. Effects of various grain positions of ear on the internal structural parameters of maize grain using X-ray μCT. Trans. Chin. Soc. Agric. Eng. 2021, 37, 8–14. [Google Scholar]
  6. Hou, J.; Zhang, Y.; Jin, X.; Dong, P.; Guo, Y.; Wang, K.; Fan, Y.; Li, S. Structural parameters for X-ray micro-computed tomography (μCT) and their relationship with the breakage rate of maize varieties. Plant Methods 2019, 15, 1–11. [Google Scholar] [CrossRef]
  7. Qu, J.; Feng, W.; Zhang, X.; Xu, S.-T.; Xue, J.-Q. Dissecting the genetic architecture of maize kernel size based on genome-wide association study. Acta Agron. Sin. 2022, 1, 203–214. [Google Scholar]
  8. Li, X.; Wang, M.; Zhang, R.; Fang, H.; Fu, X.; Yang, X.; Li, J. Genetic architecture of embryo size and related traits in maize. Crop. J. 2021, 10, 204–215. [Google Scholar] [CrossRef]
  9. Cui, F.; Li, X.; Lu, S.; Zhang, X.; Qi, Y. Genome-wide Association Study of Kernel Colors in Maize. Mol. Plant Breed. 2022, 10, 1–15. [Google Scholar]
  10. Zhou, H.; Riche, A.B.; Hawkesford, M.J.; Whalley, W.R.; Atkinson, B.S.; Sturrock, C.J. Determination of wheat spike and spikelet architecture and grain traits using X-ray Computed Tomography imaging. Plant Methods 2021, 17, 26. [Google Scholar] [CrossRef]
  11. Jiang, Z.; Tu, H.; Bai, B.; Yang, C.; Zhao, B.; Guo, Z.; Liu, Q.; Zhao, H.; Yang, W.; Xiong, L.; et al. Combining UAV-RGB high-throughput field phenotyping and genome-wide association study to reveal genetic variation of rice germplasms in dynamic response to drought stress. New Phytol. 2021, 232, 440–455. [Google Scholar] [CrossRef]
  12. Yang, X.; Gao, S.; Xu, S.; Zhang, Z.; Prasanna, B.M.; Li, L.; Li, J.; Yan, J. Characterization of a global germplasm collection and its potential utilization for analysis of complex quantitative traits in maize. Mol. Breed. 2010, 28, 511–526. [Google Scholar] [CrossRef]
  13. Liu, X.; Huang, M.; Fan, B.; Buckler, E.; Zhang, Z. Iterative Usage of Fixed and Random Effect Models for Powerful and Efficient Genome-Wide Association Studies. PLoS Genet. 2016, 12, e1005767. [Google Scholar] [CrossRef]
  14. Wang, J.; Zhang, Z. GAPIT Version 3: Boosting Power and Accuracy for Genomic Association and Prediction. Genom. Proteom. Bioinform. 2021, 19, 629–640. [Google Scholar] [CrossRef]
  15. Yushkevich, P.A.; Piven, J.; Hazlett, H.C.; Smith, R.G.; Ho, S.; Gee, J.C.; Gerig, G. User-guided 3D active contour segmentation of anatomical structures: Significantly improved efficiency and reliability. NeuroImage 2006, 31, 1116–1128. [Google Scholar] [CrossRef] [Green Version]
  16. Zhang, T.; Lv, W.; Zhang, H.; Ma, L.; Li, P.; Ge, L.; Li, G. Genome-wide analysis of the basic Helix-Loop-Helix (bHLH) transcription factor family in maize. BMC Plant Biol. 2018, 18, 1–14. [Google Scholar] [CrossRef] [PubMed] [Green Version]
  17. Dowdle, J.; Ishikawa, T.; Gatzek, S.; Rolinski, S.; Smirnoff, N. Two genes in Arabidopsis thaliana encoding GDP-l-galactose phosphorylase are required for ascorbate biosynthesis and seedling viability. Plant J. 2007, 52, 673–689. [Google Scholar] [CrossRef] [PubMed]
  18. Delseny, M.; Bies-Etheve, N.; Carles, C.; Hull, G.; Vicient, C.M.; Raynal, M.; Grellet, F.; Aspart, L. Late Embryogenesis Abundant (LEA) protein gene regulation during Arabidopsis seed maturation. J. Plant Physiol. 2001, 158, 419–427. [Google Scholar] [CrossRef]
  19. Guo, M.; Rupe, M.A.; Dieter, J.A.; Zou, J.; Spielbauer, D.; Duncan, K.E.; Howard, R.J.; Hou, Z.; Simmons, C.R. Cell Number Regulator1 Affects Plant and Organ Size in Maize: Implications for Crop Yield Enhancement and Heterosis. Plant Cell 2010, 22, 1057–1073. [Google Scholar] [CrossRef] [Green Version]
  20. Gallie, D.R.; Young, T.E. The ethylene biosynthetic and perception machinery is differentially expressed during endosperm and embryo development in maize. Mol. Genet. Genom. 2004, 271, 267–281. [Google Scholar] [CrossRef]
  21. Wei, S.; Zhang, W.; Fu, R.; Zhang, Y. Genome-wide characterization of 2-oxoglutarate and Fe(II)-dependent dioxygenase family genes in tomato during growth cycle and their roles in metabolism. BMC Genom. 2021, 22, 1–14. [Google Scholar] [CrossRef] [PubMed]
  22. Li, Q.; Von Lanken, C.; Yang, J.; Lawrence, C.B.; Hunt, A.G. The yeast polyadenylate-binding protein (PAB1) gene acts as a disease lesion mimic gene when expressed in plants Enhanced Reader. Plant Mol. Biol. 2000, 42, 335–344. [Google Scholar] [CrossRef] [PubMed]
  23. Rao, Y.; Yang, Y.; Xu, J.; Li, X.; Leng, Y.; Dai, L.; Huang, L.; Shao, G.; Ren, D.; Hu, J.; et al. EARLY SENESCENCE1 Encodes a SCAR-LIKE PROTEIN2 That Affects Water Loss in Rice. Plant Physiol. 2015, 169, 1225–1239. [Google Scholar] [CrossRef] [PubMed] [Green Version]
  24. Wang, C.; Yang, Q.; Wang, C. Isolation and Functional Characterization of ZmDBP2 Encoding a Dehydration-Responsive Element-Binding Protein in Zea mays. Plant Mol. Biol. Report. 2011, 29, 60–68. [Google Scholar] [CrossRef]
  25. Tenhaken, R.; Doerks, T.; Bork, P. DCD–a novel plant specific domain in proteins involved in development and programmed cell death. BMC Bioinform. 2005, 6, 169. [Google Scholar] [CrossRef] [Green Version]
  26. Menninger, J.R.; Walker, C.; Tan, P.F. Studies on the Metabolic Role of Peptidyl-tRNA Hydrolase. Mol. Genet. Genom. 1973, 121, 307–324. [Google Scholar] [CrossRef]
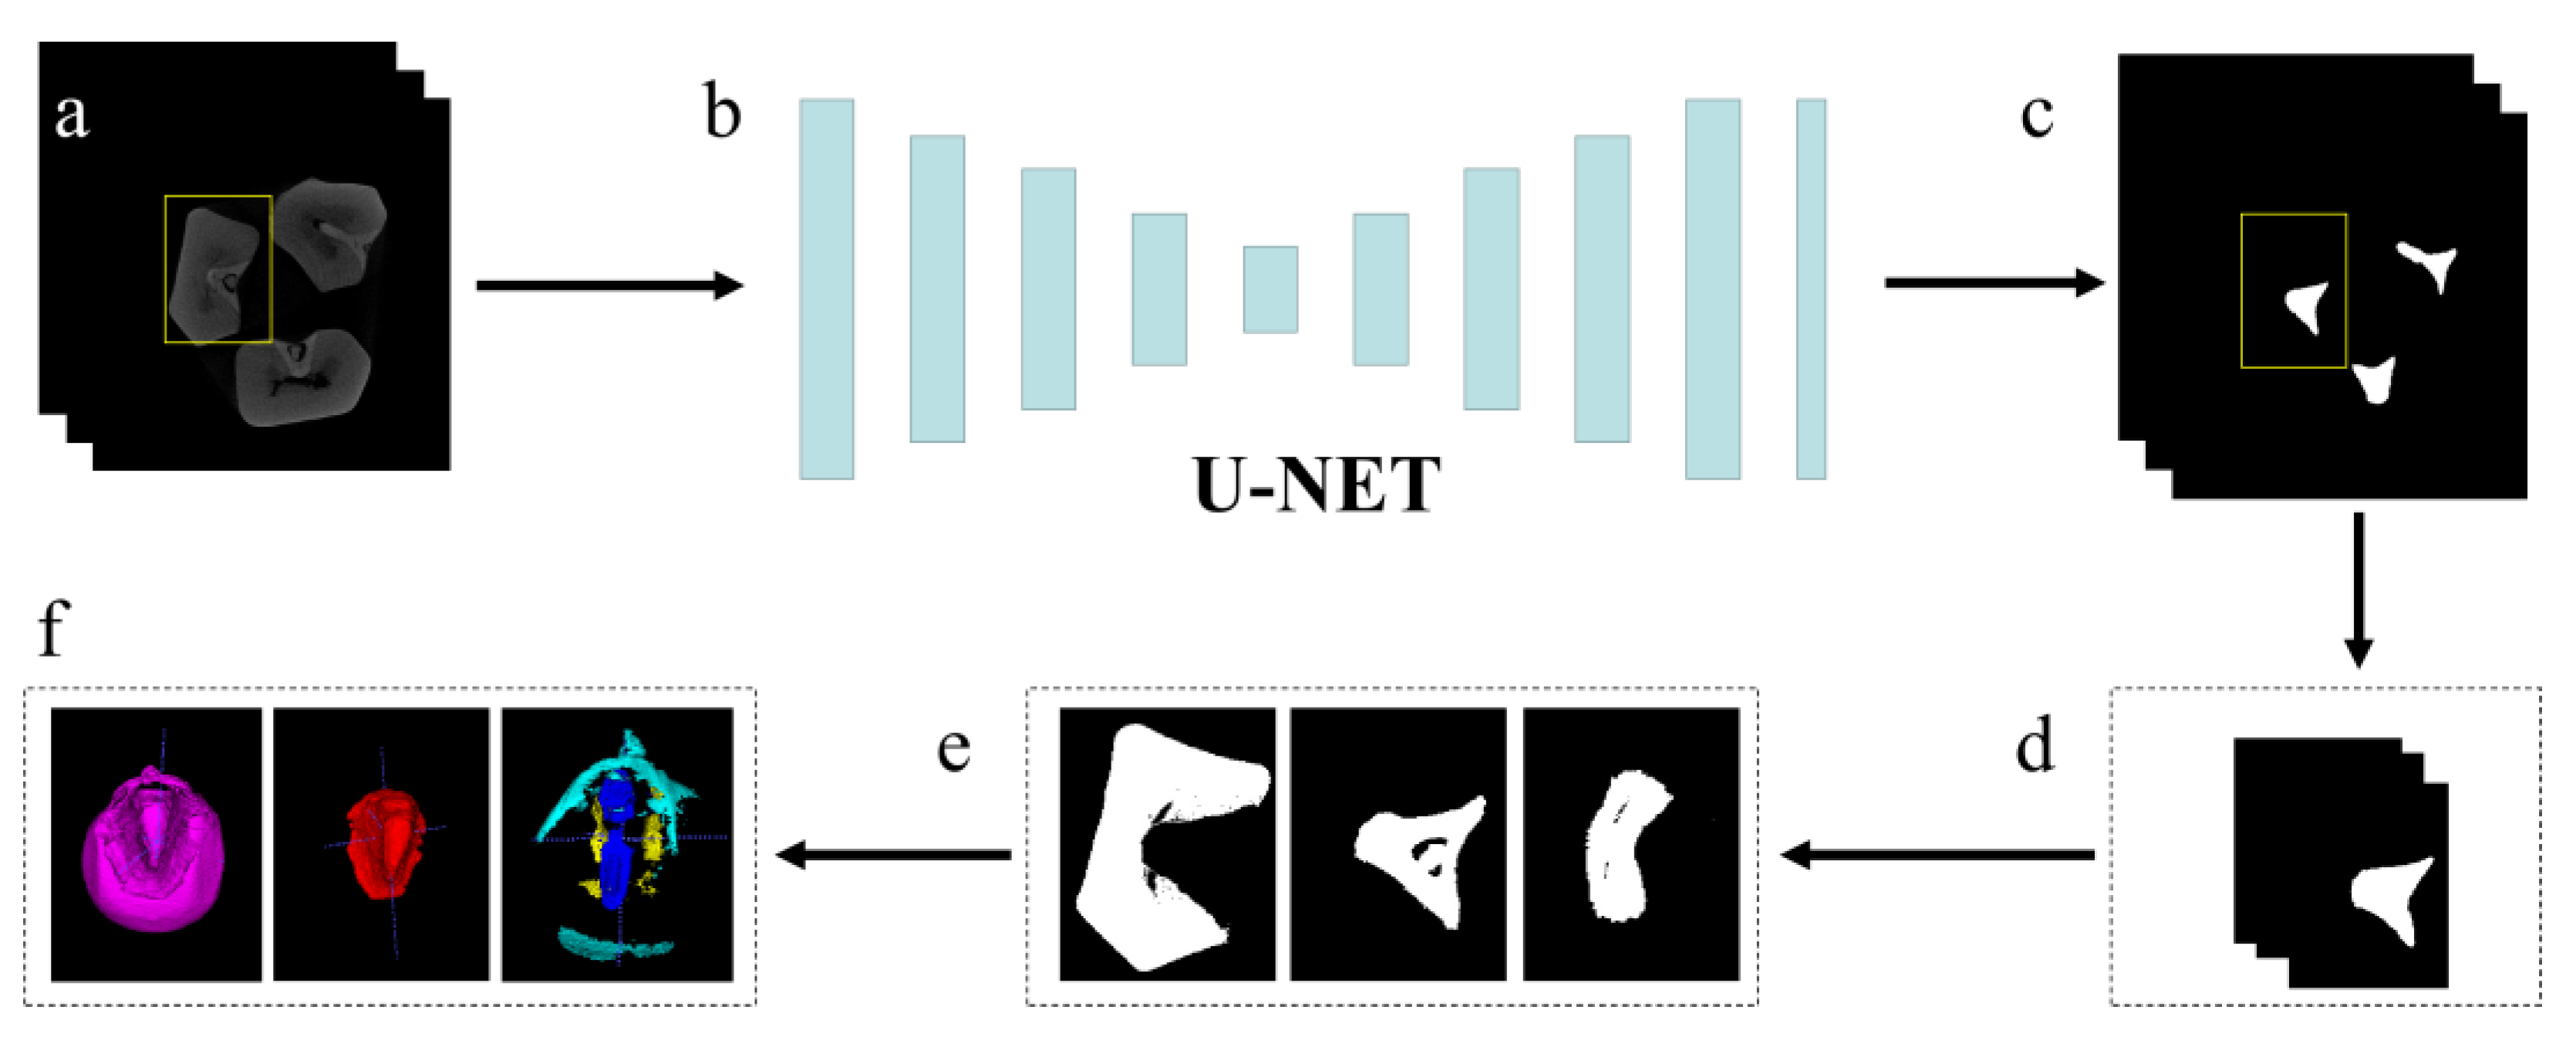
Figure 1. The flow chart of batch kernel treatment pipeline. Note: (a) CT image sequence. (b) U-Net network. (c) Segment embryo and kernel masks. (d) Extract a single kernel with an embryo. (e) Generate endosperm, embryo, and silty endosperm with cavities. (f) Visualize the 3D structures of endosperm, embryos, and cavities. Yellow box represents a single kernel that is automatically extracted for phenotyping and visualization.
Agronomy 13 01078 g001
Figure 2. The visualization of the segmentation results of the embryo, endosperm, and cavity. Note: (a) The segmentation results of embryo and endosperm. Red, pink, and green represent embryo, horny endosperm, and silty endosperm, respectively; each column represents a kernel sample, and rows 1 to 4 represent cross-sectional, coronal, sagittal, and 3D reconstruction results, respectively. (b) The segmentation results of the cavity. Cyan, yellow and blue represent the subcutaneous cavity, embryonic cavity, and endosperm cavity, respectively; each column represents a kernel sample, and rows 1 to 4 represent the cross-sectional, coronal, sagittal, and 3D reconstruction results, respectively.
Agronomy 13 01078 g002
Figure 3. Results of cluster analysis of kernel traits for the maize association analysis population. Note: (a) the results of the cluster analysis of kernel traits. (b) the weights of phenotypic parameters for cluster centers.
Agronomy 13 01078 g003
Figure 4. Correlation analysis of kernel phenotypic traits.
Agronomy 13 01078 g004
Figure 5. GO analysis of proteins encoded by candidate genes for six key kernel traits. Note: (a) enrichment by candidate genes for embryo and endosperm traits. (b) enrichment by candidate genes for cavity traits.
Agronomy 13 01078 g005
Table 1. The description of maize kernel traits in this study.
TypeTraitsUnitDescription
KernelK_LengthmmKernel length
K_WidthmmKernel width
K_ThickmmKernel thickness
K_Volumemm3Kernel volume
K_Areamm2Kernel surface area
K_SSAmm2/mm3Specific surface area
K_Sph/Kernel sphericity
EmbryoEM_Volumemm3embryo volume
EM_Ratio/EM_Volume/K_Volume
R_EM2EN/EM_Volume/EN_Volume
EndospermEN_Volumemm3Endosperm volume
EN_S_Volumemm3Silty endosperm volume
EN_H_Volumemm3Horny endosperm volume
R_S2H/EN_S_Volume/EN_H_Volume
EN_Ratio/EN_Volume/K_Volume
CavityC_Volumemm3Cavity volume
C_P_Vmm3Subcutaneous cavity
C_EM_Vmm3Embryo cavity
C_EN_Vmm3endosperm cavity
C_Ratio/C_Volume / K_Volume
Table 2. Results of descriptive statistical analysis for kernel phenotypic traits.
TraitsRangeMeanStandard DeviationSkewnessKurtosisCoefficient of Variation cv/%
K_Length5.93–12.169.780.98−0.080.1110.02
K_Width3.73–10.448.230.80−0.502.779.7
K_Thick3.21–7.645.280.710.33−0.1113.4
K_Volume31.06–319.95200.0841.450.070.3020.7
K_Area59.07–636.33259.2665.711.806.1625.3
K_SSA0.97–2.651.320.271.923.6520.5
K_Sph0.21–0.690.420.090.26−0.2621.4
EM_Volume3.80–67.4525.307.271.314.8428.7
EM_Ratio0.09–0.250.120.031.834.4425.0
R_EM2EN0.11–0.370.170.052.035.2329.4
EN_Volume22.05–239.08150.1332.680.060.2021.7
EN_S_Volume0.76–182.6846.2327.561.553.4259.6
EN_H_Volume21.29–173.96103.9127.81−0.25−0.1026.8
R_S2H0.17–28.743.482.853.5522.3781.9
EN_Ratio0.63–0.830.750.03−1.021.704.0
C_Volume0.36–16.123.522.342.016.5666.5
C_P_V0.02–13.491.951.782.368.3891.3
C_EM_V0.05–3.630.980.581.412.9659.2
C_EN_V0.00–11.811.011.633.0512.05163
C_Ratio0.002–0.080.0170.0112.137.4864.7
Disclaimer/Publisher’s Note: The statements, opinions and data contained in all publications are solely those of the individual author(s) and contributor(s) and not of MDPI and/or the editor(s). MDPI and/or the editor(s) disclaim responsibility for any injury to people or property resulting from any ideas, methods, instructions or products referred to in the content.