Article

Greater Propensity to Photosynthesize Enables Superior Grain Quality of Indica–japonica Hybrid Rice under Shading

1
MARA Key Laboratory of Sustainable Crop Production in the Middle Reaches of the Yangtze River/College of Agriculture, Yangtze University, Jingzhou 434000, China
2
Tasmanian Institute of Agriculture, University of Tasmania, Newnham Drive, Launceston, TAS 7248, Australia
3
Agricultural and Rural Bureau of Duodao District, Jingmen 448000, China
*
Author to whom correspondence should be addressed.
Agronomy 2023, 13(2), 535; https://doi.org/10.3390/agronomy13020535
Submission received: 20 December 2022 / Revised: 30 January 2023 / Accepted: 10 February 2023 / Published: 13 February 2023

Abstract

:
Indica–japonica hybrid rice (I–JR) typically has greater grain yield than that of Indica hybrid rice (IR) under prolific shading, but it is not known how shading impacts on physiological characteristics underpinning grain quality. Here, we conducted a two-year field experiment in the mid-reaches of the Yangtze River region using I–JR (genotypes Yongyou 1540 and Yongyou 538) and IR (genotypes Y-liangyou 900 and Quanyouhuazhan). We found that shading reduced grain appearance and quality, particularly milling and heading rates, and chalkiness. Shading disrupted carbon and nitrogen metabolism, impacting traits influencing the human perception of the taste of the grain, such that amylose decreased by 5.9% (I–JR) and 12.9% (IR); grain protein significantly increased, with lesser effects in I–JR than IR under shading. Shading also reduced peak, hot, and final viscosities, and breakdown value. I–JR had improved rice quality compared with that of IR due to the greater propensity of the former to photosynthesize under shading, leading to the improved functioning of carbon and nitrogen metabolism.

1. Introduction

In two subspecies of rice, indica rice (IR) and hybrid rice (JR), the use of heterosis between them is considered an important way to increase rice yield. Compared with IR, Indica–japonica hybrid rice (I–JR) is able to utilize light and temperature resources more efficiently and fully, which gives I–JR a longer grain filling period than that of IR [1,2,3]. However, the longer time to maturity may extend the growing season into unfavorable weather of suboptimal temperature [4] and low light during the rice growth stage, especially in the panicle differentiation stage and the grain filling stage. Continuous rainy weather causes significant reductions in rice grain yield [5,6], even though waterlogged soils do not impact rice to the extent that they do other staple cereals, such as wheat and maize [7].
Similar to grain yield, grain quality as a trait reflects the cumulation of effects over the growing season, encompassing management, weather, nutrition, biotic controls, and their interaction [8,9,10,11,12]. Weather impacts rice quality through the development of the grain endosperm, and associated physiological and biochemical processes [13,14]. The impact of light (duration and intensity) is one of the most critical determinants of grain quality [15,16]. Science has progressed in our understanding of the influence of shading on rice quality. Some studies theorized that shading from heading to maturity could increase the head rice rate and reduce the chalkiness of rice [17]. However, some studies showed that shading stress significantly increased chalkiness rate and degree, resulting in a lower milled-rice rate, deteriorating the appearance and processing quality [18,19]. Compared with ambient light conditions, shading at 50% reduced the heading rate, penalizing processing quality [20,21].
Starch is the main component of rice grain, primarily consisting of amylose and amylopectin. Among these constituents, amylose content has the greatest impact on rice quality [22]. The correlation between amylose content in rice and light intensity is often strongly positive, such that shading significantly increases amylose content [23]. Protein content determines nutritional quality, having a negative impact on amylose content and chalkiness rate [24,25]. In addition, studies on shading offer an advanced contemporary understanding of how nitrogen metabolism and inhibited carbon metabolism impact nitrogen and protein concentration in grains [26,27].
Our prior study showed that I–JR had greater photosynthetic capacity and yield than that of IR under shading stress [28]. To further study the effects of shading after flowering on the quality of I–JR, we conducted a two-year field experiment and systematically analyzed the experimental data. I–JR cultivars Yongyou 1540 and Yongyou 538 were used as treatment cultivars, while IR cultivars Y-Liangyou 900 and Quanyouhuazhan were used as controls, given their popularity in the middle reaches of the Yangtze River. By establishing shading experiments in the field, we simulated shading under real solar radiation that I–JR after flowering was likely to encounter in the middle reaches of the Yangtze River. Our aims were to (1) compare the grain quality between I–JR and IR under shading stress. and (2) analyze the quality adaptability of I–JR in the middle reaches of the Yangtze River.

2. Methods and Materials

2.1. Field Experimental Details

Field experimentation was conducted in the paddy fields of Yangtze University (Jingzhou, 32°21′ N, 112°31′ E, 34 m asl) during 2020–2021. The experimental site is located in the middle reaches of the Yangtze River, China. The soil was clay loam with the following properties: pH 6.7, 18.7 g kg−1 organic matter, 136.3 mg kg−1 hydrolyzable N, 30.2 mg kg−1 available p, and 121.5 mg kg−1 available K. Data for the soil properties were means across the two years. Soil samples taken from the upper 20 cm of the soil were used to test soil properties.
Four hybrid rice varieties were chosen as the experimental materials, which they had been widely grown in China. Genotypic and growth period details are shown in Table 1 and Table 2. Pregerminated seeds were sown in a seedbed at 25 g m−2 seedlings were manually transplanted at 30 to 32 days old to field plots, with 20 × 30 cm hill spacings and two seedlings per hill.
The experiments were performed in a split-plot design. The main plots were four rice cultivars, and the subplots consisted of two shading treatments: no shading (Normal) and 40% shading (Shading). When the rice plants were at the full-heading stage, a shading net was used at 2.5 m above the ground to reduce 40% of the natural light intensity from the flowering to the maturity stage. The plot size was 32 m2 with three replications. N fertilizer was applied at the basal, tillering, and panicle initiation stages in a ratio of 5:2:3: 90, 36, and 54 kg N ha−1 respectively. Phosphorus (100 kg ha−1) was applied and incorporated into all subplots on the day before transplantation. Potassium (180 kg ha−1) was split equally between the basal and panicle initiation stages. The N, P, and K sources were urea, calcium superphosphate, and potassiumchloride, respectively. Crop management followed the standard cultural practices.

2.2. Plants Sampling and Measurements

At maturity stage (MA), a diagonal 5 m2 area was harvested to determine grain yield. The panicle number was recorded from those 12 hills. Plant samples were separated into straw and panicles. The dry weight of straw was determined after oven drying at 70 °C to constant weight. The panicles were hand-threshed, and the filled spikelets were separated from the unfilled spikelets by submerging them in tap water. Three 30 g subsamples of filled spikelets and three 3 g subsamples of unfilled spikelets were assessed to determine the number of spikelets. The dry weights of rachis, and filled and unfilled spikelets were determined after oven drying at 70 °C to constant weight. The total dry weight of straw, rachis, and filled and unfilled spikelets was considered the above-ground weight. Spikelets per panicle and grain filling percentage were calculated. Grain yield was determined from a 5 m2 area in each plot and adjusted to the standard moisture content of 0.14 g H2O g−1.

2.3. Rice Quality

2.3.1. Rice Processing and Appearance Quality

The rice was harvested at the mature stage. Three biological replicates of each rice variety were collected, threshed, naturally dried, and stored for three months. The national standard of the People’s Republic of China (GB/T17891-2017) was used to determine the brown rice rate (BR), milled rice rate (MR), head rice rate (HR), chalkiness rate (CR), chalkiness degree (CD).

2.3.2. Amylose Content

The rice was pulverized by a plant pulverizer and passed through a 100-mesh sieve after pulverization. Referring to the method of Xu Dong, the amylose content was determined via iodine colorimetry [29].

2.3.3. Protein Components

The rice was pulverized with a plant pulverizer and passed through a 100-mesh sieve after pulverization. Referring to the method of Fen zhiming, the protein components were determined via BCA [30].

2.3.4. RVA Profile Characteristics

The rice was pulverized with a plant pulverizer and passed through a 100-mesh sieve after pulverization. The RVA4500 rapid viscosity-measuring instrument of PERTEN Company was used for testing, and matching software TWC was used for analysis. The characteristic values of the RVA spectrum include peak viscosity (PV), hot viscosity (HV), final viscosity (FV), breakdown value (BKV), setback (SB), peak viscosity time (PVT), and gelatinization temperature (GT).

2.3.5. Taste Value

Cooked Rice Taste Analyzer STA1A (Satake Co., Ltd., Hiroshima, Japan) was used to measure the taste value of rice grains. The taste value is a comprehensive evaluation of cooked grain that consists of appearance, hardness, viscosity, and the degree of balance [31].

2.4. Statistical Analysis

Data were analysed using two-way analysis of variance with SAS 9.2 (SAS Institute, Cary, NC, USA). The means were compared with the least-significant-difference (LSD) test at the 0.05 probability level.

3. Results

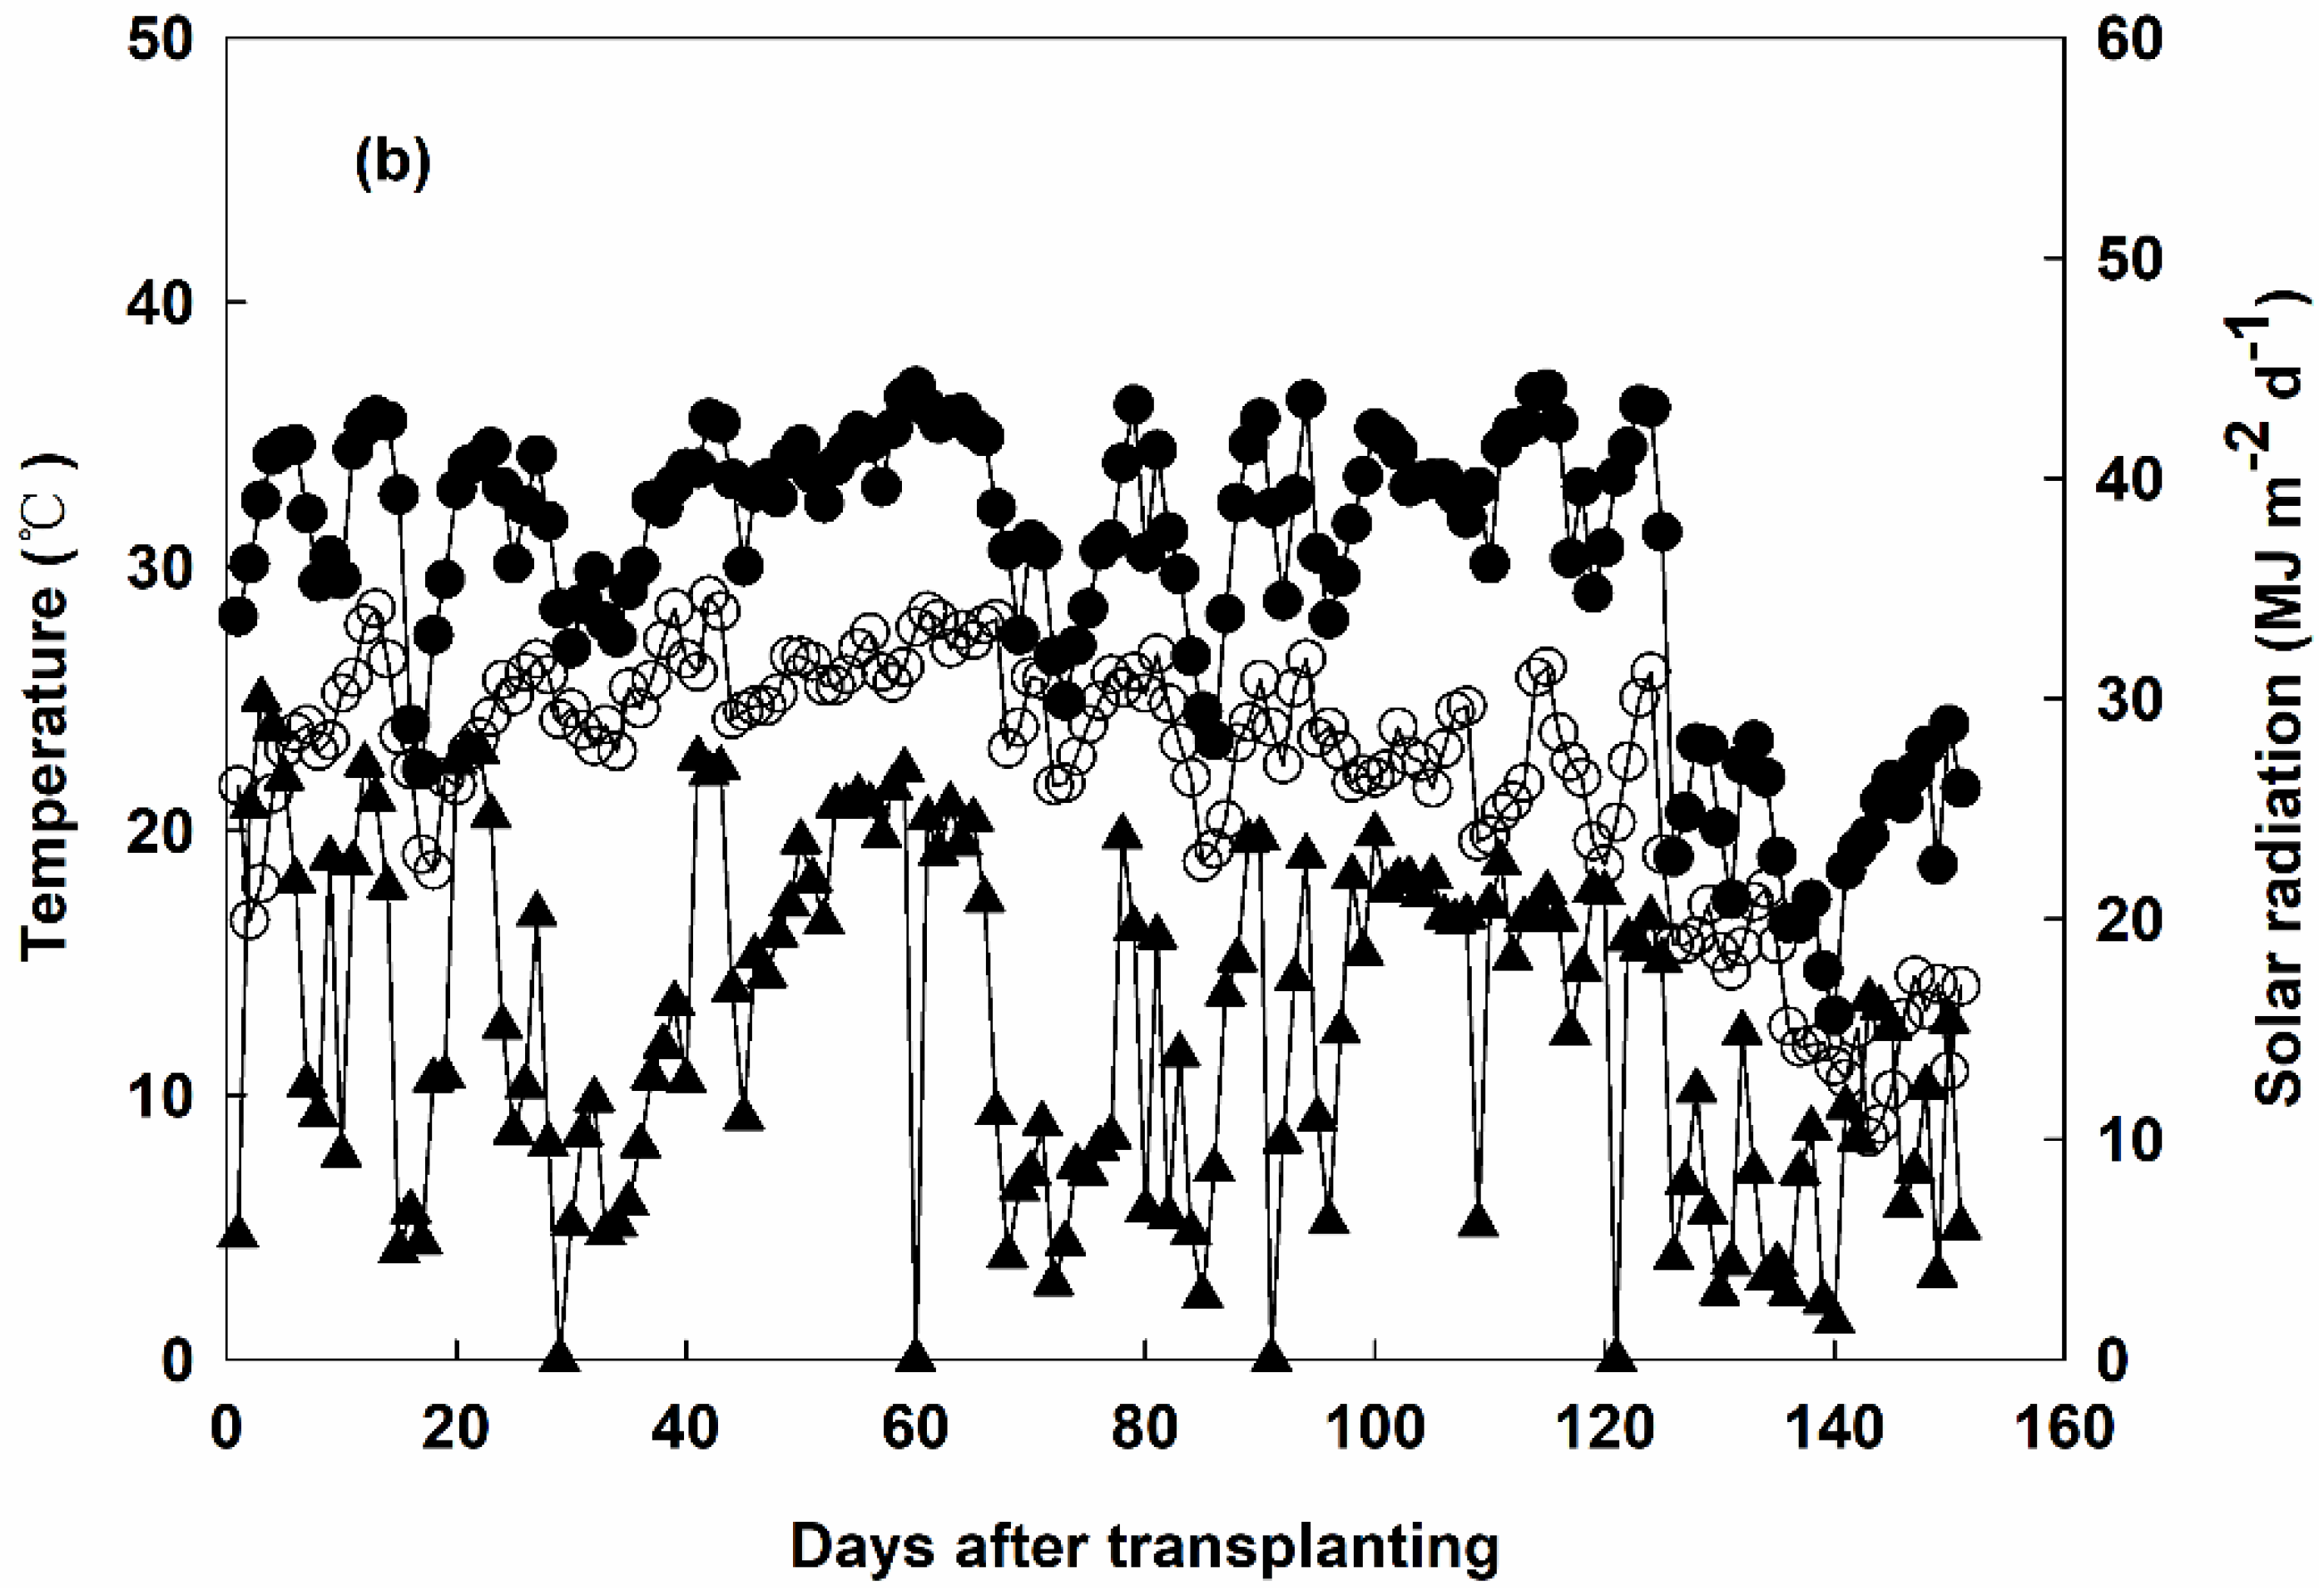
3.1. Climate Conditions
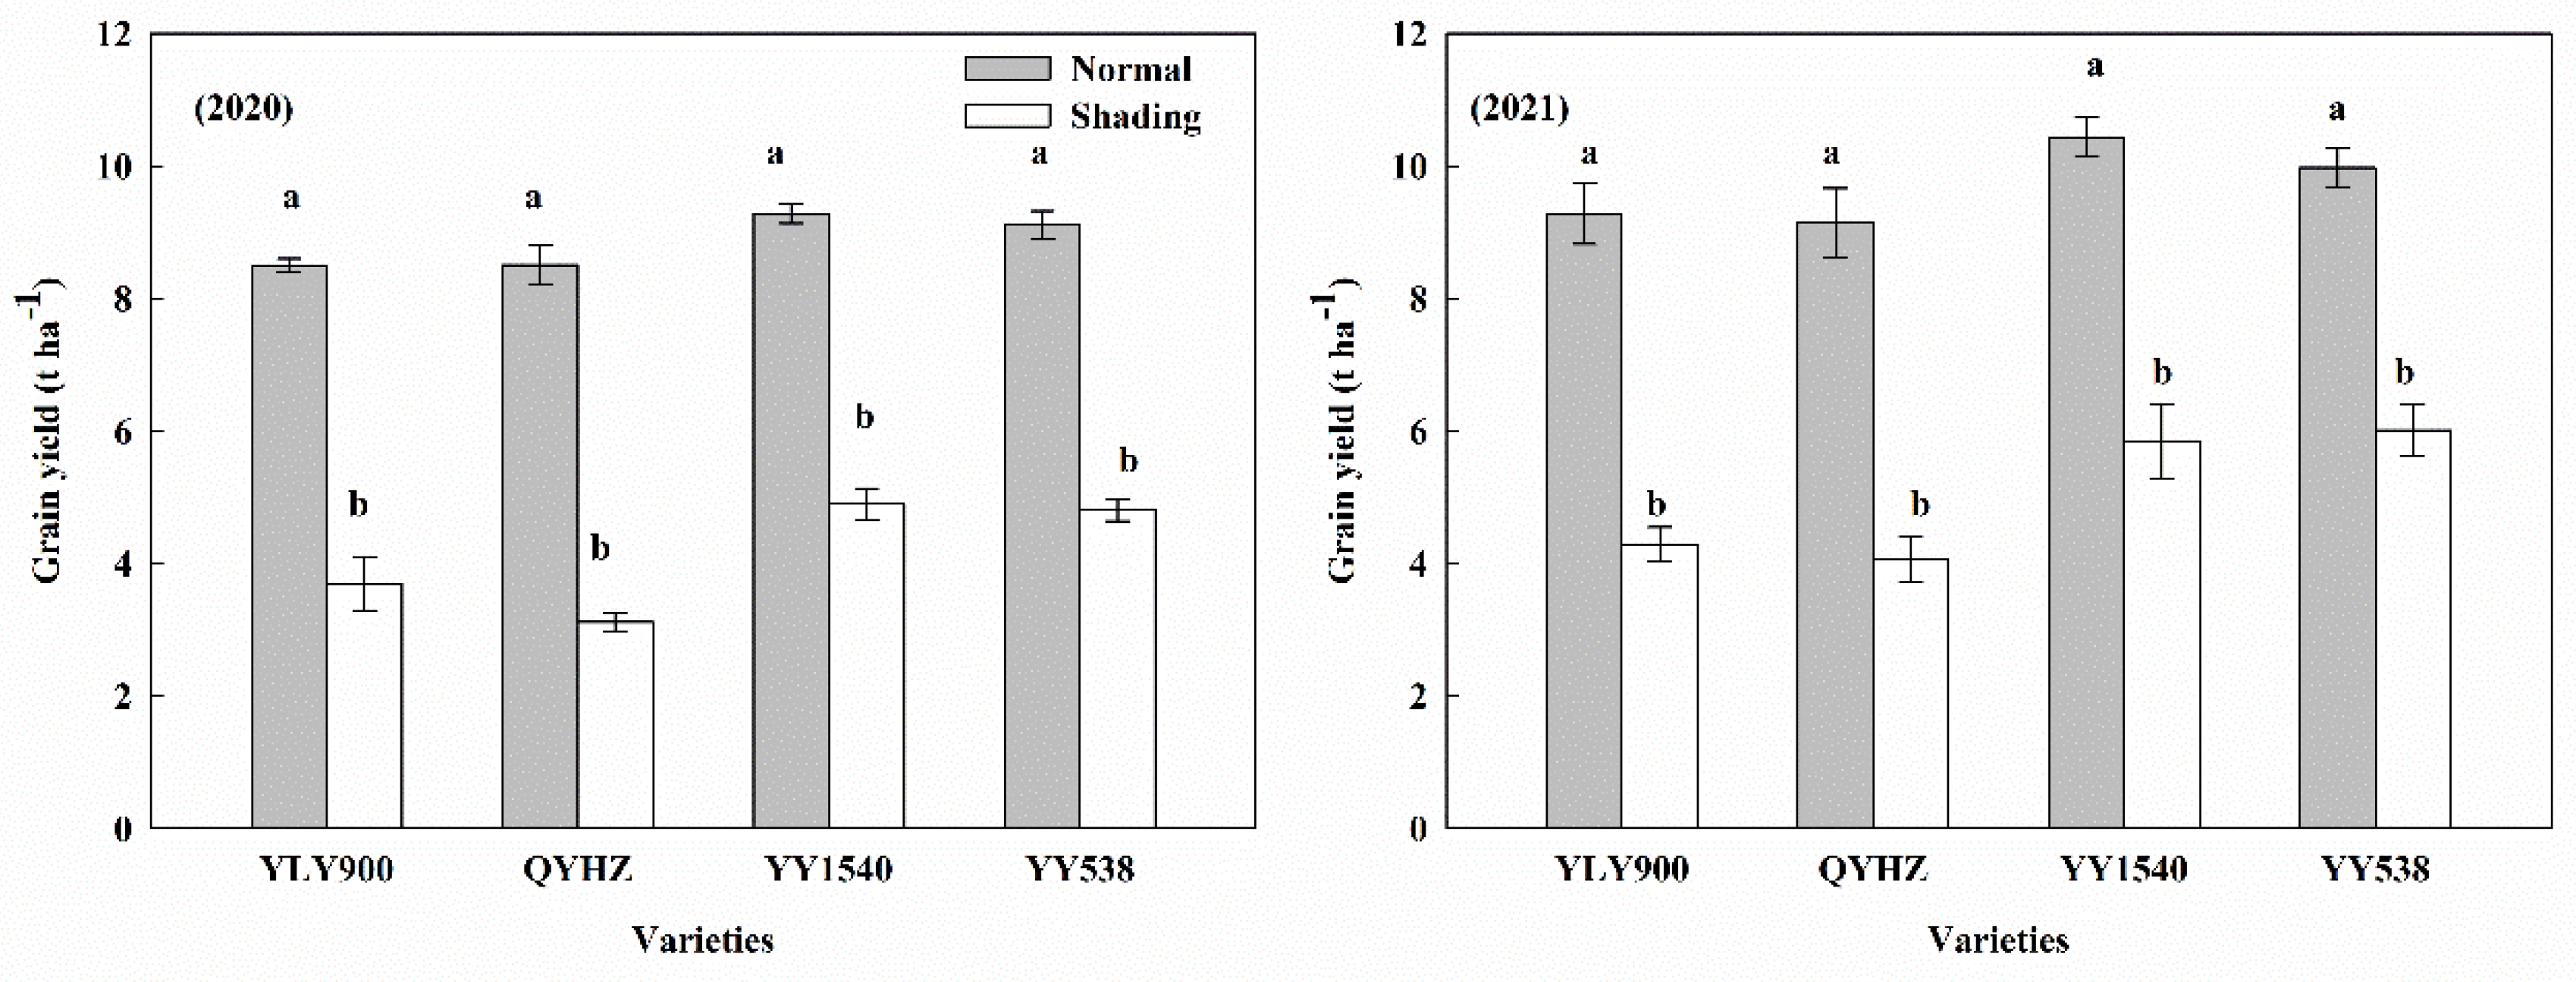
As shown in Figure 1, compared with 2020, the temperature in the rice growth stage (June–October) in 2021 was more conducive to the growth and development of rice. The lowest temperature in Jingzhou was 21.5 °C in 2020 and 22.3 °C in 2021. The average daily radiation during the grain filling period (mid-August to mid-October) in 2020 was 15.1 and 15.5 MJ m−2 d−1 in 2020 and 2021, respectively.

3.2. Grain Yield

Shading significantly reduced the grain yield of all cultivars (Figure 2). In normal conditions, the average grain yield of I–JR and IR was 9.7 and 8.9 t ha−1 across two years, and I–JR had a 9.5% yield advantage over the IR. Under shading stress, the two-year average grain yield of I–JR was 5.4 t ha−1, while that of IR was 3.8 t ha−1. Compared with normal conditions, the grain yield of IR under shading in 2020 decreased by 60.0%, which was significantly greater than that of I–JR (47.2%); in 2021, the grain yield of I–JR decreased by 41.9%, and the decline of IR was 54.7%.

3.3. Rice Processing and Appearance Quality

Shading stress decreased the MR and HR of all cultivars, and the HR was the most affected by shading (Table 3). Compared with normal conditions, the MR and HR of IR decreased by 6% and 14% respectively across two years, while I–JR decreased by 4.5% and 9%. Shading also increased the CR and CD of all cultivates. The CR and CR of I–JR increased by 65% and 124% in 2020–2021, which were lower than that of IR (78% in CR and 162% in CD).
Shading after flowering had different effects on rice processing and appearance quality (Table 4). Shading reduced the BR, but it did not reach a significant level. In 2020, the CR was most significantly affected by the treatments, followed by CD, HR, and MR; in 2021, the performance was CR > HR > CD > MR. In 2020, only CR and CD had an interaction effect between varieties and treatments; in 2021, all indicators were affected by the interaction effects between varieties and treatments.

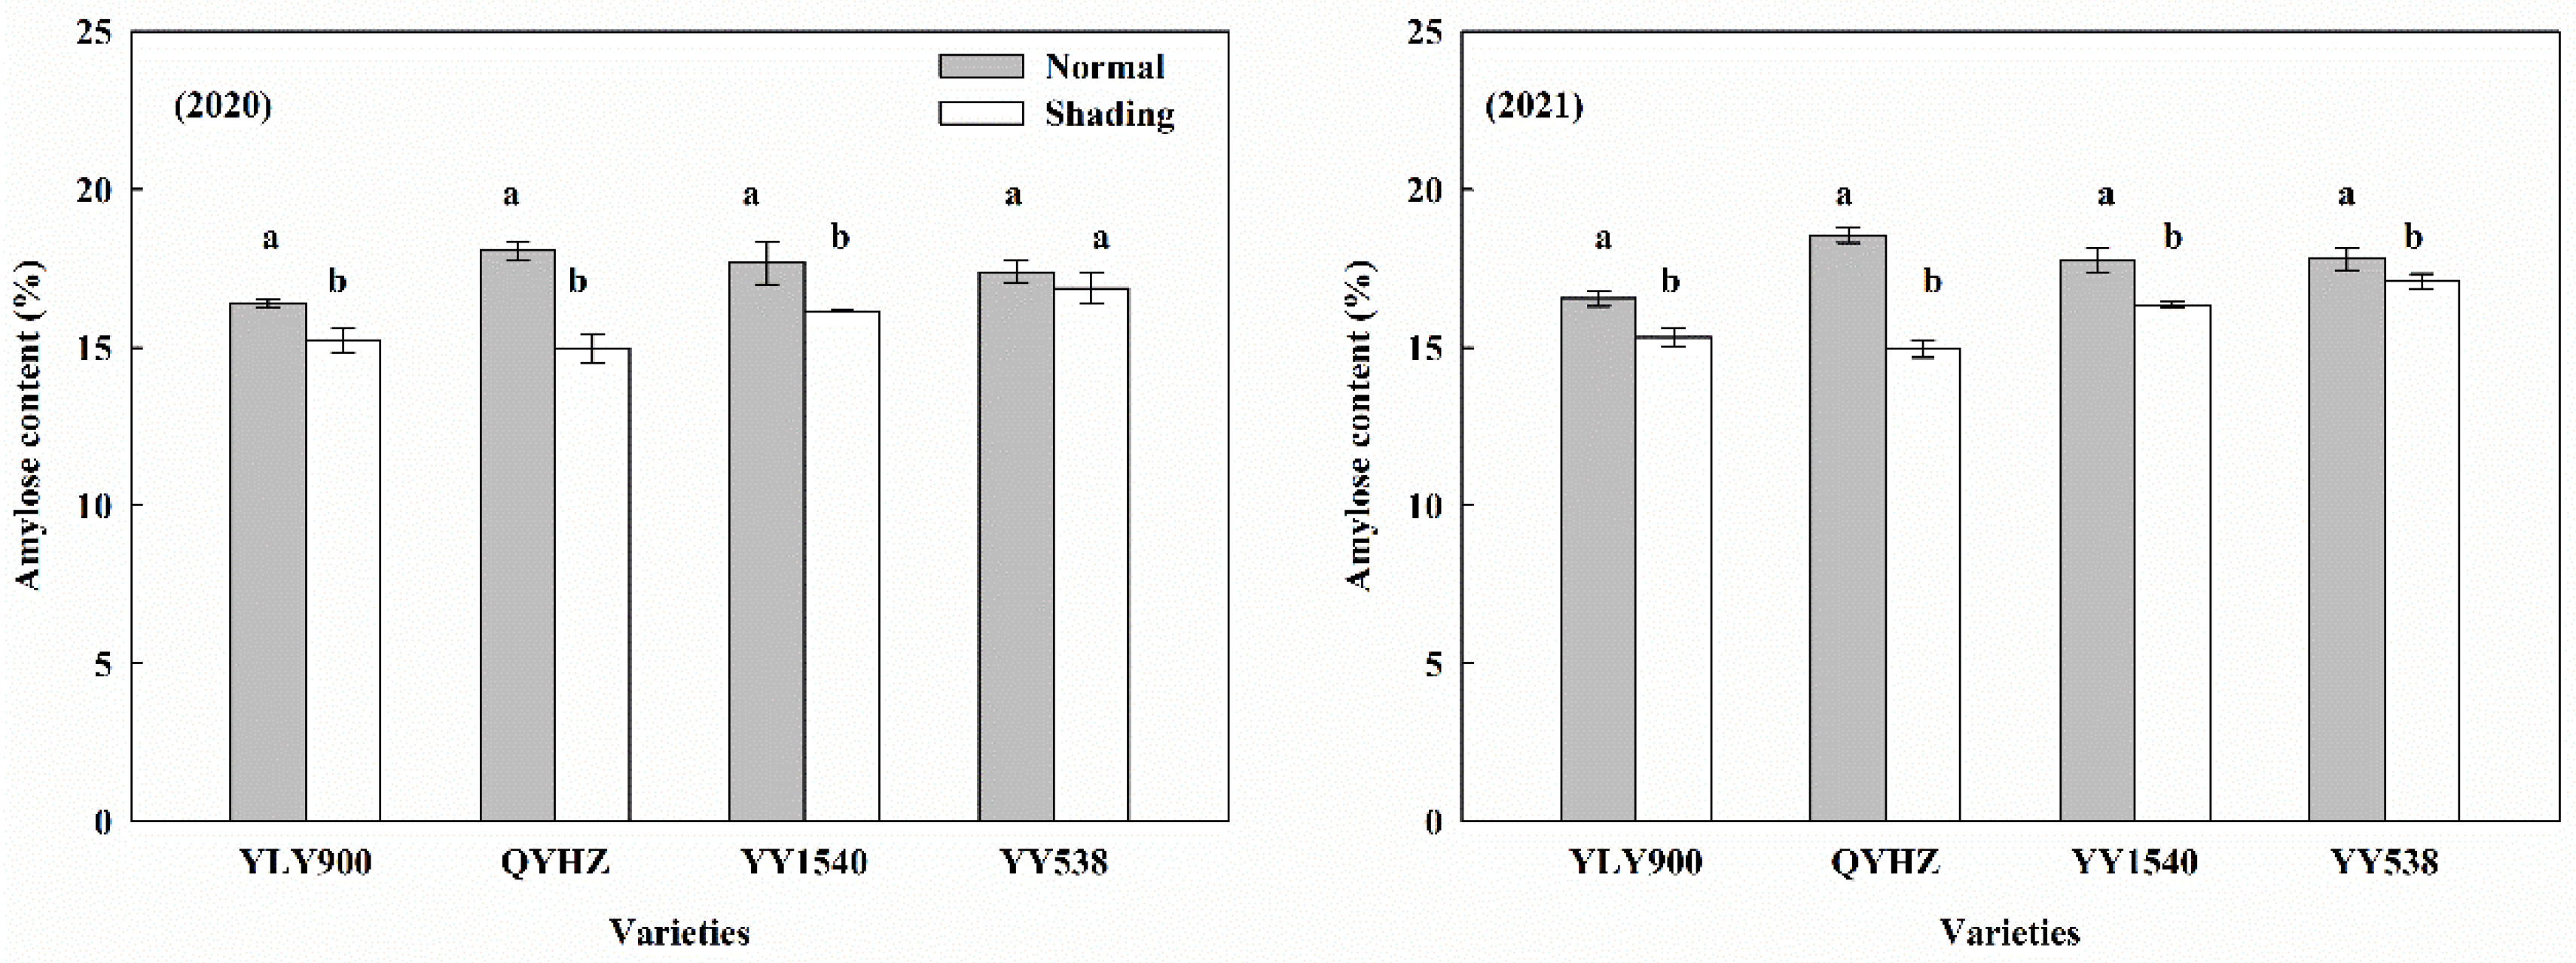
3.4. Amylose Content

The amylose content was positively correlated with light intensity, and there were significant differences among different types of varieties (Figure 3). In 2020, the amylose of IR decreased by 12.2% under shading, while I–JR only decreased by 5.8%; in 2021, the amylose of I–JR decreased by 6.0%, which was significantly lower than that of IR (13.4%). Obviously, the amylose content of I–JR was less affected by shading than IR was.

3.5. Protein Component Content

In normal conditions, there was more albumin and globulin in I–JR, while the opposite was true for gliadin and glutenin (Table 5). With the decline in light intensity, the protein content in the grains of all cultivars increased significantly, in which gliadin had the largest increase. In 2020 and 2021, the gliadin of IR increased by 162.9% and 166.0%, while I–JR increased by 115.1% and 111.3%, respectively. The protein component with the smallest increase was glutelin. In 2020, I–JR and IR increased by 13.4% and 24.0%, respectively. In 2021, I–JR and IR increased by 13.0% and 22.8% respectively. Overall, the effects of shading on grain protein components were significantly different among cultivars, and I–JR were less affected by shading.

3.6. RVA Profile Characteristics

In 2020, the RVA profile characteristics of different types of rice changed to varying degrees under shading (Table 6). Except for PVT, other RVA profile characteristics were significantly affected by shading. In normal conditions, the PV and BKV were significantly higher than those under shading. In normal conditions, the SB of I–JR was significantly lower than that of IR. Shading significantly increased the SB of all cultivars, and showed the IR was more affected by shading. In addition, the BKV and SB of I–JR were significantly less affected by shading than that of IR. PVT was not significantly affected by treatment, but was significantly affected by varieties. Compared with IR, I–JR had higher GT under all treatments. Overall, the I–JR had a more stable RVA profile characteristics than those of IR under shading.

3.7. Taste Value

In normal conditions, the taste value of I–JR was 74.9 across two years, which was slightly higher than that of IR (Figure 4). Shading significantly reduced the taste value of all cultivars. Under shading stress, I–JR had a better and more stable taste value than that of IR. In 2020, the taste value of I–JR decreased by 8.9%, which was lower than that of IR (15.8%); in 2021, the taste value of I–JR decreased by 7.2%, and the IR decreased by 14.5%.

3.8. Relationships among Taste Value and HR, CR, Protein Component Content, and Amylose Content

There were significant differences in the effects of shading on the correlation between rice taste value and rice quality of different types of rice varieties (Figure 5). For I–JR, there was a significant positive correlation between amylose content and taste value (R2 = 0.72), which was significantly higher than that of IR (R2 = 0.39). The correlation between protein components and taste value was the opposite, showing significant negative correlation. The correlation of I–JR was R2 = 0.74, and that of IR was R2 = 0.78. There was a positive correlation between the taste value and the HR of the two types of rice cultivars. For IR, there was a significant negative correlation between CR and taste value, but this relationship was not significant for I–JR.

4. Discussion

Grain production is one of the most important issues in agricultural production. There are many studies on the impact of shading stress on rice [32]. Shading stress at different growth stages could lead to stunted growth and development, reduce dry matter accumulation and the rate of assimilation of photosynthetic matter, and ultimately lead to a substantial reduction in rice yield [33,34]. For each growth stage, shading after flowering has the greatest impact on rice grain yield [35]. In this experiment, shading after flowering significantly reduced the grain yield of the two types of rice cultivars, and I–JR had better grain yield adaptability than that of IR under shading. In our previous study, we found that shading significantly reduced the grain filling percentage, which was the main reason for crop failure. Due to the inhibition of photosynthesis under shading stress, the “source” could not provide enough assimilates to meet grain growth, and the rice grain filling was insufficient, forming a large number of empty and half-filled grains, which greatly limited the grain yield potential [36,37]. In addition to the effect on the accumulation of photosynthetic substances, the shading stress after flowering also changed the transport and distribution ratio of photosynthetic substances. The decline in photosynthetic matter production capacity made grain filling rely on the output of assimilates accumulated in the stem and leaf before flowering, which significantly increased the dry matter output and output rate of stem and leaf. However, this increase in output could not completely offset the loss caused by the decrease in photosynthetic material accumulation, which led to a significant decrease in the amount of dry matter allocated to the rice panicles [38].
Crop quality and grain yield rely on the synthesis and distribution of assimilates during the growth stages of crops, which are regulated by genetic factors and the environment [39,40]. On the basis of the inhibitory effects of shading stress on rice material accumulation after full heading, the reduction in rice quality under shading became inevitable. In this experiment, the effect of shading stress on BR was not significant, but the MR and HR of all cultivars were significantly reduced under shading. With the decrease in accumulated substances in the grain, the number of empty grains increased, which made the MR and the HR decline. This study found that shading after flowering could lead to a significant increase in CR and CD, which is consistent with previous studies [41,42]. Compared with IR, the MR, HR, CD, and CR of I–JR were less affected by shading stress. Overall, the processing and appearance quality of I–JR were more stable than those of IR, which was mainly from I–JR having a higher grain filling percentage and grain weight under shading.
Rice cooking quality is a complex rice quality trait. Shading significantly reduced the amylose content, and the degree of amylose reduction was more significant as the light intensity decreased [43]. However, some studies found that shading caused an increase in rice amylose content, and this increase was different among different cultivars [44,45]. In this experiment, the amylose content of all tested cultivars under shading was lower than that under normal conditions. This was mainly caused by shading significantly reducing photosynthesis and the production of sugar sources, resulting in a significant decrease in amylose content. The decrease in amylose content in I–JR under shading was smaller than that in IR, which indicated that the Indica–japonica hybrid rice could greatly manufacture and transport sugar-derived substances even under shading stress.
In addition, shading stress increased the content of each protein component in this experiment. The reason for this phenomenon might be that shading led to an imbalance in the carbon and nitrogen ratio of rice plants [18]. Under shading, rice had a higher nitrogen assimilation capacity, and the metabolism of rice was shifted from carbon metabolism to nitrogen metabolism, which led to an increase in the nitrogen content rate of rice plant tissue. Moreover, shading after flowering reduced the relative distribution rate of carbon and nitrogen elements in rice organs [27]. Compared with normal conditions, the content of produced and transported nitrogenous compounds increased under shading, which reduced the production and transport capacity of the carbohydrates, and lastly led to a significant increase in protein content in grains. The increased rice grain protein content improved the nutritional quality of rice, but reduced the taste value [46]. This also verified our previous research that shading reduces the activities of sucrose synthase and sucrose phosphate synthase in rice leaves, and increases the activity of glutamate synthase. Due to the more stable carbon and nitrogen metabolism enzyme activity, I–JR could maintain a relatively stable level of carbon and nitrogen metabolism, even under shading [47]. Combining the relationship between the taste value and the rice quality, the amylose content and protein component significantly affected on the taste value of I–JR. So, maintaining the stability of carbon and nitrogen metabolism in I–JR under shading is the most critical factor to maintain the taste value.
As an important characteristic of rice quality, RVA profile characteristics were not only affected by genetic factors, but also restricted by environmental factors [48]. This study found that shading significantly reduced PV, HV, FV, BKV, and GT, and significantly increased SB, which is consistent with previous studies [49]. Lim found that PV, HV, FV, and BKV were positively correlated with rice taste, and FV and SB were negatively correlated with rice taste [50]. It is generally believed that rice with high PV and BKV, low FV and SB (absolute value) has better eating quality [51]. In this experiment, under normal conditions, I–JR had higher PV, and smaller FV and SB than those of IR. Under shading, I–JR also had higher PV, larger BKV, and smaller SB than those of IR.

5. Conclusions

Shading after anthesis has a great negative impact on grain yield and rice quality. Under shading stress, the production and accumulation of photosynthetic characters in all rice cultivars were significantly inhibited, which reduced grain yield. Shading stress caused a lot of empty grains, which decreased HR and MR, but increased the chalkiness rate and degree. Shading caused carbon and nitrogen metabolism disorders, decreased amylose content, and increased protein components, leading to a decline in rice taste quality and an increase in nutritional quality. Overall, shading after flowering reduced rice quality, and there were significant differences among cultivars, showing that I–JR had a more stable rice quality than that of IR. Combined with our previous experimental results, the better rice quality of I–JR was mainly from it having better photosynthetic production capacity, and a more stable carbon and nitrogen metabolism.

Author Contributions

Y.Z. designed the experiments and revised the paper; C.S., J.D. and J.Y. investigated the traits; C.S. analysed the data and wrote the manuscript; K.L., M.T.H., L.H. and X.T. aided in the conceptualization, scientific rigor, and manuscript editing; X.Z. and C.W. Writing—review & editing. All authors have read and agreed to the published version of the manuscript.

Funding

This study was funded by the National Key Research and Development Program of China (2022YFD2301004).

Data Availability Statement

The original contributions presented in the study are included in the article; further inquiries can be directed to the corresponding author.

Conflicts of Interest

The authors declare no conflict of interest. The author Cheng Shang is an employee of MDPI, however they do not work for the journal Agronomy at the time of submission and publication.

References

  1. Yin, M.; Liu, S.W.; Zheng, X.; Chu, G.; Xu, C.M.; Zhang, X.F.; Wang, D.Y.; Chen, S. Solar radiation-use characteristics of indica/japonica hybrid rice (Oryza sativa L.) in the late season in southeast China. Crop J. 2021, 9, 427–439. [Google Scholar] [CrossRef]
  2. Zhu, D.W.; Zhang, H.C.; Guo, B.W.; Xu, K.; Dai, Q.G.; Wei, C.X.; Zhou, G.S.; Huo, Z.Y. Physicochemical properties of Indica–japonica hybrid rice starch from Chinese varieties. Food Hydrocoll. 2017, 63, 356–363. [Google Scholar] [CrossRef]
  3. Zhou, Q.; Yuan, R.; Zhang, W.Y.; Gu, J.F.; Liu, L.J.; Zhang, H.; Wang, Z.Q.; Yang, J.C. Grain yield, nitrogen use efficiency and physiological performance of indica/japonica hybrid rice in response to various nitrogen rates. J. of Integr. Agric. 2023, 22, 63–79. [Google Scholar] [CrossRef]
  4. Ibrahim, A.; Harrison, M.T.; Meinke, H.; Zhou, M. Examining the yield potential of barley near-isogenic lines using a genotype by environment by management analysis. Eur. J. Agron. 2019, 105, 41–51. [Google Scholar] [CrossRef]
  5. Janardhan, K.V.; Murty, K.S.; Dash, N.B. Effect of low light during ripening period on grain yield and translocation of assimilates in rice varieties. Indian J. Plant Physiol. 1980, 23, 163–168. Available online: https://ispponline.org/storage/ijpp-23o-2-009.pdf (accessed on 20 December 2022).
  6. Schmierer, M.; Knopf, O.; Asch, F. Growth and Photosynthesis Responses of a Super Dwarf Rice Genotype to Shade and Nitrogen Supply. Rice Sci. 2021, 28, 178–190. [Google Scholar] [CrossRef]
  7. Liu, K.; Harrison, M.T.; Shabala, S.N.; Meinke, H.B.; Ahmed, I.; Zhang, Y.B.; Tian, X.H.; Zhou, M. The state of the art in modeling waterlogging impacts on plants: What do we know and what do we need to know. Earth’s Future 2020, 8, e2020EF001801. [Google Scholar] [CrossRef]
  8. Harrison, M.T.; Roggero, P.P.; Zavattaro, L. Simple, efficient and robust techniques for automatic mul-ti-objective function parameterisation: Case studies of local and global optimisation using APSIM. Environ. Model. Softw. 2019, 117, 109–133. [Google Scholar] [CrossRef]
  9. Snow, V.; Rodriguez, D.; Dynes, R.; Kaye-Blake, W.; Mallawaarachchi, T.; Zydenbos, S.; Cong, L.; Obadovic, I.; Agnew, R.; Amery, N.; et al. Resilience achieved via multiple compensating subsystems: The im-mediate impacts of COVID-19 control measures on the agri-food systems of Australia and New Zealand. Agricult. Syst. 2021, 187, 103025. [Google Scholar] [CrossRef]
  10. Zahra, N.; Hafeez, M.B.; Nawaz, A.; Farooq, M. Rice production systems and grain quality. J. Cereal Sci. 2022, 105, 103463. [Google Scholar] [CrossRef]
  11. Harrison, M.; Cullen, B.; Armstrong, D. Management options for dairy farms under climate change: Effects of intensification, adaptation and simplification on pastures, milk production and profitability. Agric. Syst. 2017, 155, 19–32. [Google Scholar] [CrossRef]
  12. Liu, K.; Harrison, M.; Yan, H.L.; Liu, D.L.; Meinke, H.; Hoogenboom, G.; Wang, B.; Peng, B.; Guan, K.Y.; Jaegermeyr, J.; et al. Silver lining to a climate crisis in multiple prospects for alleviating crop waterlogging under future climates. Nat. Commun. 2023, 14, 765. [Google Scholar] [CrossRef] [PubMed]
  13. Wu, F.F.; Chen, H.Y.; Yang, N.; Wang, J.P.; Duan, X.; Jin, Z.Y.; Xu, X.M. Effect of germination time on physicochemical properties of brown rice flour and starch from different rice cultivars. J. Cereal Sci. 2013, 58, 263–271. [Google Scholar] [CrossRef]
  14. Falade, K.O.; Semon, M.; Fadairo, O.S.; Oladunjoye, A.O.; Orou, K.K. Functional and physico-chemical properties of flours and starches of African rice cultivars. Food Hydrocoll. 2014, 39, 41–50. [Google Scholar] [CrossRef]
  15. Liu, K.; Deng, J.; Lu, J.; Wang, X.Y.; Lu, B.L.; Tian, X.H.; Zhang, Y.B. High nitrogen levels alleviate yield loss of super hybrid rice caused by high temperatures during the flowering stage. Front. Plant Sci. 2019, 10, 357. [Google Scholar] [CrossRef] [PubMed]
  16. Liu, K.; Harrison, M.T.; Wang, B.; Yang, R.; Yan, H.L.; Zou, J.; Liu, D.L.; Meinke, H.; Tian, X.H.; Ma, S.Y.; et al. Designing high-yielding wheat crops under late sowing: A case study in southern China. Agron. Sustain. Dev. 2022, 42, 29. [Google Scholar] [CrossRef]
  17. Liu, Q.H.; Li, T.; Zhang, J.J. Effects of early stage shading on function leaf growth at grain-filling stage and on grain quality of rice. Chin. J. Ecol. 2006, 25, 1167–1172. Available online: http://www.cje.net.cn/CN/abstract/abstract16199.shtml (accessed on 20 December 2022).
  18. Chen, H.; Li, Q.P.; Zeng, Y.L.; Deng, F.; Ren, W.J. Effect of different shading materials on grain yield and quality of rice. Sci. Rep. 2019, 9, 9992. [Google Scholar] [CrossRef]
  19. Wei, H.Y.; Zhu, Y.; Qiu, S.; Han, C.; Hu, L.; Xu, D.; Zhou, N.B.; Xing, Z.P.; Hu, Y.J.; Cui, P.Y.; et al. Combined effect of shading time and nitrogen level on grain filling and grain quality in japonica super rice. J. Integr. Agric. 2018, 17, 2405–2417. [Google Scholar] [CrossRef]
  20. Kato, T. Effects of the shading and rachis-branch clipping on the grain-filling process of rice cultivars differing in the grain size. Jpn. J. Crop Sci. 1986, 55, 252–260. [Google Scholar] [CrossRef]
  21. Liang, C.G.; Liu, J.; Wang, Y.; Xiong, D.; Ding, C.B.; Li, T. Low light during grain filling stage deteriorates rice cooking quality, but not nutritional value. Rice Sci. 2015, 22, 197–206. [Google Scholar] [CrossRef]
  22. Zhang, J.Y.; Kong, H.C.; Ban, X.F.; Li, C.M.; Gu, Z.B.; Li, Z.F. Rice noodle quality is structurally driven by the synergistic effect between amylose chain length and amylopectin unit-chain ratio. Carbohydr. Polym. 2022, 295, 119834. [Google Scholar] [CrossRef] [PubMed]
  23. Liu, Q.H.; Wu, X.; Chen, B.C.; Ma, J.Q.; Gao, J. Effects of Low Light on Agronomic and Physiological Characteristics of Rice Including Grain Yield and Quality. Rice Sci. 2014, 21, 243–251. [Google Scholar] [CrossRef]
  24. Wakamatsu, K.; Sasaki, O.; Uezono, I. Effect of the amount of nitrogen application on occurrence of white-back kernels during ripening of rice under high-temperature conditions. Jpn. J. Crop Sci. 2008, 77, 424–443. Available online: https://www.jstage.jst.go.jp/article/jcs/77/4/77_4_424/_article/-char/en (accessed on 20 December 2022). [CrossRef]
  25. Wang, X.Q.; Yin, L.Q.; Shen, G.Z.; Xu, L.; Liu, Q.Q. Determination of amylose content and its relationship with RVA profile within genetically similar cultviars of rice (Oryza sativa L. ssp. Japonica). Agric. Sci. China 2010, 9, 1101–1107. [Google Scholar] [CrossRef]
  26. Shang, C.; Chong, H.T.; Xiong, X.; Huang, L.Y.; Tian, X.H.; Zhang, Y.B. Effects of Shading After Full Heading on Dry Matter Production and Carbon and Nitrogen Metabolism of Indica-japonica. Hybrid Rice 2022, 37, 100–107. [Google Scholar] [CrossRef]
  27. Phelan, D.C.; Harrison, M.T.; McLean, G.; Cox, H.; Pembleton, K.G.; Dean, G.J.; Parsons, D.; do Amaral Richter, M.E.; Pengilley, G.; Hinton, S.J.; et al. Advancing a farmer decision support tool for agronomic decisions on rainfed and irrigated wheat cropping in Tasmania. Agric. Syst. 2018, 167, 113–124. [Google Scholar] [CrossRef]
  28. Shang, C.; Guo, Z.; Chong, H.T.; Tian, X.H.; Zhang, Y.B. Higher Radiation Use Efficiency and Photosynthetic Characteristics After Flowering Could Alleviate the Yield Loss of Indica-Japonica Hybrid Rice Under Shading Stress. Int. J. Plant Prod. 2022, 16, 105–117. [Google Scholar] [CrossRef]
  29. Xu, D.; Zhu, Y.; Zhou, L.; Han, C.; Zheng, L.M.; Zhang, H.C.; Wei, H.Y.; Wang, J.; Liao, A.H.; Cai, S.B. Differences in yield and grain quality among various types of indica/japonica hybrid rice and correlation between quality and climatic factors during grain filling period. Acta Agron. Sin. 2018, 44, 1548–1559. Available online: https://www.cabdirect.org/cabdirect/abstract/20183361662 (accessed on 20 December 2022). [CrossRef]
  30. Feng, Z.M.; Shen, J.; Tan, S.Q. Determination of protein in rice by BCA method. Neijiang Technol. 2017, 6, 87. [Google Scholar]
  31. Zhu, D.W.; Zhang, H.C.; Guo, B.W.; Ke, X.U.; Dai, Q.G.; Wei, H.Y.; Gao, H.; Ya-Jie, H.U.; Cui, P.Y.; Huo, Z.Y. Effects of nitrogen level on yield and quality of japonica soft super rice. J. Integr. Agric. 2017, 16, 1018–1027. [Google Scholar] [CrossRef]
  32. Chaturvedi, G.S.; Ingram, K.T. Growth and yield of lowland rice in response to share and drainage. Philipp. J. Crop Sci. 1989, 14, 61–67. Available online: https://www.cabi.org/GARA/FullTextPDF/Pre2000/19920758132.pdf (accessed on 20 December 2022).
  33. Kobata, T.; Sugawara, M.; Takatu, S. Shading during the early grain filling period does not affect potential grain dry matter increase in rice. Agron. J. 2000, 92, 411–417. [Google Scholar] [CrossRef]
  34. Song, S.L.; He, A.B.; Zhao, T.C.; Yin, Q.; Mu, Y.X.; Wang, Y.D.; Liu, H.Y.; Nie, L.X.; Peng, S.B. Effects of shading at different growth stages with various shading intensities on the grain yield and anthocyanin content of colored rice (Oryza sativa L.). Field Crops Res. 2022, 283, 108555. [Google Scholar] [CrossRef]
  35. Cai, Z.K.; Luo, S.M. Effect of shading on growth, development and yield formation of rice. Chin. J. Appl. Ecol. 1999, 10, 193–196. Available online: http://www.cjae.net/CN/Y1999/V10/I2/193 (accessed on 20 December 2022).
  36. Liu, K.; Yang, R.; Lu, J.; Wang, X.Y.; Lu, B.L.; Tian, X.H.; Zhang, Y.B. Radiation use efficiency and source-sink changes of supper hybrid rice under shade stress during grain filling stage. Agron. J. 2019, 111, 1788–1798. [Google Scholar] [CrossRef]
  37. Wang, Y.B.; Huang, R.D.; Zhou, Y.F. Effects of shading stress during the reproductive stages on photosynthetic physiology and yield characteristics of peanut (Arachis hypogaea Linn.). J. Integr. Agric. 2021, 20, 1250–1265. [Google Scholar] [CrossRef]
  38. Harrison, M.; Kelman, W.; Moore, A.; Evans, J. Grazing winter wheat relieves plant water stress and transiently enhances photosynthesis. Funct. Plant Biol. 2010, 37, 726–736. [Google Scholar] [CrossRef]
  39. Ren, W.J.; Yang, W.Y.; Xu, J.W.; Fan, G.Q.; Ma, Z.H. Effect of Low Light on Grains Growth and Quality in Rice. Acta Agron. Sin. 2003, 5, 785–790. Available online: http://en.cnki.com.cn/Article_en/CJFDTOTAL-XBZW200305026.htm (accessed on 20 December 2022).
  40. Huang, L.Y.; Wang, F.; Liu, Y.; Zhang, Y.B. Night temperature determines the interannual yield variation in hybrid and inbred rice widely used in central China through different effects on reproductive growth. Front. Plant Sci. 2021, 12, 646168. [Google Scholar] [CrossRef]
  41. Thuy, T.L.; Saitoh, K. Effect of shading on dry-matter production, yield and grain appearance quality of Vietnamese rice cultivar (Oryza sativa L.) in the paddy field. Sci. Rep. Fac. Agric. Okayama Univ. 2017, 106, 13–19. Available online: https://ousar.lib.okayama-u.ac.jp/en/search/p/5/item/54773?all=%E6%AF%94%E8%BC%83&sort=id%3Ar (accessed on 20 December 2022).
  42. Tsutomu, I.; Yukinori, N.; Noriaki, A.; Akihiro, O.; Keitaro, S.; Takayuki, U.; Satoshi, Y.; Motohiko, K. High temperature and low solar radiation during ripening differentially affect the composition of milky-white grains in rice (Oryza sativa L.). Plant Prod. Sci. 2018, 21, 370–379. [Google Scholar] [CrossRef]
  43. Deng, F.; Li, Q.P.; Chen, H.; Zeng, Y.L.; Li, B.; Zhong, X.Y.; Wang, L.; Ren, W.J. Relationship between chalkiness and the structural and thermal properties of rice starch after shading during grain-filling stage. Carbohydr. Polym. 2021, 252, 117212. [Google Scholar] [CrossRef] [PubMed]
  44. Ren, J.J. The effects of climatic fluctuation on rice yield. J. Southwest Agric. Univ. 1991, 13, 276–279. Available online: https://www.cnki.com.cn/Article/CJFDTOTAL-XNND199103008.htm (accessed on 20 December 2022).
  45. Bian, J.; Ren, G.L.; Xu, F.F.; Zhang, H.C.; Wei, H.Y. Comparison of grain yield and quality of different types of japonica rice cultivars in the northern Jiangsu plain, China. J. Integr. Agric. 2021, 20, 2065–2076. [Google Scholar] [CrossRef]
  46. Mo, Z.W.; Wu, L.; Pan, S.G.; Fitzgerald, T.L.; Xiao, F.; Tang, Y.J.; Wang, Y.L.; Duan, M.Y.; Tian, H.; Tang, X.R. Shading during the grain filling period increases 2-acetyl-1-pyrroline content in fragrant rice. Rice 2015, 8, 9. [Google Scholar] [CrossRef]
  47. Liu, L.; Chen, T.; Wang, Z.; Zhang, H.; Yang, J.; Zhang, J. Combination of site-specific nitrogen management and alternate wetting and drying irrigation increases grain yield and nitrogen and water use efficiency in super rice. Field Crops Res. 2013, 154, 226–235. [Google Scholar] [CrossRef]
  48. Singh, N.; Kaur, L.; Sandhu, K.S.; Kaur, J.; Nishinari, K. Relationships between physicochemical, morphological, thermal, rheological properties of rice starches. Food Hydrocoll. 2006, 20, 532–542. [Google Scholar] [CrossRef]
  49. Wang, L.; Deng, F.; Ren, W.J.; Yang, W.Y. Effects of Shading on Starch Pasting Characteristics of Indica Hybrid Rice (Oryza sativa L.). PLoS ONE 2013, 8, e68220. [Google Scholar] [CrossRef]
  50. Lim, S.J.; Kim, D.U. Varietal variation of amylogram properties and its relationship with other eating quality characteristics in rice. Korean J. Breed. 1995, 27, 268–275. [Google Scholar]
  51. Chen, H.; Chen, D.; He, L.H.; Wang, T.; Lu, H.; Yang, F.; Deng, F.; Chen, Y.; Tao, Y.F.; Li, M.; et al. Correlation of taste values with chemical compositions and Rapid Visco Analyser profiles of 36 indica rice (Oryza sativa L.) varieties. Food Chem. 2021, 349, 129176. [Google Scholar] [CrossRef] [PubMed]
Figure 1. Daily maximal and minimal temperatures, and solar radiation during rice-growing season in Jingzhou in (a) 2020 and (b) 2021.
Agronomy 13 00535 g001aAgronomy 13 00535 g001b
Figure 2. Grain yield of different rice varieties under shading after flowering in 2020–2021. YLY900 (Y-liangyou 900); QYHZ (Quanyouhuazhan); YY1540 (Yongyou 1540); YY538 (Yongyou 538). Different lowercase letters indicate significant differences at p < 0.05 between Normal and shading according to LSD at 0.05 level.
Agronomy 13 00535 g002
Figure 3. Amylose content of different rice varieties under shading after flowering in 2020–2021. YLY900 (Y-liangyou 900); QYHZ (Quanyouhuazhan); YY1540 (Yongyou 1540); YY538 (Yongyou 538). Different lowercase letters indicate significant differences at p < 0.05 between normal and shading according to LSD at 0.05 level.
Agronomy 13 00535 g003
Figure 4. Taste values of different rice varieties under shading after flowering in 2020–2021. YLY900 (Y-liangyou 900); QYHZ (Quanyouhuazhan); YY1540 (Yongyou 1540); YY538 (Yongyou 538). Different lowercase letters indicate significant differences at p < 0.05 between normal and shading according to LSD at 0.05 level.
Agronomy 13 00535 g004
Figure 5. Correlation analysis of taste value and head rice rate (a), chalkiness rate (b), protein component content (c) and amylose content (d) of different rice varieties under shading after flowering in 2020–2021. YLY900 (Y-liangyou 900); QYHZ (Quanyouhuazhan); YY1540 (Yongyou 1540); YY538 (Yongyou 538).
Agronomy 13 00535 g005
Table 1. Pedigrees and year of release of genotypes used in these experiments.
VarietyTypeYear of ReleaseFemale ParentMale Parent
Y-liangyou 900Indica2015Y 58SR 900
QuanyouhuazhanIndica2017Quan 9311AHuazhan
Yongyou 1540Indica–japonica2017Yongjing 15AF 7540
Yongyou 538Indica–japonica2013Yongjing 3AF 7538
Table 2. Typical crop husbandry associated with the genotypes used here.
VarietySeeding DateTransplanting DateFull heading DateMature Date
2020
Y-liangyou 90012 May12 June21 August1 October
Quanyouhuazhan12 May12 June14 August23 September
Yongyou 154012 May12 June23 August13 October
Yongyou 53812 May12 June25 August20 October
2021
Y-liangyou 9009 May4 June15 August20 September
Quanyouhuazhan9 May4 June13 August21 September
Yongyou 15409 May4 June20 August12 October
Yongyou 5389 May4 June24 August14 October
Table 3. Processing and appearance quality of different rice varieties under shading after flowering in 2020–2021.
VarietyTreatmentBrown Rice RateMilled Rice RateHead Rice RateChalkiness Rate Chalkiness Degree
%
2020
Y-liangyou 900Normal80.1 a72.6 a64.5 a13.7 b5.3 b
Shading79.4 a66.4 a56.4 a23.4 a13.0 a
QuanyouhuazhanNormal80.1 a70.2 a63.2 a14.1 b5.7 b
Shading78.3 b64.9 b52.9 b26.4 a15.6 a
Yongyou 1540Normal80.1 a73.2 a67.3 a10.4 b4.5 b
Shading79.9 a69.2 b60.4 b18.8 a10.5 a
Yongyou 538Normal80.4 a75.0 a69.3 a13.1 b5.6 b
Shading79.9 a72.2 a63.0 b19.4 a12.5 a
2021
Y-liangyou 900Normal80.4 a70.5 a65.5 a13.8 b5.1 b
Shading79.6 a69.0 b58.9 b23.5 a12.7 a
QuanyouhuazhanNormal80.2 a70.7 a64.4 a14.1 b5.7 b
Shading78.4 b65.8 b52.7 b26.1 a16.0 a
Yongyou 1540Normal80.7 a74.3 a68.6 a10.2 b4.8 b
Shading80.2 a71.1 b62.8 b18.5 a10.5 a
Yongyou 538Normal80.4 a75.1 a69.5 a12.8 b5.6 b
Shading80.0 a71.8 b62.7 b19.1 a12.3 a
Different lowercase letters indicate significant differences at p < 0.05 between normal and shading according to LSD at 0.05 level.
Table 4. Variance analysis of processing and appearance quality of different rice varieties under shading after flowering in 2020–2021.
Source of VariationF Value
Brown Rice RateMilled Rice RateHead Rice RateChalkiness Rate Chalkiness Degree
2020
Variety (V)1.7 ns9.3 **12.6 **39.1 **9.8 **
Treatment (T)4.6 ns14.6 **60.7 **527.2 **342.9 **
V × T1.0 ns1.1 ns0.7 ns9.8 **3.9 *
2021
Variety (V)2.0 ns68.7 **74.6 **36.2 **8.1 **
Treatment (T)6.5 *117.0 **355.6 **442.4 **270.5 **
V × T0.9 ns5.5 *10.7 *7.6 **4.6 *
* p < 0.05. ** p < 0.01. ns, not significant.
Table 5. Protein components of different rice varieties under shading after flowering in 2020–2021.
VarietyTreatmentAlbumin
mg g−1
Globulin
mg g−1
Gliadin
mg g−1
Gluten
mg g−1
2020
Y-liangyou 900Normal3.5 b2.7 b1.3 b35.2 b
Shading4.3 a5.5 a2.9 a41.6 a
QuanyouhuazhanNormal2.5 b2.9 b1.3 b37.9 b
Shading4.3 a5.1 a4.0 a49.2 a
Yongyou 1540Normal3.3 b4.7 b0.6 b35.9 b
Shading4.2 a5.2 a1.6 a39.6 a
Yongyou 538Normal4.7 b3.9 b0.9 b32.3 b
Shading5.4 a4.9 a1.2 a37.6 a
Mean 4.0 A4.4 A1.7 A38.7 A
2021
Y-liangyou 900Normal3.4 b2.5 b1.2 b36.8 b
Shading4.4 a5.4 a2.8 a41.2 a
QuanyouhuazhanNormal2.3 b2.9 b1.4 b37.3 b
Shading4.3a5.0 a4.1 a48.8 a
Yongyou 1540Normal3.5 b4.8 b0.6 b35.7b
Shading3.9 a5.2 a1.5 a39.2 a
Yongyou 538Normal4.6 b3.8 b0.7 b32.1 b
Shading5.4 a4.8 a1.2 a37.3 a
Mean 4.0 A4.3 A1.7 A38.6 A
Analysis of varianceVariety (V)********
Treatment (T)********
V × T*******
Different lowercase letters indicate significant differences at p <0.05 between Normal and shading according to LSD at 0.05 level. * p < 0.05. ** p < 0.01.
Table 6. RVA profile characteristics of different rice varieties under shading after flowering in 2020.
VarietyTreatmentPVHVFVBKVSBGTPVT
cPcPcPcPcPs°C
Y-liangyou 900Normal2728.3 a1495.0 a2801.3 a1233.3 a73.0 b84.0 a5.9 a
Shading2402.3 b1408.7 b2552.0 b993.7 b149.7 a82.8 b5.9 a
QuanyouhuazhanNormal2634.0 a1389.0 a2722.7 a1245.0 a88.7 b85.1 a5.7 a
Shading2080.7 b1264.7 b2361.3 b816.0 b280.7 a84.2 a5.8 a
Yongyou 1540Normal2833.3 a1588.0 a3109.3 a1245.3 a−24.0 a88.0 a6.1 a
Shading2467.7 b1446.3 b2723.3 b1021.3 b−44.3 a86.4 b5.9 b
Yongyou 538Normal2743.3 a1521.0 a3049.0 a1222.3 a5.7 a87.1 a6.0 a
Shading2612.3 b1460.3 a2916.7 b1152.0 a4.3 a85.8 b6.0 a
Analysis of varianceVariety (V)*************
Treatment (T)************ns
V × T**ns*****ns**
Different lowercase letters indicate significant differences at p < 0.05 between Normal and shading according to LSD at 0.05 level. * p < 0.05. ** p < 0.01. ns, not significant. Peak viscosity (PV), hot viscosity (HV), final viscosity (FV), breakdown value (BKV), setback (SB), peak viscosity time (PVT), and gelatinization temperature (GT).
Disclaimer/Publisher’s Note: The statements, opinions and data contained in all publications are solely those of the individual author(s) and contributor(s) and not of MDPI and/or the editor(s). MDPI and/or the editor(s) disclaim responsibility for any injury to people or property resulting from any ideas, methods, instructions or products referred to in the content.

