Article

Methane Uptake and Nitrous Oxide Emission in Saline Soil Showed High Sensitivity to Nitrogen Fertilization Addition

1
Inner Mongolia Key Laboratory of Environmental Chemistry, Inner Mongolia Normal University, Hohhot 010022, China
2
College of Chemistry and Environmental Sciences, Inner Mongolia Normal University, Hohhot 010022, China
3
Agriculture and Animal Husbandry Technology Promotion Center of Inner Mongolia, Hohhot 010018, China
*
Author to whom correspondence should be addressed.
Agronomy 2023, 13(2), 473; https://doi.org/10.3390/agronomy13020473
Submission received: 6 January 2023 / Revised: 1 February 2023 / Accepted: 2 February 2023 / Published: 5 February 2023

Abstract

:
Saline soils can significantly affect methane (CH4) and nitrous oxide (N2O) in atmospheric greenhouse gases (GHGs). However, the coupling effect of nitrogen fertilization addition and saline soils on CH4 uptake and N2O emissions has rarely been examined under various salinity conditions of soil. In this study, the effects of nitrogen fertilization addition on CH4 and N2O fluxes under different salinity conditions of soil in Hetao Irrigation District, Inner Mongolia, were investigated by on-site static chamber gas chromatography. A slightly saline soil (S1) (Electrical Conductivity: 0.74 dS m−1) and a strongly saline soil (S2) (EC: 2.60 dS m−1) were treated at three levels of nitrogen fertilization: a high fertilization rate of 350 kg N ha−1 (H), a low fertilization rate of 175 kg N ha−1 (L), and no fertilizer (control treatment, referred to as CK). Nitrogen application was the important factor affecting N2O emissions and CH4 uptake in saline soil. The CK, L, and H treatments exhibited a cumulative CH4 uptake of 156.8–171.9, 119.7–142.0, and 86.7–104.8 mg m−2 in S1, 139.3–176.0, 109.6–110.6, and 68.5–75.4 mg m−2 in S2, respectively. The cumulative N2O emissions under the L and H treatments in S2 were 44.1–44.7%, and 74.1–91.1% higher than those in S1. Nitrogen fertilizer application to saline soils reduced CH4 uptake and promoted N2O emission in the Hetao Plain, Inner Mongolia. Our results indicate that mitigating soil salinity and adopting appropriated fertilizer amounts may help to cope with global climate change.

1. Introduction

Global warming caused by greenhouse gases (GHGs) from carbon dioxide (CO2), methane (CH4), and nitrous oxide (N2O) has become a major environmental problem facing the world. The radiative forcing of nitrous oxide (N2O) and methane (CH4) is of greater concern because of their 265 and 34 times higher global warming potential, respectively, compared to carbon dioxide (CO2), on a 100-year time scale [1]. From 1990 to 2005, global CH4 and N2O fluxes from agricultural activities increased by 17% [2], with agricultural activities accounting for 47% and 58% of anthropogenic emissions of atmospheric CH4 and N2O, respectively, in 2005 [3]. The increase in the GHGs (CH4 and N2O) emitted by agricultural production is closely relevant to changes of soil salinity and nitrogen fertilizer in land use.
Previous studies primarily focused on the effects of fertilization on CH4 and N2O fluxes in non-saline and non-alkaline soils in agricultural ecosystems [4,5,6]. However, the high salt content in soil causes microbial osmotic stress and specific ion toxicity in soil [7], which affects soil physicochemical properties and microbial activities related to soil carbon and nitrogen cycles, thereby affecting CH4 and N2O fluxes in saline soils. The CH4 uptake and N2O emissions depend on the amount of salt content and are produced via multiple soil-nitrogen transformation pathways, such as nitrification and denitrification processes being affected by salt content in the soil [8]. Limited consideration has been given to the effects of nitrogen fertilizer on CH4 uptake and N2O emission in saline soil [9].
Saline soils are widespread and rapidly increasing in more than 120 countries, owing to climate change, seawater intrusion, and inappropriate irrigation and drainage management [10]. Saline soils currently account for approximately 20% of the world’s arable land [11]. China has 99 million hectares of saline soils and ranks third globally in terms of saline soil area. The area of high saline soil in the Hetao Irrigation District in Inner Mongolia reaches approximately 797,300 ha because of excessive use of chemical fertilizer and flood irrigation to wash and drain the salts [12]. It is essential to determine the effect of salinity on soil carbon and nitrogen cycling, improve nitrogen utilization in saline soils, reduce the environmental impact of nitrogen losses, ensure rational use of saline soils, and reveal the interactive effects of fertilization and soil salinity on soil carbon and nitrogen cycling [13,14]. The observations of the CH4 and N2O fluxes in nitrogen-fertilized saline soils are few in in situ studies. This limits the scientific estimation of total CH4 and N2O fluxes in arable saline soils, hindering the establishment of technical approaches for reducing GHGs emissions in saline soils.
The main objectives of this study are to (i) evaluate how fertilization and soil salinity is already affecting CH4 uptake and N2O emission from saline soil, (ii) assess the relationship between physico-chemical properties of soil and CH4 uptake or N2O emission to clarify the potential regulatory mechanisms in fertilized saline soil, and (iii) identify uncertainties and knowledge gaps and suggest future directions in the cumulative estimation of CH4 and N2O in nitrogen-fertilized arable saline soils for improving the research of soil salinity and nitrogen fertilization.

2. Materials and Methods

2.1. Study Area

The study area is located at Urat Front Banner, the most representative agricultural planting area of saline soils in China (40°28′ N, 108°11′ E). Urat Front Banner is in an arid region of northwest China, with a historical mean annual temperature of 3.6–7.3 °C variation, precipitation of 200–260 mm, an annual mean sunshine duration of 3202 h, a frost-free period of approximately 120 days per year, and an annual mean evaporation of 1900–2300 mm [15].
The monthly mean atmospheric temperature in April–November was consistent in 2015 and 2016, exhibiting a gradual increase from April to July–August, followed by a slow decrease from September to November. There was an inter-annual difference in atmospheric precipitation, with a lower intensity and frequency of atmospheric precipitation in 2016 (Figure 1). These data were obtained from a meteorological station. The station is 30 m away from the research field.
Two types of arable saline soils with different salinity conditions were selected as the test soils; S1 is a slightly saline soil with an EC of 0.74 dS m−1 and S2 is a strongly saline soil with an EC of 2.60 dS m−1. The soil salt content in the treatments is presented in Table 1, the criteria for the classification of the saline soils are listed in Table 2, and the physicochemical properties for S1 and S2 soils in addition to the soil salt content are listed in Table 3. The distance is 100 m between plots S1 and S2. The two plots have the same soil type, slope, and area (~5 ha). The type of nitrogen fertilizer used was diammonium phosphate and urea in each plot, including three treatment s: (1) no fertilization (S1CK and S2CK), (2) low-rate fertilization (175 kg N ha−1) (S1L and S2L), and (3) high-rate fertilization (350 kg N ha−1) (S1H and S2H). Each treatment in plots S1 and S2 was conducted in 100 m2 and placed randomly by triplicate subplots.
Each plot was planted with sunflower (Helianthus annuus) in May every year. The land was plowed with a deep tiller before planting. The sunflower field was irrigated by the Yellow River in China. The irrigation type used was flood irrigation. The salts leach into the soil at an intensity of 400 mm during the first irrigation and are transported into the ground for plant growth. When there is no water ponding, the farmers can enter the farmland to cultivate and the sunflowers are planted. Diammonium phosphate was applied as the base fertilizer. The amount applied as base fertilization in each treatment accounts for 45% of the total nitrogen fertilizer in the whole growth period. Urea was applied as top-dressing fertilizer. The 55% of the total nitrogen fertilizer in the whole growth period is applied at the top-dressing stage. The fertilizers were applied to the soil by broadcasting. In addition to N, P, and K, no soil correction was applied. Except for the irrigation before planting, no irrigation is carried out at other times during the growing season of crops. The sunflowers were harvested in September every year.

2.2. Gas Sample Collection and Determination

Three fixed sampling points were set within each replicate sub-plot of each study plot. Atmospheric air samples were collected using the static chamber. The chamber size was 0.5 m (length) × 0.5 m (width) × 0.5 m (height). These static chambers were placed over the sunflower row covering the part between two rows. This base of the chamber was placed at a depth of 25 cm into the soil. The gas samples were collected between 07:00 and 10:00 following N fertilization events. The frequency of gas sampling was determined according to the fertilization time, and was once every 10 days in July, and once every 15 days in June, August, and September, and once per month in April, May, and October. The sample was not collected in May 2016. The irrigation water used for salt washing before planting needs to infiltrate for about one month in May 2016. In this period, we could not enter the field to collect gas. About 100 mL of gas was drawn through a 100-mL injector connected to three sampling ports that passed through the chamber. The sampling time was 20 min per chamber. Samples were taken over 0, 5, 10, 15, and 20 min, with five samples per chamber and three replicate sets of samples per sampling. The collected gas samples, in cap-lock syringes, were quickly taken back to the laboratory, where they were analyzed using an Agilent 6820 gas chromatograph (Agilent 6820D, Agilent Technologies, Santa Clara, CA, USA) with a flame ionization detector. The flame ionization detector is used for the determination of N2O and CH4. The emission was determined from the slope of the mixing ratio change in the five samples taken over a 20 min sampling period. The soil CH4 uptake or N2O emissions rate was estimated based on this regression. Sample sets that did not yield a linear regression value of r2 greater than 0.90 were rejected. Rates of CH4 uptake or N2O emissions were determined from an average of three replicates under fertilized treatments and treatments without fertilization. The CH4 or N2O fluxes per unit area were calculated from Yang et al. (2018) [16].

2.3. Soil Collection and Analysis

The soil samples were extracted using a soil drill with a diameter of 0.05 m, using the S-shaped sampling method when collecting gas. The depth of this sampling was 0–20 cm. The sampling location was closed to the chamber. The samples were taken from 10 points per plot and mixed, then packed into sealed bags and brought back to the laboratory.
In the laboratory, the methods used for determining the soil organic carbon (SOC), total nitrogen (TN), soil NH4+-N, NO3--N, pH, and EC were as per the protocols of Yang et al. (2018) [16]. Physicochemical properties for S1 and S2 soils (Table 3) were determined according to the Chinese Soil Society guidelines for soil analysis. The concentrations of Cl, SO42−, Na+, K+, Mg2+, and Ca2+ were determined using a DIONEX ICS-3000 Ion Chromatography System [17]. Direct spectrophotometric measurements of (CO32−) were performed using procedures outlined by Easley et al. (2013) [18]. Bicarbonate ion (HCO3) content was determined using potentiometric titration [19]. The soil temperature and water content were measured in situ at a depth of 0.075 m using a temperature analyzer and TDR moisture analyzer, respectively.

2.4. Data Processing and Plotting

The differences and correlation analysis of CH4 and N2O fluxes from different nitrogen fertilization–saline soil were evaluated for statistical significance using a two-way analysis of variance (ANOVA) in Excel 2018. The random factors were considered in different growing seasons. The test data were processed and plotted using OriginPro 2021.

3. Results

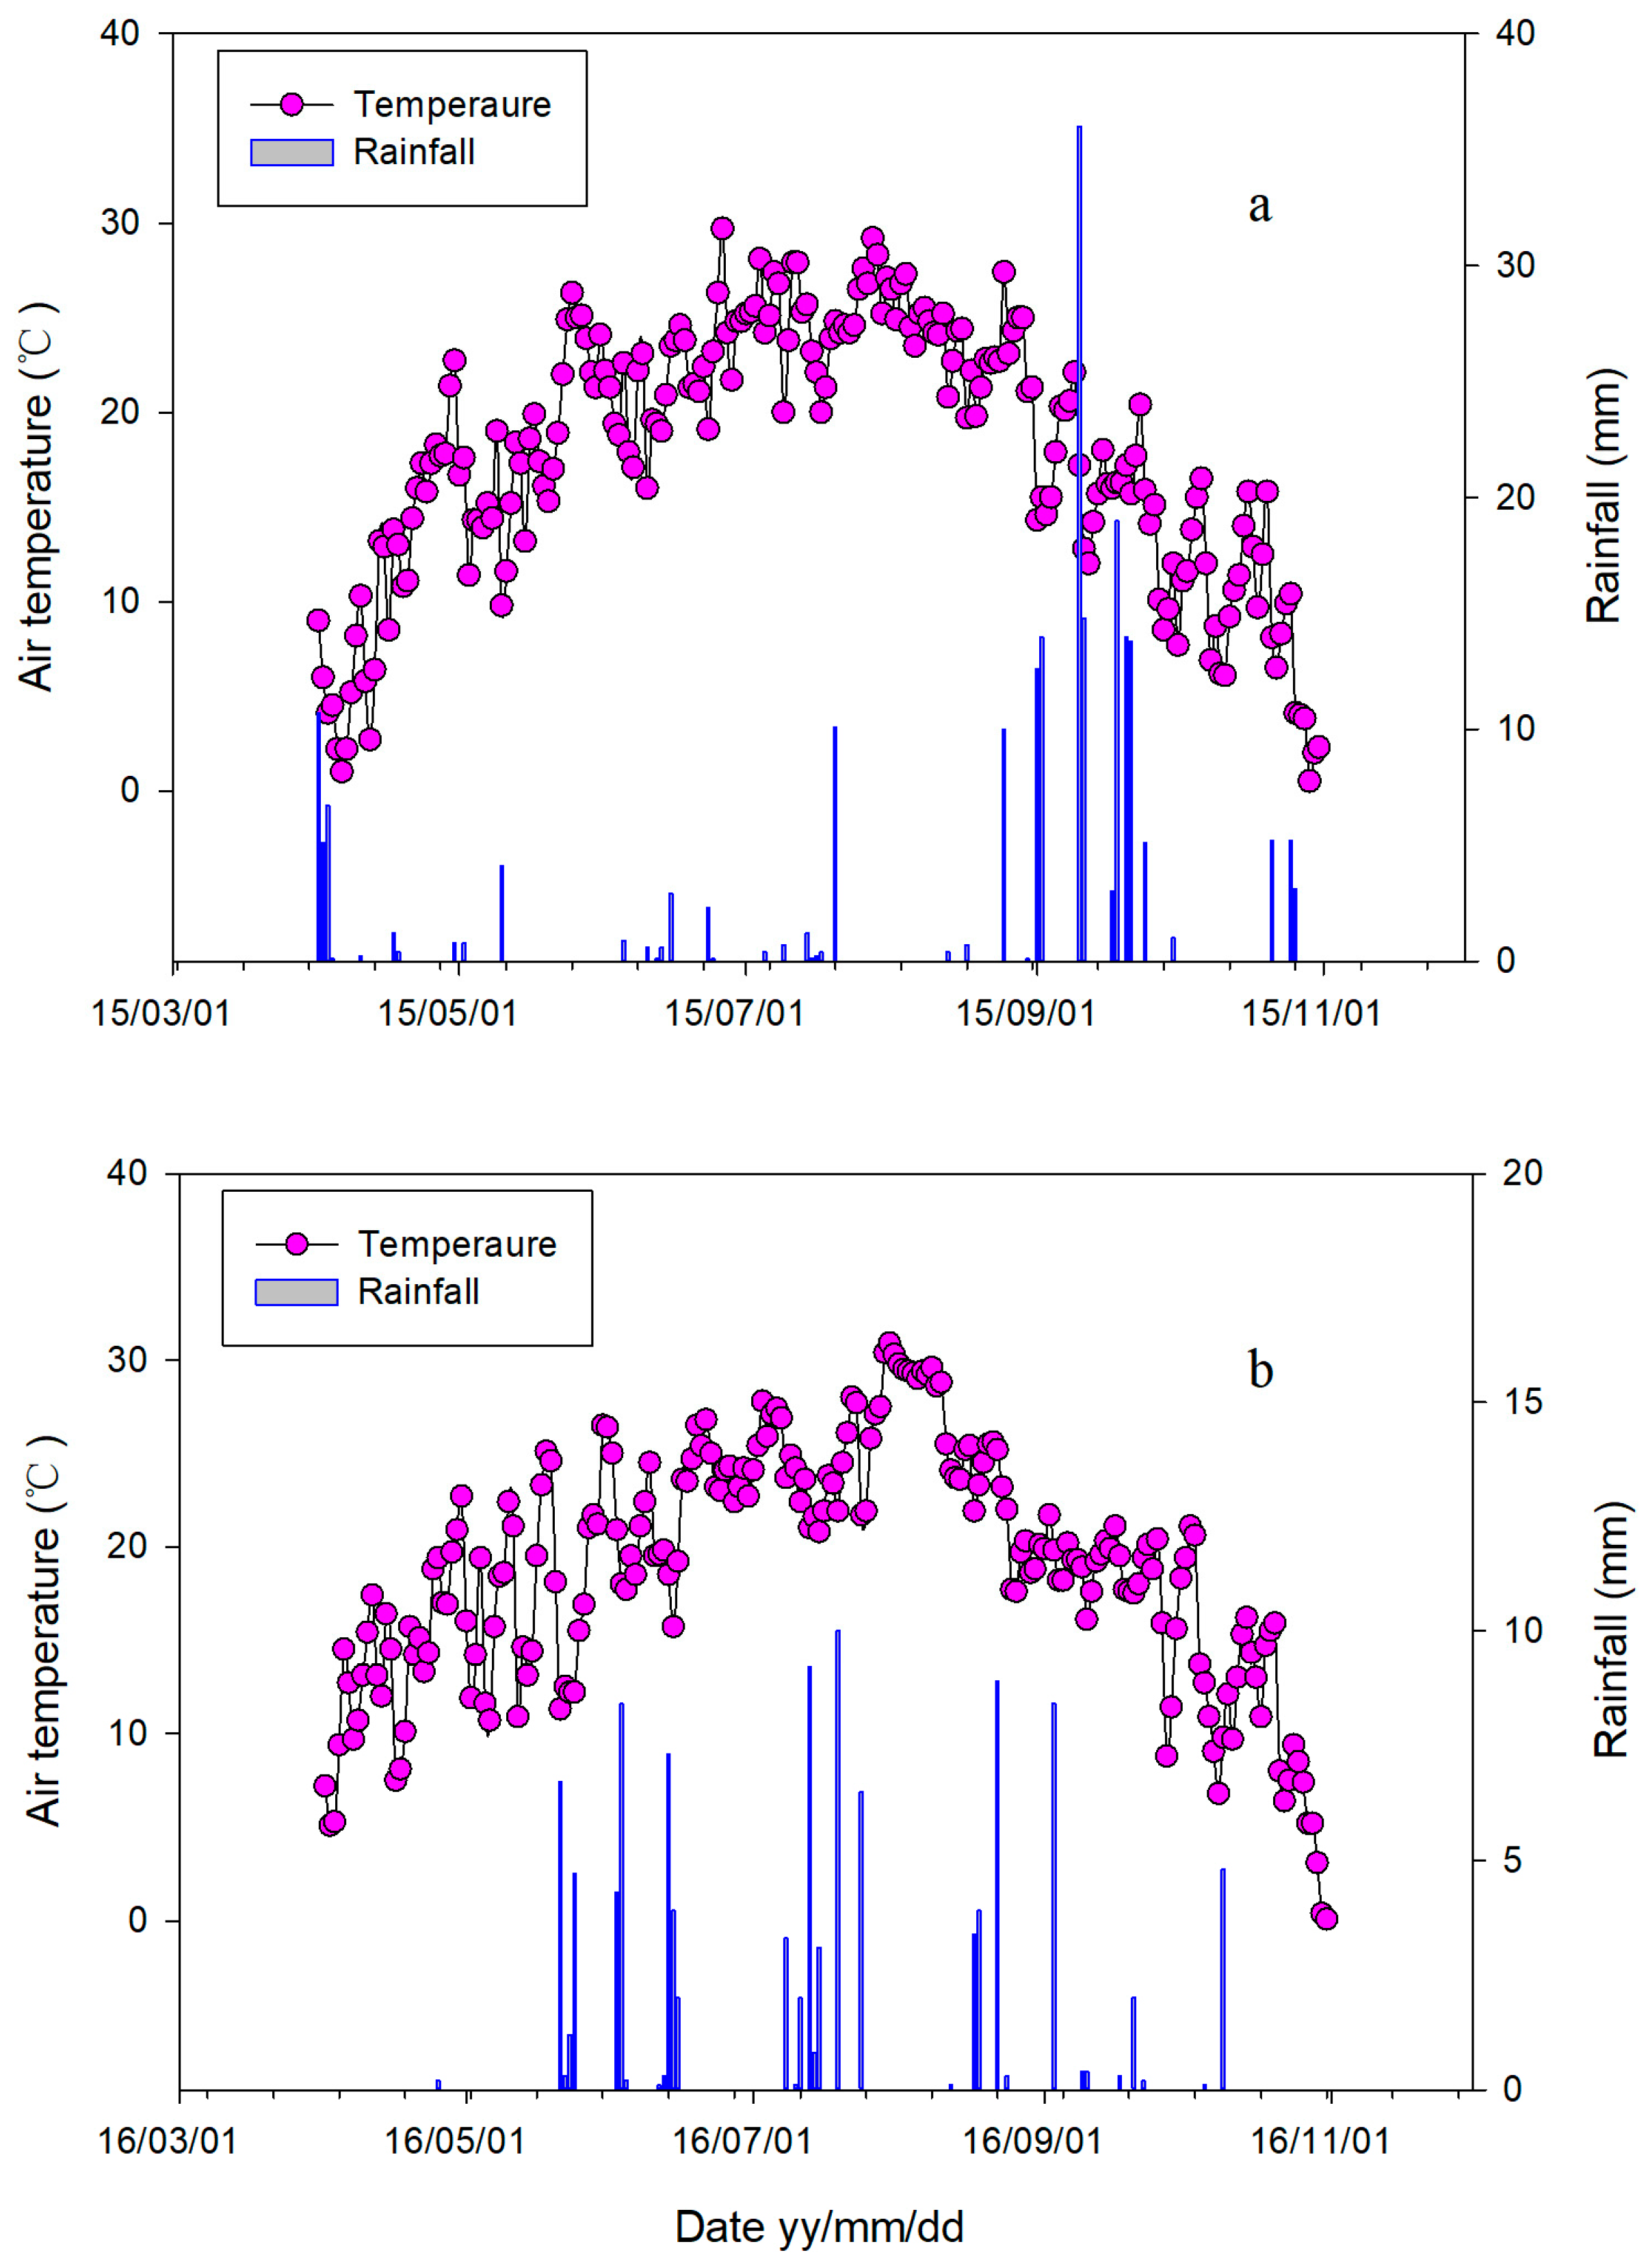
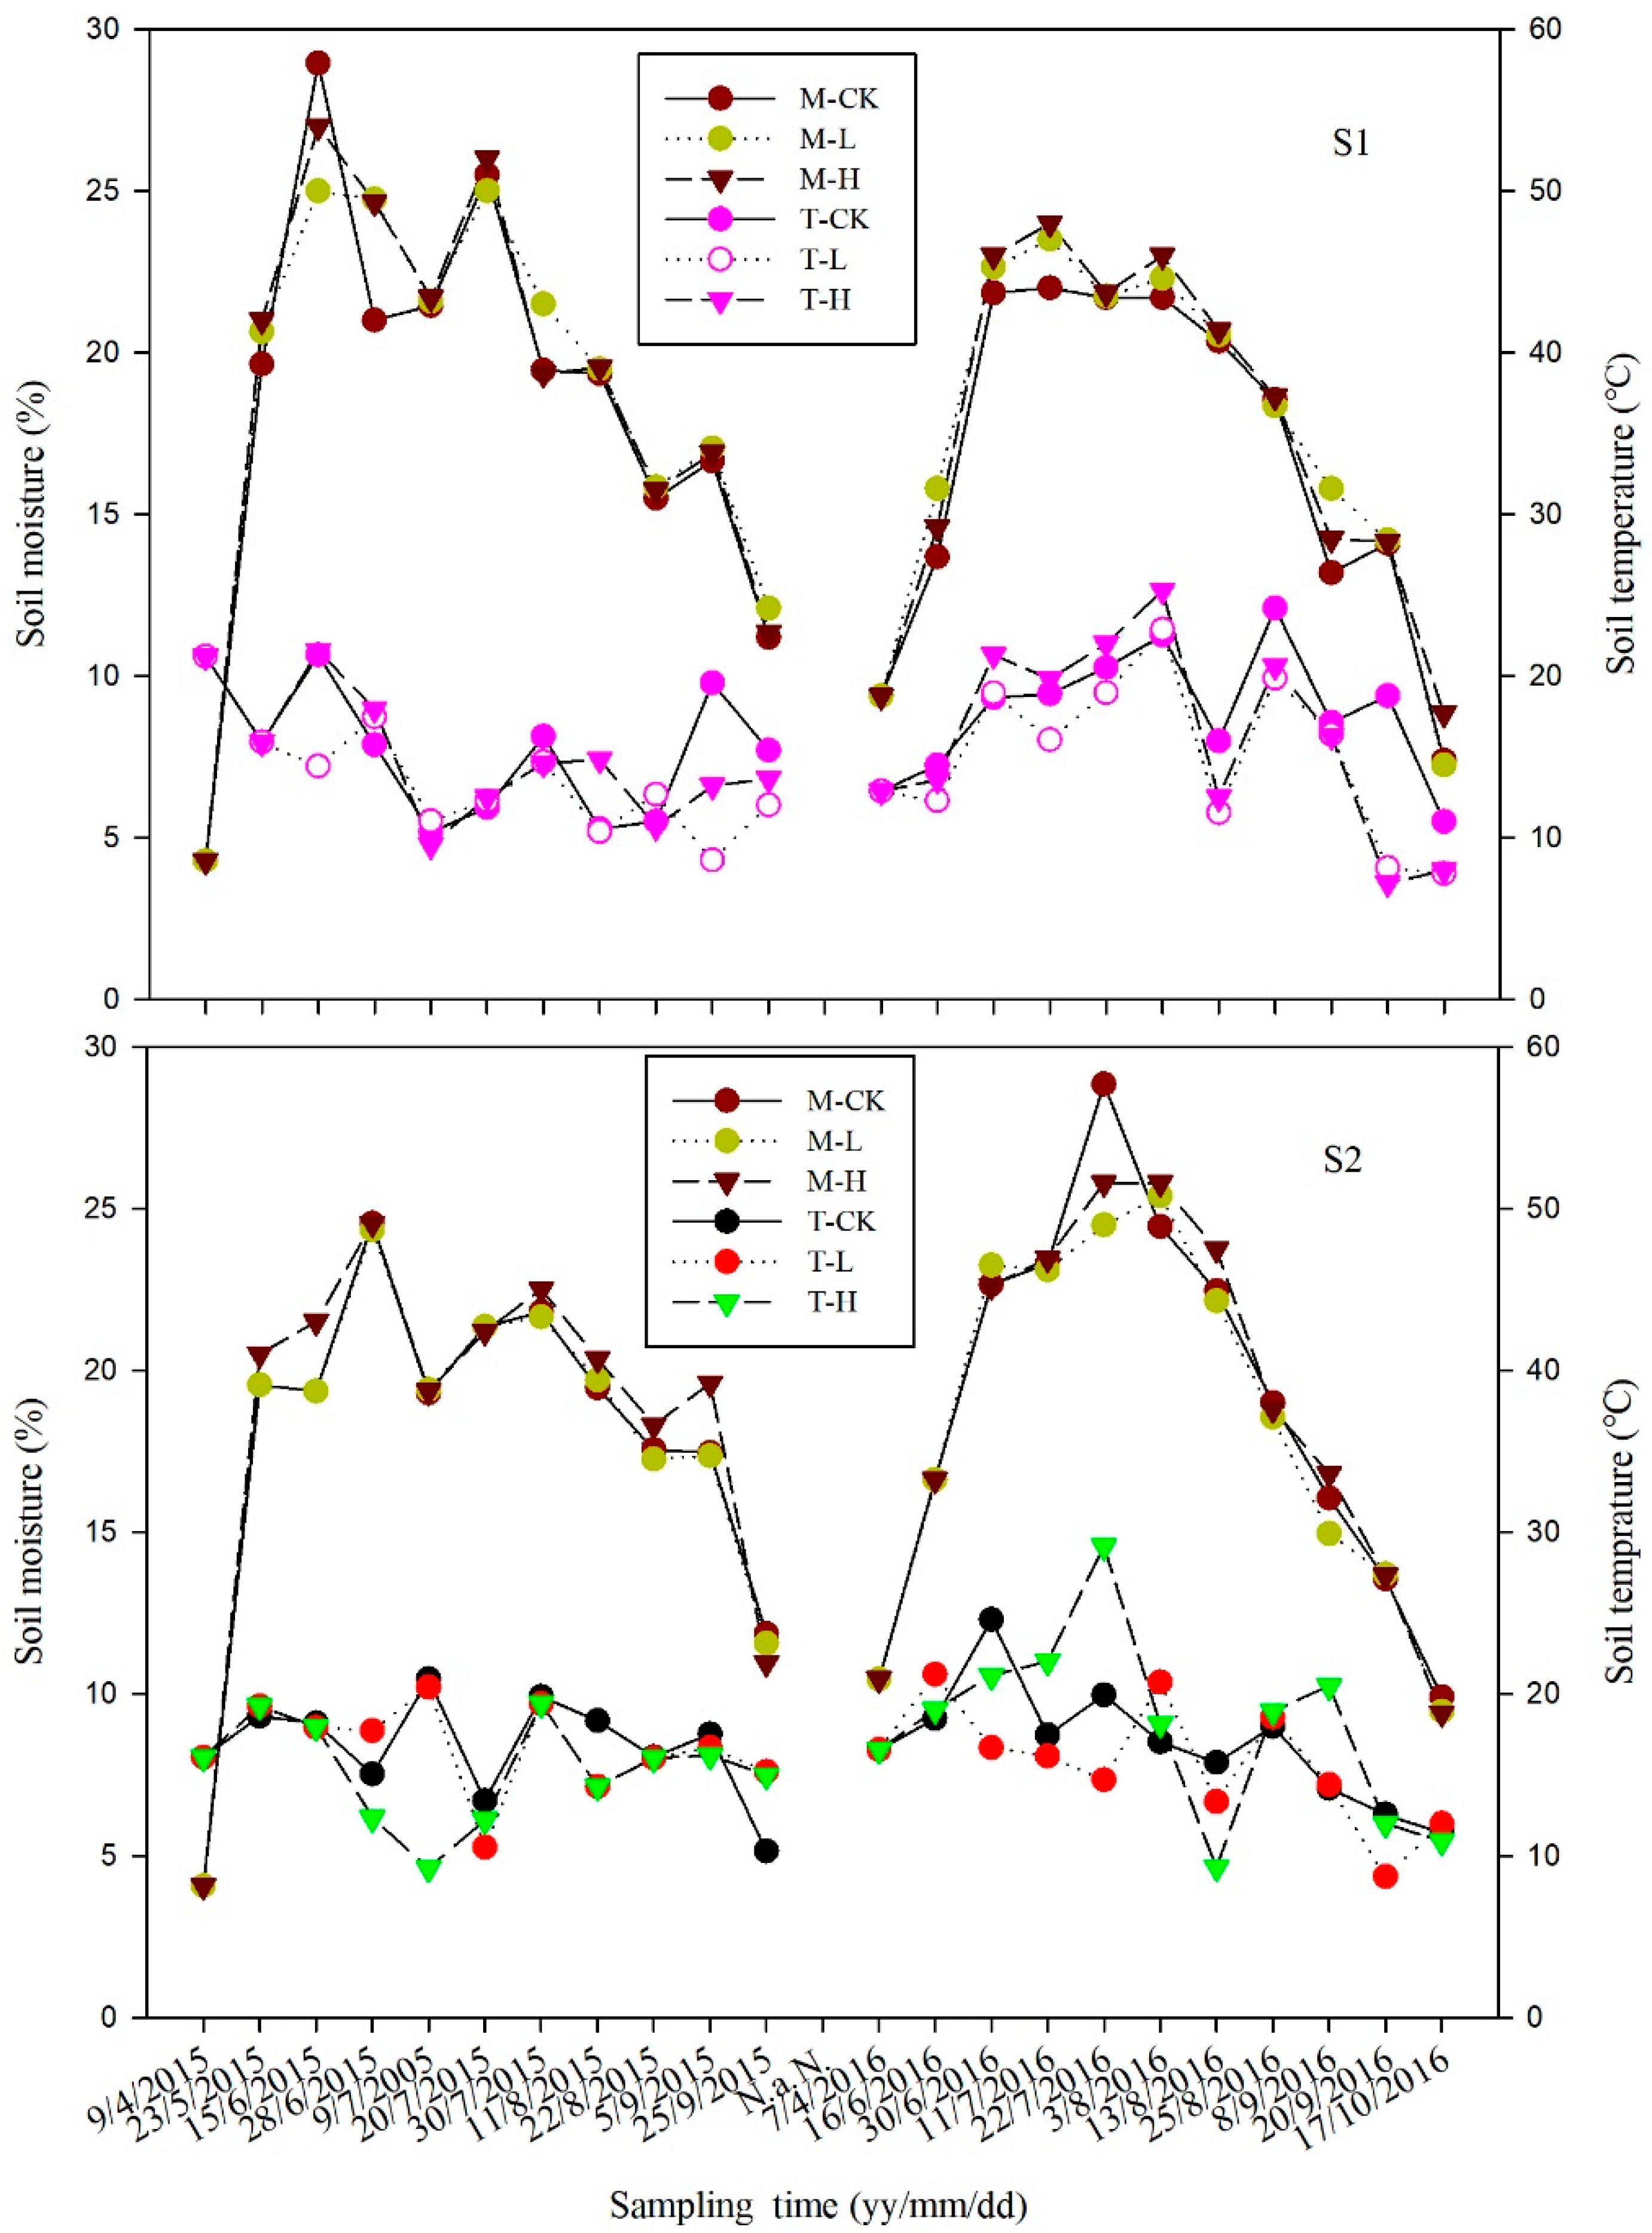
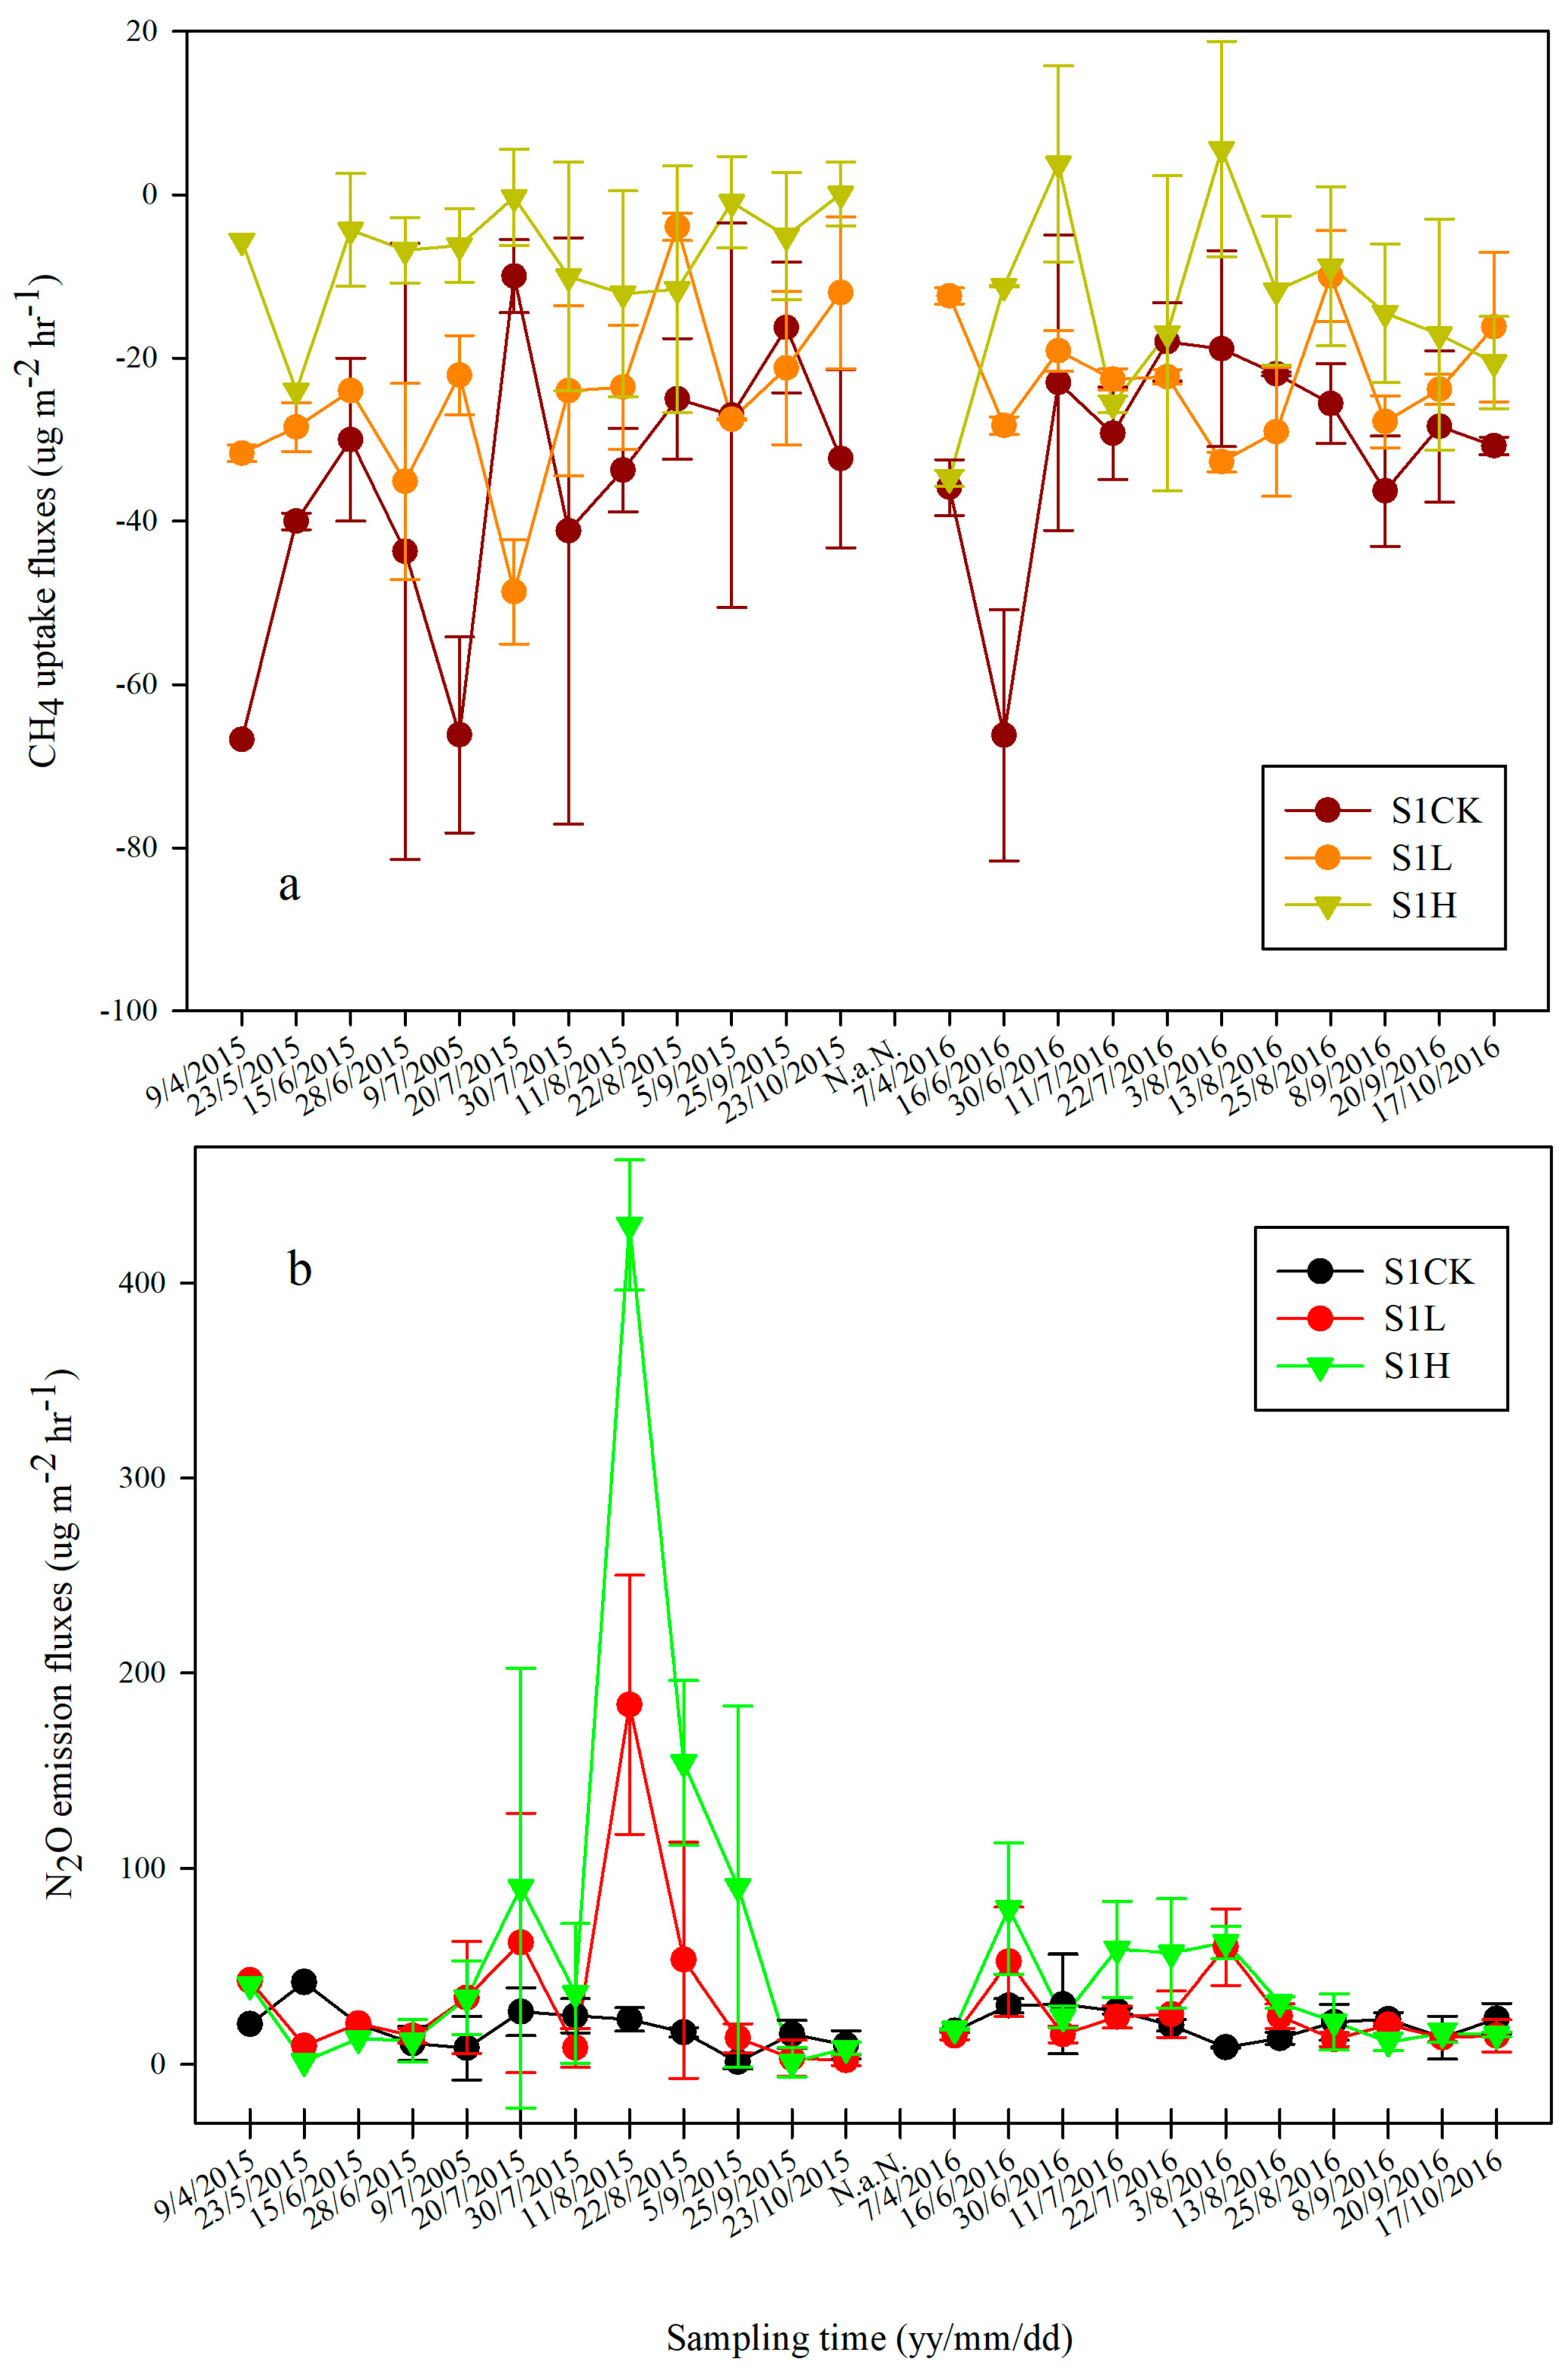
3.1. Effects of Temperature and Moisture in the Soil on Seasonal Variation in CH4 and N2O Fluxes

The soil moisture content and temperature in S1 and S2 showed the same seasonal trends as the CH4 uptake and N2O emission. In July–August 2015–2016, S1 and S2 were under high temperature and moisture in the soil, and CH4 uptake and N2O emission fluxes were high. In contrast, these fluxes were relatively low in April–June and August–November. (Figure 2 and Figure 3).
The S1 and S2 soil exhibited the same trend of CH4 and N2O fluxes at different nitrogen fertilization rates during the whole crop growing season from 2015 to 2016. The CH4 uptake flux peaked at 82.0 μg m−2 hr−1 in July 2016, and the N2O emission flux peaked at 429.8 μg m−2 hr−1 in August 2015 (Figure 3). The H treatment lowered the CH4 uptake fluxes, and increased N2O emission fluxes, compared with the L treatment under the same salinity during the same growing season in 2015 and 2016. S2 soil exhibited lower CH4 uptake fluxes and higher N2O emission fluxes than S1 soil at the same nitrogen application rate in 2015 and 2016.

3.2. Cumulative N2O Emission and CH4 Uptake

The cumulative N2O emission in the saline soils differed significantly between the two nitrogen fertilization rates during growing seasons in 2015 and 2016 (p < 0.01). The H treatment led to higher cumulative N2O emission in saline soils than the L treatment under the same salinity in both growing seasons (p < 0.01). The cumulative N2O emission augmented significantly with increasing salinity in saline soil at the same nitrogen application rate. The cumulative N2O emissions in S1 under the CK, L, and H treatments were 97.0–99.4, 118.2–144.9, and 168.8–278.3 mg m−2, respectively (Figure 4a). The cumulative N2O emissions in S2 under the L and H treatments were 44.1–44.7%, and 74.1–91.1% higher than that in S1 in 2015 and 2016 (p < 0.01). The L and H treatments in S1 increased the cumulative N2O emission by 18.9–49.4% and 69.8–186.9% in comparison to the CK treatment, respectively (p < 0.01). The cumulative N2O emissions in S2 under the L and H treatments were 67.5–124.7% and 216.0–419.2% higher than that under the CK treatment, respectively (Figure 4a).
The cumulative CH4 uptake (F = 8.64, p < 0.01) in S1 and S2 soils differed significantly between fertilizer treatments in the crop growing seasons from 2015 to 2016 (Figure 4b). The cumulative CH4 uptake was higher in S1 than that in S2 for the CK, L, and H treatments (p < 0.01), and decreased with increasing salinity in saline soil. Low and high nitrogen fertilization rates inhibited CH4 uptake in S1 and S2. Compared with the CK treatment, nitrogen application decreased CH4 uptake in saline soils under the same salinity conditions (p < 0.01). The CK, L, and H treatments exhibited cumulative CH4 uptake of 156.8–171.9, 119.7–142.0, and 86.7–104.8 mg m−2 in S1, 139.3–176.0, 109.6–110.6, and 68.5–75.4 mg m−2 in S2, respectively, during the growing season from 2015 to 2016. The cumulative CH4 uptake of L treatments in S1 and S2 are 9.4–30.4% and 21.3–37.2% lower than that of CK treatment, respectively. The cumulative CH4 uptake of H treatments in S1 and S2 are 39.0–44.7% and 50.8–57.2% lower than that of CK treatment, respectively (p < 0.01) (Figure 4b). During the growing seasons, the cumulative CH4 uptake in saline soils for H treatment decreased considerably, compared with L treatment under the same salinity (p < 0.01). There was no significant difference in the cumulative CH4 uptake under any treatment during growing seasons between 2015 and 2016 (p > 0.05).
The soil inorganic N content increased with increasing nitrogen application rate under the same salinity conditions (Table 4). Under the two salinity and three nitrogen application conditions, the cumulative N2O emission showed a significant positive correlation with soil NO3-N content (r = 0.8123, p < 0.01), and EC (r = 0.6403, p < 0.05) (Figure 5).
However, neither the soil NH4+-N nor its NO3-N content had a significant effect on CH4 uptake (p > 0.05).
The effect of saline content, nitrogen application, and the two-factor interaction effects on the cumulative CH4 uptake and N2O emission in saline soil all reached a very significant level (p < 0.01). Nitrogen application was the important factor affecting N2O emissions and CH4 uptake in saline soil (Table 5). The F value shows the influence of nitrogen application and saline soil and its interaction on the N2O emission in the following order: nitrogen application> saline soil >nitrogen application * saline soil; and on CH4 uptake as nitrogen application * saline soil > saline soil > nitrogen application.

4. Discussion

4.1. Fertilization Reduced CH4 Uptake in Soils under Different Salinity Conditions

In our study, the cumulative CH4 uptake of S1 was higher than that of S2 in both growing seasons, and the rate of the cumulative CH4 uptake decreased with increasing soil salinity. Studies have reported that salinity inhibits CH4 oxidation [20], and high salt content strongly inhibits CH4 uptake [21]. Moderately saline soils have a higher potential for CH4 uptake than strongly saline soils [22]. In addition, methanotrophs play an important role in the oxidization of atmospheric CH4, and their activity directly affects CH4 fluxes and the rate of CH4 oxidation from soil to atmosphere [23,24]. The salt content in soil is the most important factor affecting microbial activity and can be correlated to the structure of the methanotrophs community (including species, abundance, diversity, and specific activity) [25]. CH4 uptake was inhibited in strongly saline soil, likely because Methylocella spp., the most abundant methanotrophs, had low activity, whereas few were even unable to oxidize methane in strongly saline soils [26].
This study showed that nitrogen fertilization (diammonium phosphate and urea) application reduced CH4 uptake in salinity conditions, consistent with previous reports. Grassmann et al. (2020) observed a decrease in CH4 uptake because of the fertilization of grassland soils [27]. Powlson et al. (1997) used urea as a nitrogen fertilizer to study the methane-oxidizing ability of farmland soils, finding that long-term fertilization led to a significant decrease in the methane oxidization rate, and urea application inhibited soil methane oxidation by more than 80% in the short term, and the inhibition may be as high as 20%, after soil nitrification [28], since fertilization reduces the activity of methanotrophs in soils [29]. In addition, the effects of the non-specific salt from urea-derived NH4+ inhibit soil CH4 oxidation, thereby reducing soil CH4 uptake [30]. This result was consistent with our research. The NH4+-N content of saline soils in the H treatment was higher than that in the L treatment (Table 4). The effect of the nitrogen application rate on the CH4 uptake by saline soils varied with soil salinity, compared with CK. CH4 uptake in the S1 with the H and L nitrogen fertilization was lower than that of CK. CH4 uptake was lower in the H treatment than in the L treatment. The minimum CH4 uptake occurred at the highest fertilization rate of S2. Different amounts of nitrogen fertilizer (diammonium phosphate) applied to various saline soils had diverse effects on CH4 fluxes, possibly because soil properties such as pH and salinity are key factors regulating bacterial diversity and community structure [31]. Soil temperature and moisture are not important single factors affecting CH4 uptake. This may be because CH4 uptake is subject to the cumulative effect of EC, moisture, and temperature; therefore, the contribution of soil temperature and moisture to CH4 uptake is smaller and was obscured by the effects of nitrogenous fertilizer and EC to CH4 uptake [16]. In the future, it will be necessary to study the effects of the activity and community structure of methanotrophs, and the methane oxidation rate in saline soils enhancing CH4 uptake under the performance of agricultural and fertilization management practices. This could be an important research direction for gaining deeper insights into the effects and mechanisms of agricultural practices on CH4 uptake in arable saline soils.

4.2. Effect of Nitrogen Fertilization on N2O Emission in Saline Soils under Different Salinity Conditions

Indoor incubation experiments and field tests have shown that saline soils produce more N2O emissions than non-saline soils after NH4+ fertilization [16,32,33] Ghosh et al. (2017). This study showed that diammonium phosphate and urea application in saline soils significantly increased N2O emission with increasing salinity, consistent with the above findings. Zhou et al. (2017a) reported that salinity induced increases in N2O emissions, which is attributed to salt having a stronger inhibitory effect on nitrite reductase in comparison with ammonia-oxidizing bacteria (AOB) [34]. The functional nitrite reductase nir gene can be used as a molecular marker for denitrifying bacteria. It exhibits two structural forms, the copper-containing nitrite reductase (Cu-nir) encoded by the NirK gene and the cytochrome cd1-containing nitrite reductase (cd1-nir) encoded by the nirS gene. The NirK gene is more widely distributed than the nirS gene and is more sensitive to environmental factors. Another possible reason for the promotional effect of soil salinity on N2O emission is that salinity reduces N2O reductase activity. The reduction of N2O to N2 is the last step in the denitrification process in specific denitrifying bacteria and is primarily determined by N2O reductase activity, which is more sensitive to the external environment than other N-cycling enzymes. High soil salinity strongly inhibits N2O reductase. Under denitrification-favoring, NO3 N rich, anaerobic conditions soil N2O emission shows a positive response to increased salinity [35,36]. This study showed that N2O emission from nitrogen-fertilized saline soils ranged from 209.6 to 484.4 mg m−2, which was significantly higher than in other non-saline fertilized areas [37,38], which is attributed to the fact that soil salinity promotes soil N2O emission. Moreover, the shallow groundwater in the Hetao Irrigation District facilitates soil N2O emission.
Soil N2O emission under different salinity conditions increased with increasing nitrogen fertilization. Nitrogen fertilization promotes N2O emission from saline soils because of large quantities of nitrogen present as a substrate for soil nitrification and denitrification, thereby facilitating N2O emission [39]. The inorganic nitrogen content of soil decreases with increasing salinity [40,41]. This study showed that the nitrogen availability in saline soils varied with salinity under different fertilization treatments. The inorganic nitrogen content in S2 under the CK, L, and H treatments was lower than that in S1, respectively. Therefore, the soil inorganic nitrogen content decreased with increasing soil salinity under the same fertilization conditions.
This study showed that N2O emissions increased steadily as the soil temperature and moisture increased. N2O emissions generally peaked when soil temperature and moisture peaked. The two processes of nitrification and denitrification that microorganisms participated in had a significant effect on N2O emissions, which are mainly related to soil temperature and moisture [42]. Inorganic nitrogen content in the studied soil increased with increasing nitrogen fertilization rate, whether the soil’s salinity was high (S2) or low (S1). The content of NH4+-N and NO3-N in soil are fundamental factors limiting soil N2O production, whether through soil nitrification or denitrification. Nitrogen fertilization is favorable for the survival of nitrifying and denitrifying microorganisms in saline soils regardless of salinity level and can effectively reduce N2O emission from nitrification, with the probability of N2O formation through denitrification increasing with the increasing inorganic nitrogen content in soil [43]. This study revealed a highly significant positive correlation (p < 0.01) between N2O emission and NO3-N content in saline soils (Figure 5). In the arable saline soils of the Hetao Irrigation District, N2O is primarily produced by denitrification, as evidenced by that NO3- N has significant correlation with N2O emission. The applied fertilizer provides substrate, nutrients, and a suitable environment for AOB and denitrifying bacteria (NirK) to facilitate soil denitrification and nitrifier denitrification. Further study should be conducted on the changes in the abundance of AOB and denitrifying bacteria (NirK) with increasing fertilization rates in saline soils with a fixed salinity level.

4.3. The Effects of Interactions from Fertilization and EC on the Cumulative CH4 Uptake and N2O Emissions

Nitrogen fertilization affects CH4 and N2O fluxes in saline soils. The results of N2O emission and CH4 uptake from fertilized saline soil in the experimental area were used to estimate the total greenhouse gas emissions in the region. The area of Hetao Plain affected by saline was 79.73 × 10⁴ ha in Inner Mongolia, China [42]. The two-year mean cumulative N2O emission from S1 in Hetao Plain of China over the growing season (from April to October) was estimated to be 0.78 × 10⁶ kg, 1.05 × 10⁶ kg, and 1.78 × 10⁶ kg under the CK, L, and H treatments, respectively, and the cumulative CH4 uptake was estimated to be 1.31 × 10⁶ kg, 0.57 × 10⁶ kg, and 1.04 × 10⁶ kg, respectively. The corresponding results in S2 were 0.78 × 10⁶ kg, 1.52 × 10⁶ kg, and 3.22 × 10⁶ kg for cumulative N2O emission, and 0.88 × 10⁶ kg, 1.26 × 10⁶ kg, and 0.76 × 10⁶ kg for cumulative CH4 uptake, respectively. The cumulative N2O emission in S1 and S2 from Hetao Plain account for 0.36–0.83% and 0.36–1.5% of the annual estimated N2O emission of 2.15 × 10⁹ kg in China [44], respectively. The cumulative CH4 uptake in S1 and S2 from Hetao Plain under various fertilization conditions accounted for 0.21–0.47% and 0.27–0.45% of the annual estimated CH4 uptake of 2.78 × 10⁹ kg in China [45], respectively. The proportions of CH4 uptake and N2O emission in Hetao Plain for China approximated the proportion of CH4 uptake and N2O emission from saline soil in the Gurbantunggut Desert, Xinjiang, accounting for 0.23% and 0.52% of the national estimated value of China, respectively [46].
The slightly saline soils involved in CH4 uptake could be considered a sink, but the capacity as a carbon sink decreased with increasing salinity and nitrogen fertilization in saline soil. Nitrogen fertilization increased the N2O emissions in saline soils, and the N2O emissions were significantly high in strongly saline soils at a high nitrogen fertilization rate. The CH4 uptake and the N2O emissions under different soil and fertilization conditions have shown that salt control and reduction of fertilizer application are effective measures to reduce the N2O emissions and increase the CH4 uptake in arable saline soils.

5. Conclusions

In this study, a two-year field experiment was performed to investigate the effects of nitrogen application level on the CH4 uptake and N2O emissions from intensively managed saline fields with different EC. The fluxes of CH4 uptake and N2O emissions from different nitrogen application and EC level varied remarkably in the growing seasons. Low salinity in the soil significantly inhibited N2O emission and increased CH4 uptake compared to soils with high salinity. CH4 uptake decreased with increasing salinity and nitrogen application rates in saline soil. N2O emission was promoted by nitrogen fertilization with increased salinity in saline soil. In terms of CH4 uptake and N2O emissions, treatment L would be recommended for soil S1. As a suggestion for future research, remediation of saline soil and optimization of fertilization are effective measures to reduce greenhouse gas emissions.

Author Contributions

Project administration, Y.J.; writing—original draft preparation, W.Y.; formal analysis, M.Y., H.W. and Y.H.; data curation, W.Y. All authors have read and agreed to the published version of the manuscript.

Funding

This research has been supported by the National Natural Science Foundation of China [Grant No. 42265004], the Science Foundation for Distinguished Young Scholars of Inner Mongolia Autonomous Region, China [Grant No. 2022JQ02], the Program for Young Talents of Science and Technology in Universities of Inner Mongolia Autonomous Region, China [grant No. NJYT23041], the Fundamental Research Funds for the Inner Mongolia Normal University [Grant No. 2022JBTD009], the Key research and development and achievement transformation plan of Inner Mongolia Autonomous Region [Grant No. 2022YFHH0035], and the High level talents research project of Inner Mongolia Normal University, China [Grant No. 2020YJRC056].

Data Availability Statement

Data is contained within the article. No new data were created in this study.

Acknowledgments

We sincerely appreciate the anonymous reviewers and editors for their critical and valuable comments to help improve this manuscript. The authors are grateful to the Inner Mongolia Key Laboratory of Environmental Chemistry for authorizing the use of the scientific research field and providing help during the research. We acknowledge the editorial team from the Journal of Agricultural Environmental Science for providing language help and writing assistance.

Conflicts of Interest

The authors declare no conflict of interest.

References

  1. IPCC. Climate Change 2013: The Physical Science Basis, Contribution of Working Group I to the Fourth Assessment Report of the Intergovernmental Panel on Climate Change; Cambridge University Press: Cambridge, UK; New York, NY, USA, 2013. [Google Scholar]
  2. US-EPA. Global Anthropogenic Non-CO2 Greenhouse Gas Emissions, 1990–2020; EPA 430-R-06-003; United States Environmental Protection Agency: Washington, DC, USA, 2006.
  3. IPCC. Agriculture. In Climate Change 2007, Mitigation, Contribution of Working Group III to the Fourth Assessment Report of the Intergovernmental Panel on Climate Change; Metz, B., Davidson, O.R., Bosch, P.R., Dave, R., Meyer, L.A., Eds.; Cambridge University Press: Cambridge, UK; New York, NY, USA, 2007. [Google Scholar]
  4. Liu, S.A.; Wang, J.J.; Tian, Z.; Wang, X.D.; Harrison, S. Ammonia and greenhouse gas emissions from a subtropical wheat field under different nitrogen fertilization strategies. J. Environ. Sci. 2017, 57, 196–210. [Google Scholar] [CrossRef]
  5. Lam, S.K.; Suter, H.; Davies, R.; Bai, M.; Mosier, A.R.; Sun, J.; Chen, D. Direct and indirect greenhouse gas emissions from two intensive vegetable farms applied with a nitrification inhibitor. Soil Biol. Biochem. 2018, 116, 48–51. [Google Scholar] [CrossRef]
  6. Kuypers, M.M.M.; Marchant, H.K.; Kartal, B. The microbial nitrogen-cycling network. Nat. Rev. Microbiol. 2018, 16, 263–276. [Google Scholar] [CrossRef]
  7. Pathak, H.; Rao, D.L.N. Carbon and Nitrogen Mineralization from added Organic Matter in Saline and Alkali Soils; Central Soil Salinity Research Institute: India, Haryana, 1998. [Google Scholar]
  8. Fagodiya, R.K.; Malyan, S.K.; Singh, D.; Kumar, A.; Yadav, R.K.; Sharma, P.C.; Pathak, H. Greenhouse Gas Emissions from Salt-Affected Soils: Mechanistic Understanding of Interplay Factors and Reclamation Approaches. Sustainability 2022, 14, 11876. [Google Scholar] [CrossRef]
  9. Haj-Amor, Z.; Araya, T.; Kim, D.G.; Bouri, S.; Lee, J.; Ghiloufi, W.; Yang, Y.; Kang, H.; Kumar Jhariya, M.; Banerjee, A.; et al. Soil salinity and its associated effects on soil microorganisms, greenhouse gas emissions, crop yield, biodiversity and desertification: A review. Sci. Total Environ. 2022, 843, 156946. [Google Scholar] [CrossRef] [PubMed]
  10. Rengasamy, P. Soil processes affecting crop production in salt-affected soils. Funct. Plant Biol. 2010, 37, 613–620. [Google Scholar] [CrossRef]
  11. Meena, M.D.; Yadav, R.K.; Narjary, B.; Yadav, G.; Jat, H.S.; Sheoran, P.; Meena, M.K.; Antil, R.S.; Meena, B.L.; Singh, H.V.; et al. Municipal solid waste (MSW): Strategies to improve salt affected soil sustainability: A review. Waste Manage. 2019, 84, 38–53. [Google Scholar] [CrossRef]
  12. Yang, T.T.; Hu, C.Y.; Ding, G.D.; Wang, H.J. Types and recognizing system of saline-alkaline land in Hetao irrigation district. J. Inner Mongolia Agr. Univ. 2005, 26, 44–49. [Google Scholar]
  13. Bohm, J.; Messerer, M.; Muller, H.M.; Scholz-Starke, J.; Gradogna, A.; Scherzer, S.; Maierhofer, T.; Bazihizina, N.; Zhang, H.; Stigloher, C.; et al. Understanding the molecular basis of salts equestration in epidermal bladder cells of Chenopodium quinoa. Curr. Biol. 2018, 28, 3075–3805. [Google Scholar] [CrossRef]
  14. Wang, R.S.; Wan, S.Q.; Sun, J.X.; Xiao, H.J. Soilsalinity, sodicity and cotton yield parameters under different drip irrigation regimes during saline wasteland reclamation. Agr. Water Manage. 2018, 209, 20–31. [Google Scholar] [CrossRef]
  15. Yang, W.Z.; Jiao, Y.; Yang, M.D.; Wen, H.Y.; Liu, L.J. Absorbed carbon dioxide in saline soil from northwest China. CATENA 2021, 207, 105677. [Google Scholar] [CrossRef]
  16. Yang, W.Z.; Jiao, Y.; Yang, M.D.; Wen, H.Y. Methane uptake by saline–alkaline soils with varying electrical conductivity in the Hetao Irrigation District of Inner Mongolia, China. Nutr. Cycl. Agroecosys. 2018, 112, 265–276. [Google Scholar] [CrossRef]
  17. Pisinaras, V.; Tsihrintzis, V.A.; Petalas, C.; Ouzounis, K. Soil salinization in the agricultural lands of Rhodope District, northeastern Greece. Environ. Monit. Assess. 2010, 166, 79–94. [Google Scholar] [CrossRef]
  18. Easley, R.A.; Patsavas, M.C.; Byrne, R.H.; Liu, X.; Feely, R.A. Spectrophotometric measurement of calcium carbonate saturation states in seawater. Environ. Sci. Technol. 2013, 47, 1468–1477. [Google Scholar] [CrossRef]
  19. Bocanegra-Garcia, G.; Carrillo-Chavez, A. Hydro-geochemical behavior of bicarbonate and sulfate ions leaching from a sulfide-poor silver mine in Central Mexico: Potential indicator of acid mine drainage. B Environ. Contam. Tox. 2003, 71, 1222–1229. [Google Scholar] [CrossRef]
  20. King, G.M.; Schnell, S. Effects of ammonium and non-ammonium salt additions on methane oxidation by Methylosinustrichosporium OB3b and Maine forest soils. Appl. Environ. Microb. 1998, 64, 253–257. [Google Scholar] [CrossRef] [PubMed]
  21. Serrano-Silva, N.; Valenzuela-Encinas, C.; Marsch, R.; Dendooven, L.; Alcántara-Hernández, R.J. Changes in methane oxidation activity and methanotrophic community composition in saline-alkaline soils. Extremophiles 2014, 18, 561–571. [Google Scholar] [CrossRef]
  22. Zhang, J.F.; Li, Z.J.; Ning, T.Y.; Gu, S.B. Methane uptake in salt-affected soils shows low sensitivity to salt addition. Soil Biol. Biochem. 2011, 43, 1434–1439. [Google Scholar] [CrossRef]
  23. Zheng, Y.; Zhang, L.M.; Zheng, Y.M.; Di, H.; He, J.Z. Abundance and community composition of methanotrophs in a Chinese paddy soil under long-term fertilization practices. J. Soil Sediment 2008, 8, 406–414. [Google Scholar] [CrossRef]
  24. LeMer, J.; Roger, P. Production, xidation, emission and consumption of methane by soils: A review. Eur. J. Soil Biol. 2001, 7, 25–35. [Google Scholar] [CrossRef]
  25. Valenzuela-Encinas, C.; Alcantara-Hernandez, R.J.; Estrada-Alvarado, I.; Zavala-Díaz de la Serna, F.J.; Dendooven, L.; Marsch, R. The archaeal diversity and population in a drained alkaline saline soil of the former lake Texcoco (Mexico). Geomicrobiol. J. 2012, 29, 18–22. [Google Scholar] [CrossRef]
  26. Unteregelsbacher, S.; Gasche, R.; Lipp, L.; Sun, W.; Kreyling, O.; Geitlinger, H.; Kgel-Knabner, I.; Papen, H.; Kiese, R.; Schmid, H.P.; et al. Increased methane uptake but unchanged nitrous oxide flux in montane grasslands under simulated climate change conditions. Eur. J. Soil Sci. 2013, 64, 586–596. [Google Scholar] [CrossRef]
  27. Grassmann, C.S.; Mariano, E.; Rocha, K.F.; Gilli, B.R.; Rosolem, C.A. Effect of tropical grass and nitrogen fertilization on nitrous oxide, methane, and ammonia emissions of maize-based rotation systems. Atmos. Environ. 2020, 234, 117571. [Google Scholar] [CrossRef]
  28. Powlson, S.D.; Goulding, W.T.K.; Willison, W.T.; Websterb, P.C.; Hütsch, B.W. The effect of agriculture on methane oxidation in soil. Nutr. Cycl. Agroecosys. 1997, 49, 59–70. [Google Scholar] [CrossRef]
  29. Horz, H.P.; Yimga, M.T.; Liesack, W. Detection of methanotroph diversity on roots of submerged rice plants by molecu larretrieval of pmoA, mmoX, mxaF, and 16SrRNA and ribosomal DNA, including profiling. Appl. Environ. Microb. 2001, 67, 4177–4185. [Google Scholar] [CrossRef] [PubMed]
  30. Yang, N.; Fan, L.; He, P.J.; Shao, L.M. Response of methanotrophs and methane oxidation on ammonium application in landfill soils. Appl. Microbiol. Biot. 2011, 92, 1073–1082. [Google Scholar] [CrossRef]
  31. Sjogersten, S.; Wookey, P.A. Spatio-temporal variability and environmental controls of methane fluxes at the forest-tundra ecotone in the fennoscandian mountains. Global Change Biol. 2002, 8, 885–894. [Google Scholar] [CrossRef]
  32. Zhang, W.; Zhou, G.; Li, Q.; Liao, N.L.; Guo, H.; Min, W.; Ma, L.; Ye, J.; Hou, Z. Saline water irrigation stimulate N2O emission from a drip-irrigated cotton field. Acta Agr. Scand. B S. P. 2016, 66, 141–152. [Google Scholar] [CrossRef]
  33. Ghosh, U.; Thapa, R.; Desutter, T.; He, Y.; Chatterjee, A. Saline-sodic soils: Potential sources of nitrous oxide and carbon dioxide emissions? Pedosphere 2017, 27, 65–75. [Google Scholar] [CrossRef]
  34. Zhou, M.H.; Butterbach-Bahl, K.; Vereecken, H.; Bruggemann, N. Ameta-analysis of soil salinization effects on nitrogen pools, cycles and fluxes in coastal ecosystems. Global Change Biol. 2017, 23, 1338–1352. [Google Scholar] [CrossRef]
  35. Reddy, N.; Crohn, D.M. Effects of soils alinity and carbon availability from organic amendments on nitrous oxide emissions. Geoderma 2014, 235–236, 363–371. [Google Scholar] [CrossRef]
  36. Wang, C.; Tong, C.; Chambers, L.G.; Liu, X.T. Identifying the salinity thresholds that impact greenhouse gas production in subtropical tidal fresh water marsh soils. Wetlands 2017, 37, 559–571. [Google Scholar] [CrossRef]
  37. Wu, Q.F.; Wu, X.P.; Li, Y.K.; Wu, H.J.; Yan, P.; Zhang, Y.C.; Li, R.N.; Wang, L.Y.; Wang, X.B.; Cai, D.X. Studies on the fluxes of nitrous oxide from greenhouse vegetable soil. J. Plant Nutr. Fert. 2011, 17, 942–948. [Google Scholar]
  38. Hou, A.X.; Tsuruta, H. Nitrous oxide and nitric oxide fluxes from an upland field in Japan: Effect of urea type, placement, and crop residues. Nutr. Cycl. Agroecosys. 2003, 65, 191–200. [Google Scholar] [CrossRef]
  39. Zhao, C.S.; Hu, C.X.; Sun, X.C.; Huang, W. Influence of temperature and moisture on nitrogen mineralization in vegetable fields of central China. Chinese J. Eco-Agr. 2012, 20, 861–866. [Google Scholar] [CrossRef]
  40. Laura, R.D. Salinity and nitrogen mineralization in soil. Soil Biol. Biochem. 1977, 9, 333–336. [Google Scholar] [CrossRef]
  41. Gandhi, A.P.; Paliwal, K.V. Mineralization and gaseous losses of nitrogen from urea and ammonium sulphate in salt-affected soils. Plant Soil 1976, 45, 247–255. [Google Scholar] [CrossRef]
  42. Yang, W.Z.; Yang, M.D.; Wen, H.Y.; Jiao, Y. Global Warming Potential of CH4 uptake and N2O emissions in saline–alkaline soils. Atmos. Environ. 2018, 191, 172–180. [Google Scholar] [CrossRef]
  43. Gu, J.X.; Nicoullaud, B.; Rochette, P.; Grossel, A.; Hénault, C.; Cellier, P.; Richard, G. Aregional experiment suggests that soil texture is a major control of N2O emissions from tile-drained winterwheat fields during the fertilization period. Soil Biol. Biochem. 2013, 60, 134–141. [Google Scholar] [CrossRef]
  44. Zhou, F.; Shang, Z.Y.; Ciais, P.; Tao, S.; Piao, S.L.; Raymond, P.; He, C.F.; Li, B.G.; Wang, R.H.; Wang, X.H.; et al. A new high-resolution N2O emission inventory for China in 2008. Environ. Sci. Technol. 2014, 48, 8538–8547. [Google Scholar] [CrossRef] [PubMed]
  45. Zhuang, Q.L.; Chen, M.; Xu, K.; Tang, J.Y.; Saikawa, E.; Lu, Y.Y.; Melillo, J.M.; Prinn, R.G.; McGuire, A.D. Response of global soil consumption of atmospheric methane to changes in atmospheric climate and nitrogen deposition. Global Biogeochem. Cy. 2013, 27, 650–663. [Google Scholar] [CrossRef]
  46. Zhou, X.B.; Zhang, Y.M.; Tao, Y.; Wu, L. Effects of fluxes of nitrous oxide, methane and carbon dioxide and their responses to increasing nitrogen deposition in the Gurbantünggüt Desert of Xinjiang, China. Chinese J. Plant Ecology 2017, 41, 290–300. [Google Scholar]
Figure 1. Changes in daily average temperature and precipitation (a) for 2015 and (b) for 2016.
Agronomy 13 00473 g001
Figure 2. Variation pattern of soil moisture and soil temperature in the S1 and S2 with three levels of nitrogen fertilization (H, L, and CK) in saline soil from 2015 to 2016. (S1: slightly saline soil; S2: strongly saline soil; M: soil moisture; T: soil temperature).
Agronomy 13 00473 g002
Figure 3. Variation pattern of CH4 uptake fluxes (a) and N2O emission fluxes (b) from S1, and CH4 uptake fluxes (c) and N2O emission fluxes (d) from S2 with three levels of nitrogen fertilization (H, L, and CK) in saline soil from 2015 to 2016. Vertical bars indicate the mean and standard error. (S1: slightly saline soil; S2: strongly saline soil).
Agronomy 13 00473 g003aAgronomy 13 00473 g003b
Figure 4. Cumulative N2O emissions (a) and cumulative CH4 uptake (b) in the S1 and S2 with three levels of nitrogen fertilization (H, L, and CK) in saline soil from 2015 to 2016. Vertical bars indicate the mean and standard error. There was significant difference for different letters (A–F) (p < 0.01). (S1: slightly saline soil; S2: strongly saline soil).
Agronomy 13 00473 g004
Figure 5. Pearson correlation analysis of CH4 uptake and N2O emissions (n = 18, * p ≤ 0.05). EC: Electrical conductivity; NH4+-N: Ammonium; NO3-N: Nitrate; T: Soil temperature; M: Soil moisture.
Agronomy 13 00473 g005
Table 1. Soil salt content in the different soils in the study site (%).
SoilsK+/(%)Na+/(%)Ca2+/(%)Mg2+/(%)SO42−/(%)CO32−/(%)HCO3/(%)Cl/(%)Total Salt Content/(%)
S10.0020.0090.0140.00560.0130.0000.0640.0100.120
S20.0060.1200.0830.0450.3900.0000.0480.1400.830
Table 2. Soil salinization classification index [16].
Time
Treatments
Soil Salt Content (%)Saline Type
Non SalinizationLowMediumHighSaline Soil
Coastal and semi- humid, semi-arid and arid Regions<0.10.1–0.20.2–0.40.4–0.6
(1.0)
>0.6
(1.0)
HCO3+CO32−, Cl,
Cl-SO42−, SO42−-Cl-
Semi desert and desert area<0.20.2–0.3
(0.4)
0.3–0.5
(0.6)
0.5(0.6)–1.0
(2.0)
1.10
(2.0)
SO42−, Cl-SO42−,
SO42−-Cl
Table 3. The physicochemical properties for S1 and S2 soils in addition to the soil salt content.
SoilsTexturepHOC
(g kg−1)
TN/
(mg kg−1)
TP/
(mg kg−1)
BS/
(%)
CEC
(cmol kg−1)
Clay
(%)
Silt
(%)
Sand
(%)
S133.738.228.18.119.632.80.5561.710.5
S234.140.525.48.798.322.10.8570.310.1
Note: OC: Organic C; TN: Total N; TP: Total P; BS: Base saturation; CEC: cation exchange capacity.
Table 4. The chemical properties of different saline and fertilized soils.
TimeTreatmentsNH4+-N
(mg kg−1)
NO3-N
(mg kg−1)
Inorganic Nitrogen
(mg kg−1)
pH
2015S1CK2.0 ± 0.18 a33.0 ± 1.91 b35.1 ± 1.81 b8.0 ± 0.11 a
S1L4.1 ± 0.26 b82.8 ± 4.20 c86.9 ± 4.46 d8.1 ± 0.09 a
S1H6.6 ± 0.07 c150.5 ± 19.53 d157.2 ± 19.60 e8.2 ± 0.06 a
S2CK4.4 ± 0.96 b19.4 ± 0.98 a23.8 ± 1.94 a8.7 ± 0.07 b
S2L6.6 ± 0.10 c75.0 ± 3.34 c81.6 ± 3.44 d8.8 ± 0.12 b
S2H7.6 ± 0.16 d125.0 ± 12.21 d132.7 ± 12.37 e8.8 ± 0.09 b
2016S1CK7.0 ± 0.13 d16.2 ± 2.85 a23.2 ± 2.98 a8.1 ± 0.14 a
S1L9.5 ± 0.21 e33.3 ± 4.56 b42.7 ± 4.77 b8.2 ± 0.11 a
S1H10.0 ± 0.32 e41.5 ± 0.78 b51.5 ± 1.01 c8.1 ± 0.10 a
S2CK8.0 ± 0.19 d14.1 ± 1.59 a22.2 ± 1.78 a8.7 ± 0.96 b
S2L10.2 ± 0.35 e21.2 ± 0.98 a31.4 ± 1.33 b8.7 ± 0.93 b
S2H14.0 ± 0.39 f30.7 ± 1.32 b44.7 ± 1.71 b8.8 ± 0.81 b
Note: S1, S2: slightly saline soil, and strongly saline soil. S1CK, S2CK: no fertilization of S1 and S2. S1L, S2L low-rate fertilization (175 kg N ha−1) of S1 and S2. S1H, S2H: high-rate fertilization (350 kg N ha−1) of S1 and S2. There was significant difference for different lowercase letters in the same column (p < 0.05). EC: Electrical conductivity; NH4+-N: Ammonium; NO3--N: Nitrate. Values are means ± SD (n = 3).
Table 5. ANOVA for cumulative N2O and CH4 from the interaction with different nitrogen fertilization–saline soil.
FactorsCumulative N2O AmountCumulative CH4 Amount
FpSignificanceFpSignificance
Nitrogen fertilization14.5720.005***2.180.05*
Saline soil5.6100.05*5.5150.05*
Nitrogen fertilization * saline soil2.5080.05*28.1630.001***
Note: * significance level at p < 0.05; *** significance level at p < 0.001.
Disclaimer/Publisher’s Note: The statements, opinions and data contained in all publications are solely those of the individual author(s) and contributor(s) and not of MDPI and/or the editor(s). MDPI and/or the editor(s) disclaim responsibility for any injury to people or property resulting from any ideas, methods, instructions or products referred to in the content.

