Article

Effects of Different Altitudes on Coffea arabica Rhizospheric Soil Chemical Properties and Soil Microbiota

1
College of Tropical Crops, Yunnan Agricultural University, Pu’er 665099, China
2
College of Agronomy and Biotechnology, Yunnan Agricultural University, Kunming 650201, China
*
Author to whom correspondence should be addressed.
Agronomy 2023, 13(2), 471; https://doi.org/10.3390/agronomy13020471
Submission received: 9 January 2023 / Revised: 2 February 2023 / Accepted: 3 February 2023 / Published: 5 February 2023
(This article belongs to the Special Issue Coffee—from Plant to Cup)

Abstract

:
Coffee is one of the most valuable agricultural commodities worldwide, second only to oil in terms of international trade. Coffea arabica L. is a widely cultivated and economically important crop that is responsible for about 90% of the global production of coffee. In this study, we selected five C. arabica cultivation sites at different altitudes to clarify the effects of altitude on rhizospheric soil physical–chemical characteristics and microbial communities. The samples collected at low altitudes were more nutrient-deficient and acidic than the soil samples collected at medium–high altitudes. The Proteobacteria-to-Acidobacteria ratio increased from lower altitudes to medium–high altitudes. Additionally, although Ascomycota was the dominant fungal phylum, it was unaffected by the altitude. Furthermore, the alpha richness and diversity of the bacterial and fungal communities were higher at medium–high altitudes than at low altitudes. Moreover, the redundancy analysis indicated that microbial phyla were closely associated with pH. These findings suggest that C. arabica should be cultivated at medium–high altitudes, which is conducive to sustainable management and the production of high-quality C. arabica beans.

1. Introduction

Coffee, which is an evergreen tree species belonging to the genus Coffea in the family Rubiaceae, is native to north-central Africa, yet is now cultivated in 76 countries and regions worldwide to produce one of the three most consumed beverages [1]. Coffea arabica is the main cultivated coffee species, accounting for about 80% of the total coffee-producing area [2]. Coffee-growing provinces in China include Yunnan, Hainan, Guangdong, Guangxi, and Sichuan, of which Yunnan is the primary producer and exporter (i.e., its planting area and output represent 99% of the total area and output) [3]. The large-scale cultivation of coffee in Yunnan province occurs in subtropical hilly areas (600–1200 m elevation) with temperatures of 19–22 °C and soils with a medium texture and a relatively high-water holding capacity [3]. Four cities (Pu’er, Baoshan, Dehong, and Lincang) account for more than 80% of the coffee-growing area in Yunnan province [3].
Genetic factors, environmental conditions, and their interactive effects on coffee plants greatly influence the quality and intrinsic characteristics of coffee beans [4]. Specifically, altitude has an important effect on the quality of C. arabica beans, and its influence on flavor is greater than that of genetic factors [1,5,6,7,8]. For example, cultivating coffee plants at high altitudes frequently results in the production of coffee with increased acidity and more desirable aroma characteristics [9,10], while also affecting the coffee bean size as well as the caffeine, trigonelline, acid, and fat contents [11]. Most cultivated C. arabica plants are distributed in the tropical plateau or mountainous regions at high altitudes [12]. The temperatures near the equator are high, although C. arabica plants can be grown at an altitude of about 2000 m (above sea level) [12]. The areas suitable for C. arabica cultivation in Yunnan province are characterized by high latitudes and cool conditions [13]. The cultivation of C. arabica is most productive at altitudes between 600 and 1200 m [14], however, this upper limit has recently increased to approximately 1400 m. Thus, nearly 670 ha of C. arabica plants have been cultivated at 1200–1400 m, leading to the rapid development of C. arabica seed production in Yunnan province [15].
The rhizosphere refers to the zone of influence of the roots [16]. Rhizosphere microorganisms provide a vital link between plants and soil environments [17]. They affect coffee ecosystems via their contributions to decomposition and nutrient cycling, which in turn significantly influences the microbial conversion of complex organic compounds into simple inorganic compounds [18,19], thereby increasing productivity [18,20,21]. The effect of altitude on rhizosphere microbial diversity has been extensively documented. Some studies revealed that rhizosphere microbial diversity is not significantly affected by changes in elevation, whereas other studies indicated that the diversity of rhizosphere microbiota is modulated by altitude [14,22,23,24]. Pandey et al. [17] reported that the microbial community diversity apparently decreases as the altitude increases. However, changes in the C. arabica rhizosphere microbiota depend on multiple factors, including several environmental factors (e.g., altitude), but the precise effects of altitude on microorganisms have not been comprehensively determined [25].
Second-generation sequencing platforms are gradually applied to resolve soil microbial communities in different altitudes. Prior research involving second-generation sequencing technology indicated that altitudinal variations could alter the rhizosphere soil bacteria [4,12,17,25,26,27,28]. Similarly, Illumina HiSeq-based analyses confirmed that the rhizosphere soil fungi are significantly modified with the variations of altitude [4,12,17,25,26,27,28].
Thus, clarifying the effects of different altitudes on C. arabica rhizospheric soil physical–chemical characteristics and soil microbiota is critical for optimizing the cultivation of high-quality C. arabica plants. In this study, the diversity and composition of the C. arabica rhizospheric microorganism at different altitudes were examined. The NovaSeq PE250 platform was applied to examine the 16S rRNA and internal transcribed spacer (ITS) to characterize the diversity of microbial communities. Furthermore, the physicochemical properties of rhizospheric soil were also determined. This research provided basic knowledge regarding the influences of different altitudes on C. arabica rhizospheric soil chemical properties and soil microbiota. The study findings may serve as the theoretical basis for improving the sustainable management and production of high-quality C. arabica plants and beans.

2. Materials and Methods

2.1. Rhizosphere Soil Samples Collection

Rhizospheric soil samples were collected on 8 January 2022 at sites where C. arabica had been cultivated for 8 years. The sample sites at different altitudes (680, 930, 1030, 1210, and 1320 m) were located in Simao district, Pu’er city in Yunnan province (latitude 22°34′45″ N, longitude 101°52′52″ E). For coffee cultivation, altitudes above 1200 m are generally classified as high altitudes, whereas altitudes below 1000 m are generally classified as low altitudes. Altitudes between 1000 and 1200 m are considered to be medium altitudes. Therefore, this study involved two treatments at low altitudes (680 and 930 m), one treatment at a medium altitude (1030 m), and two treatments at high altitudes (1210 and 1320 m). The five study regions comprised mostly sandy and clay soil. All five study regions are located in a subtropical humid monsoon climatic zone with temperatures ranging from 15 °C to 20.3 °C and precipitation varying from 1100 mm to 2780 mm. Besides, all five study regions were shady slopes and unmanaged wastelands before coffee cultivation. The coffee cultivation was managed under full sun exposure. The organic and compound fertilizer application rates were 1000 and 5000 kg per hectare, respectively, in all five study sites. The N, P, and K contents accounted for 15% of the compound fertilizer content. Three biological replicates of composite rhizospheric soil samples were obtained from the roots of 15 randomly selected C. arabica plants at each altitude. Since soil humidity/rainfall, likely, greatly affects the change of fungal community (and there are changes of that among the considered altitudes with rainfall amounts between 680 and 1320 m), we chose to collect experimental samples in the dry season. Three sampling points were randomly selected at 50 cm from the base of the trunk of each C. arabica plant. The samples were mixed for the subsequent analysis. A soil drill with an inner diameter of 10 cm was used to collect samples from the 0–30 cm soil layer. Fine roots with a straight diameter of 0.1–0.5 cm were also collected. The rhizospheric soil samples were obtained by shaking the roots, and then, the sifted soil particles (1 mm diameter) through a 1 mm sieve were saved. All rhizospheric soils were put into sterile centrifuge tubes and refrigerated in the lab. Each rhizospheric soil was homogenized, and then 10 g rhizospheric soils were transferred to tubes and preserved at −80 °C for microbial sequencing analysis. The remaining rhizospheric soils were used for the analyses of the physical–chemical characteristics.

2.2. Measurement of Rhizospheric Soil Physical-Chemical Characteristics

The rhizospheric soil physical–chemical characteristics were examined as described by Bao et al. [29]. The water and soil samples were mixed at a ratio of 2.5:1. All mixed samples were shaken at 200 rpm for 10 min through the shaker and then rested for 30 min. The rhizospheric soil pH was measured using the pH meter. The electrical conductivity of the soil was measured using the conductivity meter. The organic matter was examined according to the K2Cr2O7 oxidation process. The organic carbon content was determined based on a K2Cr2O7 external heating H2SO4 process. The total nitrogen was examined using the Kjeldahl digestion process, whereas the total phosphorus was examined using the NaOH–Mo-Sb anti-colorimetric method. The total potassium was measured using an HF digestion and flame photometric method. The available nitrogen was examined according to the alkali hydrolyzed diffusion process. Nitrate nitrogen was detected using a phenol disulfonic acid colorimetric method, while ammonium nitrogen was detected on the basis of digestion and indophenol blue colorimetry. The available phosphorus was examined using an HCL–H2SO4 extraction colorimetric process, while the available potassium was examined via a CH3COONH4 extraction and flame photometric method.

2.3. DNA Extraction and MiSeq Sequencing

DNA was obtained from 0.5 g rhizospheric soils (dry weight) by soil DNA Kit (Omega Bio-Tek, Norcross, GA, USA). The V4–V5 regions of the bacterial 16S rRNA genes were sequenced through PCR using primers 515F (5′-GTGCCAGCMGCCGCGGTAA-3′) and 907R (5′-CCGTCAATTCCTTTGAGTTT-3′) [30]. The ITS2 regions of the fungal rRNA genes were sequenced through PCR using primers ITS3_KYO2 (5′-GATGAAGAACGYAGYRAA-3′) and ITS4 (5′-TCCTCCGCTTATTGATATGC-3′) [31]. The 5′ end of each primer was tagged with sample-specific barcodes and universal sequences. The PCR sequences were quantitatively examined by the QuantiFluor™-ST Quantification system (Promega, Madison, WI, USA) as well as by 2% agarose gel electrophoresis. The amplicon pools were prepared for sequencing and the size and quantity of the amplicon libraries were assessed using the 2100 Bioanalyzer (Agilent, USA) and the Library Quantification Kit for Illumina (Kapa Biosciences, Woburn, MA, USA), respectively. The libraries were sequenced on the NovaSeq PE250 platform (Kapa Biosciences, Woburn, MA, USA).

2.4. Bioinformatic Analyses

The libraries were analyzed using the Illumina NovaSeq platform, based on the manufacturer’s recommendations. The reads were divided into libraries based on the unique barcode and truncated by deleting the barcode and primer sequences. The reads were integrated by FLASH v.1.2.8 (http://ccb.jhu.edu/software/FLASH/ (accessed on 8 January 2023)). The high-quality clean reads were obtained by filtering raw reads using fqtrim v.0.94 (http://ccb.jhu.edu/software/fqtrim/ (accessed on 8 January 2023)). Chimeric sequences were filtered by the Vsearch software v.2.3.4 (https://github.com/torognes/vsearch (accessed on 8 January 2023)). After the dereplication step, performed by DADA2 (https://qiime2.org/ (accessed on 8 January 2023)), the feature tables, and sequences were obtained. Using the SILVA (release 138; https://www.arbsilva.de/documentation/release138/ (accessed on 8 January 2023)), feature abundances were normalized by the relative abundances of each sample. Alpha and beta diversity indices were calculated by QIIME2 [32], with graphs drawn by the R package. The BLAST online tool was applied to align sequences. The features of representative sequences were annotated using the SILVA database.

2.5. Statistical Analyses

Statistical analyses were conducted by SPSS 18.0 software and the R vegan package. Alpha diversity was primarily applied to reflect the evenness and richness as well as the sequencing depth of the microbes. It was presented through the Observed_OTUs, Chao1, ace, Shannon, Simpson, and Goods_coverage indices, which reflect richness and uniformity. Specifically, Observed_OTUs indicates the type of operational taxonomic unit (OTU) that can be detected in bacteria and fungi. Chao1 and ace are applied to analyze the richness of the microbes. The Shannon and Simpson indices represent diversity, whereas, Goods_coverage refers to microbial coverage. In contrast, beta diversity was applied to reflect the microbial differences among populations. Briefly, beta diversity was presented through a principal coordinate analysis (PCoA) and nonmetric multidimensional scaling (NMDS).

3. Results

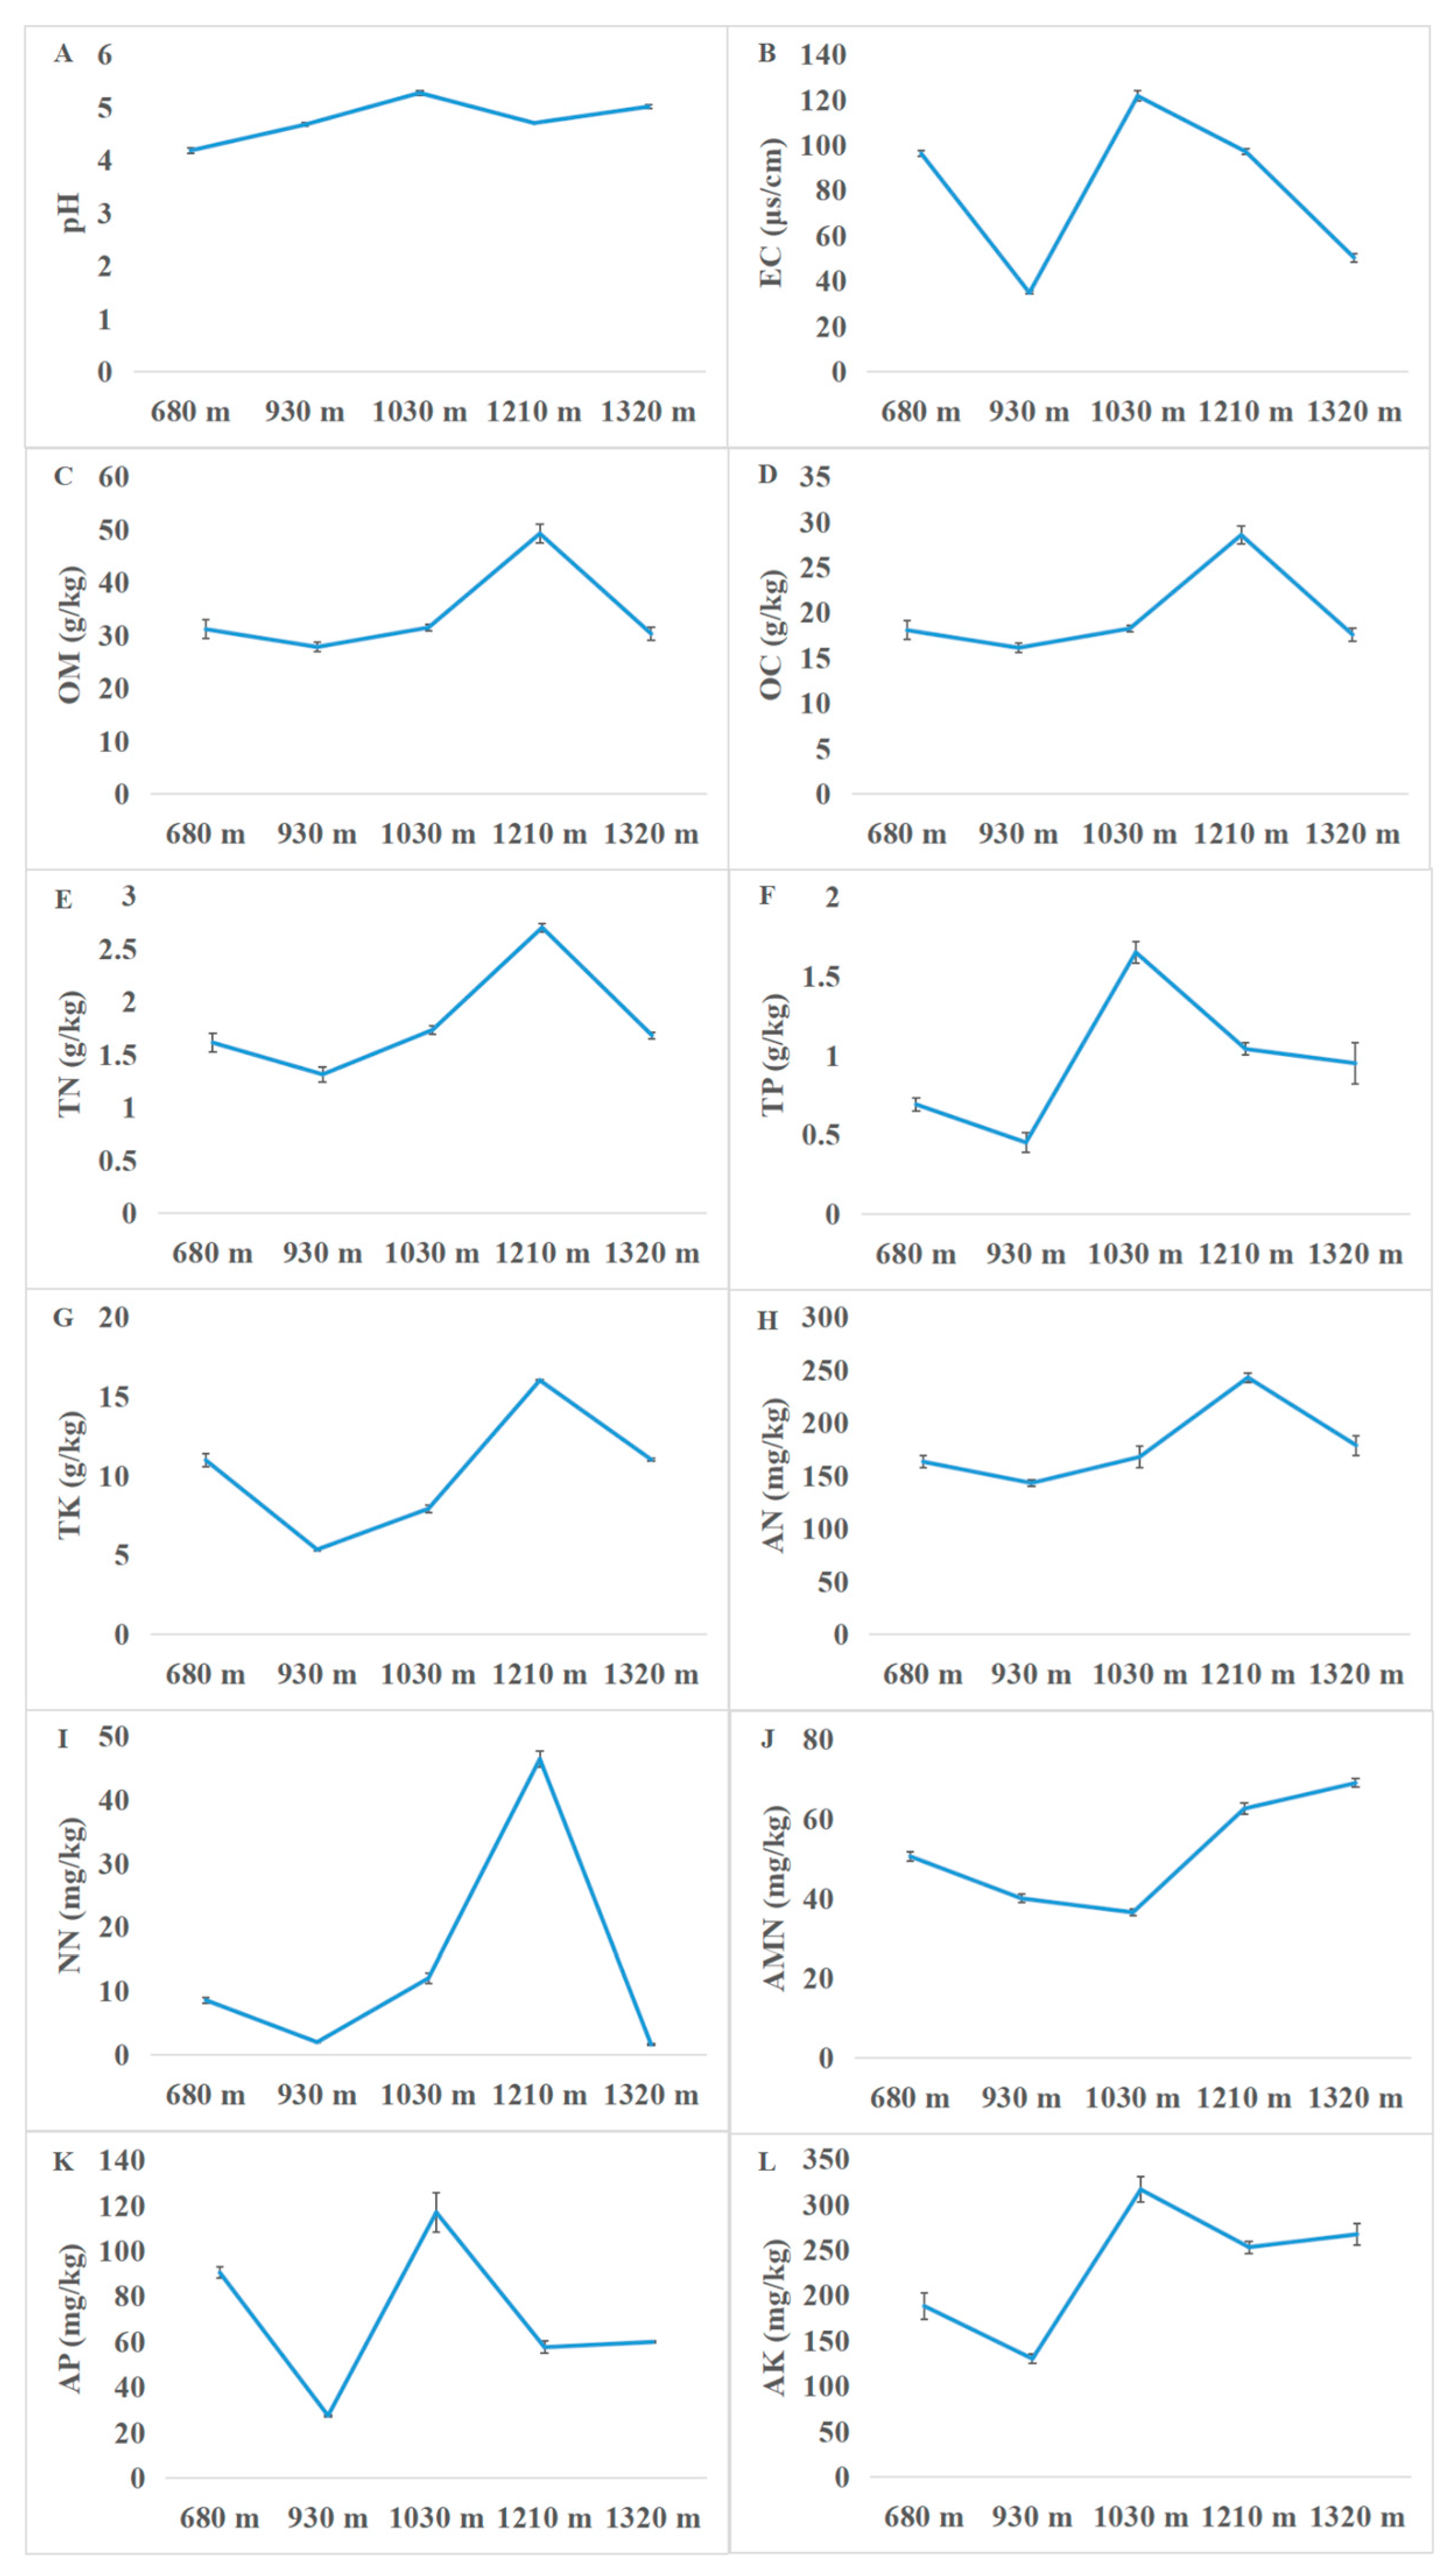
3.1. Soil Physicochemical Properties

The differences in the soil pH among altitudes are presented in Figure 1A. The pH initially increased as the altitude increased, peaking (5.27) at 1030 m, although it decreased from 1030 to 1210 m, then, increased slightly at 1320 m. The electrical conductivity and total phosphorus content decreased considerably from 680 to 930 m before increasing sharply, reaching 121.60 μs/cm and 1.65 g/kg, respectively, at 1030 m (Figure 1B,F). From 1030 to 1320 m, the electrical conductivity and total phosphorus content decreased significantly (Figure 1B,F). Similar trends in the changes to the organic matter, organic carbon, total nitrogen, total potassium, nitrate nitrogen, and available nitrogen contents were observed as the altitude increased (Figure 1C–E,G–I). These six soil physicochemical properties tended to decrease from 680 to 930 m, yet then increased, peaking at 1210 m. From 1210 to 1320 m, these six soil physicochemical properties decreased substantially. The ammonium nitrogen content decreased slightly during the low-to-medium altitude change and then increased during the medium-to-high altitude change. The available phosphorus and available potassium contents fluctuated as the altitude increased, however, were the highest at 1030 m (Figure 1K,L).

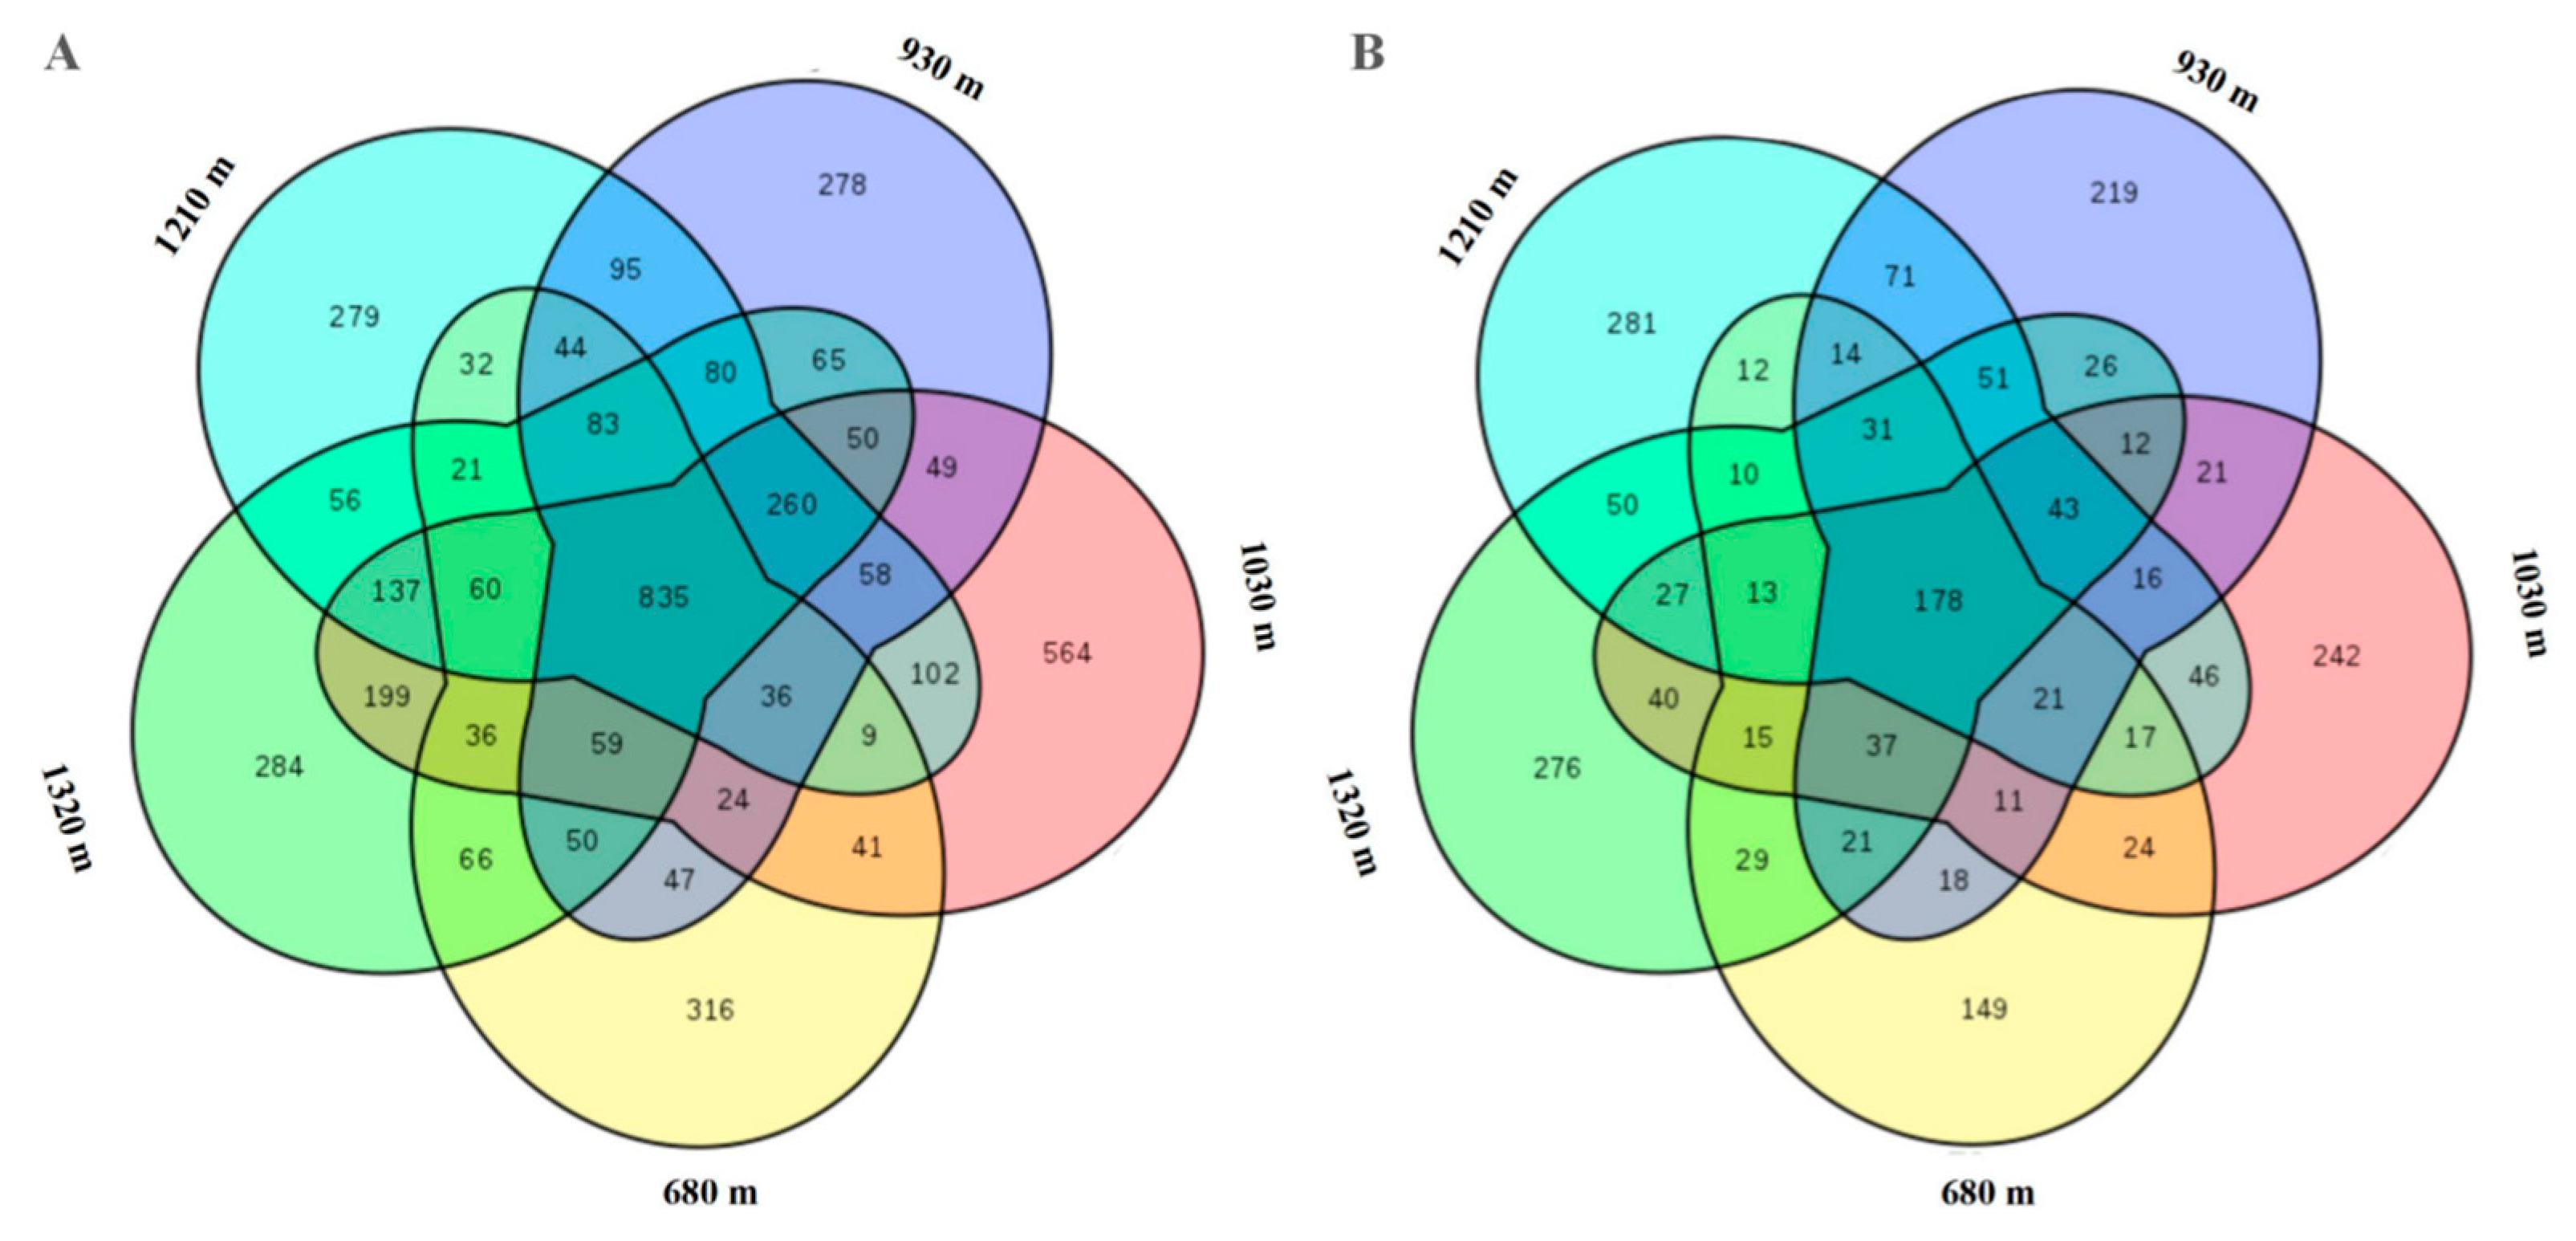
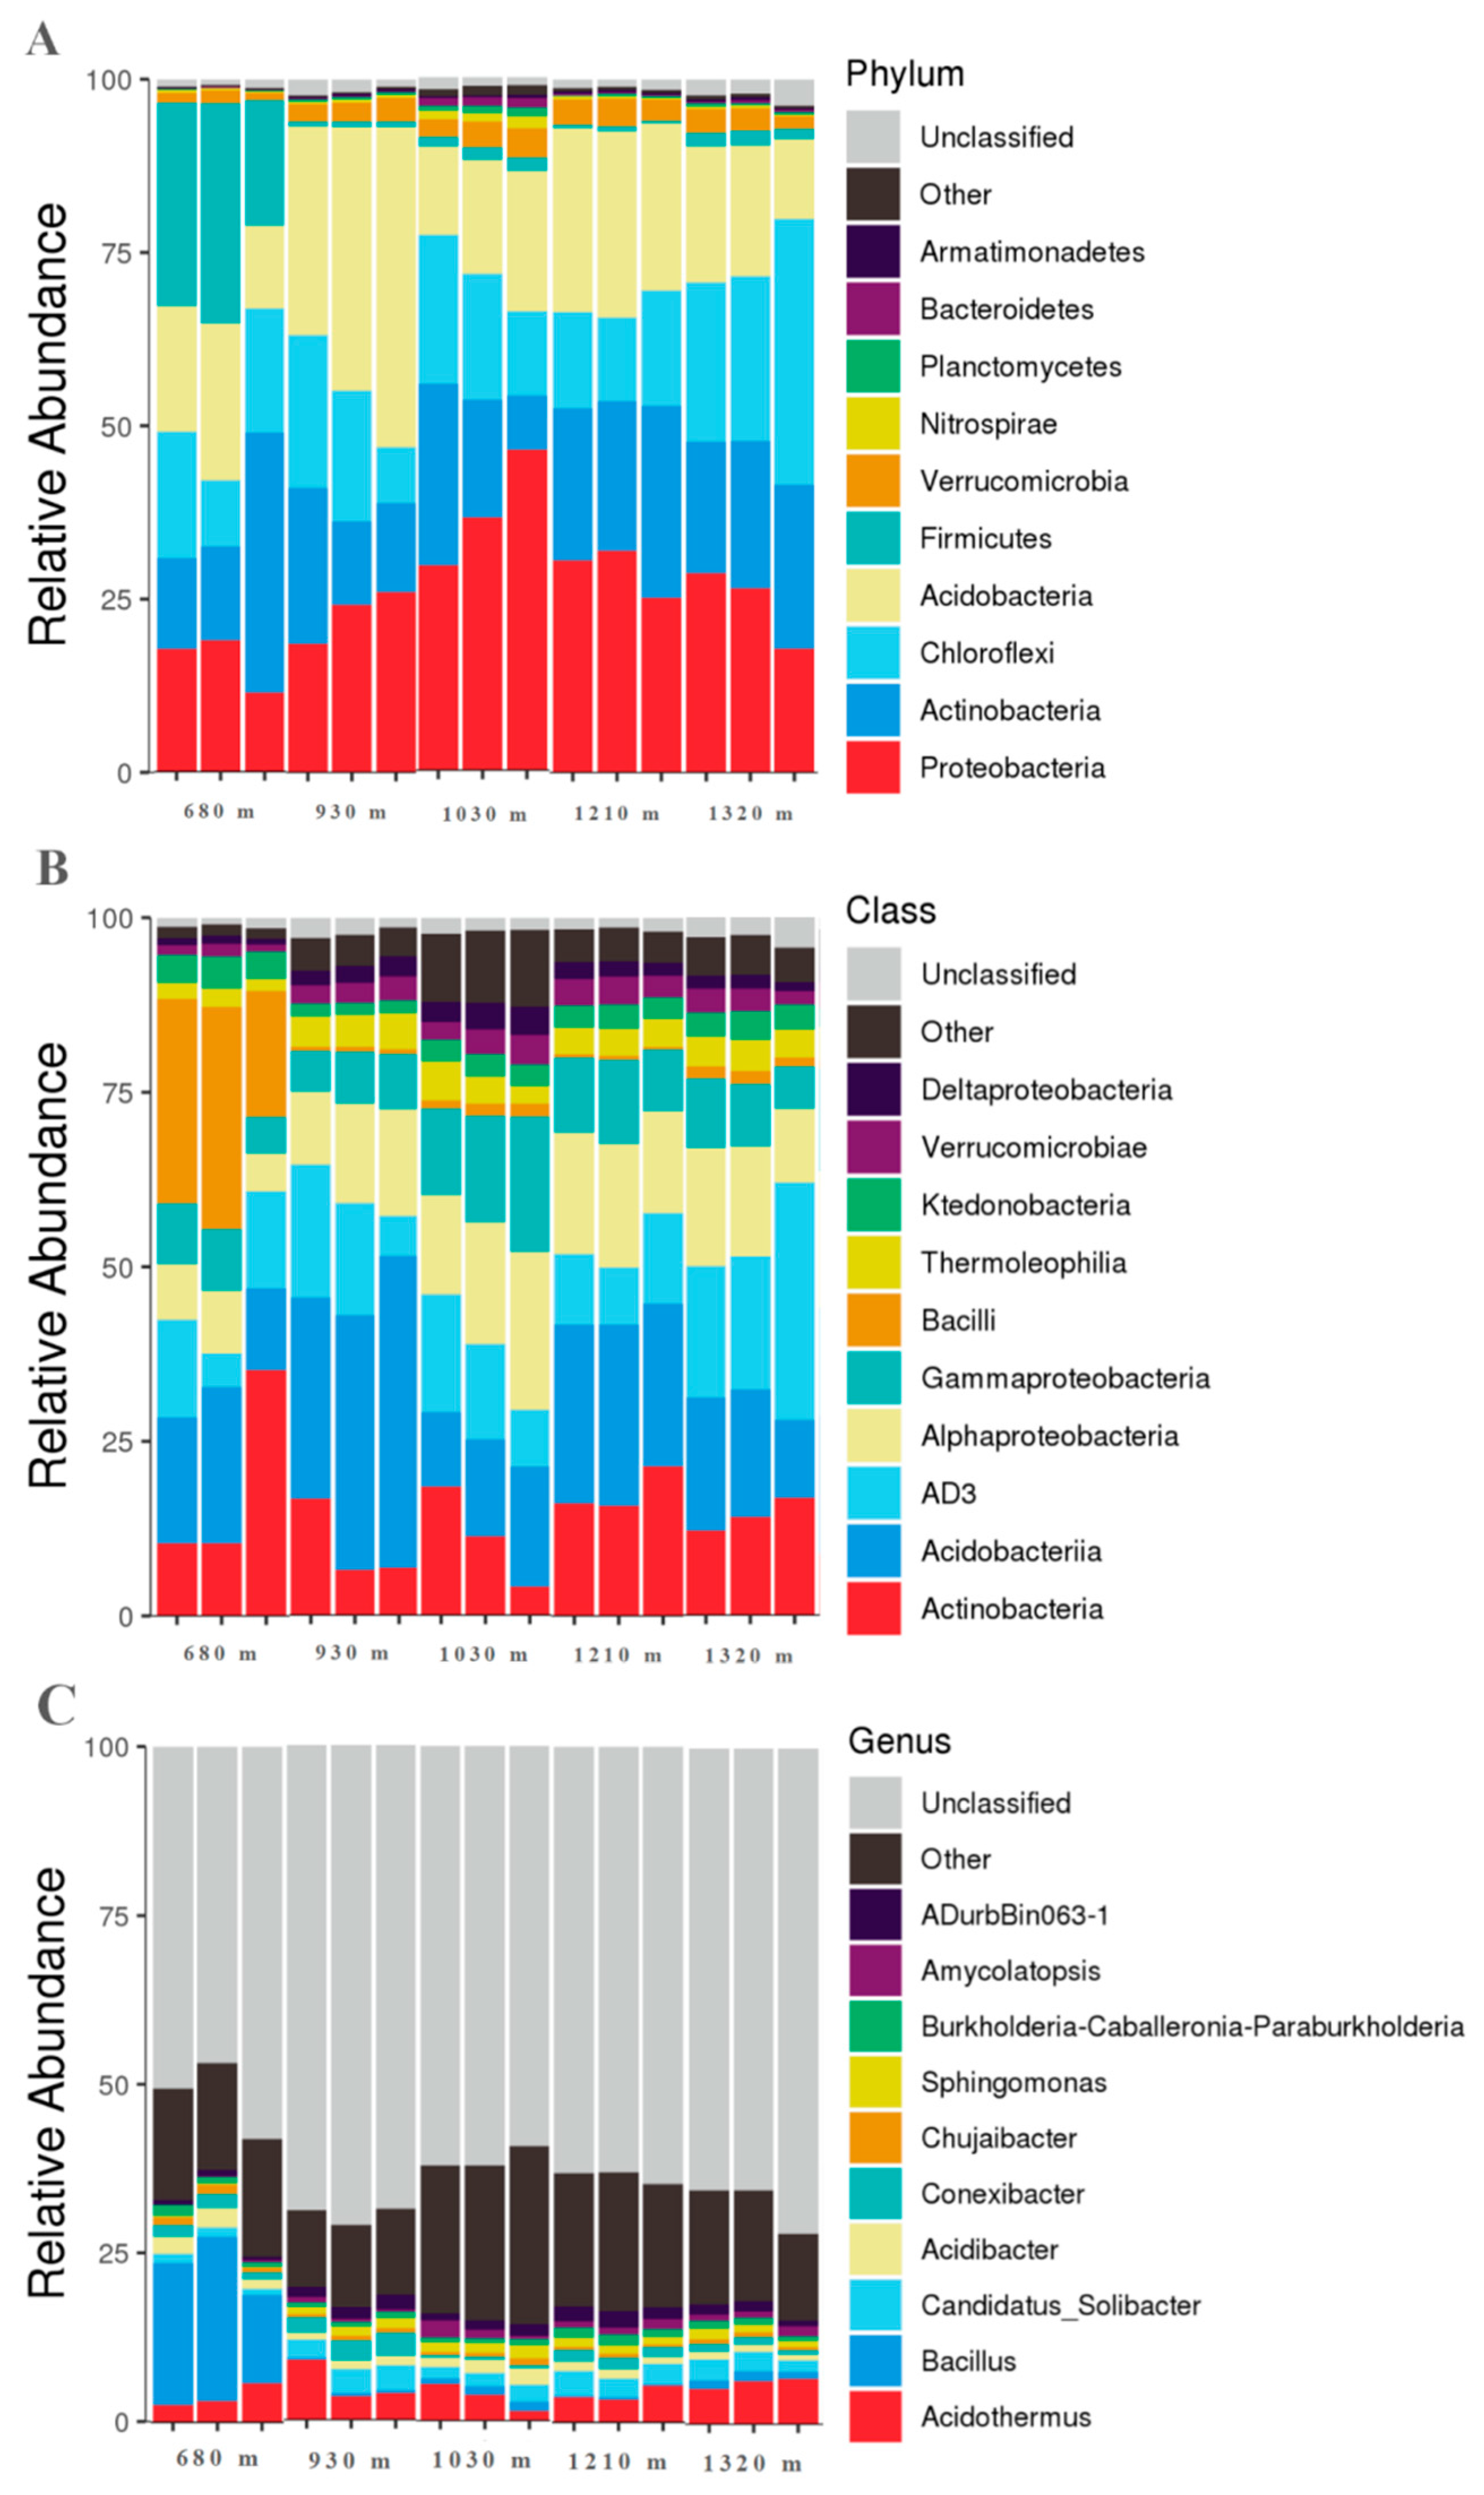
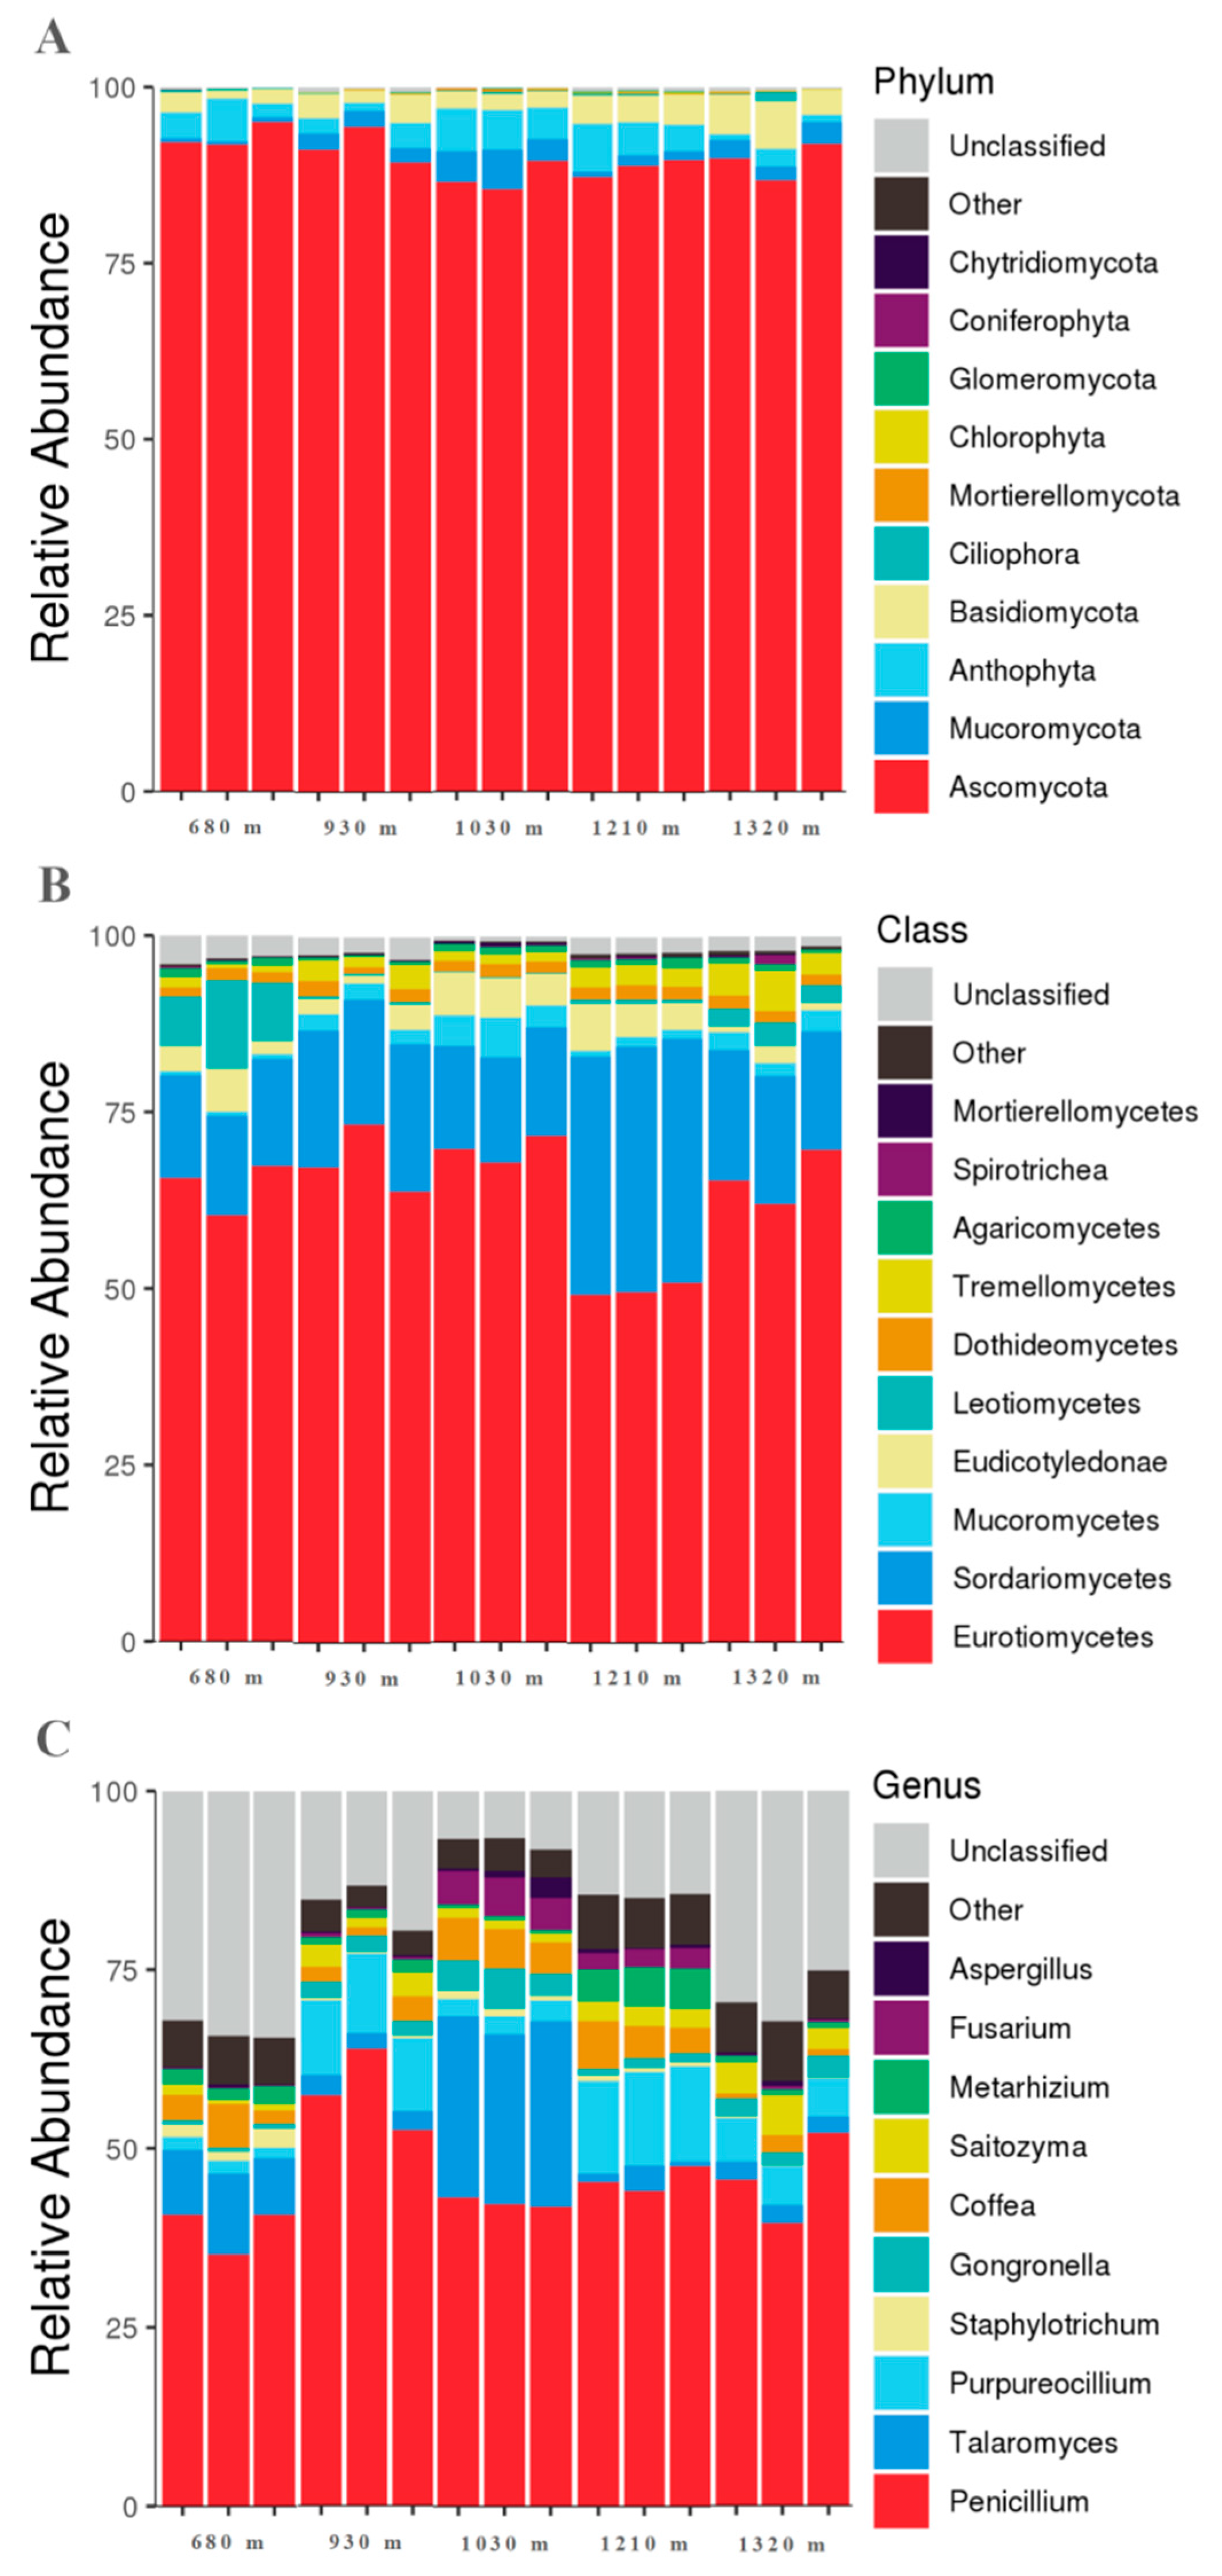
3.2. Microbial Community Characteristics

The 4315 bacterial OTUs (97% similarity) were founded, with 1998, 2380, 2700, 2494, and 2473 bacterial OTUs obtained at altitudes of 680, 930, 1030, 1210, and 1320 m, respectively. In addition, 835 bacterial OTUs were shared among the five altitudes, accounting for 19.35% of the total number of bacterial OTUs. Accordingly, the bacterial groups in the five fields differed substantially (Figure 2A). A total of 2021 fungal OTUs (97% similarity) were obtained, with 632, 770, 725, 799, and 797 fungal OTUs obtained at altitudes of 680, 930, 1030, 1210, and 1320 m, respectively. Moreover, 178 of the fungal OTUs were common to all five altitudes, accounting for 8.81% of the total number of fungal OTUs. Hence, there were considerable differences in the fungal groups in the five fields (Figure 2B).
To further analyze the bacterial communities in the five rhizospheric soil samples, the V4–V5 regions of 16S RNA genes were estimated. The 1 domain, 25 phyla, 67 classes, 133 orders, 221 families, 403 genera, and 758 species were detected in 15 soil samples.
At the bacterial phylum level (Figure 3A), the top three phyla in all samples were Proteobacteria (26%), Actinobacteriota (22.92%), and Acidobacteria (19.84%). An analysis of the changes in these phyla as the altitude increased revealed that the relative abundance of Proteobacteria increased gradually, peaking at 1030 m, and then decreased gradually. The relative abundance of Actinobacteriota rapidly decreased from 680 to 930 m and then increased substantially, reaching its maximum level at 1210 m. From 1210 to 1320 m, the relative abundance of Actinobacteriota decreased considerably. The relative abundance of Acidobacteria fluctuated as the altitude increased. The relative abundances (0.1% > for greater than) of the bacteria at the phylum level were listed in Table S1.
At the bacterial class level (Figure 3B), the top three classes in all samples were Acidobacteriia (21.83%), Actinobacteria (14.39%), and AD3 (14.38%). The relative abundance of Acidobacteriia fluctuated as the altitude increased. The relative abundance of Actinobacteria decreased from 680 to 930 m and then increased, peaking at 1210 m. From 1210 to 1320 m, the relative abundance of Actinobacteria decreased substantially. The relative abundance of AD3 initially increased slightly from 680 to 930 m, yet subsequently decreased as the altitude increased to 1210 m, before again increasing, reaching its maximum level at 1320 m. The relative abundances (0.1% > for greater than) of the bacteria at the class level were listed in Table S2.
At the bacterial genus level (Figure 3C), Acidothermus (4.61%), Bacillus (4.53%), and Candidatus_Solibacter (2.45%) were the top three genera in all rhizospheric soil samples. The relative abundance of Acidothermus from 680 to 1030 m increased at first and then decreased, after which it increased, reaching its maximum level at 1320 m. As the altitude increased, the relative abundances of Bacillus and Candidatus_Solibacter fluctuated. The relative abundances (0.1% > for greater than) of the bacteria at the genus level were listed in Table S3.
For a more precise analysis of the fungal OTUs, the ITS2 regions of fungal rRNA genes in 15 soil samples were estimated. The 5 domains, 17 phyla, 46 classes, 134 orders, 258 families, 450 genera, and 468 species were identified.
At the phylum level, Ascomycota was the most dominant phylum in the fungal community, accounting for 89.50% of all fungal phyla (Figure 4A). The alterations in the relative abundance of Ascomycota produced a valley curve. More specifically, the relative abundance of Ascomycota decreased slowly during the low-to-medium altitude change, reaching its lowest level at 1030 m, and then increased gradually during the medium-to-high altitude change. The relative abundances (0.1% > for greater than) of the fungi at the phylum level were listed in Table S4.
The dominant fungal classes were Eurotiomycetes (63.63%) and Sordariomycetes (20.23%) (Figure 4B). The relative abundance of Eurotiomycetes initially increased, peaking at 1030 m, but then decreased at 1210 m and increased slightly at 1320 m. As the altitude increased, the relative abundance of Sordariomycetes fluctuated. The relative abundances (0.1% > for greater than) of the fungi at the class level were listed in Table S5.
The dominant fungal genera in the rhizospheric soil samples collected at different altitudes were Penicillium (46.08%), Talaromyces (8.27%), and Purpureocillium (6.73%) (Figure 4C). The relative abundance of Penicillium fluctuated as the altitude rose. The variations in the relative abundance of Talaromyces were visualized as a U-shaped curve. The relative abundance of Purpureocillium decreased slightly from 680 to 930 m and then increased, reaching its maximum level at 1210 m, before decreasing slightly at 1320 m. The relative abundances (0.1% > for greater than) of the fungi at the genus level were listed in Table S6.

3.3. Microbial Diversity

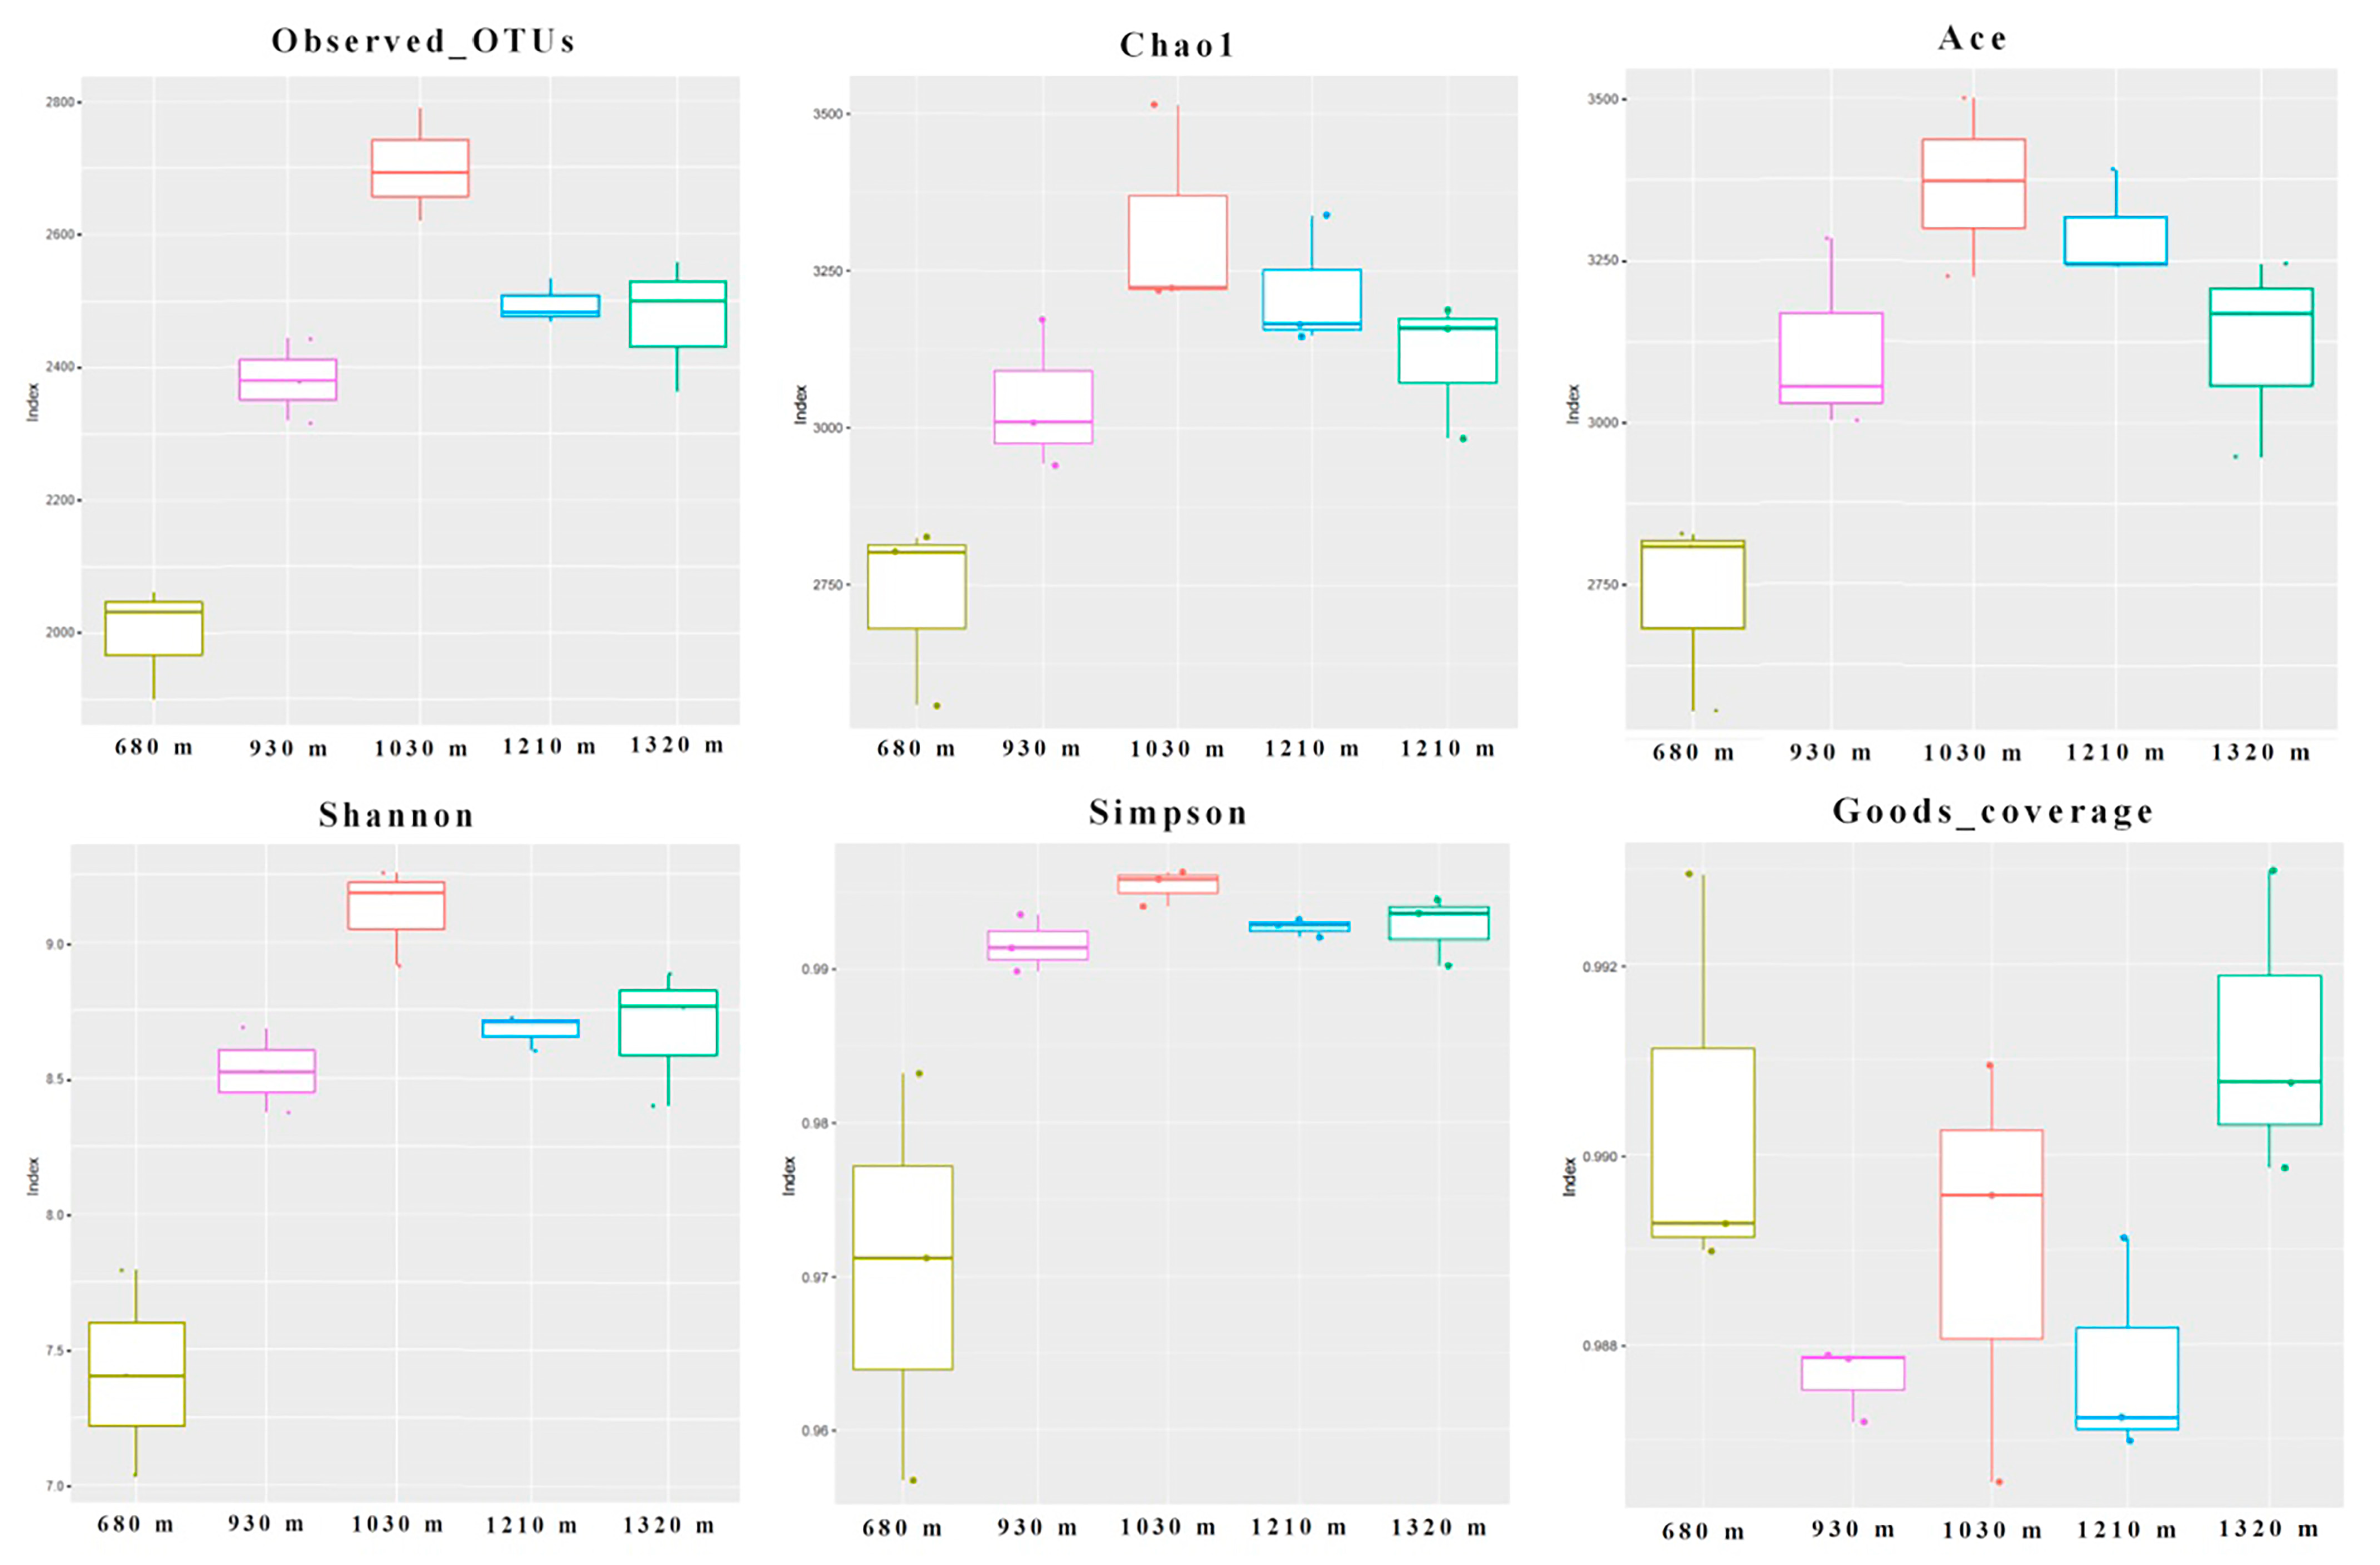
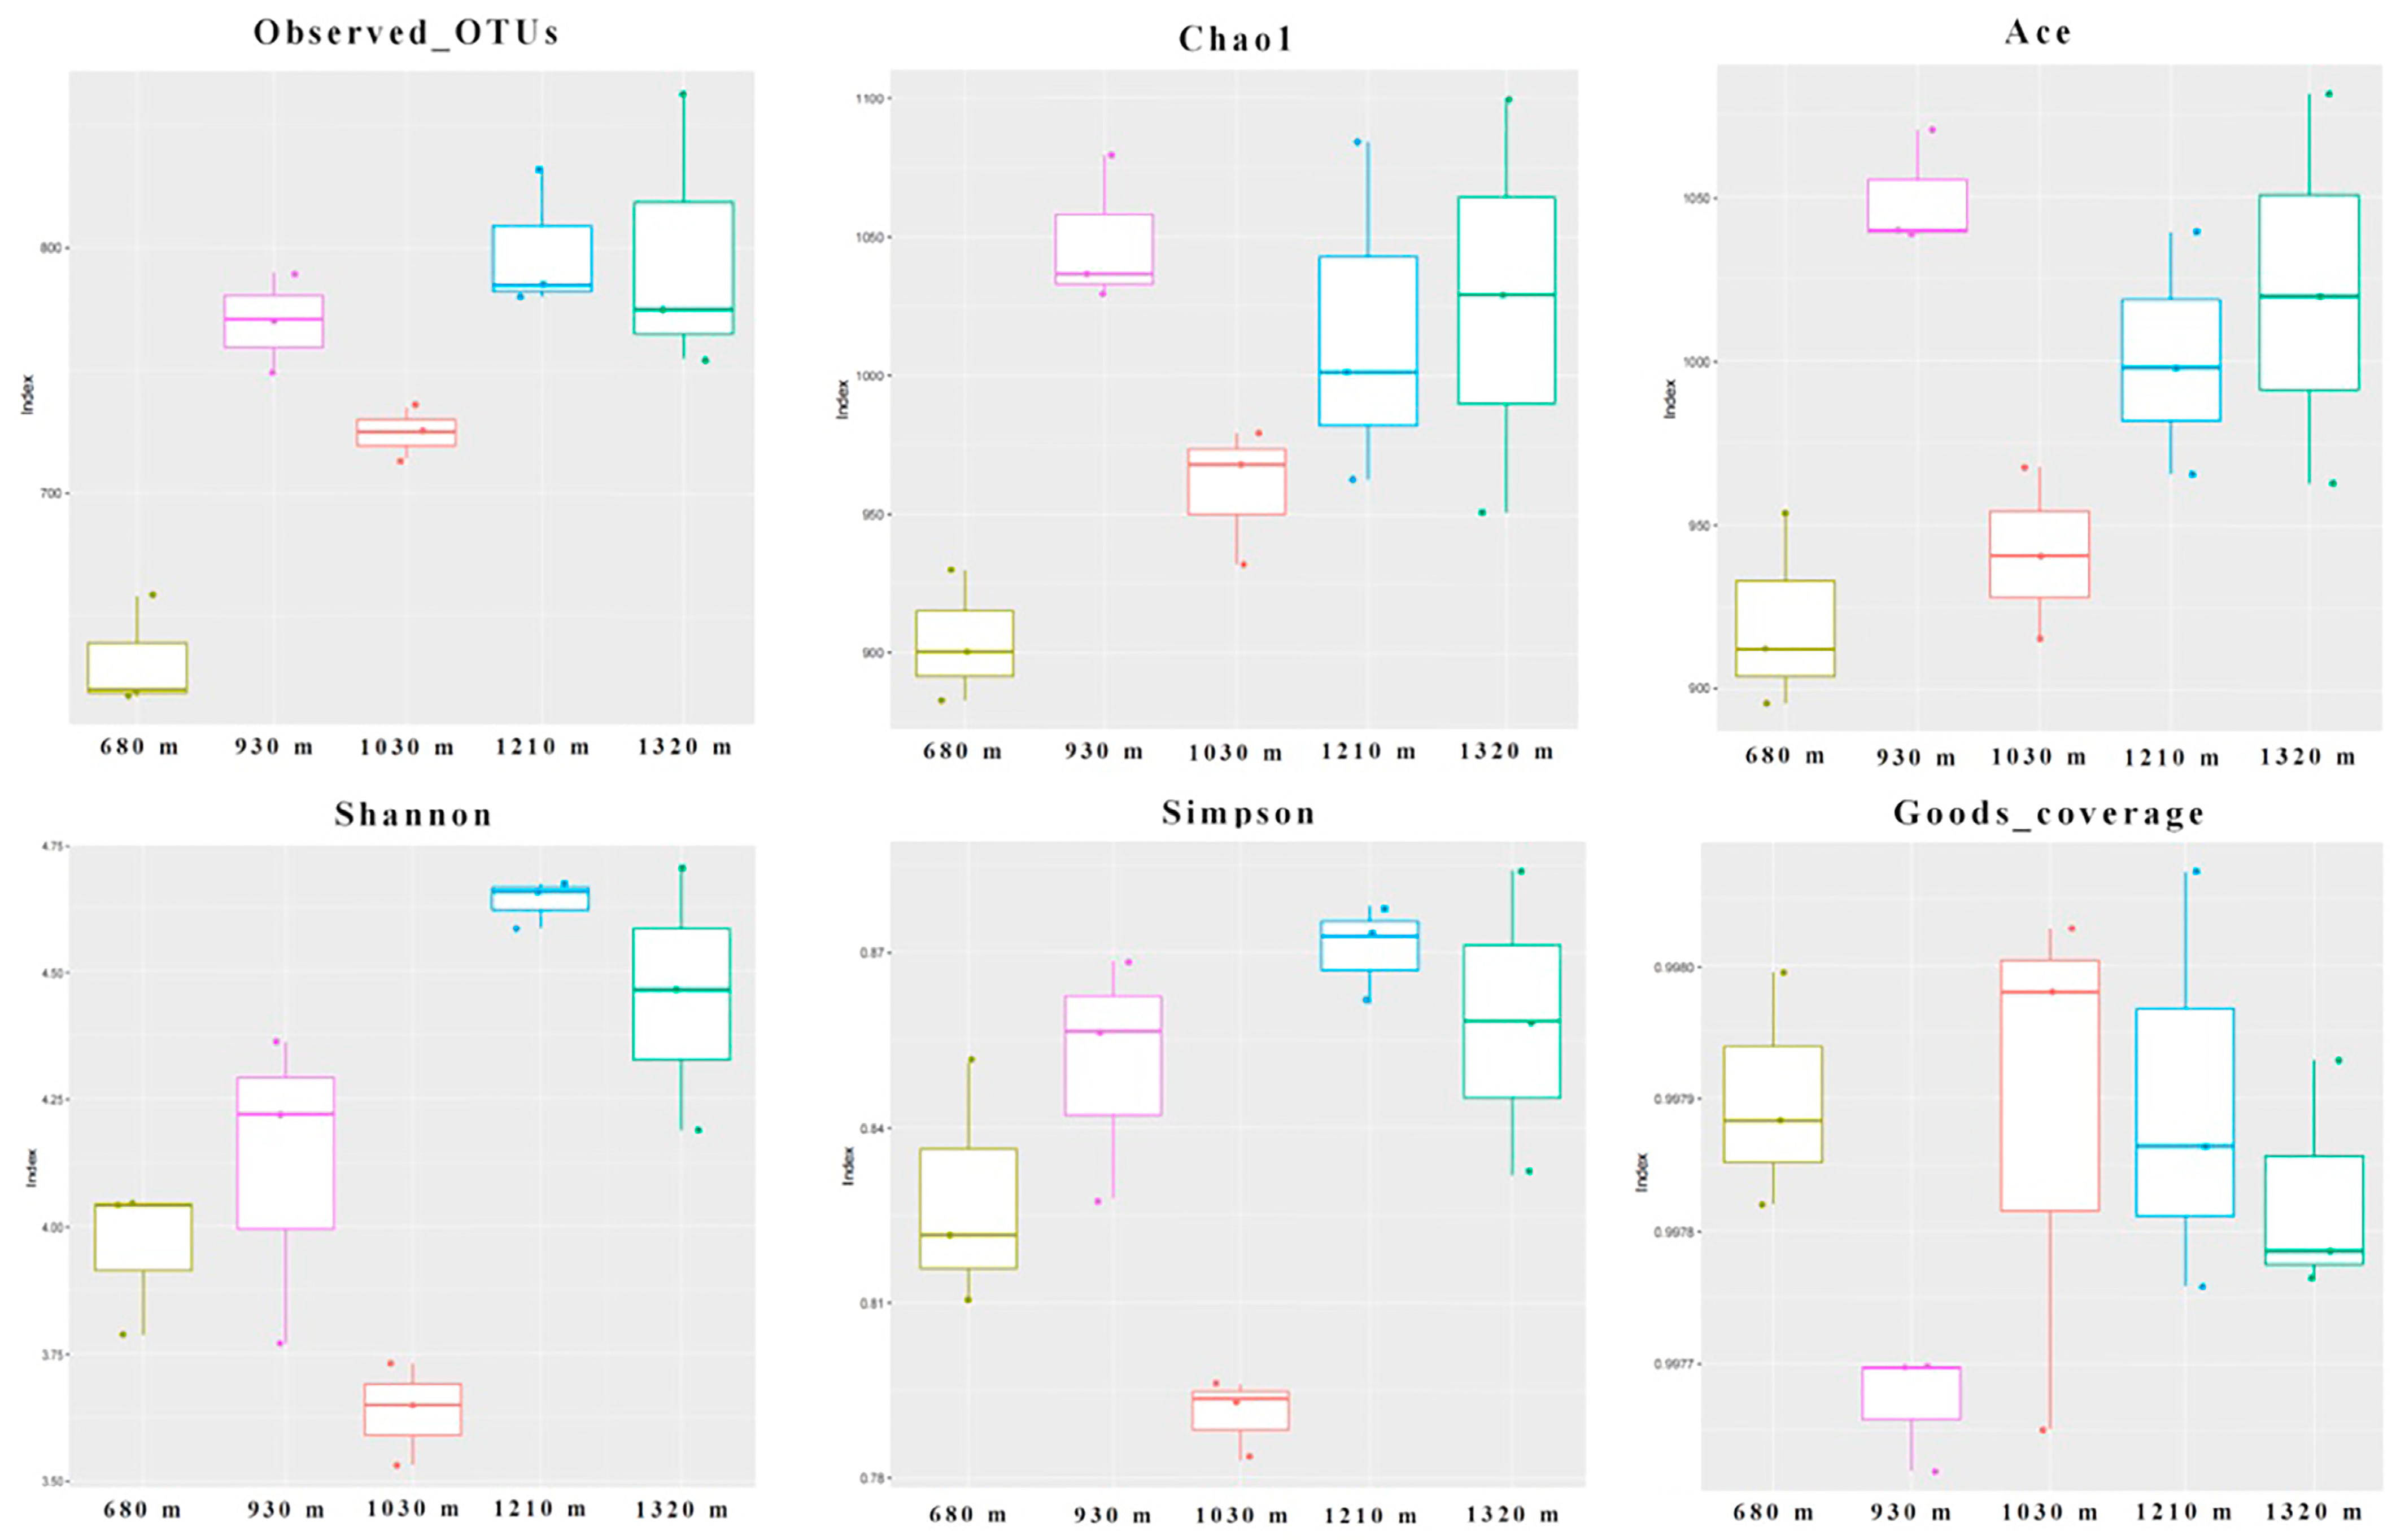
3.3.1. Alpha Diversity Indices of the Microbial Communities

Alpha diversity indices (i.e., Observed_OTUs, Chao1, ace, Shannon, Simpson, and Goods_coverage) were used to reveal the diversity of the bacterial communities in the rhizospheric soil samples (Figure 5). Similar trends were detected in the changes in Observed_OTUs and the diversity indices (Shannon and Simpson) of the bacterial communities as the altitude increased. All three indices initially increased, peaking at 1030 m. They subsequently decreased somewhat from 1030 to 1210 m and increased slightly as the altitude increased to 1320 m. The richness indices (Chao1 and ace) of the bacterial communities increased at first, reaching their maximum levels at 1030 m, and then decreased as the altitude increased to 1320 m. The bacterial coverage rate (Goods_coverage) fluctuated as the altitude increased. The data suggest that the results accurately represented the real situations in each sample. Additionally, the probability that a new bacterial species was not detected in the samples was statistically 0.
Alpha diversity indices (i.e., Observed_OTUs, Chao1, ace, Shannon, Simpson, and Goods_coverage) were also used to reveal the diversity in the fungal communities among the rhizospheric soil samples (Figure 6). As the altitude increased, Observed_OTUs and the diversity indices (Shannon and Simpson) of the fungal communities fluctuated, while the values were highest at 1030 m. Similar to the observed changes in the bacterial communities, the richness indices (Chao1 and ace) of the fungal communities increased at first, reaching maximum levels at 930 m, but then decreased as the altitude increased to 1210 m and finally increased at 1320 m. The fungal coverage rate showed that the data correctly represented the real situations in each sample. Moreover, the probability that a new fungal species was not detected in the samples was statistically 0.

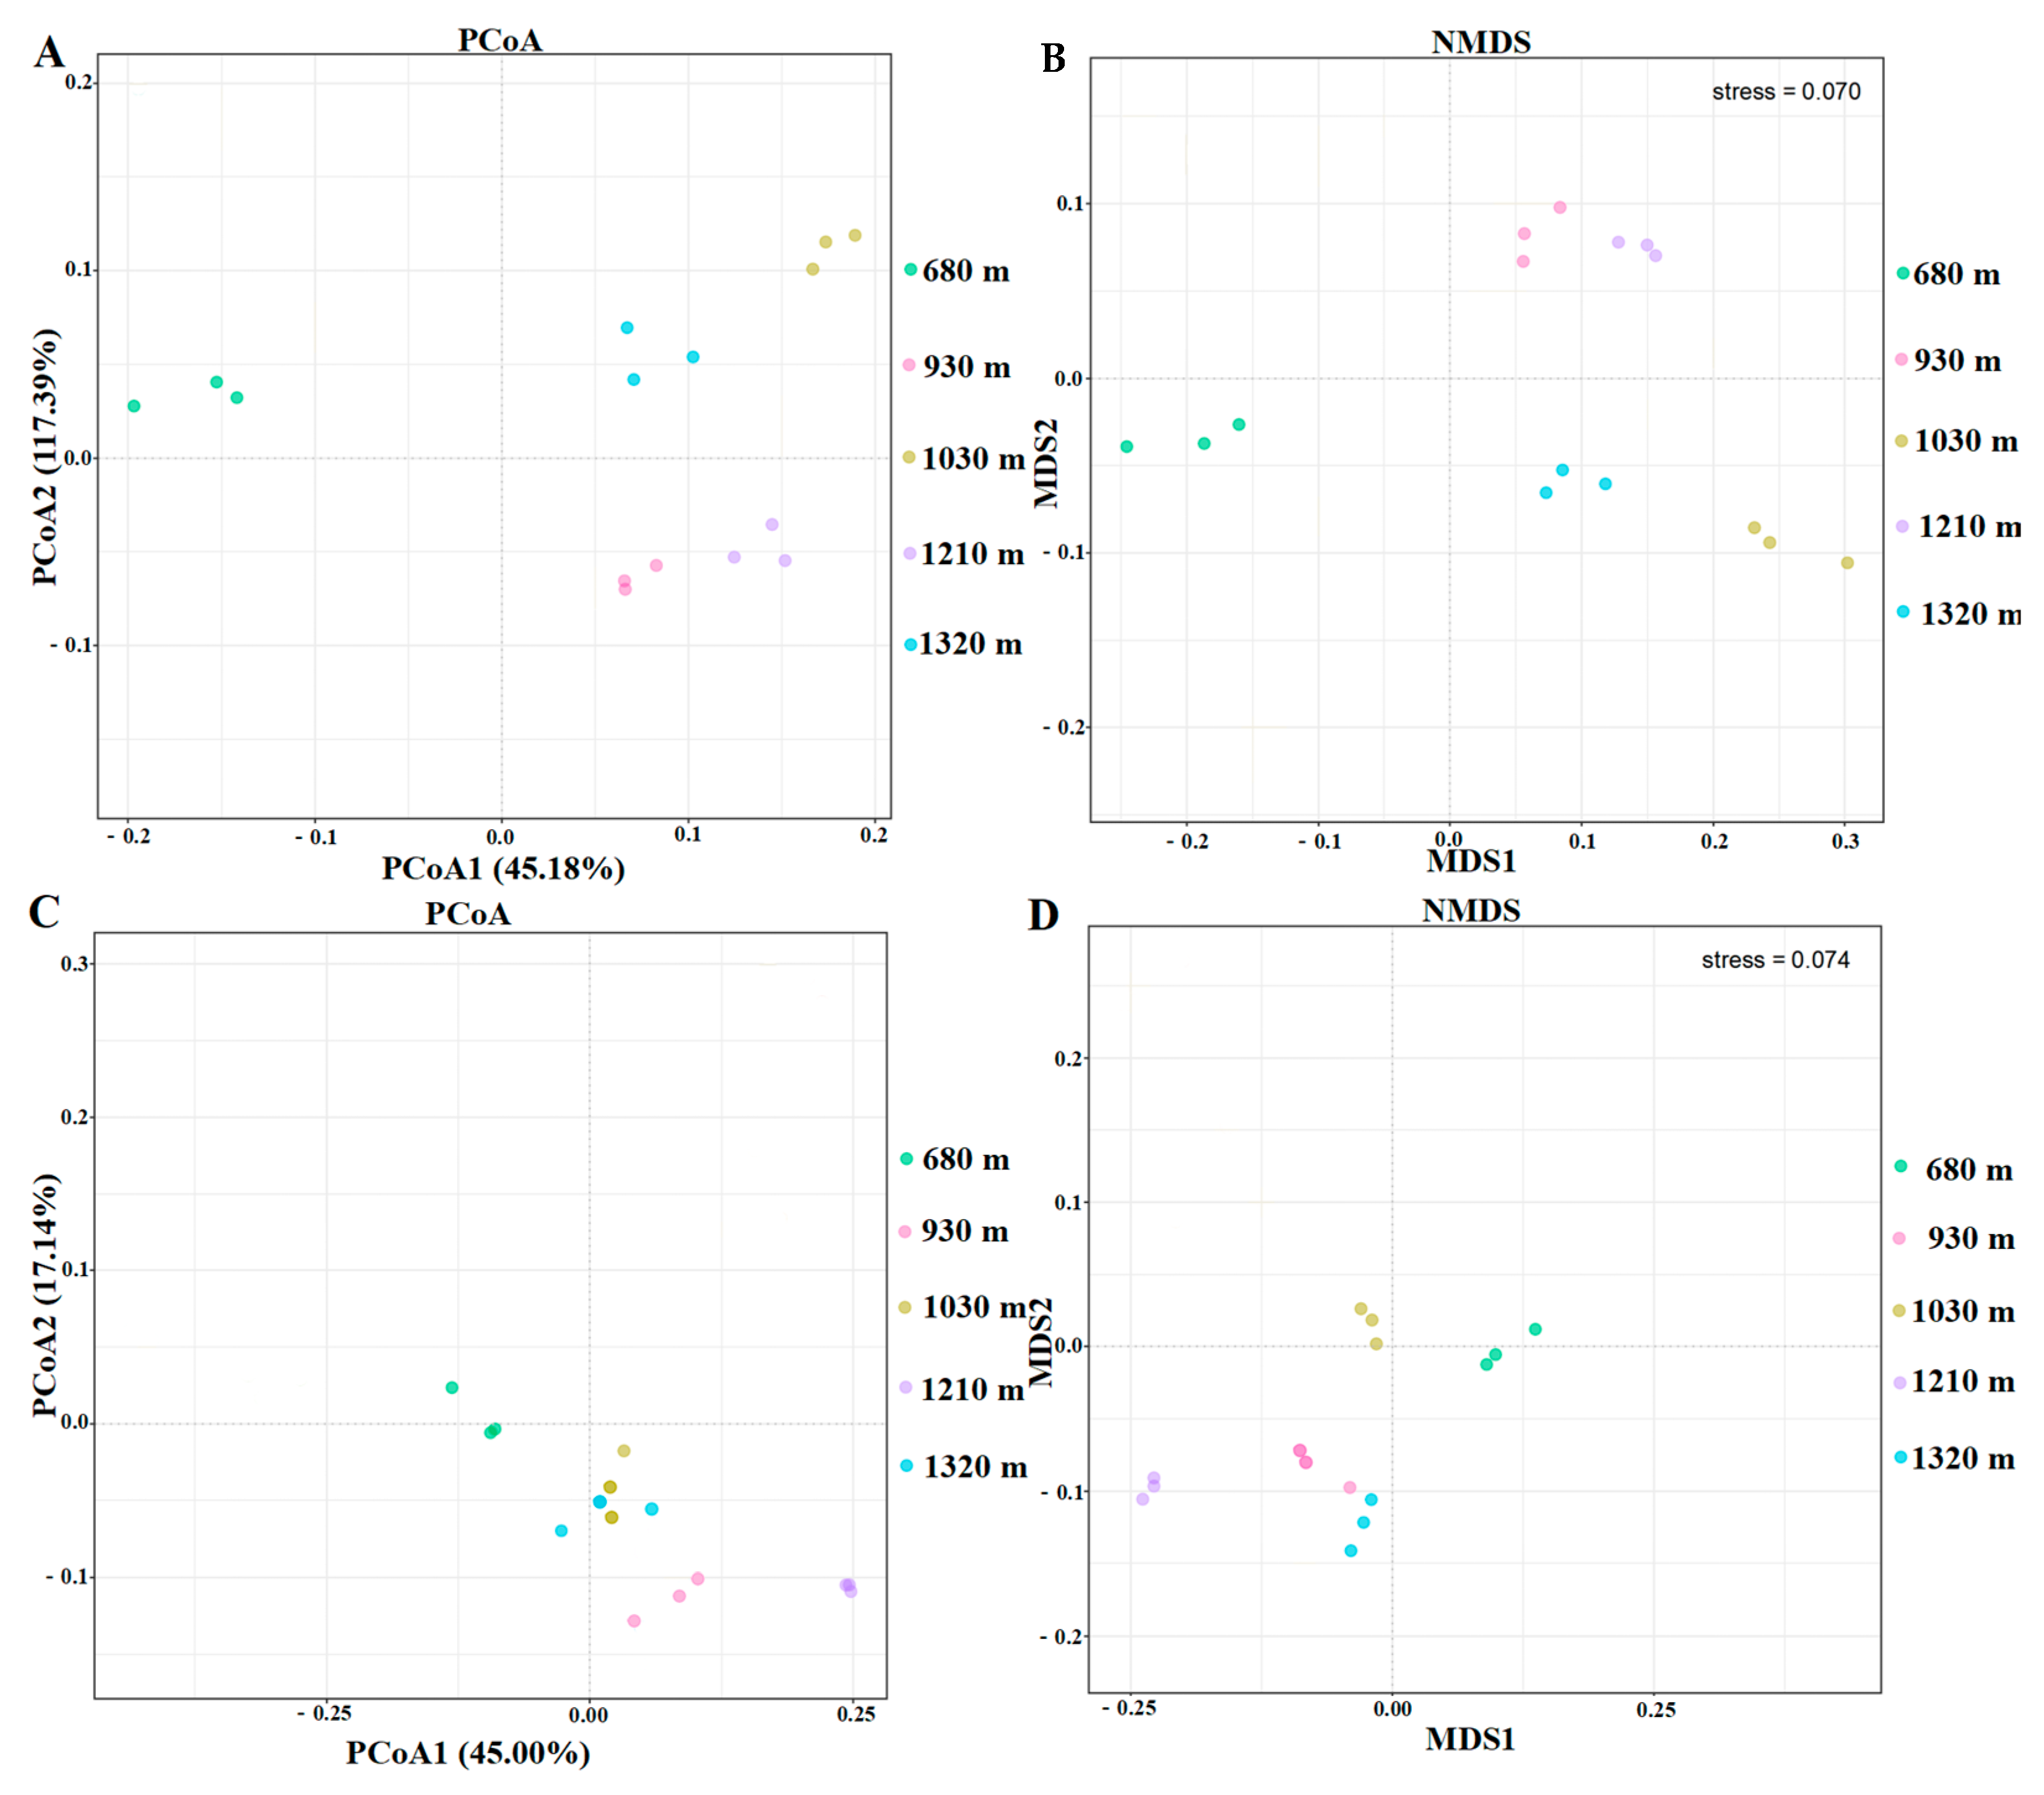
3.3.2. Beta Diversity Indices of the Microbial Communities

Figure 7A presents the distribution of the bacterial communities in the C. arabica rhizospheric soil samples at five altitudes, as determined by the PCoA. On the basis of the first principal coordinate, which accounted for 45.18% of the total variation, the C. arabica rhizospheric bacterial communities at four altitudes (930, 1030, 1210, and 1320 m) were grouped together and clearly separated from the C. arabica rhizospheric bacterial community at 680 m (low altitude). Similarly, the NMDS analysis separated the rhizospheric soil samples into two groups (Figure 7B).
The PCoA results for the first principal coordinate, which contributed 45.00% of the total variation, indicated that the C. arabica rhizospheric fungal communities at four altitudes (930, 1030, 1210, and 1320 m) were generally separated from the C. arabica rhizospheric fungal community at 680 m (low altitude) (Figure 7C). The NMDS analysis indicated the same fungal community structure at each site as well as a clear difference between the rhizospheric fungal community structure at 680 m, and the rhizospheric fungal community structures at the four higher altitudes (930, 1030, 1210, and 1320 m) (Figure 7D).

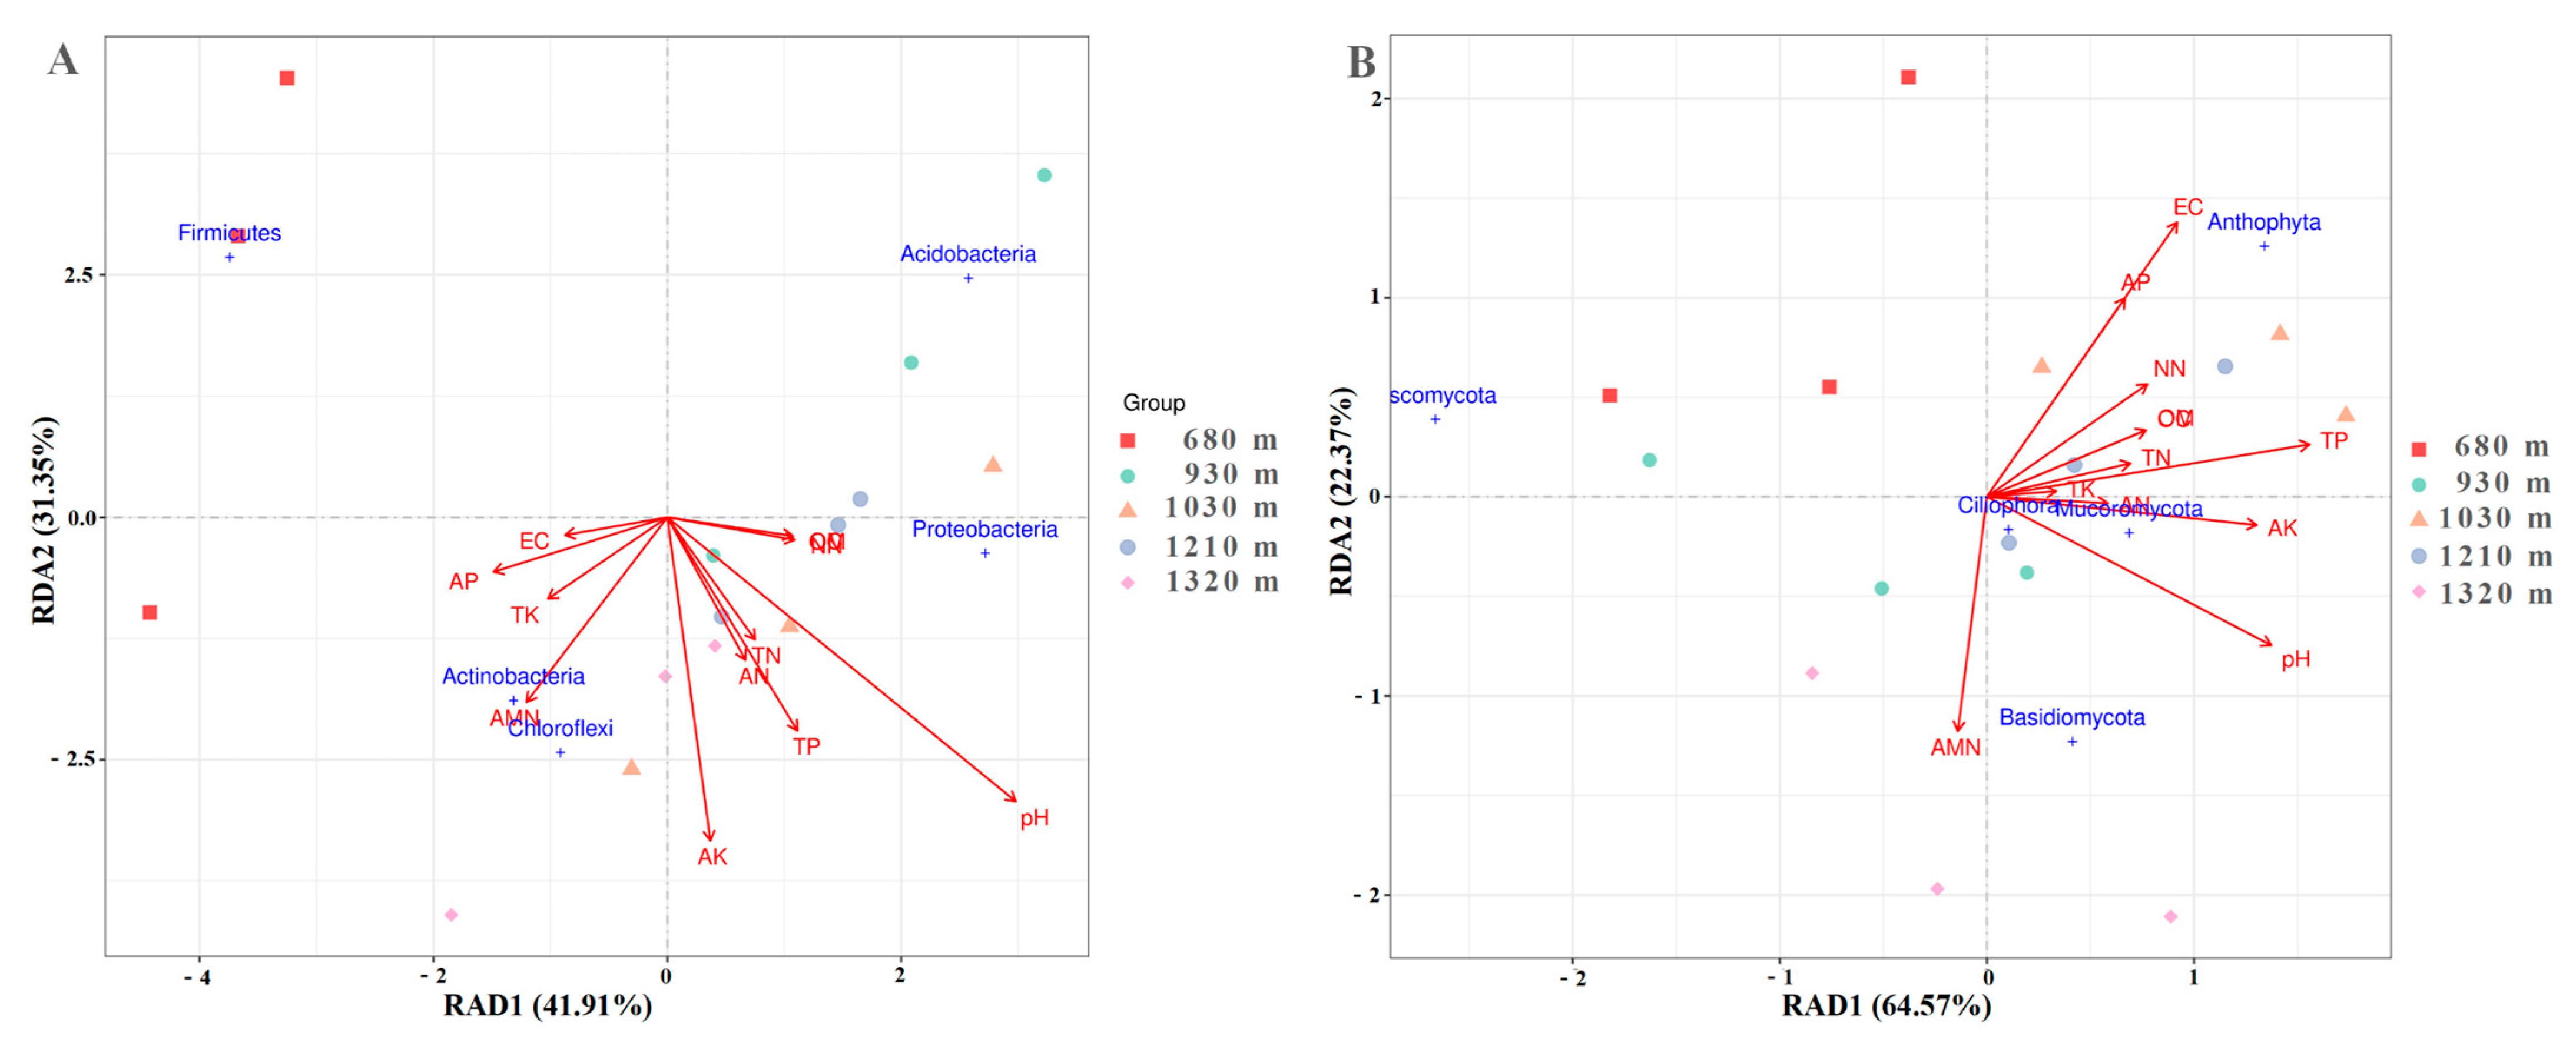
3.4. Effect of Environmental Factors on Microbial Communities

The redundancy analysis (RDA) for the top five bacterial phyla and rhizospheric soil environmental factors detected unremarkable alterations in the bacterial community structures in the C. arabica rhizospheric soil samples at five altitudes. The first two RDA components (RDA1 and RDA2) explained 41.91% and 31.35% of the total variance, respectively. In addition, the physicochemical properties of the soil samples were separated into two groups (Figure 8A), with one group comprising pH, available potassium, total phosphorus, available nitrogen, total nitrogen, nitrate nitrogen, organic carbon, and organic matter, while the remaining properties were included in the other group. Accordingly, the effects of pH, available potassium, total phosphorus, available nitrogen, total nitrogen, nitrate nitrogen, organic carbon, and organic matter on the bacterial community structure were similar, yet differed from the effects of the physicochemical properties in the other group. The rank order of the influences of the rhizospheric soil physical–chemical characteristics on the bacterial community structure was as follows: pH > available potassium > total phosphorus > ammonium nitrogen > available nitrogen > available phosphorus > total nitrogen > total potassium > nitrate nitrogen > organic carbon > organic matter > EC. Soil pH was the main environmental factor influencing the bacterial community composition at the phylum level. Furthermore, there was a positive correlation between the soil pH and the abundance of Proteobacteria.
The RDA for the top five fungal phyla and rhizospheric soil environmental factors indicated obvious alterations in the fungal community structures in the C. arabica rhizospheric soil samples at five altitudes. The first two RDA components (RDA1 and RDA2) explained 64.57% and 22.37% of the total variance, respectively. The physicochemical properties of the soil samples were divided into two groups (Figure 8B), with ammonium nitrogen forming one group and the rest combining to form the other group. Hence, the effect of ammonium nitrogen on the fungal community structure was distinct from the effects of the other physicochemical properties. The rank order of the influences of rhizospheric soil physical–chemical characteristics on fungal phyla was as follows: EC > total phosphorus > pH > available potassium > available phosphorus > ammonium nitrogen > nitrate nitrogen > organic matter > organic carbon > total nitrogen > available nitrogen > total potassium. Soil EC, total potassium, and pH were the three primary environmental factors modulating the fungal community composition at the phylum level. A positive correlation was found between EC and the abundance of Anthophyta. Additionally, total potassium and pH were negatively correlated with the abundance of Ascomycota, although positively correlated with the abundance of Mucoromycota and Ciliophora.

4. Discussion

Altitude is generally believed to be one of the factors that affect C. arabica quality [33,34,35]. Specifically, on the basis of the correlation between biochemical compositions and altitudes, higher altitudes (e.g., 1000 m) produce higher quality C. arabica plants than lower altitudes [36,37,38,39]. However, additional studies should be conducted to thoroughly clarify the relationship between altitude and C. arabica rhizospheric soil properties.
In this study, the C. arabica rhizospheric soil pH increased slightly from lower altitudes to medium–high altitudes. Therefore, the rhizospheric soil conditions were generally less acidic at medium–high altitudes than at lower altitudes. Furthermore, the organic matter, organic carbon, total nitrogen, total phosphorus, total potassium, available nitrogen, ammonium nitrogen, and available potassium contents in the C. arabica rhizospheric soil samples were higher at medium–high altitudes than at low altitudes. These results might be connected with the variation in rainfall as the altitude increased, which may have affected the C. arabica rhizospheric soil fertility and acidification. The amount of rainfall at the sample collection sites gradually increased as the altitude decreased. The increased rainfall at lower altitudes likely increased the acidification of the soil because of the associated increased leaching of basic cations, which are transferred to the surface water and groundwater (Rengel et al., 2011). In addition, the increased rainfall at lower altitudes likely accelerated the loss of soil nutrients, leading to decreased soil fertility [40].
In terms of the bacterial communities in the C. arabica rhizospheric soil samples, the Proteobacteria-to-Acidobacteria ratio was lower for the C. arabica rhizospheric soil samples at low altitudes than for the C. arabica rhizospheric soil samples at medium–high altitudes. The Proteobacteria-to-Acidobacteria ratio is a useful indicator of nutrient availability in the rhizosphere soil, with Proteobacteria usually present in nutrient-rich soil, whereas Acidobacteria is more common in nutrient-deficient soil [41,42,43,44]. In this study, the variation in the Proteobacteria-to-Acidobacteria ratio was mainly attributed to the change in soil fertility as the altitude increased. The rhizosphere soil fertility was higher at medium–high altitudes than at low altitudes. Our results agreed with the report of a recent study in which the Proteobacteria-to-Acidobacteria ratio also increased as the altitude increased [45].
In fungal communities, Ascomycota has an overwhelming advantage over other fungi [16,46]. In the present study, the variation in the relative abundance of Ascomycota from 680 to 1320 m was detected as a U-shaped curve. However, the differences among altitudes were not significant, which is suggestive of a lack of correlation between the relative abundance of Ascomycota and altitude. Similar tendencies were reported by Praeg et al. [27] and Wei et al. [28]. Cui et al. [26] analyzed the rhizosphere and bulk soil microbes at different altitudes in the eastern Tibetan Plateau. The marked alterations in the relative abundance of Ascomycota from 2800 to 3500 m also produced a U-shaped curve.
Several studies demonstrated that rhizospheric soil physical–chemical characteristics and plant traits affect the richness and diversity of microbial communities in the rhizosphere [47,48,49]. However, there has been relatively little research on the effects of environmental factors, such as altitude, on microbial community diversity and richness. In our study, changes in altitude considerably influenced the richness and diversity of the rhizospheric soil microbial communities. For example, the richness (Chao1 and ace) and diversity (Shannon and Simpson) indices for the C. arabica rhizospheric soil bacterial communities were higher at medium–high altitudes than at low altitudes. Similarly, in an earlier study, the soil bacterial richness and diversity continued to increase as the altitude increased [50]. The suppression of bacterial populations in the C. arabica rhizospheric soil samples at low altitudes in this study may be related to the excessive rainfall-induced degradation and acidification of the soil. In contrast, earlier research conducted by Pandey et al. [17], Bryant et al. [51], and Wang et al., [52] indicated that the richness and diversity of microbial populations may decrease as the altitude increases. In addition, Chen et al. suggested that soil bacterial diversity also could present the third pattern as the altitude (2400–3800 m) increases [53]. They found that Observed_OTUs, Chao1, and Shannon index showed a signally increasing trend with altitudes up to 3500 m and then presented a downward trend, exhibiting a unimodal pattern [53]. Furthermore, the diversity of microbial populations alongside increasing altitudes also presented a hollow pattern and a drop in microbial diversity at mid-altitudes [54,55]. These inconclusive reports inferred that the biogeographic patterns of microbial community diversity were more complicated than expected. Therefore, more research on microbial communities conduces to illuminate the relationships between microbial diversity and altitude.
Our analysis of fungal communities revealed a lack of altitude-related patterns in the changes to the richness and diversity indices for the C. arabica rhizospheric soil samples, which agreed with the findings of previous studies [22,56]. Changes in altitude can greatly affect rhizosphere microbial community diversity [45]. The beta diversity indices in this study suggested that the diversity and richness of the microbial communities were significantly higher at medium–high altitudes than at low altitudes, especially at 680 m. In addition, our PCoA and NMDS analyses of the microbial communities in the rhizospheric soil samples, collected at five altitudes, indicated that changes in the altitude can substantially alter the C. arabica rhizospheric soil microbial community structures. Moreover, the microbial communities at four altitudes (930, 1030, 1210, and 1320 m) were grouped together and were obviously distinguished from the corresponding communities at 680 m.
Changes in the diversity and composition of soil microbial communities may be due to altitude-related environmental factors that affect the physiological characteristics of the soil microbes [57,58]. In the present study, the RDA results identified pH as the most vital soil environmental factor influencing the soil microbial community compositions. Similar results were obtained in earlier studies conducted on Changbai Mountain and in the Tibetan Plateau by Shen et al. [23] and Yuan et al. [59], respectively. Chen et al. [53] also indicated that soil pH caused by altitude was markedly affected by the diversity patterns of soil microbial community structures in the montane ecosystems. Soil pH-driven altitude patterns of microbial diversity have also been reported across different spatial scales [60,61,62]. The aforementioned reports were all confirmed with interrelation, which displayed that soil pH was dramatically related to alpha and beta diversity indices of the microbial community structures. Moreover, compared with other edaphic factors, pH is better for predicting soil microbial community structures [60,63]. Therefore, the rhizospheric soil microbial communities at various altitudes may be modified by altering specific edaphic factors, including pH. However, the indirect effects of altitude on soil microorganisms (e.g., atmospheric pressure or solar radiation) should be investigated in future studies.
In the present study, many C. arabica rhizospheric soil parameters, including soil fertility, an abundance of plant growth-promoting microbes, microorganism proportions, and rhizosphere microbial community richness and diversity, were better at medium–high altitudes than at low altitudes. Several reports have described the interactions between rhizosphere soil parameters and altitudes [17,25,64]. Most of these studies showed that altitude can profoundly influence coffee quality. Substantial differences in quality have also been detected when the same genotype was cultivated at different altitudes [65]. Decreases in the temperature at medium–high altitudes can delay the ripening of coffee berries and lower the chances of disease, thereby positively modulating coffee quality-related attributes, such as aroma, fruitiness, acidity, and overall quality; temperature increases may lead to the development of an undesirable green earthy taste [36]. In our study, we determined that healthy soil at medium–high altitudes may be ideal for the production of high-quality coffee. Some studies concluded that chemical, physical, and biological (including microbial) components relevant to maintaining soil health can promote plant growth [66,67].

5. Conclusions

We may be able to characterize soil fertility and the distribution of various microbes more thoroughly in the C. arabica rhizospheric soil at different altitudes by completing a systematic examination of the factors associated with soil fertility, and the C. arabica rhizospheric soil microbiome. This information may be used to select C. arabica cultivation sites with optimal growth conditions, which in turn may increase the quality of C. arabica plants and enhance the production of coffee beans that satisfy the stringent quality-based requirements for scientific and commercial uses.

Supplementary Materials

The following supporting information can be downloaded at: https://www.mdpi.com/article/10.3390/agronomy13020471/s1, Table S1. The relative abundances (0.1% > for greater than) of the bacteria at the phylum level. Table S2. The relative abundances (0.1% > for greater than) of the bacteria at the class level. Table S3. The relative abundances (0.1% > for greater than) of the bacteria at the genus level. Table S4. The relative abundances (0.1% > for greater than ) of the fungus at the phylum level. Table S5. The relative abundances (0.1% > for greater than) of the fungus at the class level. Table S6. The relative abundances (0.1% > for greater than ) of the fungus at the genus level.

Author Contributions

Conceptualization, Y.G., X.L. and C.Z.; methodology, F.Z. and C.X.; software, P.Q.; validation, K.J. and H.D.; formal analysis, M.Z. and Y.L.; investigation, B.W. and X.S.; data curation, Y.G.; writing-original draft preparation, Y.G.; writing-review and editing, Y.G.; project administration, Y.G., X.L. and C.Z.; funding acquisition, C.Z. All authors have read and agreed to the published version of the manuscript.

Funding

This research was funded by the Scientific Research Fund Project of the Education Department of Yunnan Province (No. 2023Y0919), the Basic Research Program of Yunnan Science and Technology Department Agricultural joint special project (No. 202101BD070001-072), Yunnan International Science and Technology Cooperation Project (No. 2018IA087), Scientific Research Fund Project of Education Department of Yunnan Province (No. 2020J0276), Major project of School of Tropical Crops, Yunnan Agricultural University (No. 2019RYZDA01), Xingdian Talents Support Program of Yunnan Province, Yunnan Agricultural University high-level talent start-up funds, and Ministry of Agriculture and Rural Affairs Central Agricultural Production Development Advantageous Characteristic Industrial Cluster Construction (30000221100000920058).

Data Availability Statement

Data is contained within the article and Supplementary Materials.

Acknowledgments

We thank Yajima for editing the English text of a draft of this manuscript.

Conflicts of Interest

The authors declare no conflict of interest.

References

  1. Guimaraes, R.J.; Borem, F.M.; Shuler, J.; Farah, A.; Romero, J.C.P. Coffee growing and post-harvest processing. In Coffee Production, Quality and Chemistry; Farah, A., Ed.; The Royal Society of Chemistry: London, UK, 2019; pp. 150–178. [Google Scholar]
  2. DaMatta, F.M.; Ronchi, C.P.; Maestri, M.; Barros, R.S. Ecophysiology of coffee growth and production. Braz. J. Plant Physiol. 2007, 19, 485–510. [Google Scholar] [CrossRef]
  3. Yan, L.; Huang, L.F.; Wang, X.Y.; Zhou, H.; Cheng, J.H.; Li, J.H.; Long, Y.Z.; Dong, Y.P. Genetic diversity of coffee germplasms by ISSR markers. Chin. J. Trop. Crops 2019, 40, 300–307. (In Chinese) [Google Scholar]
  4. Martinez, S.J.; Bressani, A.P.P.; Simao, J.B.P.; Pylro, V.S.; Dias, D.R.; Schwan, R.F. Dominant microbial communities and biochemical profile of pulped natural fermented coffees growing in different altitudes. Food Res. Int. 2022, 159, 111605. [Google Scholar] [CrossRef]
  5. Mintesnot, A.; Dechassa, N. Effect of altitude, shade, and processing methods on the quality and biochemical composition of green coffee beans in Ethiopia. East Afr. J. Sci. 2018, 12, 87–100. [Google Scholar]
  6. Paudel, M.; Parajuli, K.; Regmi, S.; Budhathoki, S. Effect of altitude and shade on production and physical attributes of coffee in Gulmi, Syangja and Palpa districts of Nepal. J. Agric. Nat. Resour. 2021, 4, 222–238. [Google Scholar] [CrossRef]
  7. Cassamo, C.T.; Mangueze, A.V.J.; Leitão, A.E.; Pais, I.P.; Moreira, R.; Campa, C.; Chiulele, R.; Reis, F.O.; Marques, I.; Scotti-Campos, P.; et al. Shade and altitude implications on the physical and chemical attributes of green coffee beans from gorongosa mountain, Mozambique. Agronomy 2022, 12, 2540. [Google Scholar] [CrossRef]
  8. Ferreira, S.D.; Oliveira, E.S.M.; Ribeiro, R.W.; Filete, A.C.; Castanheira, T.D.; Rocha, C.P.B.; Moreli, P.A.; Oliveira, C.S.E.; Guarçoni, C.R.; Partelli, F.L.; et al. Association of altitude and solar radiation to understand coffee quality. Agronomy 2022, 12, 1885. [Google Scholar] [CrossRef]
  9. Worku, M.; de Meulenaer, B.; Duchateau, L.; Boeckx, P. Effect of altitude on biochemical composition and quality of green arabica coffee beans can be affected by shade and postharvest processing method. Food Res. Int. 2018, 105, 278–285. [Google Scholar] [CrossRef]
  10. Kamal, B.K.; Acharya, B.; Srivastava, A.; Pandey, M. Effect of different altitudes in qualitative and quantitative attributes of green coffee beans (Coffea arabica) in Nepal. Int. J. Hortic. Agric. Food Sci. 2021, 5, 1–7. [Google Scholar]
  11. Bertrand, B.; Vaast, P.; Alpizar, E.; Etienne, H.; Davrieux, F.; Charmetant, P. Comparison of bean biochemical composition and beverage quality of Arabica hybrids involving Sudanese-Ethiopian origins with traditional varieties at various elevations in Central America. Tree Physiol. 2006, 26, 1239–1248. [Google Scholar] [CrossRef]
  12. Colmenares, P.C.H.; Silva, P.A.; Mogollón, O.A.M. Impacts of different coffee systems on soil microbial populations at different altitudes in Villavicencio (Colombia). Agron. Colomb. 2016, 34, 285–291. [Google Scholar] [CrossRef]
  13. Zhang, H.B.; Zhou, H.; Li, J.H.; Lin, X.W.; Bai, X.H.; Guo, T.Y.; Xiao, B.; Xia, H.Y.; Yang, J.Z. Growing of Coffea arabica in high altitudes in China. Chin. J. Trop. Agric. 2014, 34, 21–32. (In Chinese) [Google Scholar]
  14. Zhang, Y.; Cong, J.; Lu, H.; Li, G.; Qu, Y.; Su, X.; Zhou, J.; Li, D. Community structure and elevational diversity patterns of soil Acidobacteria. J. Environ. Sci. 2014, 26, 1717–1724. [Google Scholar] [CrossRef]
  15. Zhao, M.Z.; Wu, T.; Tang, J.; Ma, G.R.; Guo, T.Y.; Xiao, Z.W.; Su, L.L.; Zhou, H.; Bai, X.H. Status quo and variation of soil fertility in different altitude of Coffea arabica L. Chin. J. Trop. Crops 2019, 40, 629–637. (In Chinese) [Google Scholar]
  16. Wang, B.; Lu, Y.; Li, W.; He, S.; Lin, R.; Qu, P.; Chen, H.; Zhang, F.; Zhao, M.; Shi, X.; et al. Effects of the continuous cropping of Amomum villosum on rhizosphere soil physicochemical properties, enzyme activities, and microbial communities. Agronomy 2022, 12, 2548. [Google Scholar] [CrossRef]
  17. Pandey, A.; Palni, L.M.S. The rhizosphere effect in trees of the Indian central himalaya with special reference to altitude. Appl. Ecol. Environ. Res. 2007, 5, 93–102. [Google Scholar] [CrossRef]
  18. Evizal, R.; Tohari, I.D.; Prijambada, J.W.; Widianto, D. Soil bacterial diversity and productivity of coffee shade tree agro-ecosystem. J. Trop. Soils 2012, 17, 181–187. [Google Scholar] [CrossRef]
  19. Nigussie, A.; Kissi, E. The contribution of coffee agroecosystem to soil fertility in Southwestern Ethiopia. Afr. J. Agric. Res. 2012, 7, 74–81. [Google Scholar] [CrossRef]
  20. Haggar, J.P.; Barrios, M.; Bolanos, M.; Merlo, M.; Moraga, P.; Munguia, R.; Ponce, A.; Romero, S.; Soto, G.; Staver, C.; et al. Coffee agroecosystem performance under full sun, shade, conventional and organic management regimes in Central America. Agrofor. Syst. 2011, 82, 285–301. [Google Scholar] [CrossRef]
  21. Bagyaraj, D.J.; Thilagar, G.; Ravisha, C.; Kushalappa, C.G.; Krishnamurthy, K.N.; Vaast, P. Below ground microbial diversity as influenced by coffee agroforestry systems in the Western Ghats, India. Agric. Ecosyst. Environ. 2015, 202, 198–202. [Google Scholar] [CrossRef]
  22. Fierer, N.; McCain, C.M.; Meir, P.; Zimmermann, M.; Rapp, J.M.; Silman, M.R. Microbes do not follow the elevational diversity patterns of plants and animals. Ecology 2011, 92, 797–804. [Google Scholar] [CrossRef] [PubMed]
  23. Shen, C.; Xiong, J.; Zhang, H.; Feng, Y.; Lina, X.; Li, X.; Liang, W.; Chu, H. Soil pH drives the spatial distribution of bacterial communities along elevation on Changbai Mountain. Soil Biol. Biochem. 2013, 57, 204–211. [Google Scholar] [CrossRef]
  24. Wang, J.T.; Cao, P.; Hu, H.W.; Li, J.; Han, L.L.; Zhang, L.M.; Zheng, Y.M.; He, J.Z. Altitudinal distribution patterns of soil bacterial and archaeal communities along Mt. Shegyla on the Tibetan Plateau. Microb. Ecol. 2015, 69, 135–145. [Google Scholar] [CrossRef] [PubMed]
  25. De Armas-Ricard, M.; Orlando, J.; Bustamante, R.; Carú, M. Microbial communities of bulk and Eschscholzia californica rhizosphere soils at two altitudes in Central Chile. J. Soil. Sci. Plant Nutr. 2016, 16, 1–13. [Google Scholar] [CrossRef]
  26. Cui, Y.X.; Bing, H.J.; Fang, L.C.; Wu, Y.H.; Yu, J.L.; Shen, J.T.; Jiang, M.; Wang, X.; Zhang, X.C. Diversity patterns of the rhizosphere and bulk soil microbial communities along an attitudinal gradient in an alpine ecosystem of the eastern Tibetan Plateau. Geoderma 2019, 338, 118–127. [Google Scholar] [CrossRef]
  27. Praeg, N.; Pauli, H.; Illmer, P. Microbial diversity in bulk and rhizosphere soil of Ranunculus glacialis along a high-alpine attitudinal gradient. Front. Microbiol. 2019, 10, 1429. [Google Scholar] [CrossRef]
  28. Wei, N.; Yue, X. Distribution of core root microbiota of Tibetan hulless barley along an attitudinal and geographical gradient in the Tibetan plateau. Microorganisms 2022, 10, 1737. [Google Scholar] [CrossRef]
  29. Bao, S.D. Analysis Method of Soil and Agricultural Chemistry, 3rd ed.; China Agricultural Press: Beijing, China, 2000; pp. 25–108. [Google Scholar]
  30. Logue, J.B.; Stedmon, C.A.; Kellerman, A.M.; Nielsen, N.J.; Andersson, A.F.; Laudon, H.; Lindstrom, E.S.; Kritzberg, E.S. Experimental insights into the importance of aquatic bacterial community composition to the degradation of dissolved organic matter. ISME J. 2016, 10, 533–545. [Google Scholar] [CrossRef]
  31. Karlsson, I.; Friberg, H.; Steinberg, C.; Persson, P. Fungicide effects on fungal community composition in the wheat phyllosphere. PloS ONE 2014, 9, e111786. [Google Scholar] [CrossRef]
  32. Bolyen, E.; Rideout, J.R.; Matthew, R.D.; Bokulich, N.A.; Abnet, C.C.; Al-Ghalith, G.A.; Alexander, H.; Alm, E.J.; Arumugam, M.; Asnicar, F.; et al. Author correction: Reproducible, interactive, scalable and extensible microbiome data science using QIIME 2. Nat. Biotechnol. 2019, 37, 1091. [Google Scholar] [CrossRef]
  33. Joët, T.; Lafargue, A.; Descroix, F.; Doulbeau, S.; Bertrandkochko, B.A.; Dussert, S. Infuence of environmental factors, wet processing and their interactions on the biochemical composition of green Arabica cofee beans. Food Chem. 2010, 118, 693–701. [Google Scholar] [CrossRef]
  34. Ferreira, W.P.M.; Queiroz, D.M.; Silvac, S.A.; Tomaz, R.S.; Corrêa, P.C. Effects of the orientation of the mountainside, altitude and varieties on the quality of the coffee beverage from the “Matas de Minas” Region, Brazilian Southeast Retrieved from. Am. J. Plant Sci. 2016, 7, 1291–1303. [Google Scholar] [CrossRef]
  35. Tsegay, G.; Redi-Abshiro, M.; Chandravanshi, B.S.; Ele, E.; Mohammed, A.M.; Mamo, H. Effect of altitude of coffee plants on the composition of fatty acids of green coffee beans. BMC Chem. 2020, 14, 36. [Google Scholar] [CrossRef] [PubMed]
  36. Bertrand, B.; Boulanger, R.; Dussert, S.; Ribeyre, F.; Berthiot, L.; Descroix, F.; Joët, T. Climatic factors directly impact the volatile organic compound fingerprint in green Arabica coffee bean as well as coffee beverage quality. Food Chem. 2012, 135, 2575–2583. [Google Scholar] [CrossRef]
  37. Davis, A.P.; Gole, T.W.; Baena, S.; Moat, J. The impact of climate change on indigenous Arabica coffee (Coffea arabica): Predicting future trends and identifying priorities. PLoS ONE 2012, 7, 10–14. [Google Scholar] [CrossRef]
  38. Schroth, G.; Läderach, P.; Blackburn Cuero, D.S.; Neilson, J.; Bunn, C. Winner or loser of climate change? A modeling study of current and future climatic suitability of Arabica coffee in Indonesia. Reg. Environ. Chang. 2015, 15, 1473–1482. [Google Scholar] [CrossRef]
  39. Tolessa, K.; D’heer, J.; Duchateau, L.; Boeckx, P. Influence of growing altitude, shade and harvest period on quality and biochemical composition of Ethiopian specialty coffee. J. Sci. Food Agric. 2017, 97, 2849–2857. [Google Scholar] [CrossRef]
  40. Rengel, Z. Soil pH, Soil Health and Climate Change. In Soil Health and Climate Change. Soil Biology; Singh, B., Cowie, A., Chan, K., Eds.; Springer: Berlin, Germany, 2011; pp. 50–58. [Google Scholar]
  41. Smit, E.; Leeflflang, P.; Gommans, S.; Broek, J.V.D.; van Mil, S.; Wernars, K. Diversity and seasonal fluctuations of the dominant members of the bacterial soil community in a wheat field as determined by cultivation and molecular methods. Appl. Environ. Microbiol. 2001, 67, 2284–2291. [Google Scholar] [CrossRef]
  42. Gao, Z.; Hu, Y.; Han, M.; Xu, J.; Wang, X.; Liu, L.; Tang, Z.; Jiao, W.; Jin, R.; Liu, M.; et al. Effects of continuous cropping of sweet potatoes on the bacterial community structure in rhizospheric soil. BMC Microbiol. 2021, 21, 102. [Google Scholar] [CrossRef]
  43. Pang, Z.; Dong, F.; Liu, Q.; Lin, W.; Hu, C.; Yuan, Z. Soil metagenomics reveals effects of continuous sugarcane cropping on the structure and functional pathway of rhizospheric microbial community. Front. Microbiol. 2021, 12, 369. [Google Scholar] [CrossRef]
  44. Sikorski, J.; Baumgartner, V.; Birkhofer, K.; Boeddinghaus, R.S.; Bunk, B.; Fischer, M.; Fösel, B.U.; Friedrich, M.W.; Göker, M.; Hölzel, N.; et al. The evolution of ecological diversity in Acidobacteria. Front. Microbiol. 2022, 13, 715637. [Google Scholar] [CrossRef] [PubMed]
  45. Tang, M.Z.; Li, L.; Wang1, X.L.; You, J.; Li, J.N.; Chen, X. Elevational is the main factor controlling the soil microbial community structure in alpine tundra of the Changbai Mountain. Sci. Rep. 2020, 10, 12442. [Google Scholar] [CrossRef] [PubMed]
  46. Liu, H.; Cheng, J.; Jin, H.; Xu, Z.; Yang, X.; Min, D.; Xu, X.; Shao, X.; Lu, D.; Qin, B. Characterization of rhizosphere and endophytic microbial communities associated with Stipa purpurea and their correlation with soil environmental factors. Plants 2022, 11, 363. [Google Scholar] [CrossRef] [PubMed]
  47. Lorenzo, P.; Rodríguez–Echeverría, S.; González, L.; Freitas, H. Effect of invasive Acacia dealbata Link on soil microorganisms as determined by PCR-DGGE. Appl. Soil Ecol. 2010, 44, 245–251. [Google Scholar] [CrossRef]
  48. Min, L.; Mei, X.X.; Ying, P.; Juan, J.C.; Na, C. Characteristics of soil microbial community functional and structure diversity with coverage of Solidago canadensis L. J. Cent. South Univ. T. 2013, 20, 749–756. [Google Scholar]
  49. Philippot, L.; Raaijmakers, J.M.; Lemanceau, P.; van der Putten, W.H. Going back to the roots: The microbial ecology of the rhizosphere. Nat. Rev. Microbiol. 2013, 11, 789–799. [Google Scholar] [CrossRef]
  50. Wang, J.; Soininen, J.; Zhang, Y.; Wang, B.; Yang, X.; Shen, J. Contrasting patterns in elevational diversity between microorganisms and macroorganisms. J. Biogeogr. 2011, 38, 595–603. [Google Scholar] [CrossRef]
  51. Bryant, J.A.; Lamanna, C.; Morlon, H.; Kerkhoff, A.J.; Enquist, B.J.; Green, J.L. Microbes on mountainsides: Contrasting elevational patterns of bacterial and plant diversity. Proc. Natl. Acad. Sci. USA 2008, 105, 11505–11511. [Google Scholar] [CrossRef]
  52. Wang, Y.; Wang, H.; Cheng, H.; Chang, F.; Wan, Y.; She, X. Niche differentiation in the rhizosphere and endosphere fungal microbiome of wild Paris polyphylla Sm. Peer J. 2020, 8, e8510. [Google Scholar] [CrossRef]
  53. Chen, L.F.; Kong, J.Q.; He, Z.B.; Zhao, W.Z.; Song, M.D.; Li, Y.M.; Gao, Y.; Yang, S.P. A fundamental role of slope aspect and elevation in controlling diversity patterns of soil bacterial communities: Insights from an arid-montane ecosystem in China. J. Soil Sci. Plant Nut. 2022, 22, 3996–4007. [Google Scholar] [CrossRef]
  54. Singh, D.; Lee-Cruz, L.; Kim, W.S.; Kerfahi, D.; Chun, J.H.; Adams, J.M. Strong elevational trends in soil bacterial community composition on Mt. Halla. South Korea Soil Biol. Biochem. 2014, 68, 140–149. [Google Scholar] [CrossRef]
  55. Liu, D.; Wu, X.; Shi, S.; Liu, H.; Liu, G. A hollow bacterial diversity pattern with elevation in Wolong Nature Reserve, Western Sichuan Plateau. J. Soil Sediment 2016, 16, 2365–2374. [Google Scholar] [CrossRef]
  56. Wang, J.; Soininen, J.; He, J.; Shen, J. Phylogenetic clustering increases with elevation for microbes. Environ. Microbiol. Rep. 2012, 4, 217–226. [Google Scholar] [CrossRef]
  57. Körner, C. The use of “altitude” in ecological research. Trends Ecol. Evol. 2007, 22, 569–574. [Google Scholar] [CrossRef]
  58. Donhauser, J.; Frey, B. Alpine soil microbial ecology in a changing world. FEMS Microbiol. Ecol. 2018, 94, fiy099. [Google Scholar] [CrossRef]
  59. Yuan, Y.; Si, G.; Wang, J.; Luo, T.; Zhang, G. Bacterial community in alpine grasslands along an altitudinal gradient on the Tibetan Plateau. FEMS Microbiol. Ecol. 2014, 87, 121–132. [Google Scholar] [CrossRef] [Green Version]
  60. Fierer, N.; Jackson, R. The diversity and biogeography of soil bacterial communities. Proc. Natl. Acad. Sci. USA 2006, 103, 626–630. [Google Scholar] [CrossRef]
  61. Delgado-Baquerizo, M.; Oliverio, A.M.; Brewer, T.E.; Benavent-González, A.; Eldridge, D.J.; Bardgett, R.D.; Fierer, N. A global atlas of the dominant bacteria found in soil. Science 2018, 359, 320–325. [Google Scholar] [CrossRef]
  62. Malard, L.A.; Anwar, M.Z.; Jacobsen, C.S.; Pearce, D.A. Biogeographical patterns in soil bacterial communities across the Arctic region. FEMS Microbiol. Ecol. 2019, 95, fz128. [Google Scholar] [CrossRef]
  63. Lauber, C.L.; Hamady, M.; Knight, R.; Fierer, N. Pyrosequencing-based assessment of soil pH as a predictor of soil bacterial community structure at the continental scale. Appl. Environ. Microbiol. 2009, 75, 5111–5120. [Google Scholar] [CrossRef]
  64. Martins, P.M.M.; Batista, N.N.; Miguel, M.G.; Simão, J.B.P.; Soares, J.R.; Schwan, R.F. Coffee growing altitude influences the microbiota, chemical compounds and the quality of fermented coffees. Food Res. Int. 2020, 129, 108872. [Google Scholar] [CrossRef] [PubMed]
  65. Galland, J.C.; Avelino, J.; Larraín, A. Origin coffees: Are appellations of origin on the horizon? In Coffee: Terroirs and Qualities, CIRAD; Montagnon, C., Ed.; Editions Quae: Versailles, Switzerland, 2006; p. 49. [Google Scholar]
  66. Trivedi, P.; Delgado-Baquerizo, M.; Anderson, I.C.; Singh, B.K. Response of soil properties and microbial communities to agriculture: Implications for primary productivity and soil health indicators. Front. Plant Sci. 2016, 7, 990. [Google Scholar] [CrossRef] [PubMed] [Green Version]
  67. Franzluebbers, A.J. Stratification of soil porosity and organic matter. In Encyclopedia of Agrophysics; Horabik, J., Lipiec, J., Eds.; Springer: Dordrecht, The Netherlands, 2011; pp. 858–861. [Google Scholar]
Figure 1. Physicochemical properties of C. arabica rhizospheric soil at different altitudes. (A) the pH of C. arabica rhizospheric soil at different altitudes; (B) the electrical conductivity of C. arabica rhizospheric soil at different altitudes; (C) the organic matter content of C. arabica rhizospheric soil at different altitudes; (D) the organic carbon content of C. arabica rhizospheric soil at different altitudes; (E) the total nitrogen content of C. arabica rhizospheric soil at different altitudes; (F) the total phosphorus content of C. arabica rhizospheric soil at different altitudes; (G) the total potassium content of C. arabica rhizospheric soil at different altitudes; (H) the available nitrogen content of C. arabica rhizospheric soil at different altitudes; (I) the nitrate nitrogen content of C. arabica rhizospheric soil at different altitudes; (J) the ammonium nitrogen content of C. arabica rhizospheric soil at different altitudes; (K) the available phosphorus content of C. arabica rhizospheric soil at different altitudes; (L) the available potassium content of C. arabica rhizospheric soil at different altitudes. OM, OC, TN, TP, TK, AN, NN, AMN, AP, and AK represent organic matter, organic carbon, total nitrogen, total phosphorus, total potassium, available nitrogen, nitrate nitrogen, ammonium nitrogen, available phosphorus, and available potassium, respectively. Data are presented for the rhizospheric soil samples collected at altitudes of 680, 930, 1030, 1210, and 1320 m.
Agronomy 13 00471 g001
Figure 2. Venn diagrams of the bacterial (A) and fungal (B) OTUs in the C. arabica rhizospheric soil at different altitudes. The altitudes of the rhizospheric soil sample collection sites are presented in the figure (680, 930, 1030, 1210, and 1320 m).
Agronomy 13 00471 g002
Figure 3. Bacterial community composition and structure in the C. arabica rhizospheric soil samples at different altitudes. (A) Top 10 bacterial phyla. (B) Top 10 bacterial classes. (C) Top ten bacterial genera. Relative abundance was calculated as the percentage of the total effective bacterial sequences in a sample. Classifications were based on the SILVA database. Phyla, classes, and genera that were not included in the top 10 in both libraries were classified as ‘Other.’ Data are presented for the rhizospheric soil samples collected at altitudes of 680, 930, 1030, 1210, and 1320 m.
Agronomy 13 00471 g003
Figure 4. Fungal community composition and structure in the C. arabica rhizospheric soil samples at different altitudes. (A) Top 10 fungal phyla. (B) Top 10 fungal classes. (C) Top 10 fungal genera. Relative abundance was calculated as the percentage of the total effective fungal sequences in a sample. Classifications were based on the SILVA database. Phyla, classes, and genera that were not included in the top 10 in both libraries were classified as ‘Other’. Data are presented for the rhizospheric soil samples collected at altitudes of 680, 930, 1030, 1210, and 1320 m.
Agronomy 13 00471 g004
Figure 5. Alpha diversity indices of the bacterial communities (based on the 16S rRNA genes) in the C. arabica rhizospheric soil samples at different altitudes. Data are presented for the rhizospheric soil samples collected at altitudes of 680, 930, 1030, 1210, and 1320 m.
Agronomy 13 00471 g005
Figure 6. Alpha diversity indices of the fungal communities (based on ITS regions) in the C. arabica rhizospheric soil samples at different altitudes. Data are presented for the rhizospheric soil samples collected at altitudes of 680, 930, 1030, 1210, and 1320 m.
Agronomy 13 00471 g006
Figure 7. Principal coordinate analysis (PCoA) and nonmetric multidimensional scaling (NMDS) analysis of the bacterial and fungal communities in the C. arabica rhizospheric soil samples at different altitudes. (A) PCoA of the bacterial community. (B) NMDS analysis of the bacterial community. (C) PCoA of the fungal community. (D) NMDS analysis of the fungal community. Data are presented for the rhizospheric soil samples collected at altitudes of 680, 930, 1030, 1210, and 1320 m.
Agronomy 13 00471 g007
Figure 8. Correlations between microbial phyla and soil physicochemical properties. (A) Redundancy analysis (RDA) of the top five bacterial phyla and soil physicochemical properties. (B) RDA of the top five fungal phyla and soil physicochemical properties. Data are presented for the rhizospheric soil samples collected at altitudes of 680, 930, 1030, 1210, and 1320 m. OM, OC, TN, TP, TK, AN, NN, AMN, AP, and AK represent organic matter, organic carbon, total nitrogen, total phosphorus, total potassium, available nitrogen, nitrate nitrogen, ammonium nitrogen, available phosphorus, and available potassium, respectively.
Agronomy 13 00471 g008
Disclaimer/Publisher’s Note: The statements, opinions and data contained in all publications are solely those of the individual author(s) and contributor(s) and not of MDPI and/or the editor(s). MDPI and/or the editor(s) disclaim responsibility for any injury to people or property resulting from any ideas, methods, instructions or products referred to in the content.

