Article

Preharvest Abiotic Stress Affects the Nutritional Value of Lettuce

by
Sanja Ćavar Zeljković
1,2,*,
Nikola Štefelová
2,
Karel Hron
3,
Ivana Doležalová
1 and
Petr Tarkowski
1,2
1
Centre of the Region Haná for Biotechnological and Agricultural Research, Department of Genetic Resources for Vegetables, Medicinal and Special Plants, Crop Research Institute, Šlechtitelů 29, 78371 Olomouc, Czech Republic
2
Czech Advanced Technology and Research Institute, Palacky University, Šlechtitelů 27, 78371 Olomouc, Czech Republic
3
Faculty of Science, Palacky University, 17. listopadu 12, 77900 Olomouc, Czech Republic
*
Author to whom correspondence should be addressed.
Agronomy 2023, 13(2), 398; https://doi.org/10.3390/agronomy13020398
Submission received: 22 December 2022 / Revised: 25 January 2023 / Accepted: 27 January 2023 / Published: 29 January 2023
(This article belongs to the Special Issue Climate Changes and Quality of Crops)

Abstract

:
Lettuce (Lactuca sativa L.) is one of the most consumed leafy green vegetables in the world, and is a good source of important bioactive compounds. However, environmental stress factors, such as salinity or drought, cause physiological and biochemical changes in plants and influence the yields and levels of both primary and secondary metabolites, which drastically changes the nutritional value and quality of the crop. In the present work, six typical Czech cultivars/landraces of various lettuce morphotypes (Altenbursky, Dubacek, Kamenac, Jupiter, Prazan, and Robin) were grown under driven conditions and then analyzed for the content of sugars, fatty acids, amino acids, phenolics, and vitamins. Obtained data were subjected to compositional tables statistical analysis, which provided not only information on general trends in the changes in their nutritional value but also how these changes affected each particular variety. Overall, drought caused the largest relative increase in phenolic compounds and some amino acids. Conversely, drought caused overall the largest relative decrease in vitamin C, but also in fatty acids. In addition, salt stress caused a larger decrease in many metabolites, especially the amino acid arginine, while fatty acids were only slightly increased, together with vitamin E. In addition, the interpretation of data from statistical analysis showed that varieties Prazan and Altenbursky had the least changes in their chemical composition when subjected to drought stress. Again, var. Altenbursky showed the least variability in comparison to other varieties when subjected to salt stress. These findings confirm the fact that landraces and old cultivars do not change their chemical profiles significantly, as is the case for improved cultivars, and they emphasize the need for their cultivation when raising the productivity of staple food crops.

1. Introduction

Due to the continuous climate changes and human impacts on the environment, abiotic stress has become a key threat, not only to crop yields and quality. Drought and salt stress, and temperature extremes, have developed into significant environmental limitations on the productivity of crops all over the world [1]. Besides morphological changes, plants grown under stress undergo many cellular and biochemical modifications, and many of them affect the nutritional value and, therefore, the quality of the crop. Better knowledge of plant responsiveness to abiotic stress in both traditional and modern breeding applications will assist in enhancing stress tolerance [2,3,4].
Lettuce (Lactuca sativa L.) is one of the most commonly consumed fresh leafy vegetables [5,6], and also one of the main crops grown both indoors [7] and outdoors [8]. Although lettuce is low in nutritional value, this leafy green can provide considerable amounts of health-beneficial secondary metabolites, mainly folate, carotenoids, and phenolic compounds. Due to its easy cultivation, the nutritional value of lettuce can be enhanced by manipulating cultural practices, by the application of biostimulants, or even by preharvest abiotic stress [9,10]. Gealieni et al. [9] found that short drought stress significantly increases the levels of bounded phenolic compounds in lettuce, especially caffeic, caftaric, and chicoric acids. A matching report was also given by Paim et al. [11]. Moreover, Šamec et al. [12] reported that selected leafy green vegetables of Brassica accumulate phenolic compounds and glucosinolates when the plants are subjected to short-term salt stress. Similar findings were shown for Amaranthus leafy vegetables, whether plants are subjected to salt or drought stress [13,14,15], but these studies do not show which particular compound accumulates, and which compounds appear in reduced levels. Phenolic compounds do not only play an important role in plant defense against abiotic stressors [16], but they are also beneficial to humans [17].
Although it is generally recommended that improving cultivation is the most important step to fill the gap between population growth and food production [3,18], some studies are showing that traditional landraces can adapt to stress better than improved cultivars. Landraces are known as a source of a wide variety of traits for enhancing crop stress tolerance [8,19,20]. Landraces and old traditional cultivars arose from the beginning of agriculture through the selection of wild ecotypes and by their growth in the domestic region, thus representing broad genetic diversity. This is why they are heterogeneous with variable phenology, having lower yields and less susceptibility to pathogens, but are very often nutritionally superior compared to modern cultivars. As pointed out by Dwivedi et al. [20], a systematic evaluation of landraces is urgently needed to identify alleles for enhancing yields and adaptation to abiotic stress so as to raise the productivity of staple food crops.
Therefore, this study aimed to investigate changes in the nutritional value of selected varieties of lettuce, both landraces and improved cultivars, grown under normal (control) and abiotic stress (drought and salt) conditions. The selection of varieties was based on their different morphological characteristics, which were also described in this study. Plants were grown under controlled conditions; each variety was stressed by 50% water deficiency and 100 mM NaCl for a short preharvest period, and then analyzed for the content and composition of soluble sugars, free amino acids, and phenolic compounds, as well as for vitamins and fatty acids. As summarized in the paragraphs above, previous studies regarding the influence of abiotic stress on leafy greens only showed general changes in plant metabolic profiles. Here, we present changes in the total of 53 analytes that have a significant impact on lettuce’s nutritional value. Due to the complexity of the produced data, the compositional tables approach is used for their analysis. Compositional tables, which can be regarded as a continous counterpart to contingency tables, enable us to examine the relationships between two factors. Here, the relevant information consists of ratios between different cells of such a table. This is the first time that this approach has been used in plant science research.

2. Materials and Methods

2.1. Plant Material and Cultivation

A set of six varieties of lettuce (Lactuca sativa L.) from the Czech National Collection of Lettuce Genetic Resources, maintained at the Department of Genetic Resources of Vegetables, Medicinal Plants and Special Crops of the Crop Research Institute, were used in this study (Table 1). The individual varieties are of Czech origin and represent different lettuce morphotypes, with one accession (ECN 09H5700047) being the landrace. The passport data of accessions/varieties is documented in the Plant Genetic Resources Documentation System of the Czech Republic (GRIN Czech Release 1.10.3) [21].
The accessions were phenotyped for seventeen descriptors according to the descriptor list for Lactuca sativa L. [22], including those for the young leaf (anthocyanin distribution, anthocyanin pattern, shape of blade, division of blade, venation), outer adult leaf (color, anthocyanin distribution, anthocyanin pattern, blistering), harvested part (size of the head and/or rosette), leaf head (shape in vertical section, overlapping of leaves, firmness), and stem length, including inflorescence, fruit seed coat color, bolting, and flowering .
The plant seeds were sown in perlite and, at the stage of the fully developed cotyledon leaves, transplanted in a 160-cell standard tray with horticultural substrate Florcom (BB Com Ltd., Letohrad). The plants were watered appropriately as needed, i.e., twice per week. At the stage of 5–6 fully developed true leaves, the plantlets were transplanted into plastic growing pots (diameter 9 cm), in which the gardening substrate Florcom was also used, always in 5 repetitions from each accession. The plants were grown in a growth chamber (Photon System Instruments, Drásov, Czech Republic), with the temperature at 14 °C at night, 20 °C during the day, for 16 h a day, 8 h a night; illumination ca. 170 µmol/m2/s; 65% relative humidity.
After 7 days of acclimatization, the plants were subjected to abiotic stress. The control samples of each accession were irrigated with 80 mL of water per pot, twice a week. Plants subjected to salinity stress were watered once a week with 40 mL of 100 mM NaCl, and once a week with 40 mL of water per pot. Plants subjected to drought stress were watered with 40 mL of water per pot only once a week. Individual plant samples were collected and immediately lyophilized after 14 days of abiotic stress (Christ Beta 1–8 LD plus, Martin Christ Gefriertrocknungsanlagen GmbH, Germany) and then homogenized (Retsch MM400, Haan, Germany). The material was stored at −20 °C until analysis.

2.2. Free Sugars

Simple sugars (saccharose, glucose, and fructose) were quantified according to the slightly modified method of O’Donoghue et al. [23]. Briefly, around 20 mg of pulverized material was sonicated for 10 min with 1 mL of distilled water. After 10 min centrifugation at 14,500× g, the supernatant was collected and filtered through syringe filters of 0.22 μm porosity into vials and injected into an LC system (Smartline Knauer, Germany) equipped with an ELSD detector (Alltech 3300, USA). The sugars were separated on a Rezex RCM monosaccharide Ca+2 (8%) column (300 mm × 7.8 mm, 8 μm) (Phenomenex, Czech Republic), with Mili-Q water (Milipore Sigma, USA) used as the mobile phase, with a flow rate of 0.6 mL/min, under isocratic conditions. The detection was performed by ELSD under a nitrogen flow of 2 L/min and a detector temperature of 80 °C. The injection volume was 10 μL of sample and the analysis time was 17 min. All measurements were performed in three replicates.

2.3. Fatty Acids

The determination of fatty acids in lettuce varieties was performed according to Carvalho and Malcata [24], with some modifications. Briefly, 50 mg of the sample was extracted with 2 × 1 mL of CHCl3:MeOH (2:1). The mixture was sonicated for 10 min and then centrifuged for 10 min at 14,500× g. The supernatant was collected and evaporated to dryness under a vacuum at 40 °C. Methylation of fatty acids was performed with 1 M NaOMe/MeOH for 5 min at room temperature, and after the addition of 200 μL of saturated NaCl, fatty acid methyl esters (FAME) were extracted with 2 × 500 μL of n-hexane. The solvent was evaporated under a vacuum and the residuum was dissolved into 100 μL of n-hexane. The resulting FAMEs were analyzed via GC-MS using the Agilent system (GC 7890 A; MSD 5975C series II) on a fused silica HP-5MS UI column (30 m × 0.25 mm × 0.25 mm) and carrier gas He (1.1 mL/min). The temperature was programmed at 120 °C for 3 min, 5 °C/min to 180 °C, then held for 10 min, 10 °C/min to 220 °C, and finally 2 °C/min to 250 °C and held for 5 min. The temperature of the injection port and detector was 230 °C. Ionization was performed in EI mode (70 eV). Injection (2 μL) was performed in split mode (9:1). Identification was performed by comparison of retention times and mass spectra with the mixture of authentic standards (Supelco 37 Component FAME Mix, Merck, Czechia). All measurements were performed in three replicates.

2.4. Free Amino Acids

The analysis of the free amino acids was performed according to the already published protocol [25]. Briefly, pulverized plant material (3–5 mg) was mixed with 1 mL of 50% EtOH and sonicated for 10 min. After centrifugation at 14,500× g, 200 μL of supernatant was transferred into a new vial, evaporated to dryness at 40 °C under a vacuum, and then re-dissolved into 50 μL of the mobile phase, consisting of 20 mM ammonium formate, pH 3.0 (Component A), and 0.2% formic acid in ACN (Component B). UHPLC-MS/MS analysis was performed using a Nexera X2 UHPLC system (Shimadzu Handels GmbH), coupled with an MS-8050 device (Shimadzu Handels GmbH). Chromatographic separation was performed on an Acquity UPLC BEH AMIDE column (50 × 2.1 mm; 1.7 μm).

2.5. Free Phenolic Compounds

The phenolic compounds were determined according to a previously published protocol [26]. Briefly, homogenized plant material (20 mg) was extracted with 2 × 1 mL of 80% MeOH and sonicated for 10 min in an ultrasonic bath. After centrifugation at 14,500× g, 250 μL of supernatant was transferred into a new vial and evaporated to dryness at 40 °C under a vacuum, and then re-dissolved into 25 μL of the mobile phase consisting of 15 mM formic acid (pH 3; adjusted with NH4OH) and ACN. UHPLC-MS/MS analysis of free phenolic acids and flavonoids was performed on the same instrument described above, and chromatographic separation was performed on an Acquity UPLC BEH C18 column (50 × 2.1 mm; 1.7 μm).

2.6. Vitamins

The same extracts prepared for the analysis of phenolic compounds were used for the determination of vitamins, which was based on the slightly modified protocol of Santos et al. [27]. Here, 200 μL of the extract was used for the analysis of water-soluble vitamins (B1, B2, B3, B5, B6, B9, and C) and 400 μL for the analysis of lipophilic vitamins (A and E). Hippuric acid was used as an internal standard for both groups of vitamins. The extracts were evaporated in a vacuum at 40 °C until dryness and then re-dissolved in 25 μL of the mobile phase containing 1 μM hippuric acid as an internal standard. Analysis of both water- and fat-soluble vitamins was performed using a Nexera X2 UHPLC system (Shimadzu Handels GmbH), coupled with an MS-8050 device (Shimadzu Handels GmbH). Chromatographic separation was performed on an Acquity UPLC BEH C18 (50 × 2.1 mm, 1.7 μm). The column temperature was 40 °C. The mobile phase consisted of 15 mM formic acid (pH 3; adjusted with NH4OH) (component A) and MeOH (component B). The flow rate was 0.4 mL/min and the injection volume was 2 μL. Gradient elution for water-soluble vitamins was carried out under the following conditions: 0 min 2% B, 3 min 15% B, 4 min 65% B, 4.5 min 65% B, 5 min 2% B, 8 min 2% B. Meanwhile, for the analysis of fat-soluble vitamins, conditions were as follows: 0 min 40% B, 2 min 100% B, 4,5 min 100% B, 4,6 min 40% B, 7 min 40% B.

2.7. Statistical Analysis

Statistical analysis was performed in RStudio (R Software version 4.1.0). First, the effect of variety was assessed, focusing on the control data only. The data were log-transformed, principal component analysis (PCA) was performed, and the respective biplot was constructed. The role of both factors (i.e., condition and variety) and their interaction was examined via compositional tables [28,29]. Two separate analyses were conducted—one for the problem drought vs. control condition and the second for the problem salt vs. control condition. For each of the N = 53 variables, an individual compositional table with I = 6 rows (corresponding to the 6 varieties) and J = 2 columns (corresponding to the control and the given stress condition) was considered. Each of the combinations was represented by the average of 3 replicates (computed via geometric mean). The relative information conveyed in the tables was explored through so-called pivot coordinates for the orthogonal decomposition of compositional tables to independence and interaction tables. The coordinates of interest were visualized in boxplots and the results from PCA performed in the considered coordinate systems were visualized in PCA biplots, computed by generalizing ideas from [30]. More details about the compositional tables approach can be found in the Supplementary Materials.

3. Results and Discussion

3.1. Morphology

Lettuce comes in a variety of colors, sizes, and shapes, and therefore they are grouped into six main types based on the leaf shape, size, texture, head formation, and stem type [31], i.e., crisphead lettuce, butterhead lettuce, romaine or cos lettuce, leaf or cutting lettuce, stem or stalk lettuce, and Latin lettuce. Although there are different classification systems proposed [5], due to the high genetic and morphological diversity among lettuce cultivars, there is no standardized classification protocol, except for the minimum descriptors for leafy vegetables including lettuce [31]. Therefore, we have used the more detailed and complex Czech National Descriptors List for Lactuca sativa L. [32].
The accessions of L. sativa cover different morphotypes and varieties. The set included butterhead, crisphead, cutting and leaf morphotypes, varieties with or without anthocyanins, varieties for greenhouse and field cultivation, landraces, and advanced varieties (Table 2). Variety Altenbursky represents a historical variety of butterhead lettuce for overwintering. Heads are of medium size, with anthocyanin spots on the entire blade surface. Kamenac is an old landrace that exhibits very hard (similar to stone) orbicular heads with crispy small leaves. The other four accessions represent advanced varieties. Dubacek and Robin belong to the so-called leaf lettuces (oak-leaf types), which do not form a head, only having rosettes of leaves, which can be harvested gradually. Unlike Dubacek, Robin contains anthocyanins distributed over the entire surface of the leaves. Variety Jupiter, with medium orbicular heads and tender leaves, is suitable for growing as a summer lettuce. Prazan is a morphotype of iceberg lettuce with medium-sized firm and compact heads and crispy leaves [32].

3.2. Nutritional Value of Lettuce

The content and composition of free sugars, fatty acids, free amino acids, free phenolics, and vitamins in the six lettuce varieties investigated in this study are summarized in Tables S1–S5 (Supplementary Materials). Although these species have different morphological characteristics (Table 2), they are also distinct in chemical composition, which is closely related to their genetic background [5,7,18].
Figure 1 represents the total content of all classes of compounds analyzed in the six lettuce varieties grown under control conditions. Levels of free sugars, including saccharose, glucose, and fructose, were all similar in all investigated species (Figure 1A). Except for var. Robin, all varieties contained higher levels of fructose than glucose (Table S1). Soluble sugar content affects the sweetness of lettuce, which is one of the most important factors for consumer demand and lettuce production [33,34].
The concentrations of free amino acids significantly differed among the varieties (Figure 1B), especially in the case of var. Prazan, which contained considerably higher levels of alanine (ALA) than others (Table S2). On the contrary, the fatty acid profiles did not notably differ between the examined lettuces (Figure 1C). The major fatty acid found in all samples was α-linolenic acid, ranging from 44.15 ± 2.75 to 74.41 ± 16.05 μg/g DW, followed by linoleic acid, ranging from 16.47 ± 3.54 to 30.05 ± 6.54 μg/g DW (Table S3). These data are in agreement with those published before [35]. Considering phenolic compounds, var. Robin, with red-colored leaves, contained the highest levels of these beneficial secondary metabolites, while var. Dubacek contained the least (Figure 1D). The major phenolic acid detected was chlorogenic acid, ranging from 3452.11 ± 356.04 to 9695.02 ± 339.77 μg/g DW, while quercetin was the major representative of flavonoids (Table S4). In addition, the investigated lettuce varieties also varied in the concentrations of vitamins (Figure 1E). Although vitamins B1, B2, B3, B5, B9, C, and E were detected in all samples, ascorbic acid (vitamin C) was the only one detected in significant levels, which ranged from only 0.79 ± 0.11 to 59.89 ± 9.33 μg/g DW (Table S5), which is in accordance with the literature data summarized by Kim et al. [5].
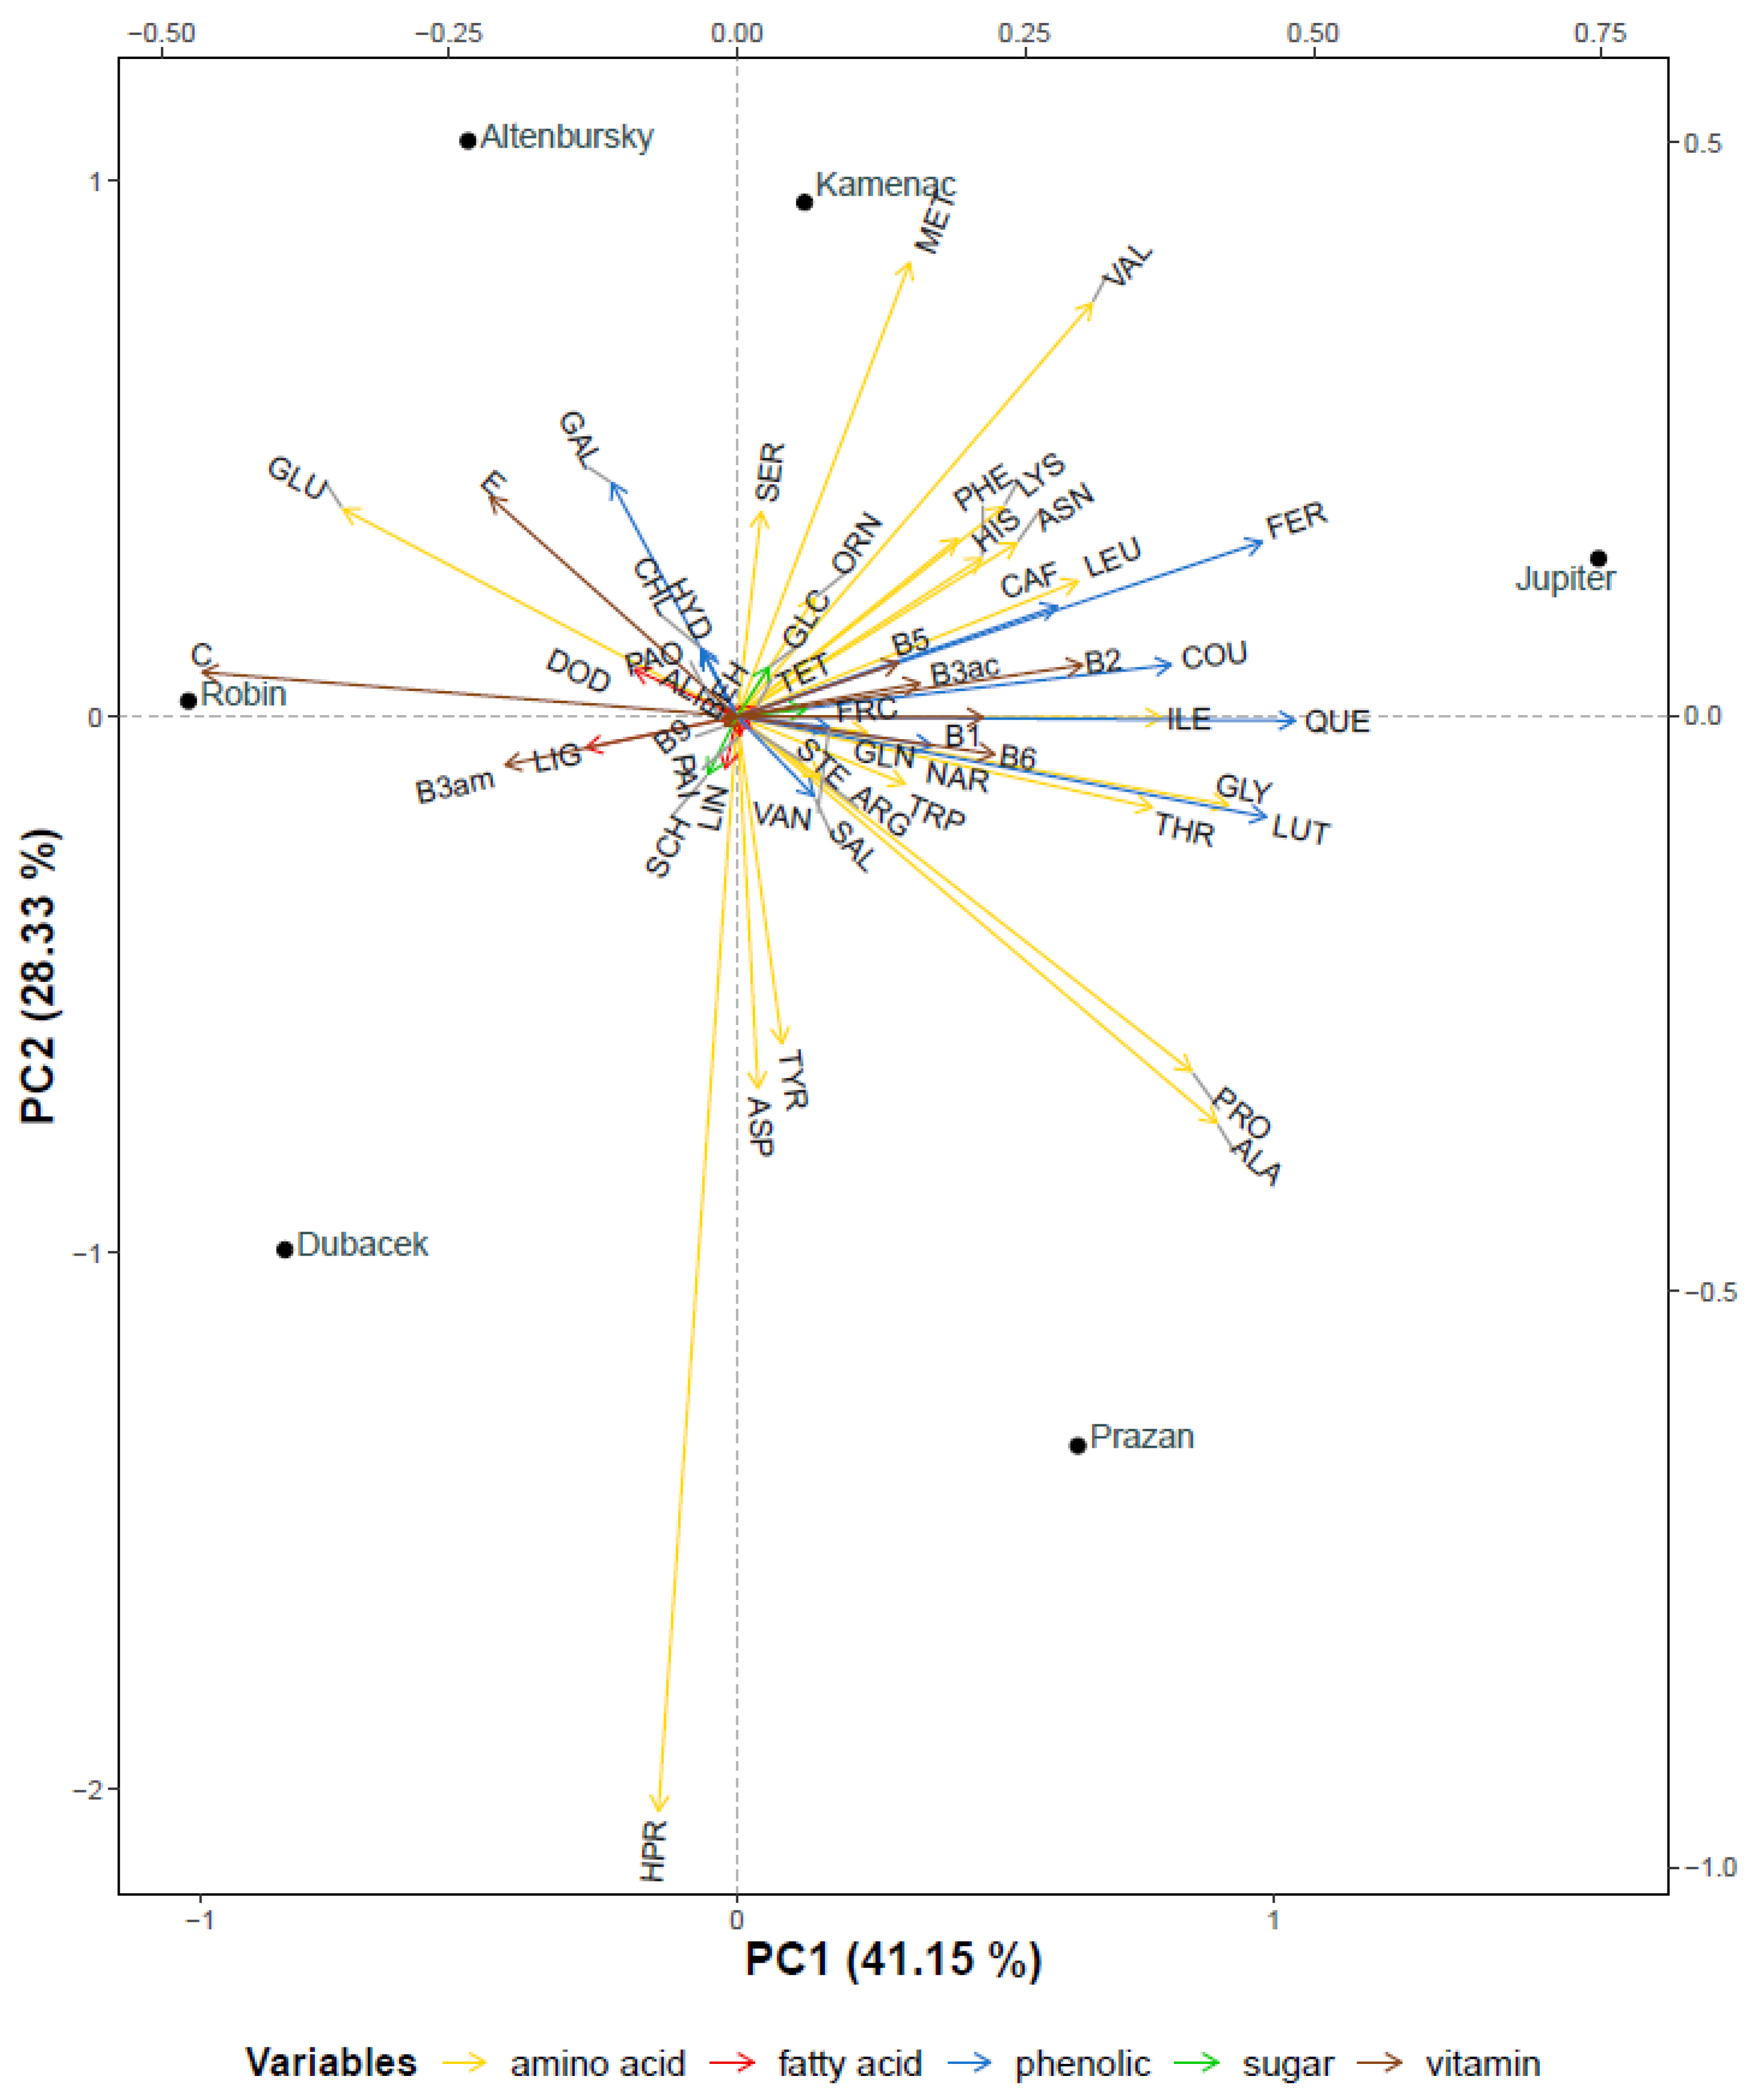
Further, the results of the principal component analysis (PCA) of 53 analytes detected in the six lettuce varieties, including 3 sugars, 21 amino acids, 9 fatty acids, 11 phenolics, and 9 vitamins, were presented as a PCA biplot (Figure 2). Here, 69.48% of the data variability is explained by the first two principal components (41.15% by PC1 and 28.33% by PC2). According to PCA, hydroxyproline (HPR) shows the highest variability across the varieties, i.e., the highest values in varieties Prazan and Dubacek, and the lowest in Altenbursky and Kamenac. Variety Robin has rather lower values of amino acids and conversely higher values of fatty acids, and it differs the most from var. Jupiter. Moreover, the results of this analysis reveal that varieties Altenbursky and Kamenac are chemically the most similar varieties, proving the fact that comprehensive chemical analysis is an important part of the description of plant genotypes. In conclusion, amino acids, but also selected phenolic compounds, are presented as the main markers for the chemical characterization of the investigated lettuce varieties. This fact was also confirmed in our previous study on selected genotypes of medicinal and aromatic plants [36], where amino acids and phenolics, together with terpenes, were confirmed as chemotaxonomic markers.

3.3. Preharvest Abiotic Stress Changes the Nutritional Value of Lettuce

As presented in Figure 3, both salt and drought stress influenced the yields of all six lettuce varieties, but in a different manner. The biomass of the investigated varieties did not decrease significantly for the plants grown under salt stress, in comparison to the decreases when plants were subjected to drought stress.
The previous study showed that salinity decreased the number of leaves significantly, but not the leaf area and fresh weight of the lettuce [10]. In addition, Galieni et al. [9] claim that drought decreases the yield of lettuce by up to 50%. Since the aim of this study was the investigation of health-beneficial secondary metabolites’ profiles and their changes during abiotic stress, here, we did not perform a detailed analysis of physiological traits, such as biomass, leaf size, etc. Therefore, although preliminary, the presented findings are in agreement with those found in the literature.
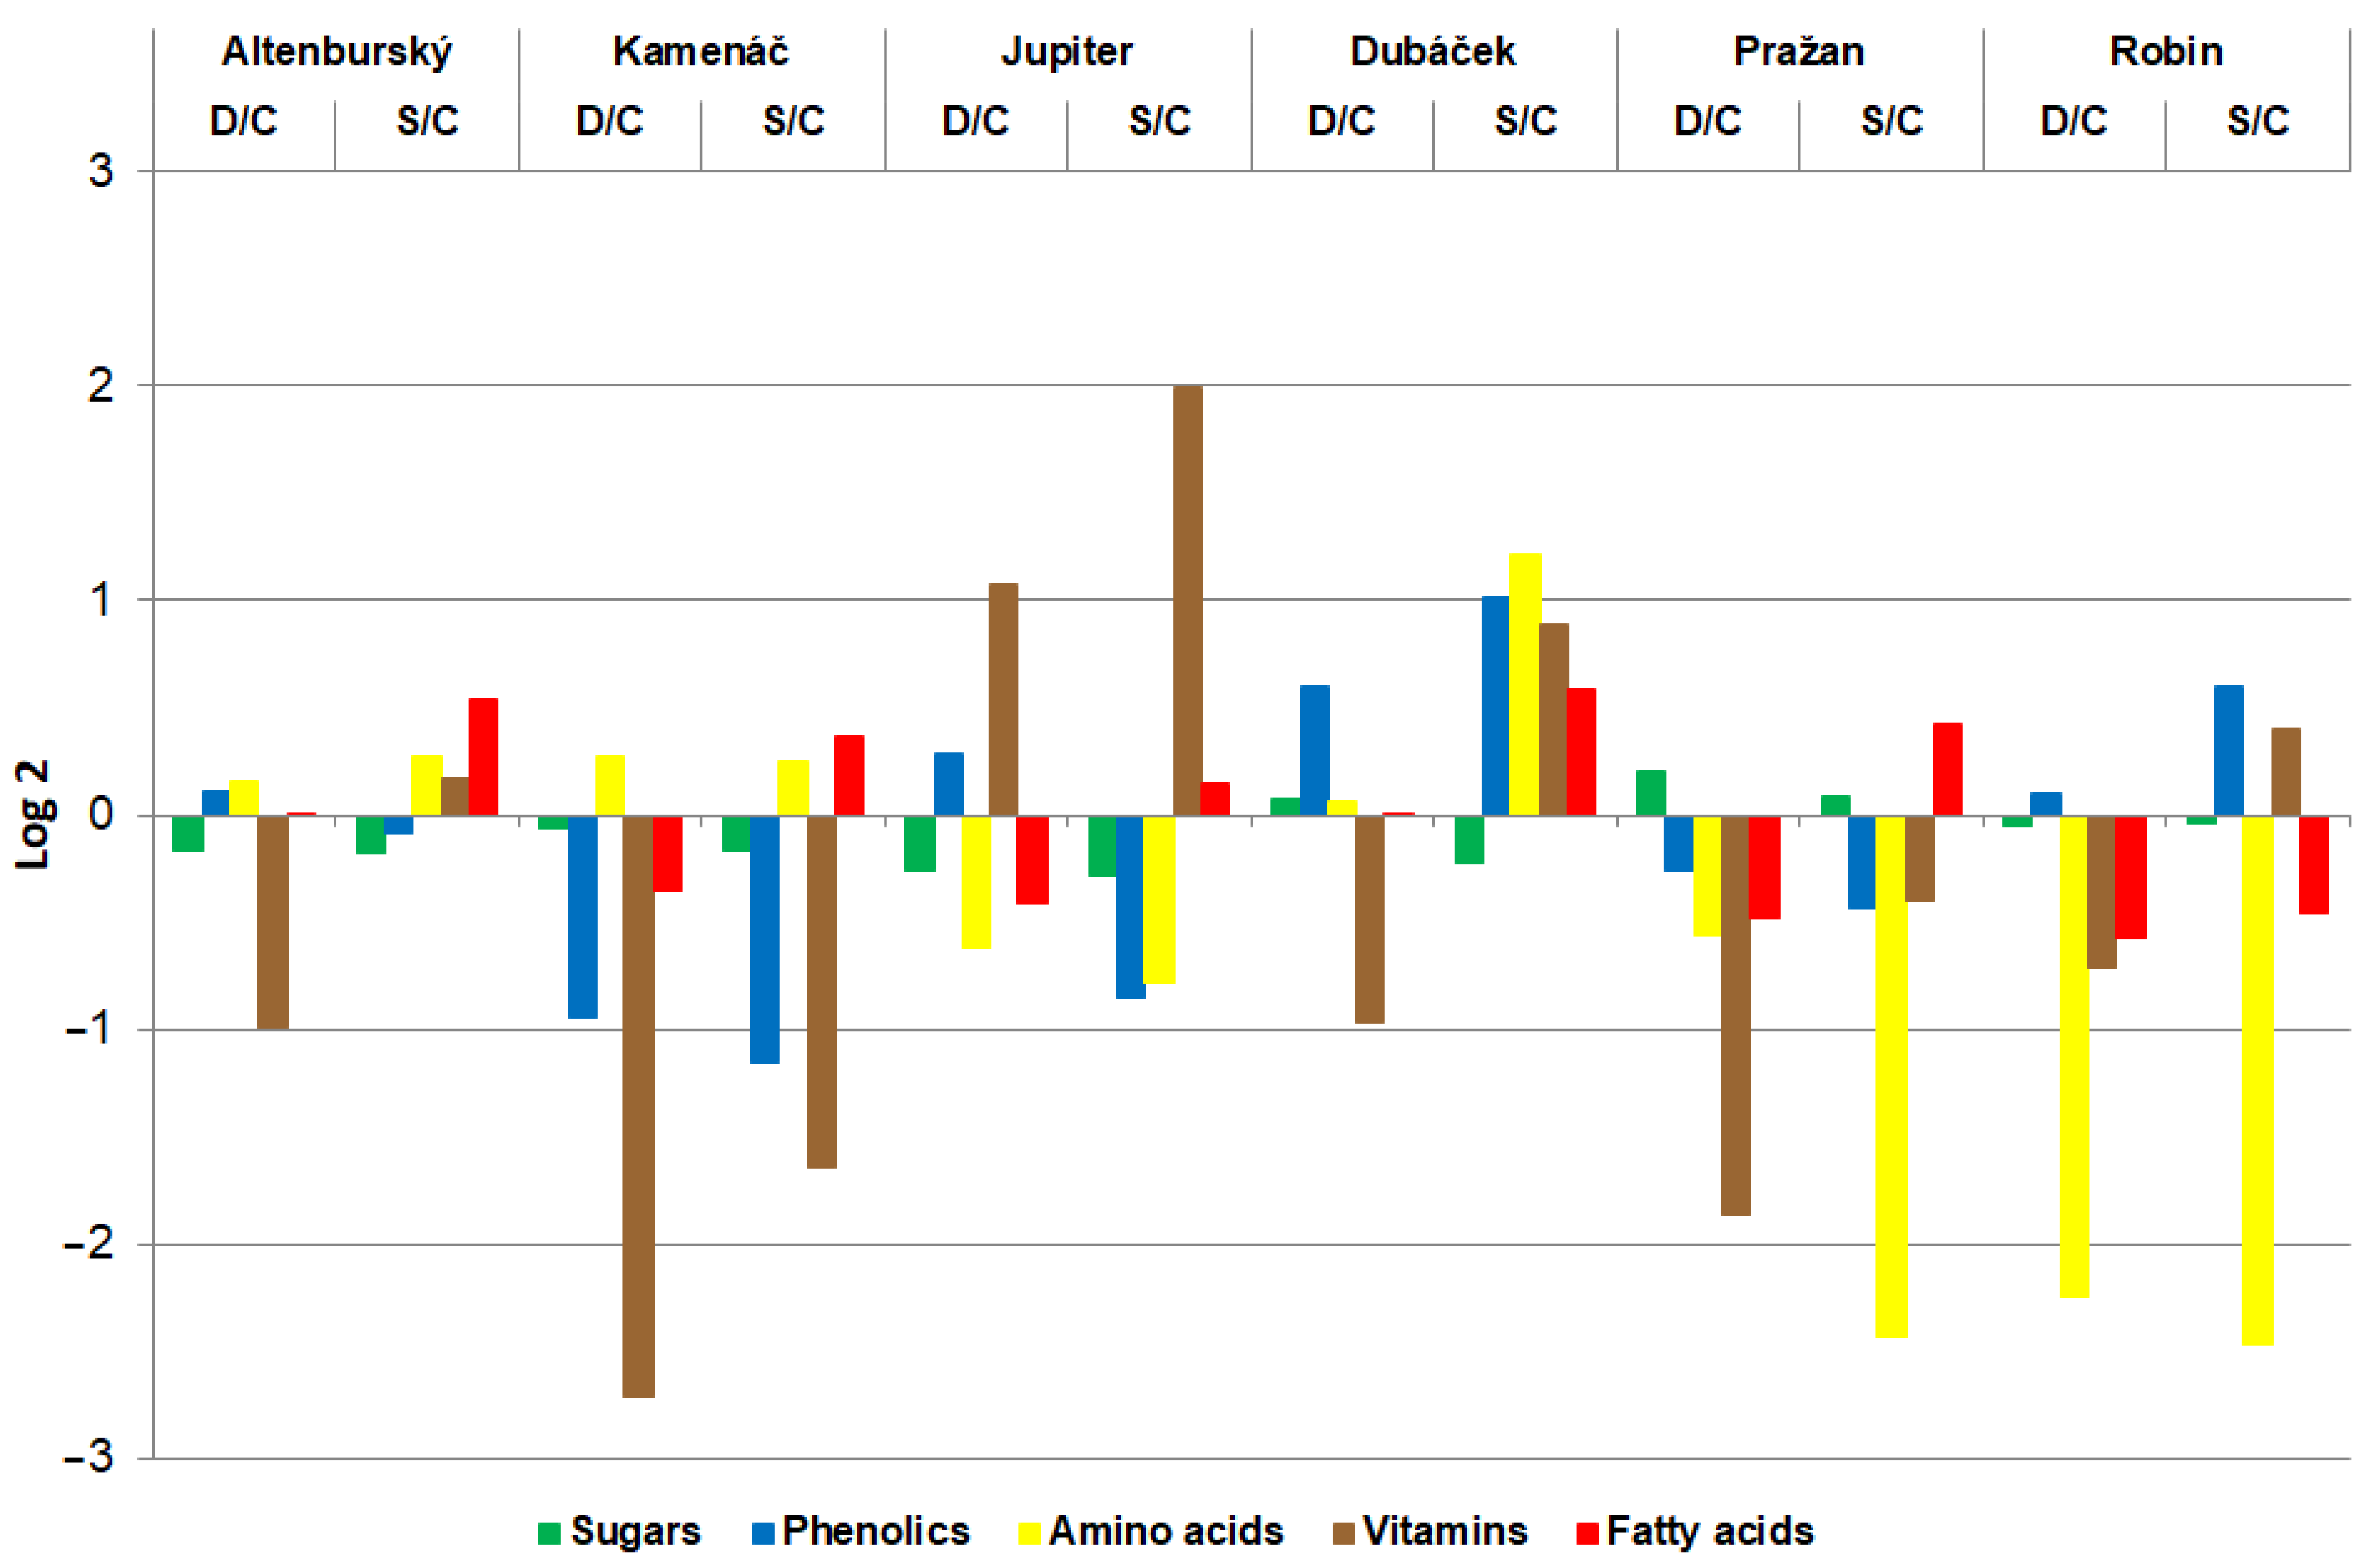
To study the impact of preharvest abiotic stress on selected lettuce varieties, we used advanced statistical analysis, where, in total, 53 variables (analytes) were studied in six varieties grown under control and two stress conditions. Barplots visualizing the log ratios of levels of each class of investigated compounds are summarized in Figure 4. The greatest changes were in the levels of vitamins, following the amino acid and phenolic compounds.
The same barplots visualizing the log ratios of levels for each particular analyte are summarized in Supplementary Figures S1 (drought vs. control) and S2 (salt stress vs. control). In addition, boxplots in Supplementary Figures S3 and S4 represent the dominance of the average value of the given variable in a variety (across control and stress conditions) concerning its average value in the remaining varieties (across control and stress conditions) (coordinates z 1 r l ).
These coordinates are informative for assessing the behavior of the variety by itself. Then, the coordinates z 1 c present the dominance of the average value of the given variable in the stress condition (across all the varieties) concerning its average value in the control condition (across all the varieties). These coordinates enable the identification of which variables change the most under the stress condition; the variables with the lowest (highest, respectively) value of z 1 c are the ones that are overall decreased (increased, respectively) the most. Furthermore, Supplementary Figures S5 and S6 present the dominance of the value of the ratio stress vs. control in the given variable in variety l concerning the average value of these ratios across the remaining varieties. Crucial information from these coordinates identifies which ratios of stress vs. control deviate the most compared to the other varieties. They also help to determine which variety has overall relatively higher (or lower) ratios of stress vs. control.
Overall, drought causes the greatest relative increase in phenolic compounds, mainly flavonoid luteolin (LUT) and phenolic acid p-coumaric acid (COU), followed by selected amino acids, such as proline (PRO) and tryptophan (TRP), and selected B-group vitamins (Figure S3). Conversely, drought causes overall the largest relative decrease in vitamin C, but also in fatty acids and selected amino acids, such as aspartate (ASP), glutamine (GLN), etc. (Figure S3A). In addition, salt stress causes a larger decrease in many metabolites, especially amino acid arginine (ARG). On the other hand, fatty acids are only slightly increased, together with vitamin E (Figure S4A). When each variety is analyzed separately (Figures S3B and S4B), similar information as presented in Figure 2 is obtained. This means that free amino acids, mainly hydroxyproline (HPR) and methionine (MET), but also flavonoids quercetin (QUE) and luteolin (LUT), play the most important role in the chemotaxonomical classification of lettuce varieties grown not only under control but also under stress conditions. It should be emphasized that each variety responded differently to the applied stress. Moreover, it can be concluded that the old variety Altenbursky showed higher plasticity in its chemical profile, whether it was cultivated under controlled or stress conditions. This variety, in contrast to other new, improved cultivars, did not notably change the content and composition of nutritionally important metabolites. Similarly, salt stress did not influence the chemical profile of landrace Kamenac, while drought stress affected the composition more significantly. On the other hand, another variety, Dubacek, showed the highest variations in general when grown under stress conditions (Figures S1–S6).
Roberts and Mattoo [3] recently emphasized that plants synthesize small molecules for protection against extreme environmental conditions. These compounds are called osmoprotectants and their elevated levels correct the cytosolic imbalance caused by stress exposure. Among others, several amino acids, such as glycine (GLY), PRO, ARG, and glutamate (GLU), also act as osmoprotectants. The accumulation of PRO leads to the improved synthesis of cells and their reduced degradation, while ARG was found to operate as a compatible solute to enhance stress tolerance in leaves [1,4]. In addition, sucrose and glucose, as soluble sugars, also serve as osmolytes to alleviate the negative effects of salt stress and also enhance proline content [37]. They play dual functions in gene regulation, as exemplified by the upregulation of growth-related genes and downregulation of stress-related genes [38]. On contrary, increased levels of fructose are related to the biosynthesis of phenolic compounds [39]. Here, changes in the levels (but also their ratios) of saccharose, glucose, and fructose in stressed plants were observed, but they were not as significant as those found for amino acids or phenolic compounds (Table S1, Figures S1 and S2), and they were mainly decreased under stress conditions. In addition, Babaousmail et al. [10] also observed a decrease in sugar content when lettuce plants were subjected to salt stress.
Furthermore, the lettuce varieties studied here had generally lower levels of fatty acids when plants were subjected to drought stress but also accumulated in the plants subjected to salt stress (Table S2, Figures S1 and S2). This could be explained by the fact that fatty acids are one of the structural components of cell membranes, and also provide one of the general defense systems against various biotic and abiotic stresses [4,40]. As a consequence, their levels significantly vary depending on stress and its intensity.
An increase in phenolic compounds is a common response to abiotic stress in lettuce [9,11,40], but the effect of stress can vary depending on the species or varieties studied, as well as on the levels of stressors and the duration of the stress application [4,40,41,42]. The presented findings are in agreement with those found in the literature. Drought initiated the accumulation of phenolic compounds in all six lettuce cultivars (Table S4, Figures S1 and S2) but this was not the case for salt stress. Varieties Dubacek and Robin showed a significant increase in these secondary metabolites, but varieties Kamenac, Jupiter, and Prazan did not. Moreover, the levels of phenolic compounds did not change significantly in the old variety Altnebursky subjected to salt stress. Together with phenolics, vitamins C and E are known as strong radical scavengers and, therefore, are involved in the subsequent downstream stress signaling and responses in plants [43,44]. Their levels varied depending on both stress and the lettuce variety. Nonetheless, it can be concluded that changes in the levels of vitamins C and E correspond with changes in phenolic compounds, i.e., if there is a decrease in phenolics, then there is an increase in vitamins. Regarding B-group vitamins, their levels also varied depending on the variety and applied stress. Generally, the accumulation of this group of vitamins was observed in both stresses, with higher concentrations in the plants that suffered drought stress (Figures S3 and S4). Nonetheless, there was no trend observed, because the concentrations of some of the members of this group increased, and the others decreased. Hanson et al. [45] point out that B vitamins are prone to destruction under stress conditions, since they are metabolic precursors of essential cofactors. These authors concluded that even plants, although they can produce vitamins, might suffer from vitamin B deficiency. However, a study published later indicated that the biosynthesis of vitamin B1 is upregulated in abiotic stress [46], while Huang et al. [47] showed that the levels of vitamin B6 and its vitamers vary during stress application, i.e., they return to normal levels after a certain time.
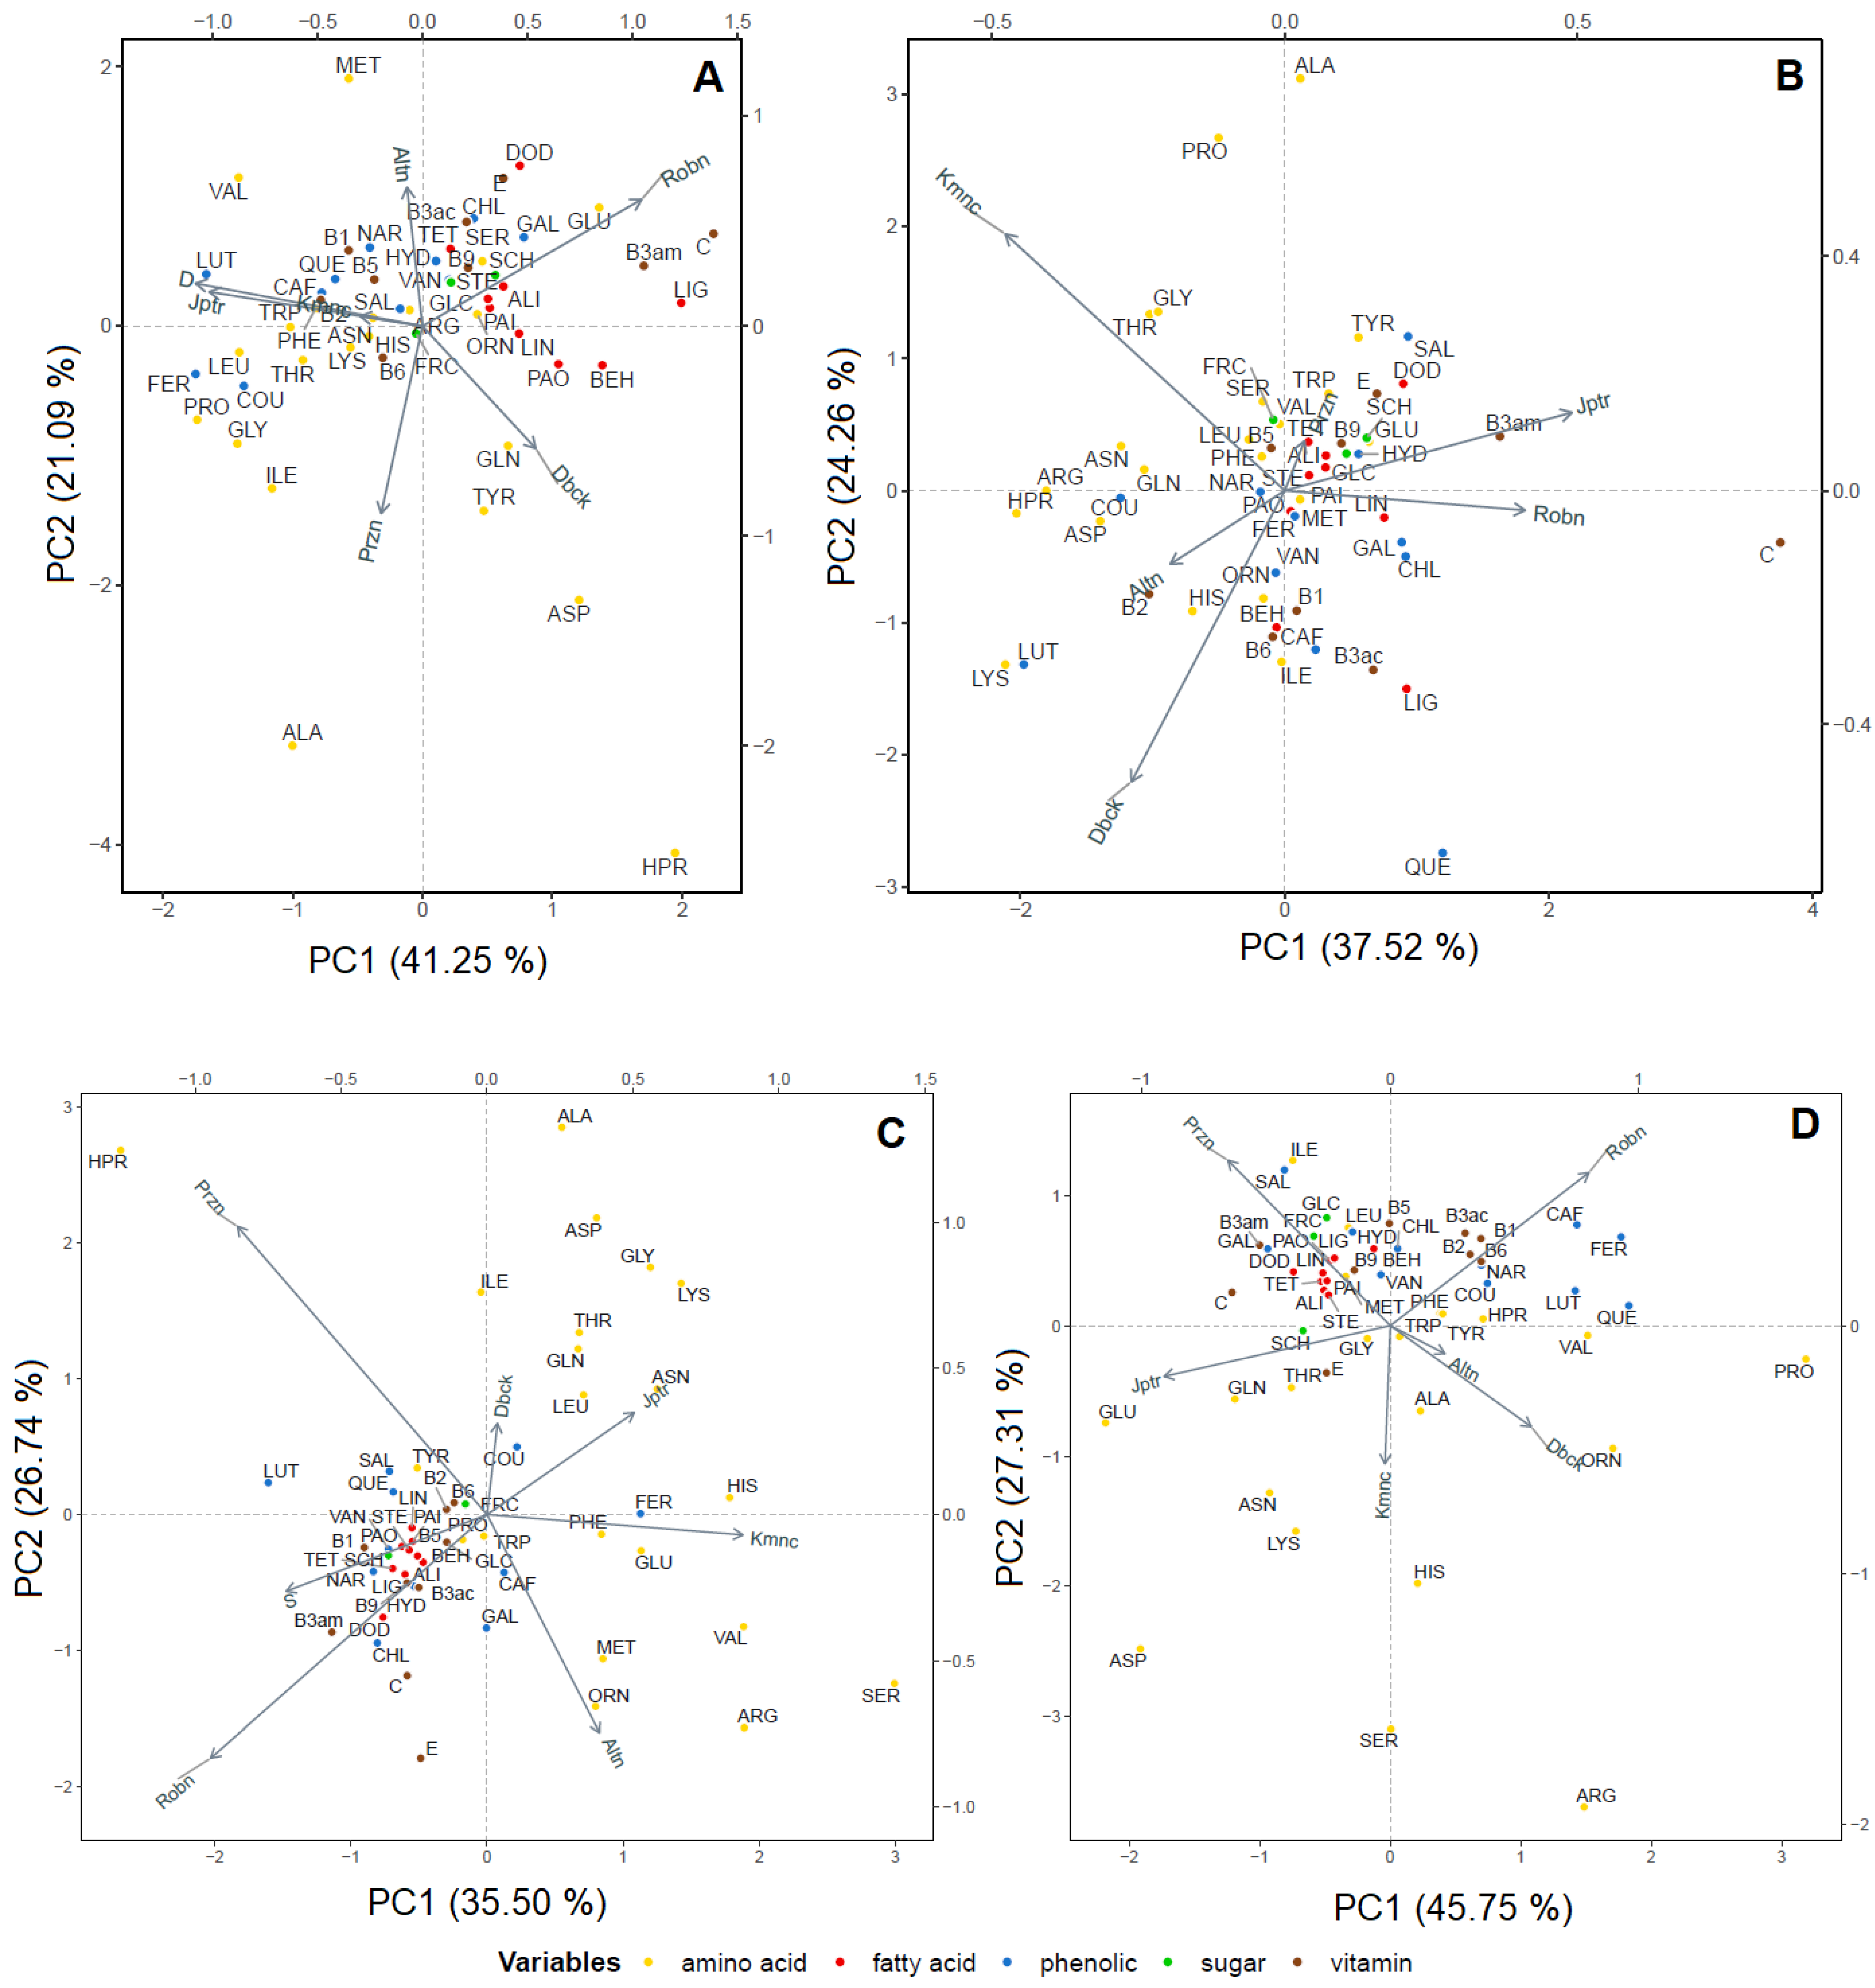
Nevertheless, the PCA analysis of data transformed into coordinates, as described above (Figure 5), summarized all the information presented in Supplementary Figures S1–S6. The PCA biplots of variables from drought vs. control (Figure 5A) and salt vs. control (Figure 5C) were created from the independence tables, and those described in Figure 5B,D from the ainteraction tables for drought vs. control and salt vs. control, respectively. As can be observed from Figure 5A, the variables that are characterized by a high relative increase under drought stress (left located) are roughly those that have higher values in variety Jupiter (arrow representing drought is closest to the arrow representing Jupiter) and lower in variety Robin (arrow pointing in the opposite direction). On the contrary, as can be seen in Figure 5C, the variables that are characterized by a high relative increase under salt stress (left located) are roughly those that have higher values in Robin (arrow representing salt is closest to the arrow representing Robin) and lower in Jupiter (arrow pointing in the opposite direction). Regarding the PCA biplot of the interaction table for drought stress (Figure 5B), 61.78% of the data variability is explained by the first two principal components (37.52% by PC1 and 24.26% by PC2). Here, varieties Kamenac and Dubaček show the greatest deviations from the general trend concerning condition changes (the longest arrows), and Prazan and Altenbursky show the smallest (the shortest arrows). Among the variables that vary the most between the varieties in terms of the effect of drought stress are vitamin C and flavonoids quercetin (QUE) and luteolin (LUT), as well as amino acids LYS, ALA, and PRO (the most outlying points).
Next, 73.06% of the data variability is explained by the first two principal components (45.75% by PC1 and 27.31% by PC2) in the PCA biplot of the interaction table for salt stress (Figure 5D). Here, variety Altenbursky shows the smallest deviations from the general trend concerning condition changes (the shortest arrow). Among the variables that vary the most between the varieties in terms of the effect of salt stress are amino acids (ARG, SER, ASP, HIS, ASN, PRO, ORN, GLU). Dubaček and Pražan are affected by salt stress the most dissimilarly (arrows pointing in the opposite directions, i.e., the variables with relatively high ratios of salt vs. control in Dubaček tend to have relatively low ratios of salt vs. control in Pražan). The same can be observed for varieties Jupiter and Robin.

4. Conclusions

This study aimed to investigate the changes in the nutritional value of six Czech varieties of lettuce (Altenbursky, Dubacek, Kamenac, Jupiter, Prazan, and Robin) when plants were grown under control and stress conditions. Results show that drought causes the largest relative increase in phenolic compounds, followed by some amino acids and selected B-group vitamins, while there was overall the largest relative decrease in vitamin C, but also in fatty acids. Salt stress causes a larger decrease in the amino acid arginine. On the other hand, fatty acids are only slightly increased, together with vitamin E. In addition, the interpretation of data from statistical analysis showed that the old variety Altenbursky had the least changes in its chemical profile when subjected to drought and stress, while salt stress also did not significantly affect the chemical composition of landrace Kamenac. These findings emphasize the need for the cultivation of landraces and old varieties to raise the productivity of staple food crops.

Supplementary Materials

The following supporting information can be downloaded at: https://www.mdpi.com/article/10.3390/agronomy13020398/s1. Compositional tables approach—supplement. Table S1: Free sugar content (mg/g DW) in investigated lettuce varieties grown under normal and stress conditions; Table S2: Free amino acid content (µg/g DW) in investigated lettuce varieties grown under normal and stress conditions; Table S3: Fatty acid content (µg/g DW) in investigated lettuce varieties grown under normal and stress conditions; Table S4: Free phenolic compound content (µg/g DW) in investigated lettuce varieties grown under normal and stress conditions; Table S5: Vitamin content (µg/g DW) in investigated lettuce varieties grown under normal and stress conditions; Figure S1: Barplots visualizing the log ratios of value in drought stress to value in control condition for each of the variables, separately for each of the varieties; Figure S2: Barplots visualizing the log ratios of value in salt stress to value in control condition for each of the variables, separately for each of the varieties; Figure S3: Boxplot of (A) coordinate z_1^c and (B) coordinates z_1^(r(l)) for the case of drought vs. control; Figure S4: Boxplot of (A) coordinate z_1^c and (B) coordinates z_1^(r(l)) for the case of salt stress vs. control; Figure S5: Boxplot of coordinate z_1^(cOR(l)) for the case of drought vs. control; Figure S6: Boxplot of (A) coordinate z_1^(cOR(l)) for the case of salt stress vs. control.

Author Contributions

Conceptualization, S.Ć.Z. and P.T.; methodology, S.Ć.Z.; formal analysis, S.Ć.Z. and I.D.; data curation, N.Š. and K.H.; writing—original draft preparation, S.Ć.Z.; writing—review and editing, S.Ć.Z., I.D., N.Š., K.H. and P.T.; visualization, N.Š. and K.H.; funding acquisition, P.T. All authors have read and agreed to the published version of the manuscript.

Funding

This work was funded by project MZE-RO0423 funded by the Ministry of Agriculture, Czech Republic, and by the project “Plants as a tool for sustainable global development” (registration number: CZ.02.1.01/0.0/0.0/16_019/0000827) within the program Research, Development and Education (OP RDE).

Data Availability Statement

Please contact the corresponding author.

Conflicts of Interest

The authors declare no conflict of interest.

References

  1. Yadav, S.; Modi, P.; Dave, A.; Vijapura, A.; Patel, D.; Patel, M. Effect of Abiotic Stress on Crops. In Sustainable Crop Production; Hasanuzzaman, M., Filho, M.C.M.T., Fujita, M., Nogueira, T.A.R., Eds.; IntechOpen: London, UK, 2020. [Google Scholar] [CrossRef]
  2. Soares, J.C.; Santos, C.S.; Carvalho, S.M.P.; Pintado, M.M.; Vasconcelos, M.W. Preserving the nutritional quality of crop plants under a changing climate: Importance and strategies. Plant Soil 2019, 443, 1–26. [Google Scholar] [CrossRef] [Green Version]
  3. Roberts, D.P.; Mattoo, A.K. Sustainable Agriculture—Enhancing Environmental Benefits, Food Nutritional Quality and Building Crop Resilience to Abiotic and Biotic Stresses. Agriculture 2018, 8, 8. [Google Scholar] [CrossRef] [Green Version]
  4. Stagnari, F.; Galieni, A.; Pisante, M. Drought stress effects on crop quality. In Water Stress and Crop Plants: A Sustainable Approach; Ahmad, P., Ed.; John Wiley & Sons, Ltd.: London, UK, 2016; Volume 2, pp. 375–392. [Google Scholar] [CrossRef]
  5. Kim, M.J.; Moon, Y.; Tou, J.C.; Mou, B.; Waterland, N.L. Nutritional value, bioactive compounds and health benefits of lettuce (Lactuca sativa L.). J. Food Comp. Anal. 2016, 49, 19–34. [Google Scholar] [CrossRef]
  6. Lebeda, A.; Ryder, E.J.; Grube, R.; Doležalová, I.; Křístková, E. Lettuce (Asteraceae; Lactuca spp.). In Genetic Resources, Chromosome Engineering, and Crop Improvement Series, Vol 3—Vegetable Crops; Singh, R., Ed.; CRC Press: Boca Raton, FL, USA, 2007; pp. 377–472. [Google Scholar]
  7. Hartman, Y.; Hooftman, D.A.; Uwimana, B.; Schranz, M.E.; van de Wiel, C.C.; Smulders, M.J.; Visser, R.G.; Michelmore, R.W.; van Tienderen, P.H. Abiotic stress QTL in lettuce crop-wild hybrids: Comparing greenhouse and field experiments. Ecol. Evol. 2014, 4, 2395–2409. [Google Scholar] [CrossRef] [PubMed] [Green Version]
  8. Romani, A.; Pinelli, P.; Galardi, C.; Sani, G.; Cimato, A.; Heimler, D. Polyphenols in greenhouse and open-air-grown lettuce. Food Chem. 2002, 79, 337–342. [Google Scholar] [CrossRef] [Green Version]
  9. Galieni, A.; Di Mattia, C.; De Gregorio, M.; Speca, S.; Mastrocola, D.; Pisante, M.; Stagnari, F. Effects of nutrient deficiency and abiotic environmental stresses on yield, phenolic compounds and antiradical activity in lettuce (Lactuca sativa L.). Sci. Horticult. 2015, 187, 93–101. [Google Scholar] [CrossRef]
  10. Babaousmail, M.; Nili, M.S.; Brik, R.; Saadouni, M.; Yousif, S.K.M.; Omer, R.M.; Osman, N.A.; Alsahli, A.A.; Ashour, H.; El-Taher, A.M. Improving the tolerance to salinity stress in lettuce plants (Lactuca sativa L.) using exogenous application of salicylic acid, yeast, and zeolite. Life 2022, 12, 1538. [Google Scholar] [CrossRef]
  11. Paim, B.T.; Crizel, R.L.; Siebeneichler, J.T.; Rodrigues, V.R.; Rombaldi, C.V.; Galli, V. Mild drought stress has potential to improve lettuce yield and quality. Sci. Hortic. 2020, 272, 109578. [Google Scholar] [CrossRef]
  12. Šamec, D.; Linić, I.; Salopek-Sondi, B. Salinity Stress as an elicitor for phytochemicals and minerals accumulation in selected leafy vegetables of Brassicaceae. Agronomy 2021, 11, 361. [Google Scholar] [CrossRef]
  13. Sarker, U.; Oba, S. Drought stress enhances nutritional and bioactive compounds, phenolic acids and antioxidant capacity of Amaranthus leafy vegetable. BMC Plant Biol. 2018, 18, 258. [Google Scholar] [CrossRef] [PubMed] [Green Version]
  14. Sarker, U.; Oba, S. Salinity stress enhances color parameters, bioactive leaf pigments, vitamins, polyphenols, flavonoids and antioxidant activity in selected Amaranthus leafy vegetables. J. Sci. Food. Agric. 2019, 99, 2275–2284. [Google Scholar] [CrossRef]
  15. Hossain, M.N.; Sarker, U.; Raihan, M.S.; Al-Huqail, A.A.; Siddiqui, M.H.; Oba, S. Influence of salinity stress on color parameters, leaf pigmentation, polyphenol and flavonoid contents, and antioxidant activity of Amaranthus lividus leafy vegetables. Molecules 2022, 27, 1821. [Google Scholar] [CrossRef] [PubMed]
  16. Šamec, D.; Karalija, E.; Šola, I.; Vujcić Bok, V.; Salopek-Sondi, B. The role of polyphenols in abiotic stress response: The influence of molecular structure. Plants 2021, 10, 118. [Google Scholar] [CrossRef]
  17. Rahman, M.M.; Rahaman, M.S.; Islam, M.R.; Rahman, F.; Mithi, F.M.; Alqahtani, T.; Almikhlafi, M.A.; Alghamdi, S.Q.; Alruwaili, A.S.; Hossain, M.S.; et al. Role of phenolic compounds in human disease: Current knowledge and future prospects. Molecules 2021, 27, 233. [Google Scholar] [CrossRef]
  18. Missio, J.C.; Rivera, A.; Figàs, M.R.; Casanova, C.; Camí, B.; Soler, S.; Simó, J. A comparison of landraces vs. modern varieties of lettuce in organic farming during the winter in the Mediterranean area: An approach considering the viewpoints of breeders, consumers, and farmers. Front. Plant Sci. 2018, 9, 1491. [Google Scholar] [CrossRef]
  19. Campbell, L.G.; Snow, A.A. Competition alters life history and increases the relative fecundity of crop–wild radish hybrids (Raphanus spp.). New Phytol. 2007, 173, 648–660. [Google Scholar] [CrossRef]
  20. Dwivedi, S.L.; Ceccarelli, S.; Blair, M.W.; Upadhyaya, H.D.; Are, A.K.; Ortiz, R. Landrace germplasm for improving yield and abiotic stress adaptation. Trends Plant Sci. 2016, 21, 31–42. [Google Scholar] [CrossRef]
  21. GRIN Czech Release 1.10.3. Plant Genetic Resources Documentation System of the Czech Republic. Available online: https://grinczech.vurv.cz/gringlobal/search.aspx (accessed on 14 December 2022).
  22. Descriptor List for Lactuca sativa L. Plant Genetic Resources in the Czech Republic. Available online: https://www.gzr.cz/klasifikatory/ (accessed on 14 December 2022).
  23. O’Donoghue, E.M.; Somerfield, S.D.; Shaw, M.; Bendall, M.; Hedderly, D.; Eason, J.; Sims, I. Evaluation of carbohydrates in Pukekohe Longkeeper and Grano cultivars of Allium cepa. J. Agric. Food Chem. 2004, 52, 5383–5390. [Google Scholar] [CrossRef]
  24. Carvalho, A.P.; Malcata, F.X. Optimization of omega-3 fatty acid production by microalgae: Crossover effects of CO2 and light intensity under batch and continuous cultivation modes. Mar. Biotechnol. 2005, 7, 381–388. [Google Scholar] [CrossRef]
  25. Abdelhakim, L.O.A.; Mendanha, T.; Palma, C.F.F.; Vrobel, O.; Štefelová, N.; Ćavar Zeljković, S.; Tarkowski, P.; De Diego, N.; Wollenweber, B.; Rosenqvist, E.; et al. Elevated CO2 improves the physiology but not the final yield in spring wheat genotypes subjected to heat and drought stress during anthesis. Front. Plant Sci. 2022, 13, 824476. [Google Scholar] [CrossRef]
  26. Ćavar Zeljković, S.; Šišková, J.; Komzáková, K.; De Diego, N.; Kaffková, K.; Tarkowski, P. Phenolic compounds and biological activity of selected Mentha species. Plants 2021, 10, 550. [Google Scholar] [CrossRef]
  27. Santos, J.; Mendiola, J.A.; Oliveira, M.B.; Ibáñez, E.; Herrero, M. Sequential determination of fat- and water-soluble vitamins in green leafy vegetables during storage. J. Chromatogr. A 2012, 1261, 179–188. [Google Scholar] [CrossRef] [PubMed]
  28. Facevicová, K.; Hron, K.; Todorov, V.; Templ, M. Compositional tables analysis in coordinates: Compositional tables analysis in coordinates. Scand. J. Stat. 2016, 43, 962–977. [Google Scholar] [CrossRef]
  29. Facevicová, K.; Hron, K.; Todorov, V.; Templ, M. General approach to coordinate representation of compositional tables. Scand. J. Stat. 2018, 45, 879–899. [Google Scholar] [CrossRef]
  30. Kynclová, P.; Filzmoser, P.; Hron, K. Compositional biplots including external non-compositional variables. Statistics 2016, 50, 1132–1148. [Google Scholar] [CrossRef]
  31. ECPGR. Minimum Descriptors for Leafy Vegetables: Cultivated Lettuce, Wild Lactuca spp., Spinach, Leaf Chicory, Witloof, Endive, Root Chicory; ECPGR: Brussels, Belgium, 2009; Available online: https://www.ecpgr.cgiar.org/fileadmin/templates/ecpgr.org/upload/NW_and_WG_UPLOADS/LeafyVeg_misc/LeafyVeg_MinDescr.pdf (accessed on 16 December 2022).
  32. Hýbl, M.; Doležalová, I.; Stavělíková, H.; Kopecký, P.; Neugebauerová, J. Sekce Zelenin H. A. In Přehled a Popis Odrůd Zemědělských Plodin od Počátku Československého a Českého Šlechtění do Roku 2000. I. Polní a Zahradní Plodiny Mimo Ovocných Dřevin; Holubec, V., Ed.; VÚRV, v.v.i.: Praha, Czech Republic, 2017; pp. 205–318. [Google Scholar]
  33. Mou, B. Lettuce. In Handbook of Plant Breeding, Volume I: Vegetables I: Asteraceae, Brassicaceae, Chenopodicaceae, and Cucurbitaceae; Prohens, J., Nuez, F., Eds.; Springer: New York, NY, USA, 2008; pp. 75–116. [Google Scholar]
  34. Chadwick, M.; Gawthrop, F.; Michelmore, R.W.; Wagstaff, C.; Methven, L. Perception of bitterness, sweetness and liking of different genotypes of lettuce. Food Chem. 2016, 197, 66–74. [Google Scholar] [CrossRef]
  35. Le Guedard, M.; Schraauwers, B.; Larrieu, I.; Bessoule, J.J. Development of a biomarker for metal bioavailability: The lettuce fatty acid composition. Environ. Toxicol. Chem. 2008, 27, 1147–1151. [Google Scholar] [CrossRef]
  36. Ćavar Zeljković, S.; Aucique-Perez, C.E.; Stefelova, N.; De Diego, N. Optimizing growing conditions for hydroponic farming of selected medicinal and aromatic plants. Food Chem. 2022, 375, 131845. [Google Scholar] [CrossRef]
  37. Sami, F.; Yusuf, M.; Faizan, M.; Faraz, A.; Hayat, S. Role of sugars under abiotic stress. Plant Physiol. Biochem. 2016, 109, 54–61. [Google Scholar] [CrossRef]
  38. Rosa, M.; Prado, C.; Podazza, G.; Interdonato, R.; González, J.A.; Hilal, M.; Prado, F.E. Soluble sugars-metabolism, sensing and abiotic stress: A complex network in the life of plants. Plant Signal Behav. 2009, 4, 388–393. [Google Scholar] [CrossRef] [Green Version]
  39. Toscano, S.; Trivellini, A.; Cocetta, G.; Bulgari, R.; Francini, A.; Romano, D.; Ferrante, A. Effect of preharvest abiotic stresses on the accumulation of bioactive compounds in horticultural produce. Front. Plant Sci. 2019, 10, 1212. [Google Scholar] [CrossRef] [Green Version]
  40. He, M.; Ding, N.Z. Plant unsaturated fatty acids: Multiple roles in stress response. Front Plant Sci. 2020, 11, 562785. [Google Scholar] [CrossRef]
  41. Sgherri, C.; Pérez-López, U.; Micaelli, F.; Miranda-Apodaca, J.; Mena-Petite, A.; Muñoz-Rueda, A.; Quartacci, M.F. Elevated CO2 and salinity are responsible for phenolics-enrichment in two differently pigmented lettuces. Plant Physiol. Biochem. 2017, 115, 269–278. [Google Scholar] [CrossRef]
  42. Oh, M.M.; Carey, E.E.; Rajashekar, C.B. Regulated water deficits improve phytochemical concentration in lettuce. J. Am. Soc. Hortic. Sci. 2010, 135, 223–229. [Google Scholar] [CrossRef] [Green Version]
  43. Akram, N.A.; Shafiq, F.; Ashraf, M. Ascorbic acid—A potential oxidant scavenger and its role in plant development and abiotic stress tolerance. Front. Plant Sci. 2017, 8, 613. [Google Scholar] [CrossRef]
  44. García-García, A.L.; García-Machado, F.J.; Borges, A.A.; Morales-Sierra, S.; Boto, A.; Jiménez-Arias, D. Pure organic active compounds against abiotic stress: A biostimulant overview. Front. Plant Sci. 2020, 11, 575829. [Google Scholar] [CrossRef]
  45. Hanson, A.D.; Beaudoin, G.A.; McCarty, D.R.; Gregory, J.F., 3rd. Does abiotic stress cause functional B vitamin deficiency in plants? Plant Physiol. 2016, 172, 2082–2097. [Google Scholar] [CrossRef] [Green Version]
  46. Fitzpatrick, T.B.; Chapman, L.M. The importance of thiamine (vitamin B1) in plant health: From crop yield to biofortification. J. Biol. Chem. 2020, 295, 12002–12013. [Google Scholar] [CrossRef]
  47. Huang, S.; Zhang, J.; Wang, L.; Huang, L. Effect of abiotic stress on the abundance of different vitamin B6 vitamers in tobacco plants. Plant Physiol. Biochem. 2013, 66, 63–67. [Google Scholar] [CrossRef]
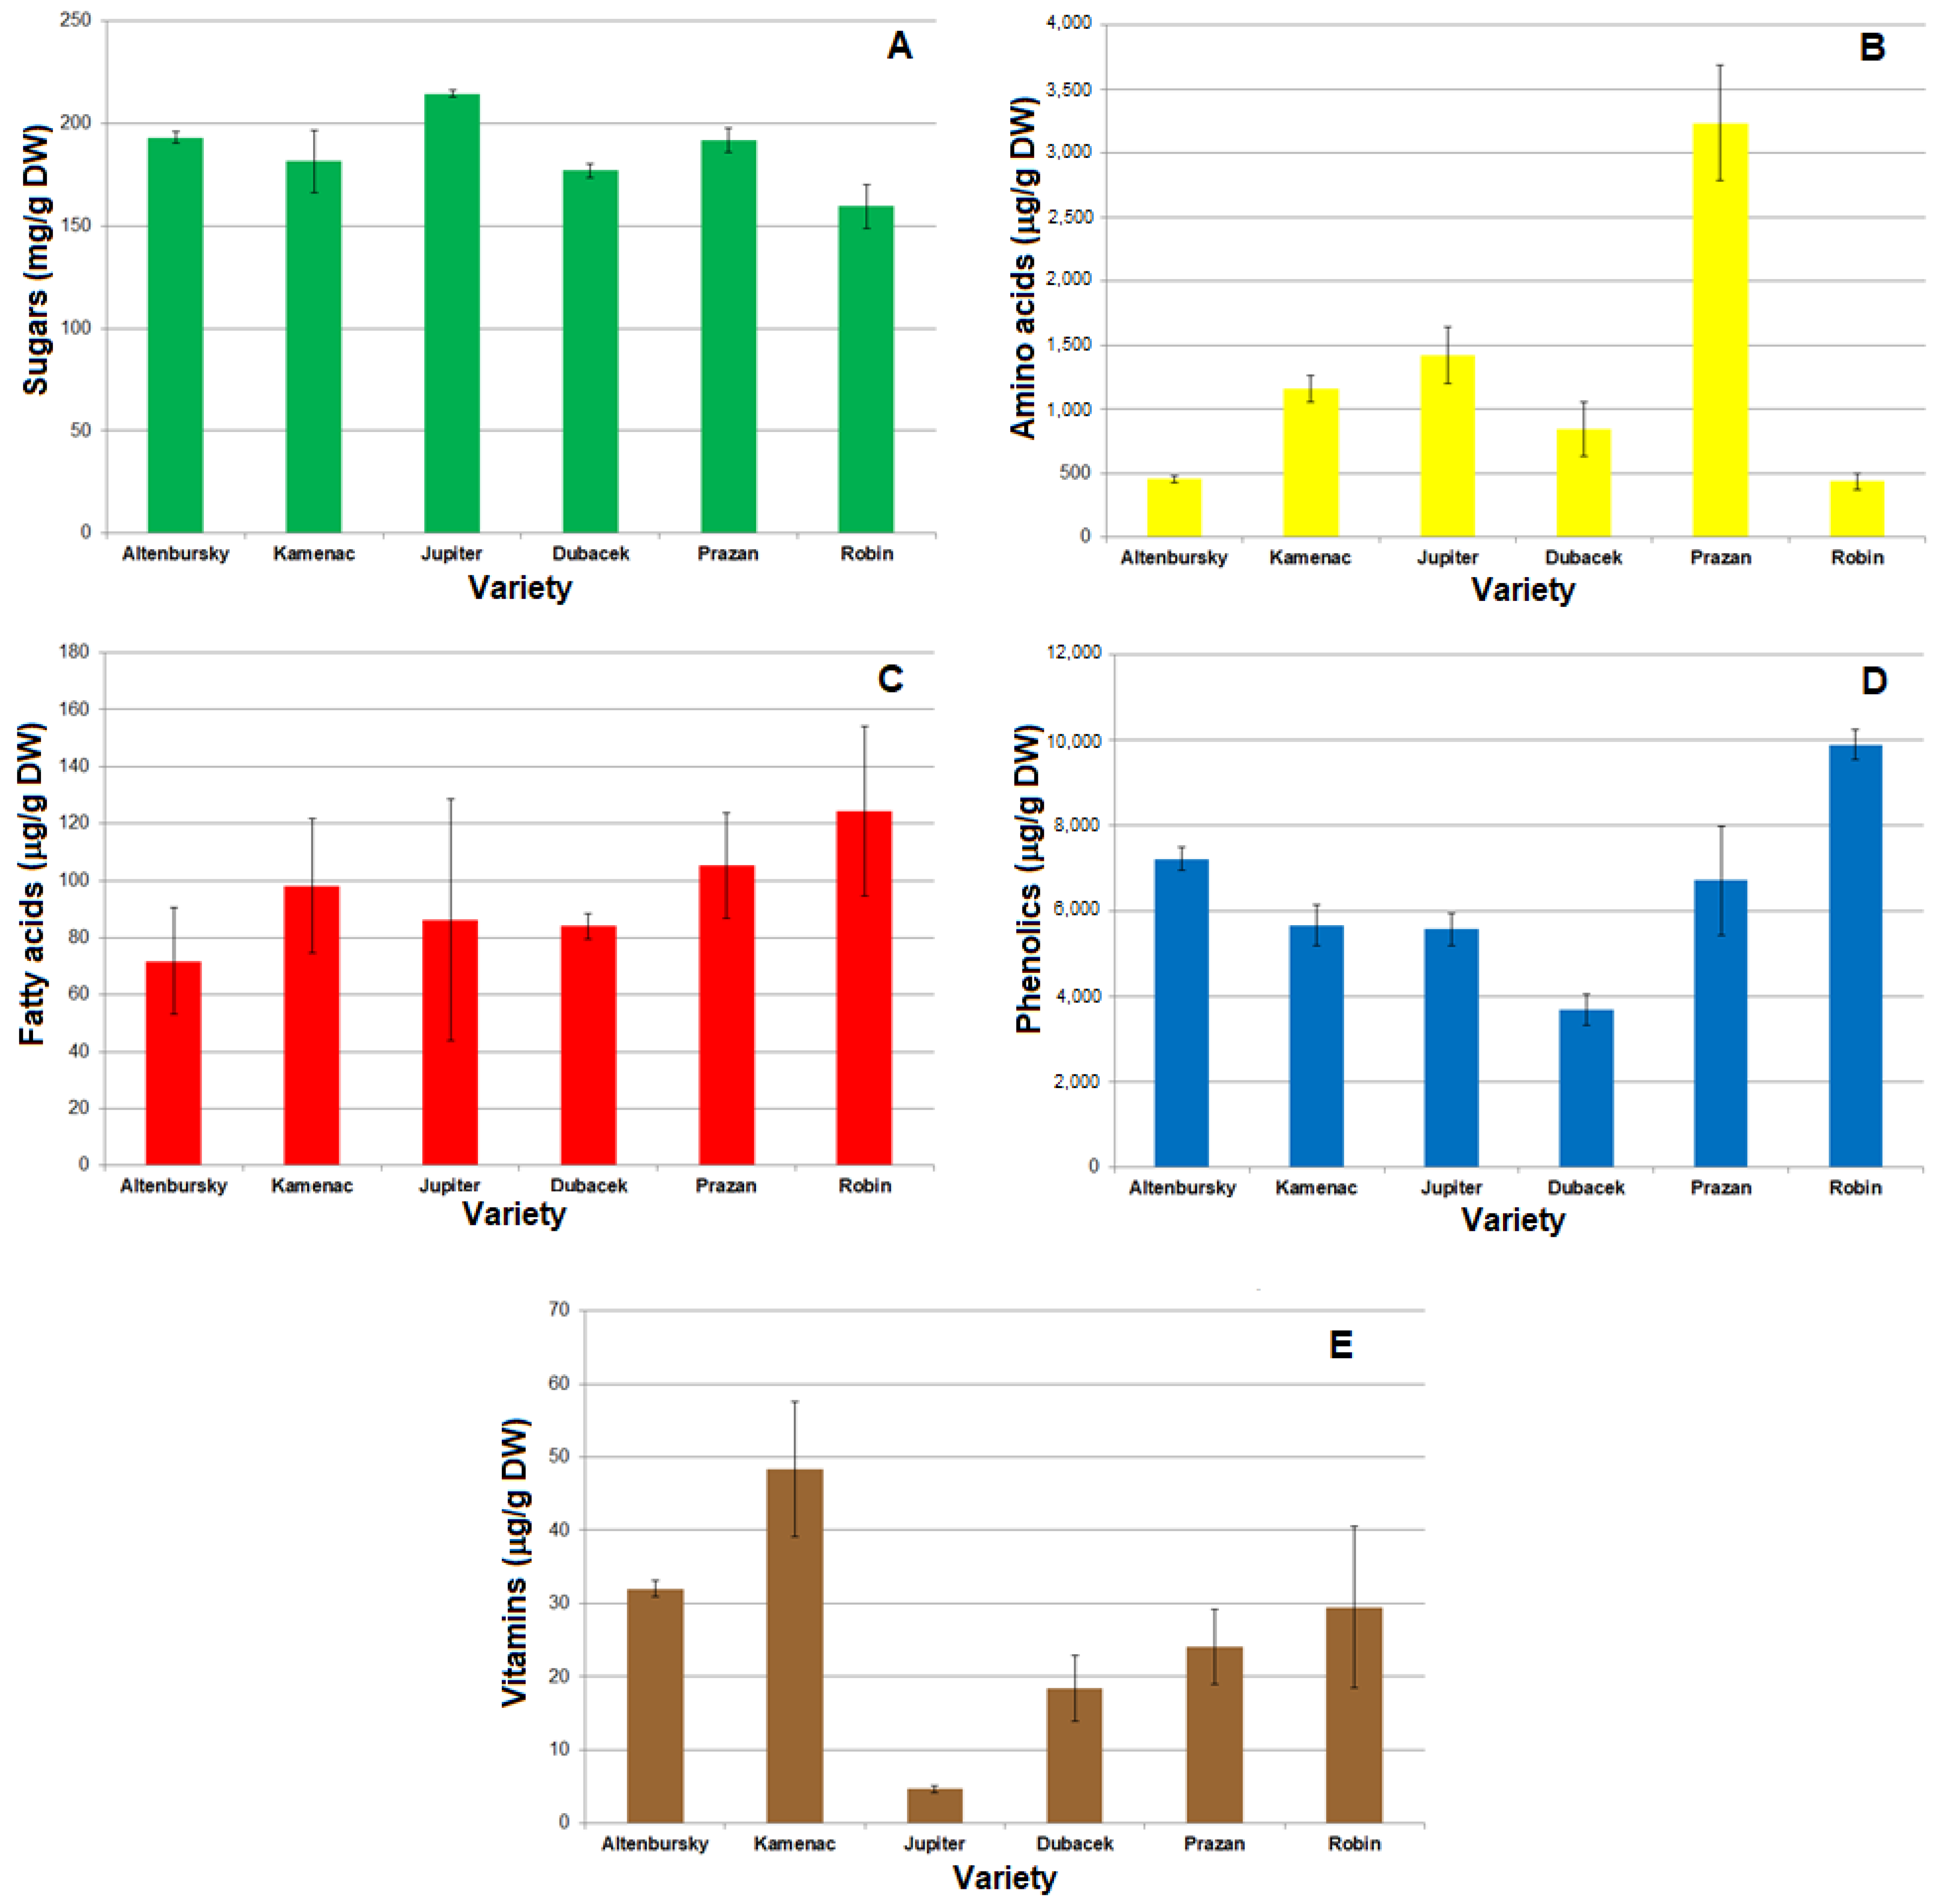
Figure 1. The total content of (A) free sugars, (B) free amino acids, (C) fatty acids, (D) free phenolics, and (E) vitamins in six lettuce varieties grown under control conditions.
Agronomy 13 00398 g001
Figure 2. PCA biplot of the chemical composition of six lettuce varieties grown under control conditions.
Agronomy 13 00398 g002
Figure 3. Lettuce varieties immediately before harvest. From left to right: control, salt stress, drought stress. (A) Altenbursky, (B) Kamenac, (C) Jupiter, (D) Dubacek, (E) Prazan, (F) Robin.
Agronomy 13 00398 g003
Figure 4. Barplots visualizing the log aratios of the total value of each class of analyzed compounds in drought stress (D) and salt stress (S) to value in the control condition (C).
Agronomy 13 00398 g004
Figure 5. PCA biplots for independence (A) and interaction tables (B) for the case of drought vs. control, and the case of salt stress vs. control, (C,D), respectively. The points are labeled with the abbreviated variables’ names. The labels of the arrows substitute the names of the coordinates: D, respectively S, stands for z 1 c (A,C); the abbreviations of varieties refer to the superscript l in coordinates z 1 r l (A,C), respectively coordinates z 1 O R l (B,D).
Agronomy 13 00398 g005
Table 1. List of lettuce varieties used in this study.
ECNVarietyMorphotypeStatus
09H5700021Altenburskybutterhead for overwinteringtraditional cultivar
09H5700047Kamenacbutterheadlandrace
09H5700712Jupiterbutterheadadvanced/improved cultivar
09H5700835Dubacekcuttingadvanced/improved cultivar
09H5700841Prazancrispheadadvanced/improved cultivar
09H5701144Robinleaf redadvanced/improved cultivar
Table 2. Morphological and phenological traits of lettuce cultivars following the Descriptors List for Lactuca sativa L. [32].
Crop TraitPhenotypical Expression of Crop Trait
AltenburskyKamenacJupiterDubacekPrazanRobin
Young leaf
Anthocyanin distributionentire blade surfaceabsentabsentabsentabsententire blade surface
Anthocyanin patterndiffusedndndndnddiffused
Shape of bladebroad ellipticorbicularellipticorbicularorbicularspathulate
Division of blade nonenonenonepinnatipart (<2/3)nonepinnatipart (<2/3)
Venationpinnatepinnatepinnatepinnatepinnatepinnate
Outer adult leaf
Colourgreengreengreengreengreenred and green
Anthocyanin distributionentire blade surfaceabsentabsentabsentabsententire blade surface
Anthocyanin patternin spotsndndndndin spots
Blisteringmoderatemoderateslightnoneextensiveslight
Size of head and/or rosettemedium
(25–40 cm)
small
(<25 cm)
medium
(25–40 cm)
medium
(25–40 cm)
medium
(25–40 cm)
large
(>40 cm)
Leaf head
Shape in vertical sectionellipticorbicularorbicularndbroad ellipticnd
Overlapping of leavespartialpartialpartialnonepartialnone
Firmnessmediumhighmediumndmediumnd
Stem length including inflorescencemedium
(50–80 cm)
medium
(50–80 cm)
medium
(50–80 cm)
medium
(50–80 cm)
high
(>80 cm)
high
(>80 cm)
Fruit seed coat colorgrey whitebrowngrey whitegrey whitegrey whitebrown
Bolting (days after sowing)late (>70)late (>70)late (>70)late (>70)late (>70)late (>70)
Flowering (days after sowing)late (>80)late (>80)late (>80)late (>80)late (>80)late (>80)
nd—not determined.
Disclaimer/Publisher’s Note: The statements, opinions and data contained in all publications are solely those of the individual author(s) and contributor(s) and not of MDPI and/or the editor(s). MDPI and/or the editor(s) disclaim responsibility for any injury to people or property resulting from any ideas, methods, instructions or products referred to in the content.