Article

Impact of Drought Stress on Yield-Related Agronomic Traits of Different Genotypes in Spring Wheat

1
College of Agronomy, Xinjiang Agricultural University, Urumqi 830052, China
2
Xinjiang Key Laboratory of Crop Biotechnology/Key Laboratory of Crop Ecophysiology and Farming System in Desert Oasis Region, Ministry of Agriculture, Institute of Nuclear and Biological Technologies, Xinjiang Academy of Agricultural Sciences, Urumqi 830091, China
3
State Key Laboratory of Crop Stress Biology for Arid Areas, College of Agronomy, Northwest A&F University, Yangling 712100, China
4
Xinjiang Laboratory of Special Environmental Microbiology, Institute of Applied Microbiology, Xinjiang Academy of Agricultural Sciences, Urumqi 830091, China
*
Authors to whom correspondence should be addressed.
These authors contributed equally to this work.
Agronomy 2023, 13(12), 2968; https://doi.org/10.3390/agronomy13122968
Submission received: 21 October 2023 / Revised: 23 November 2023 / Accepted: 24 November 2023 / Published: 30 November 2023
(This article belongs to the Special Issue The Environmental Adaptation of Wheat)

Abstract

:
Drought stress is one of the major abiotic stresses to wheat worldwide, with negative effects on wheat growth and yield. Assessing genetic variation and drought stress tolerance of key agronomic and physiological traits of spring wheat and screening germplasm resources for higher drought tolerance and yield stability are a prerequisite for developing new, better-adapted spring wheat varieties. This study evaluated nine important agronomic and physiological traits in 152 spring wheat cultivars under non-stress (NS) and drought-stress (DS) conditions. Under DS conditions, grain yield per plot (GYP) and grain weight per spike (GWE) were significantly reduced by 33.8% and 31.7%, and their drought-tolerance indexes (DIs) were only 0.66 and 0.69, respectively, indicating that GYP and GWE are the most susceptible traits to drought stress. The SPAD value of flag leave at flowering stage decreased by 13.9% under DS conditions, and the DI of SPAD was 0.86. In addition, DI-SPAD was significantly positively correlated with DIs of plant height (PH), grain number per spikelet (GPS), grain number per spike (GNS), GWE and GYP, indicating that the drought tolerance and yield of wheat are closely related to chlorophyll retention. Six wheat germplasm accessions were identified for their ability to sustain grain yield and improve drought tolerance simultaneously. These results provide insights into the genetic co-variation between grain yield and drought stress tolerance and provide a theoretical basis for the development of new wheat cultivars with excellent drought tolerance and high yields in the presence and absence of drought.

1. Introduction

Among the many effects of climate change that can severely disrupt agricultural production, water scarcity and the unpredictable nature of drought represent one of the largest threats to wheat [1,2]. In particular, inadequate water resources often limit wheat production, with insufficient irrigation leading to direct consequences on yield [3]. This confluence of issues tothreatens global food security and highlights the urgency of resolving the complicated mechanisms underlying drought tolerance in wheat [4]. Along with the increasing drought stress induced by global warming, the identification of accessions that exhibit tolerance to drought stress has been regarded as one of the most critical tasks for research into genetic improvement in wheat [5,6,7]. Therefore, dissecting wheat responses to drought stress is indispensable for the current and future improvement of wheat.
Drought stress at critical growth stages is a major factor in decreasing crop yield [8,9]. In particular, short spells of severe drought stress around flowering can cause drastic abortion of male and female gametes, resulting in irreversibly reduced fertility and grain number per spike [10,11,12,13,14]. Severe drought stresses can even lead to complete crop failure, due to the abrupt termination of the crop life cycle [15]. Some researchers have suggested that the impact of drought on crop yields will increase in the future in response to climate change, emphasizing the global importance of breeding drought-tolerant crops globally [16,17]. Therefore, a better understanding of trade-offs between yield potential and drought stress tolerance is essential for crop improvement [18], but simultaneously improving these two traits is a great challenge for crop breeding.
Drought stress can occur at any growth stage depending on the local environment, and it affects almost every aspect of plant growth through alterations in metabolism and gene expression [19,20]. Photosynthesis is the primary driver of grain yield and plant growth, and variation in photosynthetic pigment concentration is the key indicator of the rate of photosynthesis in plants grown under drought-stress conditions [19,21]. As reported by a previous study, drought stress reduces leaf chlorophyll concentration by 9%, resulting in a decrease in the photosynthetic rate of wheat [22]. This significant drought-induced change in plant physiology led to decreased plant height, diminished growth rate, decreased number of tillers, reduced relative water content, decreased grain quality parameters and, ultimately, substantial yield losses [23,24,25,26]. Thus, evaluating the yield-related agronomic traits under drought stress is very important for identifying rate-limiting traits of yield under drought conditions and selecting improved drought tolerance in a breeding program.
Drought tolerance in bread wheat (Triticum aestivum L.) is a complex quantitative trait regulated by many genes distributed over a huge genome [19,27,28]. Improving drought tolerance in wheat efficiently by selecting only one or a few superior alleles is difficult. High yield and wide adaptation are principal targets of wheat breeding but are hindered by limited knowledge onof the genetic basis of the key agronomic traits, such as drought-stress tolerance [25]. Loss of advantageous alleles for drought stress tolerance due to preferential selection for yield potential may be a common phenomenon in wheat breeding [22,29] and it is not clear whether selection for yield potential facilitates or hampers genetic improvement for drought tolerance. As a result, it is imperative to identify the relationship between drought tolerance and yield potential in order to better understand the heritable co-variation between high yield potential and yield stability under drought in wheat.
This study subjected 152 spring wheat cultivars to both non-stress and drought-stress conditions. We investigated critical yield-related agronomic and physiological traits across different wheat cultivars under conditions of differing water availability. The relationship between wheat yield and drought tolerance was analyzed, and six wheat accessions were selected which could improve drought tolerance and maintain wheat yield under drought-stress conditions. Our objectives were to evaluate the genetic variation and drought stress tolerance of key agronomic and physiological traits in spring wheat; provide insights into the relationship between agronomic and physiological traits in spring wheat; and screen wheat germplasm resources with high drought tolerance and yield stability.

2. Materials and Methods

2.1. Plant Materials

A total of 152 spring wheat accessions were tested (Table S1), namely 145 lines from the CIMMYT Wheat Physiological Germplasm Screening (WPHYSGP, El Baden, Mexico) nursery in Mexico and seven local varieties from the Xinjiang region of China.

2.2. Growth Conditions and Experiment Design

The experiments were conducted at the Spring Wheat Experimental Station, Junhu Farm of the Xinjiang Academy of Agricultural Sciences, China (43°96′ N, 87°01′ E, altitude 717.2 m) in 2011, 2012, and 2022. All wheat accessions were subjected to both drought-stress (DS) and non-stress (NS) conditions, with two replicates per treatment, using a completely randomized block design. Each replicate experimental plot was 2 m in length with four rows and an inter-row spacing of 25 cm, with 40 seeds per row. Field management was consistent with local practices for wheat production.
All the wheat accessions were planted in six different environments (year × treatment) with NS and DS treatments (Table S1). Drip irrigation was used in both treatments. In 2011, the NS treatment was irrigated seven times during the entire growth period of wheat, but the DS treatment was only irrigated twice, at the GS31 (stage of jointing) and GS55 (stage of heading). In 2012, the NS treatment was irrigated eight times over the entire wheat growth period, whereas the DS treatment was irrigated only three times, at GS31, GS55, and GS65 (stage of flowering). In 2022, the NS and DS treatments were each irrigated eight times over the entire growth period, but the amount of irrigation applied at each stage in the DS treatment was lower than that in the NS treatment. The rainfall and irrigation in the growing seasons of the different years were summarized in Table S2.

2.3. Agronomic Data

Three healthy individual plants were selected from the middle of the two internal rows in each plot were used to measure plant height (PH), spike length (SL), total number of spikelets (TSS), grain number per spikelet (GPS), grain number per spike (GNS), and grain weight per spike (GWE) of the main shoot. Thousand-grain weight (TGW) in each plot was determined by the random selection and weighing of 500 seeds from the remaining plants after wheat maturation. Grain yield per plot (GYP) was determined by harvesting all plants and recording the total grain weight. The traits investigated under each treatment were represented by the suffix “-treatment” in the present study. For instance, GYP-DS denotes grain yield per plot under drought stress.
Soil and plant analyzer development (SPAD) value is an important parameter based on a plant’s relative chlorophyll concentration or degree of greenness. The SPAD values of flag leaves were measured using a Konica Minolta SPAD-502 chlorophyll meter at the beginning of the GS65.

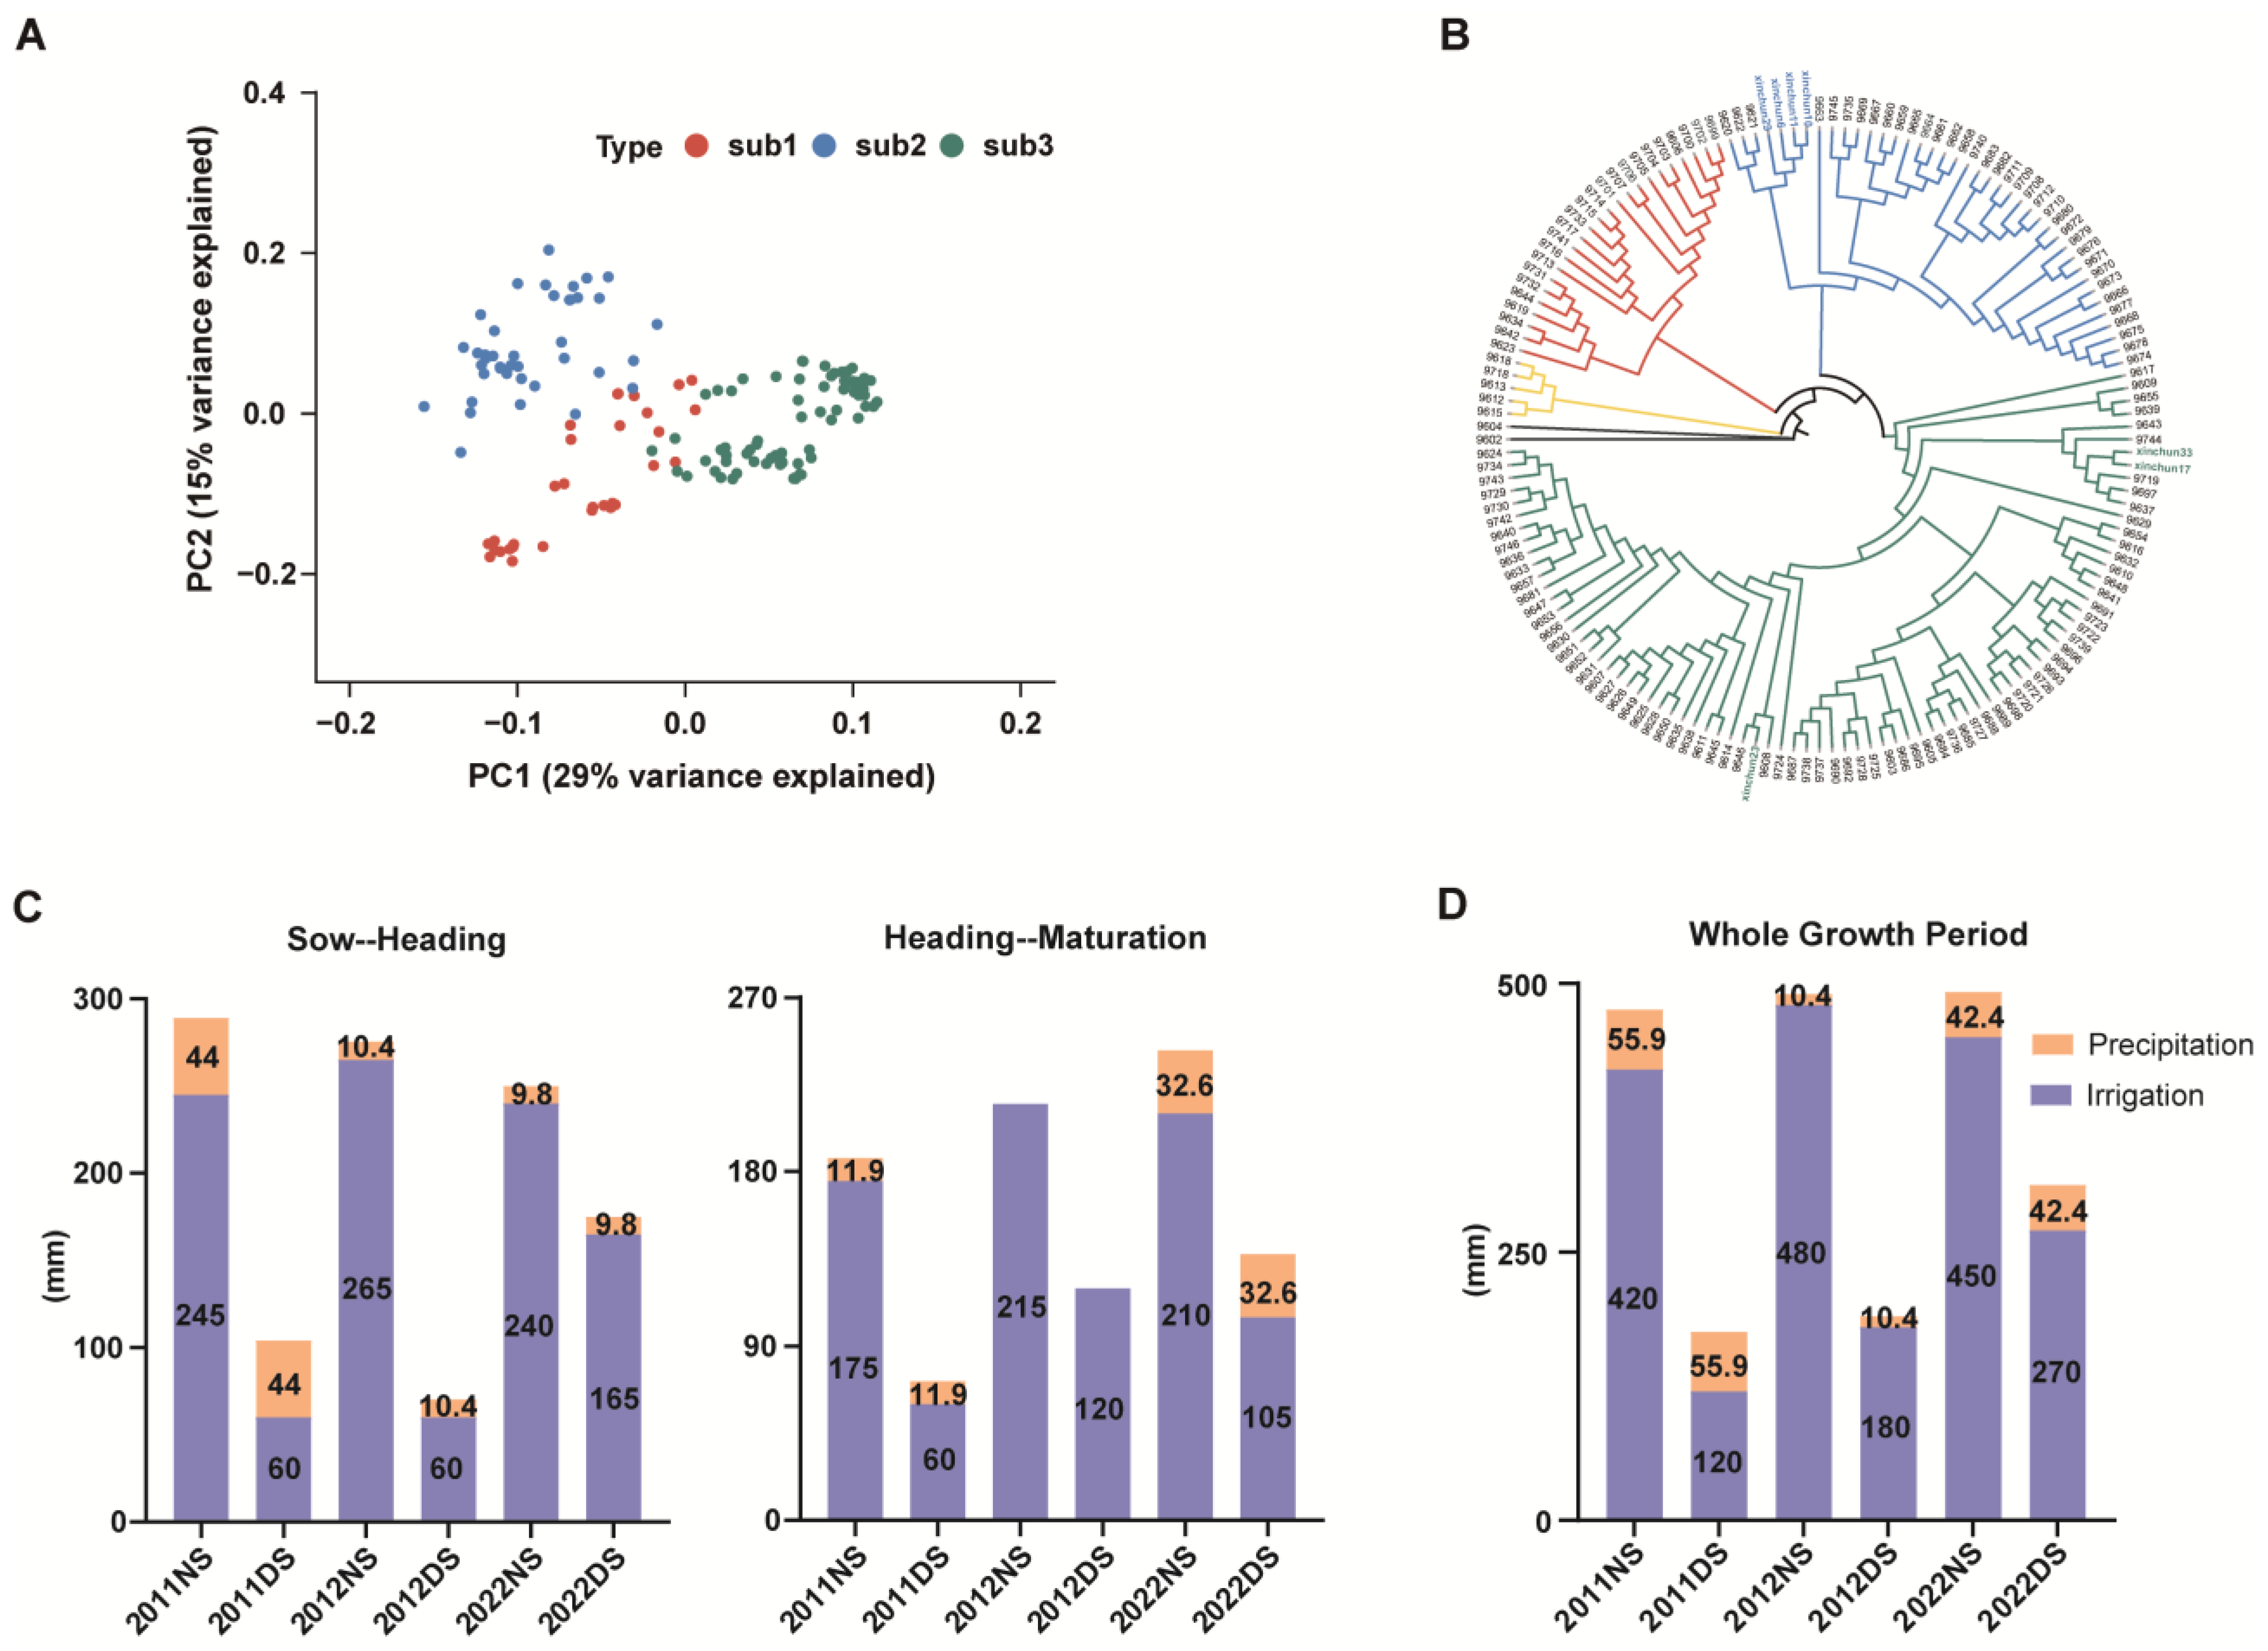
2.4. Principal Component Analysis (PCA) by Genotyping

The 152 spring wheat accessions were genotyped with the wheat 15 K single-nucleotide polymorphism (SNP) chips. The A, B, and D sub-genomes harbored different numbers of SNPs: the A sub-genome harbored 3161 SNPs, the B sub-genome 3344 SNPs, and the D sub-genome 557 SNPs. PCA was performed using a total 7062 SNPS obtained by genotyping. The software GCTA (v.1.94.1) was used to perform PCA on the genetic diversity of the population.

2.5. Statistical and Data Analysis

Principal component analysis of the population genotype data was carried out in the R (v.3.6.1) program. The multiple comparative analysis was conducted in the two-tailed Kruskal–Wallis test with Dunn’s multiple comparison post hoc test (p < 0.05). The best linear unbiased predictions (BLUPs) of investigated traits under each treatment for an individual genotype were estimated across years using the ‘lme4’ package in R (v.3.6.1). The relationships among the different traits were evaluated based on Pearson’s correlation coefficients (r) between BLUPs using the ‘rcorr’ package implemented in R (v.3.6.1). Boxplots were used for data visualization with PRISM 8.0.2 (GraphPad, Boston, MA, USA), while a phylogenetic tree was drawn using the Interactive Tree of Life (iTOL (v.6.8.1), https://itol.embl.de/ (accessed on 6 Marth 2023)) software and the neighbor-joining (NJ) method.
The drought-tolerance index (DI) was calculated according to the equation [30]: DI = Trait-DS/Trait-NS, where Trait-DS represents the BLUP of traits under drought stress, and Trait-NS represents the BLUP of traits under non-stress.

2.6. Multiple Linear Regression Analysis

Multiple linear regression analysis was used to examine the effect of the drought tolerance index of agronomic traits of the 152 accessions on wheat yield. The equation was:
Y = a + bX1 + cX2 + dX3 + eX4
where Y represents the drought tolerance index of wheat yield traits, and X1, X2, X3, and X4 indicate the drought tolerance index of plant height, grain number per spike, grain number per spikelet and thousand-grain weight, respectively, variables b, c, d, and e are the regression coefficients, and a is a constant.

3. Results

3.1. Analysis of Population and Drought Stress Test

A total of 152 spring wheat accessions were collected, namely 145 from the CIMMYT WPHYSGP nursery, and seven spring wheat cultivars from Xinjiang of China. The PCA was performed using 7062 genome-wide SNPs on the 152 accessions to estimate the population structure. The panel of accessions was clustered into three groups that were designated from sub-population 1 to sub-population 3 based on the PCA results (Figure 1A). A NJ phylogenetic reconstruction supported the existence of three main clusters in the 152 accessions (Figure 1B). The results of PCA and the phylogenetic tree were consistent in their confirmation of three general sub-populations within the population panel. Further analysis found that, the sub-population 1, sub-population 2 and sub-population 3 contained 24, 40 and 81 accessions, respectively (Figure 1B). Interestingly, Xinchun 6, Xinchun 10, Xinchun 11 and Xinchun 29, which were from Xinjiang, clustered in the sub-population 2, showing a relatively close genetic relationship (Figure 1B).
Wheat was irrigated adequately over the entire growth period under the non-stress treatment, whereas only a small amount of irrigation was performed at GS31, GS55 and GS65 (in 2011 and 2012) or throughout the growing period (in 2022) under the drought-stress treatment. Irrigation and precipitation in different wheat growth periods in all environments were investigated, and it was found that the total precipitation and its distribution differed greatly among the three years, with the most severe drought stress occurring over the entire growth period in 2011 (Figure 1C). Subsequent analysis revealed that the total amount of water used for irrigation for each wheat crop was more than 50% lower under the drought stress treatment than under the non-stress treatment (Figure 1D). This observation suggests that the wheat plants in the drought stress study suffered severe drought stress during growth.

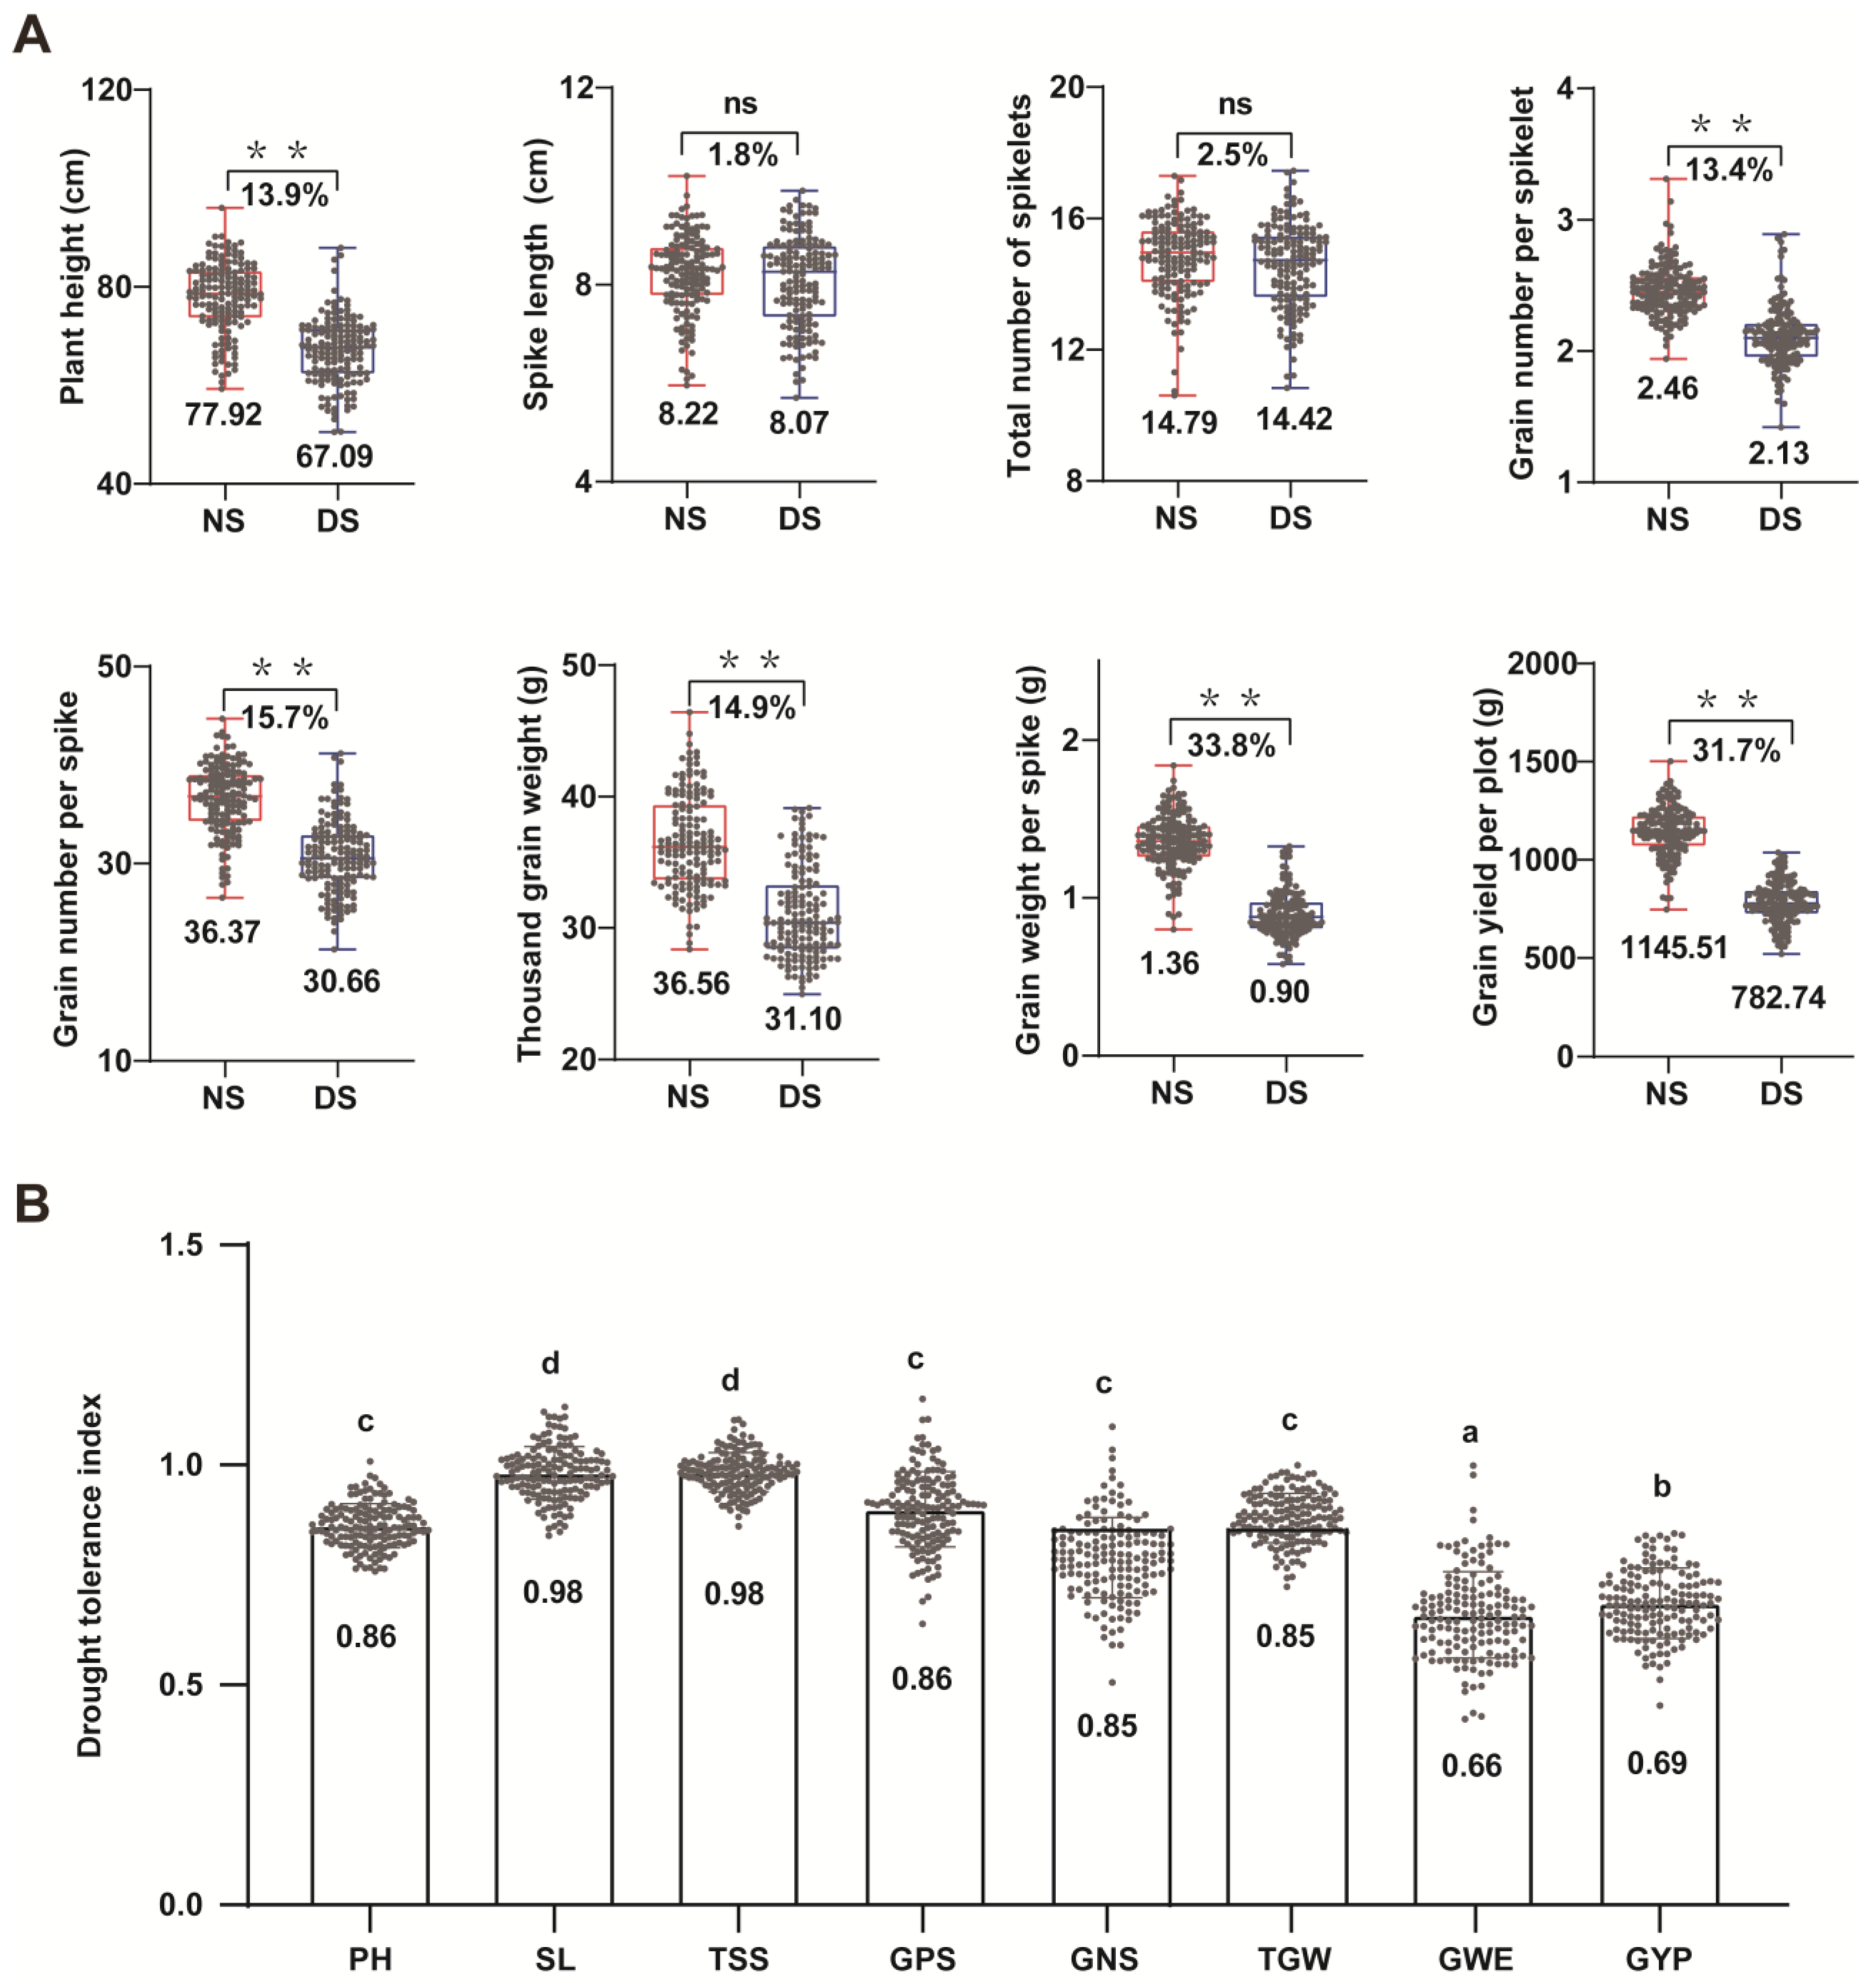
3.2. Effects of Drought Stress on Wheat Yield

Field trials were conducted to collect data on eight yield-related traits under non-stress and drought-stress conditions (Tables S1 and S3). The results showed that GWE and GYP exhibited the most significant decreases under drought-stress conditions (33.8% and 31.7%, respectively, p < 0.01), indicating that the key factors directly limiting yield were particularly sensitive to drought stress (Figure 2A). In addition, decreasing in PH, GPS, GNS and TGW in response to drought stress (relative to the corresponding non-stress values) ranged from 13.4% to 15.7% (Figure 2A). The superimposed loss effect of these traits was another important reason for the final yield loss. However, the drought-induced decreases in SL and TSS were only 1.8% and 2.5%, respectively (Figure 2A).
The DIs of the eight yield-related traits tested also showed the same trends (Table S4). The DIs of GWE (0.66) and GYP (0.69) were the lowest, confirming that they were the traits most vulnerable to drought stress, resulting in severe adverse effects on wheat yield (Figure 2B). Meanwhile, the DIs of GNS and TGW were both 0.85, which were not significantly different from those of PH and GPS, indicating that they were all sensitive to drought stress. The high DI values for SL and TSS (0.98) imply that the phenotypic performance of SL/TSS remained consistent under drought stress and non-drought stress, indicating a minimal impact of drought stress on these traits. The above results indicate that drought stress negatively affects grain number, formation and filling, directly leading to drought-induced decreases in wheat yield.
To further test the effects of agronomic traits on wheat yield, we used the drought tolerance index of yield traits of the 152 accessions for multiple linear regression analysis. We found that PH, GNS and TGW significantly influenced GWE variation, whereas PH, GPS and TGW substantially affected GYP (Table 1). Among these traits, GNS had the greatest effect on GWE, whereas PH had the greatest effect on GYP. The obtained results suggest PH, GPS, GNS, and TGW are closely related to yield traits GWE and GYP, highlighting the importance of enhancing drought tolerance of these traits to maintain wheat yield.

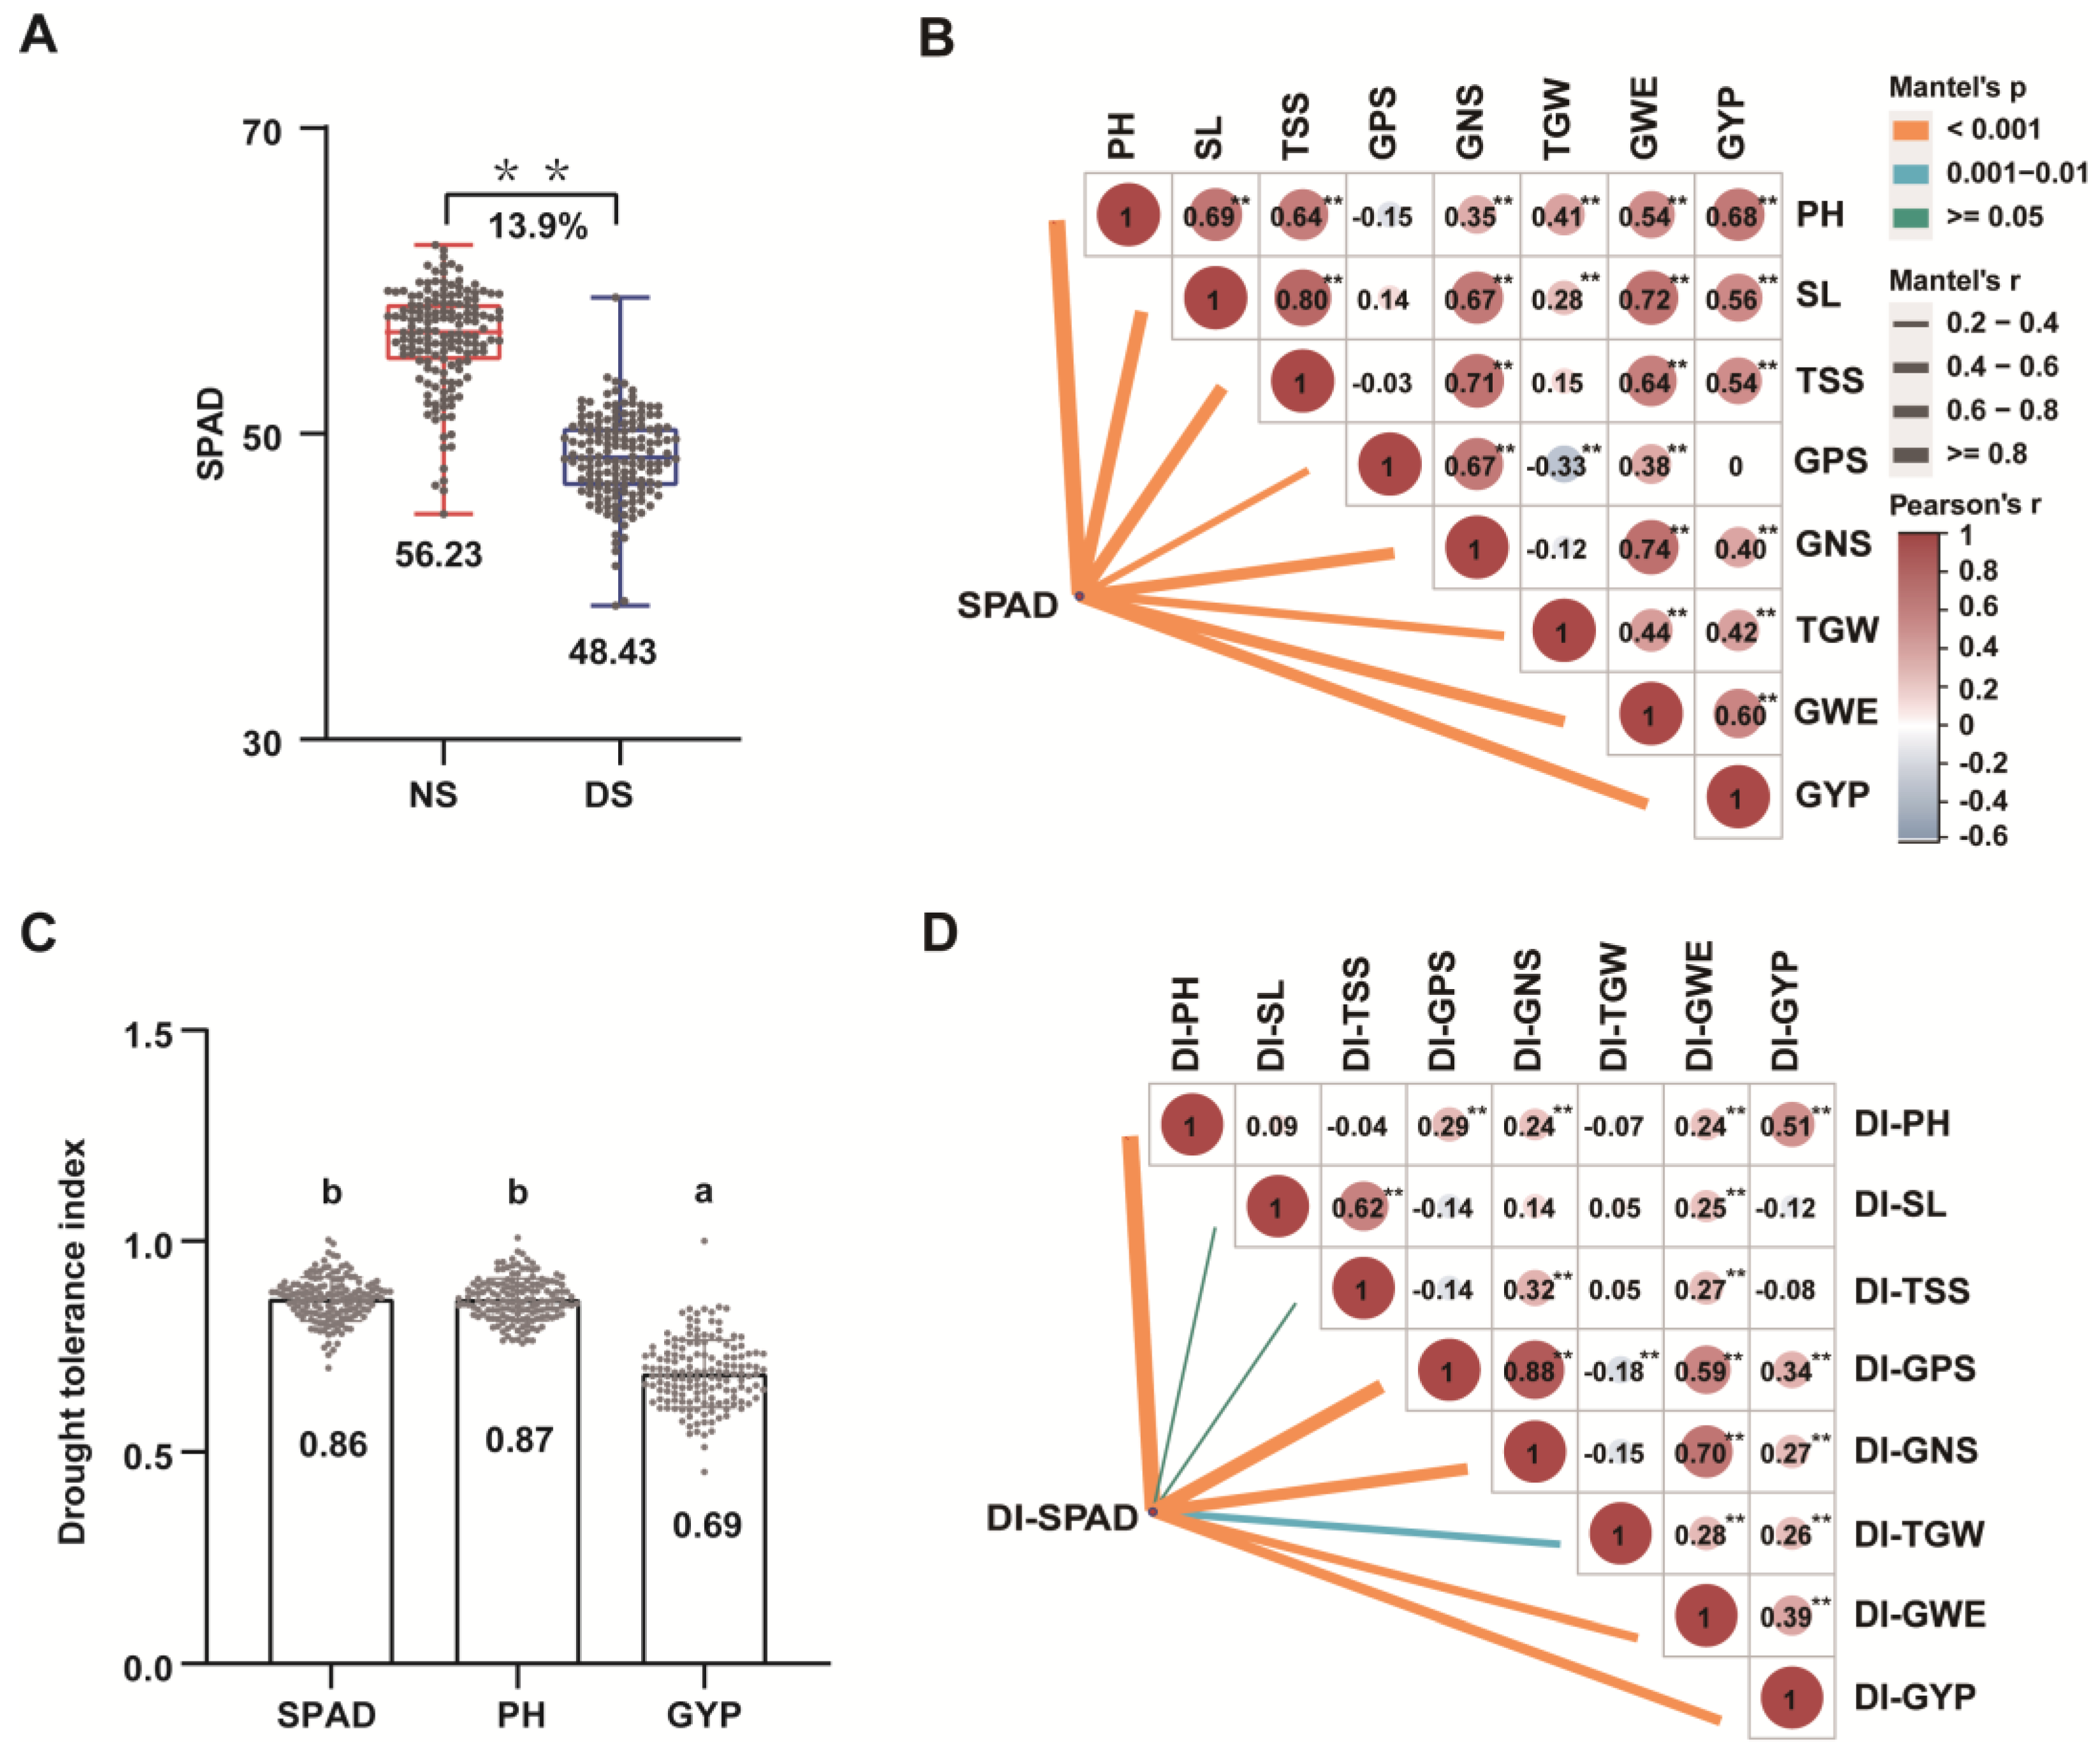
3.3. Effects of Drought Stress on Wheat Physiology

Variation in chlorophyll concentration (measured as SPAD) is a key indicator by which to determine the response of photosynthesis to drought-stress conditions. The SPAD value of flag leaves at the flowering stage under drought stress decreased by 13.9%, showing a significant difference from the non-stress condition (Figure 3A).
Correlation analysis showed that SPAD was significantly positively correlated with the eight yield-related traits under no-stress conditions, and the largest correlation coefficient was observed between SPAD and PH, reaching 0.82 (Figure 3B). In addition to GPS, the correlation coefficients between SPAD and the other seven yield traits were significantly reduced under drought-stress (Figure S1), indicating that their correlation was weakened and SPAD was susceptible to drought stress. Moreover, GWE and GYP showed significantly positive correlations with the other six yield-related traits under no-stress condition, except for GPS (Figure 3B). In general, GPS showed a negative correlation with PH, SL, TSS and TGW, and the negative relationship of those traits reached a significant level under the drought-stress condition (Figure S1). Meanwhile, the correlation between TSS and TGW was significantly positive under the drought-stress condition, which is different from that under non-stress condition (Figure S1). The results provide evidence that PH, GPS, GNS, TGW, GPS, SL, TSS and SPAD all play a significant role in determining crop yield.
Upon analyzing of DIs of SPAD, the DIs of both SPAD and PH were 0.86, implying that traits with strong correlations may have similar ability to tolerate drought stress (Figure 3C). Further analysis revealed that the DIs of SPAD and PH (0.86) showed a significant difference from that of GYP (0.69) (Figure 3C). Therefore, we speculated that DI-SPAD also had a large effect on DI-GYP, since DI-PH contributed the most to DI-GYP in the previous multiple linear regression analysis. The correlation between DI-SPAD and DIs of eight yield-related traits was further analyzed. The results showed that DI-SPAD was significantly positively correlated with DIs of PH, GPS, GNS, GWE and GYP, but was significantly negatively correlated with DI-TGW (Figure 3D). Hence, yield-related traits of wheat are closely related to SPAD, and improving drought tolerance of SPAD is an important measure to maintain wheat yield under drought-stress conditions.
Interestingly, we also noticed that DIs of GNS and PH had the highest correlation coefficients with DIs of GWE (0.70) and GYP (0.51), respectively (Figure 3D), consistent with the results of the multiple linear regression analysis. DI-GWE was significantly positively correlated with DIs of all other traits. Moreover, DI-GYP was negatively correlated with both DI-SL and DI-TSS, whereas it was significantly positively correlated with DIs for the other six traits (Figure 3D). These relationships provide a theoretical basis for further screening of drought-tolerant germplasm resources.

3.4. Drought-Tolerant Germplasm Resources

Plant breeders aim to select for high grain yield combined with high tolerance to drought, selecting for accessions that exhibit genetic differences for high drought tolerance. Therefore, thirty cultivars with the highest drought sensitivity indexes for PH, GNS, GWE, GYP, and SPAD were analyzed, and six drought-tolerant cultivars were identified (Figure 4A). Of these, four wheat cultivars were from sub-population 1 and two cultivars were from sub-population 2 (Figure 4B), implying that wheat cultivars from sub-populations 1 and 2 may have higher-than-average drought tolerance. Drought stress had almost no effect on PH, GNS, GWE, GYP, and SPAD of the six drought-tolerant cultivars (Figure 4C), information which may be further exploited in breeding for drought tolerance in the future.

4. Discussion

Drought stress is one of the consequences of climate change that most damages wheat growth and yield [31,32]. Thus, improving or at least maintaining wheat yield in water-limited environments is a significant challenge for breeders that must be met if food security goals are to be achieved [33]. This study evaluated eight important yield-related traits in 152 spring wheat cultivars under non-stress and drought-stress conditions, and found that drought stress negatively affects all the eight traits, among which GWE and GYP were significantly reduced by 33.8% and 31.7%, respectively (Figure 2A). It is indicated that drought stress might affect wheat yield by affecting yield component traits (such as GWE and GYP) at multiple developmental stages, which ultimately showed that wheat yield was very sensitive to drought stress (Figure 2A,B). Despite conventional plant breeding achieving advances in many agronomic traits of wheat, drought sensitivity is still prevalent in widely grown commercial cultivars [34,35]. Therefore, given the limited time and resources available, breeders must identify the most appropriate traits for developing tolerance to drought stress in wheat varieties. This study found that the phenotypic performance of SL and TSS was relatively stable in drought stress or non-drought-stress conditions (Figure 2B). However, PH, GPS, GNS, and TGW were closely related to the yield traits GWE and GYP (Figure 3B and Table 1), improving drought tolerance of these traits is one of the important measures to improve commercial varieties. Compared to the no-stress condition, drought stress can induce alterations in the correlation among certain traits, namely PH, SL, TSS, GPS and TGW (Figure S1), implying their susceptibility to drought stress. Enhancing the drought tolerance of these traits represents a crucial avenue for current and future endeavors in breeding for improved drought tolerance.
When plants are exposed to drought stress, they can physiologically adapt to tolerate it [19,36]. As we all know, drought can decrease the photosynthetic rate of cereals [21]. Variation in chlorophyll concentration is the key indicator of the extent of photosynthesis in plants grown under drought-stress conditions [37,38]. The SPAD value of the flag leaves at flowering stage was significantly decreased by 13.9% under drought-stress conditions in our study (Figure 3A). Genotypes with high chlorophyll concentration under drought-stress conditions could maintain a relatively stable plant height and biological yield under drought conditions, which are the basis for high crop yield [39,40]. Positive correlations in wheat between yield-related traits and SPAD were found in this study (Figure 3B,D), and improving drought tolerance of SPAD is an important measure to maintain wheat yield under the drought-stress condition. Thus, breeders should select wheat cultivars that can sustain the photosynthetic apparatus and photochemical efficiency under water-deficit irrigation in order to maintain grain yield stability under drought conditions (i.e., drought stress tolerance).
Furthermore, drought tolerance and yield should be improved in parallel because of the long-standing instability of the security of wheat production, with farmers needing to generate agricultural products under drought stress [41]. In the past, many researchers have studied drought tolerance in wheat [29], but the improvement of this crop with respect to drought tolerance is limited for many reasons. Firstly, dramatic changes in plant physiological parameters caused by drought stress need to be measured and understood [42,43]. Secondly, drought response is a complex trait controlled by many genes, which need to be considered when planning to genetically improve drought tolerance [44,45,46]. Finally, drought stress can occur at any growth stage, depending on the local environment. In this study, we measured and studied the changes in agronomic and physiological traits of 152 spring wheat cultivars in multiple environments, and found that there is a balance between yield potential and drought tolerance of wheat, and that the goal of high yield and drought tolerance breeding can be achieved by selecting appropriate wheat germplasm resources. The results of PCA and phylogenetic tree analysis suggested that the population panel could be classified into three distinct sub-populations (Figure 1A,B). Wheat accessions within the same sub-population shared a common ancestral parent or originated from the same geographical region, indicating a shared genetic basis or regional adaptation. Therefore, six wheat accessions with drought tolerance potential were selected which could maintain stable grain yield under drought-stress conditions in this study (Figure 4). Among them, four wheat cultivars were from sub-population 1 and two cultivars were from sub-population 2 (Figure 4B). This suggests that wheat cultivars from sub-populations 1 and 2 may have higher yield stability and drought tolerance. They could be used as breeding lines to generate hybrids to continue the aggregation of drought-tolerant genes, so the hybrid offspring will contain more drought-tolerant alleles than the individual parents.
Due to climatic variability, drought stress occurrs at different crop growth stages is a major hindering factor for yield improvement [9]. In particular, gamete abortion caused by drought during anthesis was the main cause of yield loss. Therefore, improving the tolerance of wheat to drought stress through adaptive strategies is vital to ensure food security. When working with a limited area of cultivated land, it is essential to prioritize key traits related to plant productivity and adaptation to environmental challenges [47]. The current study provides a theoretical basis and valuable germplasm resource for drought tolerance breeding (Figure 4). Using this resource for genetic improvement and the breeding of drought-tolerant wheat varieties should be an important aim of wheat breeders in the future.

5. Conclusions

Drought stress negatively affects grain number, formation, filling and photosynthesis, directly leading to drought-induced decreases in wheat yield. GWE and GYP are particularly sensitive to drought stress, which are the key factors directly limiting yield. In addition, the superimposed loss effect of PH, GPS, GNS, TGW and SPAD are another important reason for the final yield loss under drought stress. Compared with the no-stress conditions, drought stress can lead to changes in the correlation of agronomic and physiological traits, improving drought tolerance of these traits is an important direction for current and future drought tolerance breeding. Six wheat germplasm accessions were identified for their ability to sustain grain yield and improve drought tolerance simultaneously, they could be used as resource for genetic improvement and the breeding of drought-tolerant wheat varieties in the future.

Supplementary Materials

The following supporting information can be downloaded at https://www.mdpi.com/article/10.3390/agronomy13122968/s1. Table S1: Phenotypic data for 152 wheat accessions. PH, plant height; SL, spike length; TSS, total number of spikelets; GPS, grain number per spikelet; GNS, grain number per spike; GWE, grain weight per spike; TGW, thousand-grain weight; GYP, grain yield per plot; SPAD, soil and plant analyzer development. Non-stress treatment in 2011, 2012, 2022 (E1, E2, E3), drought stress treatment in 2011, 2012, 2022 (E4, E5, E6). BLUP represents the best linear unbiased predictions. NA represents missing data. Table S2: The rainfall and irrigation in the growing seasons of the different years. Non-stress treatment in 2011, 2012, 2022 (E1, E2, E3), drought stress treatment in 2011, 2012, 2022 (E4, E5, E6). Table S3: Statistical phenotypic data observed in six environments. SD and CV are short for standard deviation and coefficient of variation, respectively. h2 represents broad sense heritability. Table S4: Drought resistance index (DI) of 152 materials. The drought tolerance index (DI) was calculated according to the equation: DI = Trait-DS/Trait-NS, where Trait-DS represents the trait under drought stress treatment, and Trait-NS represents the trait under non-stress treatment. Figure S1: Correlation between SPAD and eight yield relate traits in wheat. Heat map of the correlations of the yield traits in non-stress (NS) and drought stress (DS) conditions.

Author Contributions

Conceptualization, Z.X. and X.L.; Methodology, Z.X. and Y.R.; Software, X.L., H.W. and C.W.; Validation, Y.R., Z.Y. and H.G.; Investigation, H.W., J.X. and Z.Y.; Resources, C.W. and Z.W.; Data curation, H.Y., J.X. and Z.W.; Writing—original draft, Z.X. and X.L.; Writing—review and editing, X.S. and Y.Z.; Visualization, Z.X. and X.L.; Supervision, Hongmei Yang and H.G.; Project administration, X.S. and Y.Z. All authors have read and agreed to the published version of the manuscript.

Funding

This research was funded by the National Natural Science Foundation of China, International (Regional) Cooperation and Exchange Program (NSFC-CGIAR, Grant No. 32061143040) and the Silk Road Economic Belt Innovation Driven Development Pilot Zone, Wuchangshi National Independent Innovation Demonstration Zone Science and Technology Development Plan (Grant No. 2022LQ03017) and Xinjiang Autonomous Region Science and Technology Support Project (Grant No. 2022E02074).

Data Availability Statement

Data is contained within the article or Supplementary Material.

Acknowledgments

Thanks to all authors for their contributions and to all projects supporting this article.

Conflicts of Interest

The funders had no role in the design of the study; in the collection, analyses, or interpretation of data; in the writing of the manuscript; or in the decision to publish the results.

References

  1. Shewry, P.R.; Hey, S.J. The contribution of wheat to human diet and health. Food Energy Secur. 2015, 4, 178–202. [Google Scholar] [CrossRef]
  2. Godfray, H.C.; Beddington, J.R.; Crute, I.R.; Haddad, L.; Lawrence, D.; Muir, J.F.; Pretty, J.; Robinson, S.; Thomas, S.M.; Toulmin, C. Food security: The challenge of feeding 9 billion people. Science 2010, 327, 812–818. [Google Scholar] [CrossRef]
  3. Langridge, P.; Reynolds, M. Breeding for drought and heat tolerance in wheat. Theor. Appl. Genet. 2021, 134, 1753–1769. [Google Scholar] [CrossRef] [PubMed]
  4. Mei, F.; Chen, B.; Du, L.; Li, S.; Zhu, D.; Chen, N.; Zhang, Y.; Li, F.; Wang, Z.; Cheng, X. A gain-of-function allele of a DREB transcription factor gene ameliorates drought tolerance in wheat. Plant Cell 2022, 34, 4472–4494. [Google Scholar] [CrossRef] [PubMed]
  5. Dai, A. Increasing drought under global warming in observations and models. Nat. Clim. Change 2013, 3, 52–58. [Google Scholar] [CrossRef]
  6. Nevo, E.; Chen, G. Drought and salt tolerances in wild relatives for wheat and barley improvement. Plant Cell Environ. 2010, 33, 670–685. [Google Scholar] [CrossRef] [PubMed]
  7. Poggi, G.M.; Corneti, S.; Aloisi, I.; Ventura, F. Environment-oriented selection criteria to overcome controversies in breeding for drought resistance in wheat. J. Plant Physiol. 2023, 280, 153895. [Google Scholar] [CrossRef]
  8. Tricker, P.J.; ElHabti, A.; Schmidt, J.; Fleury, D. The physiological and genetic basis of combined drought and heat tolerance in wheat. J. Exp. Bot. 2018, 69, 3195–3210. [Google Scholar] [CrossRef]
  9. Khan, S.; Anwar, S.; Yu, S.; Sun, M.; Yang, Z.; Gao, Z.Q. Development of Drought-tolerant transgenic wheat: Achievements and limitations. Int. J. Mol. Sci. 2019, 20, 3350. [Google Scholar] [CrossRef]
  10. Barnabás, B.; Jäger, K.; Fehér, A. The effect of drought and heat stress on reproductive processes in cereals. Plant Cell Environ. 2008, 31, 11–38. [Google Scholar] [CrossRef]
  11. Onyemaobi, I.; Liu, H.; Siddique, K.H.; Yan, G. Both male and female malfunction contributes to yield reduction under water stress during meiosis in bread wheat. Front. Plant Sci. 2016, 7, 2071. [Google Scholar] [CrossRef] [PubMed]
  12. Ji, X.; Shiran, B.; Wan, J.; Lewis, D.C.; Jenkins, C.L.; Condon, A.G.; Richards, R.A.; Dolferus, R. Importance of pre-anthesis anther sink strength for maintenance of grain number during reproductive stage water stress in wheat. Plant Cell Environ. 2010, 33, 926–942. [Google Scholar] [CrossRef] [PubMed]
  13. Dong, B.; Zheng, X.; Liu, H.; Able, J.A.; Yang, H.; Zhao, H.; Zhang, M.; Qiao, Y.; Wang, Y.; Liu, M. Effects of drought stress on pollen sterility, grain yield, abscisic acid and protective enzymes in two winter wheat cultivars. Front. Plant Sci. 2017, 8, 1008. [Google Scholar] [CrossRef]
  14. Wang, X.; Vignjevic, M.; Jiang, D.; Jacobsen, S.; Wollenweber, B. Improved tolerance to drought stress after anthesis due to priming before anthesis in wheat (Triticum aestivum L.) var. Vinjett. J. Exp. Bot. 2014, 65, 6441–6456. [Google Scholar] [CrossRef] [PubMed]
  15. Senapati, N.; Halford, N.G.; Semenov, M.A. Vulnerability of European wheat to extreme heat and drought around flowering under future climate. Environ. Res. Lett. 2021, 16, 024052. [Google Scholar] [CrossRef]
  16. Webber, H.; Ewert, F.; Olesen, J.E.; Müller, C.; Fronzek, S.; Ruane, A.C.; Bourgault, M.; Martre, P.; Ababaei, B.; Bindi, M. Diverging importance of drought stress for maize and winter wheat in Europe. Nat. Commun. 2018, 9, 4249. [Google Scholar] [CrossRef]
  17. Luo, L.; Xia, H.; Lu, B.R. Editorial: Crop breeding for drought resistance. Front. Plant Sci. 2019, 10, 314. [Google Scholar] [CrossRef]
  18. Rabieyan, E.; Bihamta, M.R.; Moghaddam, M.E.; Alipour, H.; Mohammadi, V.; Azizyan, K.; Javid, S. Analysis of genetic diversity and genome-wide association study for drought tolerance related traits in Iranian bread wheat. BMC Plant Biol. 2023, 23, 431. [Google Scholar] [CrossRef]
  19. Sallam, A.; Alqudah, A.M.; Dawood, M.F.A.; Baenziger, P.S.; Börner, A. Drought stress tolerance in wheat and barley: Advances in physiology, breeding and genetics research. Int. J. Mol. Sci. 2019, 20, 3137. [Google Scholar] [CrossRef]
  20. Du, L.; Huang, X.; Ding, L.; Wang, Z.; Tang, D.; Chen, B.; Ao, L.; Liu, Y.; Kang, Z.; Mao, H. TaERF87 and TaAKS1 synergistically regulate TaP5CS1/TaP5CR1-mediated proline biosynthesis to enhance drought tolerance in wheat. New Phytol. 2023, 237, 232–250. [Google Scholar] [CrossRef]
  21. Makino, A. Photosynthesis, grain yield, and nitrogen utilization in rice and wheat. Plant Physiol. 2011, 155, 125–129. [Google Scholar] [CrossRef] [PubMed]
  22. Li, L.; Mao, X.; Wang, J.; Chang, X.; Reynolds, M.; Jing, R. Genetic dissection of drought and heat-responsive agronomic traits in wheat. Plant Cell Environ. 2019, 42, 2540–2553. [Google Scholar] [CrossRef] [PubMed]
  23. Zhang, J.; Zhang, S.; Cheng, M.; Jiang, H.; Zhang, X.; Peng, C.; Lu, X.; Zhang, M.; Jin, J. Effect of drought on agronomic traits of rice and wheat: A meta-analysis. Int. J. Env. Res. Pub. Health 2018, 15, 839. [Google Scholar] [CrossRef] [PubMed]
  24. Tsenov, N. Effects of drought on grain productivity and quality in winter bread wheat. Bulg. J. Agric. Sci. 2015, 21, 589–595. [Google Scholar]
  25. Nezhadahmadi, A.; Prodhan, Z.H.; Faruq, G. Drought tolerance in wheat. Sci. World J. 2013, 2013, 610721. [Google Scholar] [CrossRef] [PubMed]
  26. Amalova, A.; Abugalieva, S.; Babkenov, A.; Babkenova, S.; Turuspekov, Y. Genome-wide association study of yield components in spring wheat collection harvested under two water regimes in Northern Kazakhstan. PEER J. 2021, 9, e11857. [Google Scholar] [CrossRef]
  27. Tian, G.; Wang, S.; Wu, J.; Wang, Y.; Wang, X.; Liu, S.; Han, D.; Xia, G.; Wang, M. Allelic variation of TaWD40-4B.1 contributes to drought tolerance by modulating catalase activity in wheat. Nat. Commun. 2023, 14, 1200. [Google Scholar] [CrossRef]
  28. Eltaher, S.; Hashem, M.; Ahmed, A.A.M.; Baenziger, P.S.; Börner, A.; Sallam, A. Effectiveness of TaDreb-B1 and 1-FEH w3 KASP markers in spring and winter wheat populations for marker-assisted selection to improve drought tolerance. Int. J. Mol. Sci. 2023, 24, 8986. [Google Scholar] [CrossRef]
  29. Amini, A.; Majidi, M.M.; Mokhtari, N.; Ghanavati, M. Drought stress memory in a germplasm of synthetic and common wheat: Antioxidant system, physiological and morphological consequences. Sci. Rep. 2023, 13, 8569. [Google Scholar] [CrossRef]
  30. Bouslama, M.; Schapaugh, W.T. Stress tolerance in soybeans. I. Evaluation of three screening techniques for heat and drought tolerance. Crop Sci. 1950, 24, 933–937. [Google Scholar] [CrossRef]
  31. Qin, P.; Lin, Y.; Hu, Y.; Liu, K.; Mao, S.; Li, Z.; Wang, J.; Liu, Y.; Wei, Y.; Zheng, Y. Genome-wide association study of drought-related resistance traits in Aegilops tauschii. Gent. Mol. Biol. 2016, 39, 398–407. [Google Scholar] [CrossRef] [PubMed]
  32. Boliko, M.C. FAO and the situation of food security and nutrition in the world. J. Nutr. Sci. Vitaminol. 2019, 65, S4–S8. [Google Scholar] [CrossRef] [PubMed]
  33. Cattivelli, L.; Rizza, F.; Badeck, F.W.; Mazzucotelli, E.; Mastrangelo, A.M.; Francia, E.; Marè, C.; Tondelli, A.; Stanca, A.M.J.F.C.R. Drought tolerance improvement in crop plants: An integrated view from breeding to genomics. Field Crop Res. 2008, 105, 1–14. [Google Scholar] [CrossRef]
  34. Bailey-Serres, J.; Parker, J.E.; Ainsworth, E.A.; Oldroyd, G.E.D.; Schroeder, J.I. Genetic strategies for improving crop yields. Nature 2019, 575, 109–118. [Google Scholar] [CrossRef] [PubMed]
  35. Abberton, M.; Batley, J.; Bentley, A.; Bryant, J.; Cai, H.; Cockram, J.; Oliveira, A.C.; Cseke, L.J.; Dempewolf, H.; De, P.C. Global agricultural intensification during climate change: A role for genomics. Plant Biotechnol. J. 2016, 14, 1095–1098. [Google Scholar] [CrossRef] [PubMed]
  36. Vinocur, B.; Altman, A. Recent advances in engineering plant tolerance to abiotic stress: Achievements and limitations. Curr. Opin. Biotech. 2005, 16, 123–132. [Google Scholar] [CrossRef] [PubMed]
  37. Gholami, Z.; Ehsanzadeh, P. Exogenous proline improves osmoregulation, physiological functions, essential oil, and seed yield of fennel. Ind. Crop. Prod. 2018, 111, 133–140. [Google Scholar] [CrossRef]
  38. Yang, Y.; Nan, R.; Mi, T.; Song, Y.; Shi, F.; Liu, X.; Wang, Y.; Sun, F.; Xi, Y.; Zhang, C. Rapid and nondestructive evaluation of wheat chlorophyll under drought stress using hyperspectral imaging. Int. J. Mol. Sci. 2023, 24, 5825. [Google Scholar] [CrossRef]
  39. Ghaffar, A.; Hussain, N.; Ajaj, R.; Shahin, S.M.; Bano, H.; Javed, M.; Khalid, A.; Yasmin, M.; Shah, K.H.; Zaheer, M.; et al. Photosynthetic activity and metabolic profiling of bread wheat cultivars contrasting in drought tolerance. Front. Plant Sci. 2023, 14, 1123080. [Google Scholar] [CrossRef]
  40. Kiliç, H.; Yağbasanlar, T. The effect of drought stress on grain yield, yield components and some quality traits of durum wheat (Triticum turgidum ssp. durum) Cultivars. Not. Bot. Horti Agrobot. 2010, 38, 164–170. [Google Scholar]
  41. Yasir, T.A.; Wasaya, A.; Hussain, M.; Ijaz, M.; Farooq, M.; Farooq, O.; Nawaz, A.; Hu, Y.G. Evaluation of physiological markers for assessing drought tolerance and yield potential in bread wheat. Physiol. Mol. Biol. Plants 2019, 25, 1163–1174. [Google Scholar] [CrossRef] [PubMed]
  42. Itam, M.; Mega, R.; Tadano, S.; Abdelrahman, M.; Matsunaga, S.; Yamasaki, Y.; Akash, K.; Tsujimoto, H. Metabolic and physiological responses to progressive drought stress in bread wheat. Sci. Rep. 2020, 10, 17189. [Google Scholar] [CrossRef] [PubMed]
  43. Dawood, M.F.A.; Moursi, Y.S.; Amro, A.; Baenziger, P.S.; Sallam, A.J.A. Investigation of heat-induced changes in the grain yield and grains metabolites, with molecular insights on the candidate genes in barley. Agronomy 2020, 10, 1730. [Google Scholar] [CrossRef]
  44. Mao, H.; Li, S.; Chen, B.; Jian, C.; Mei, F.; Zhang, Y.; Li, F.; Chen, N.; Li, T.; Du, L.; et al. Variation in cis-regulation of a NAC transcription factor contributes to drought tolerance in wheat. Mol. Plant 2022, 15, 276–292. [Google Scholar] [CrossRef]
  45. Zhang, Y.; Zhao, Y.; Li, T.; Ni, C.; Han, L.; Du, P.; Xiao, K. TaPYL4, an ABA receptor gene of wheat, positively regulates plant drought adaptation through modulating the osmotic stress-associated processes. BMC Plant Biol. 2022, 22, 423. [Google Scholar] [CrossRef]
  46. Gupta, P.K.; Balyan, H.S.; Sharma, S.; Kumar, R. Genetics of yield, abiotic stress tolerance and biofortification in wheat (Triticum aestivum L.). Theor. Appl. Genet. 2020, 133, 1569–1602. [Google Scholar] [CrossRef]
  47. Mwadzingeni, L.; Shimelis, H.; Dube, E.; Laing, M.D.; Tsilo, T.J. Breeding wheat for drought tolerance: Progress and technologies. J. Integr. Agr. 2016, 15, 935–943. [Google Scholar] [CrossRef]
Figure 1. Population structure, precipitation and irrigation. (A) Principal component analysis. Sub1, sub2, and sub3 represent different sub-populations. (B) Neighbor-joining phylogenetic tree analysis. (C) Irrigation and precipitation under non-stress and drought-stress treatments at different growth stages. (D) The total sum of water applied as precipitation and irrigation under non-stress and drought stress treatments in different years. Different colors in (B) represent different subgroup branches.
Agronomy 13 02968 g001
Figure 2. Sensitivity of yield traits to drought stress in wheat. (A) The numbers in column plot represent the average values of the drought tolerance index. NS, non-stress condition; DS, drought-stress condition. ** indicates a significantly different by Student’s t-test, p < 0.01; ns indicates no significant difference. The percentage represents the trait decrease in response to drought stress relative to non-stress. The equation was: (trait under non-stress conditions–trait under drought-stress conditions) × 100/trait under non-stress conditions. (B) Drought tolerance index (DI) of yield traits. The numbers in the column plot represent the average values of drought tolerance index. PH, plant height; SL, spike length; TSS, total number of spikelets, GPS, grain number per spikelet, GNS, grain number per spike; GWE, grain weight per spike; TGW, thousand grain weight; GYP, grain yield per plot. Different letters indicate statistically significant differences between samples, determined using the two-tailed Kruskal–Wallis test with Dunn’s multiple comparison post hoc test (p < 0.05).
Agronomy 13 02968 g002
Figure 3. Effects of drought stress on flag leaf chlorophyll concentration (SPAD). (A) Box plots of the SPAD value of the 152 accessions. NS, non−stress condition; DS, drought−stress condition. ** indicate significant differences using Student’s t−test, p < 0.01. The percentage represents the trait loss rate. The equation was: (the phenotypic under non−stress condition–the phenotypic under drought−stress condition) × 100/the phenotypic under non−stress condition. (B) Correlations between SPAD and yield−related traits in wheat under non−stress conditions. (C) Drought tolerance index of SPAD. SPAD, soil and plant analyzer development value; The numbers in the column plot represent the average values of drought tolerance index. Different letters indicate statistically significant differences, determined using the two−tailed Kruskal−Wallis test with Dunn’s multiple comparison post hoc test (p < 0.05). (D) Correlation between DI−SPAD and drought tolerance index (DI) of yield−related traits.
Agronomy 13 02968 g003
Figure 4. Screening of drought-tolerant accessions. (A) Thirty cultivars with the highest drought tolerance index (DI) to PH, GNS, GWE, GYP, and SPAD. PH, plant height; GNS, grain number per spike; GWE, grain weight per spike; GYP, grain yield per plot; SPAD, soil and plant analyzer development value. (B) Six drought-tolerant wheat cultivars. Sub1, sub2, and sub3 represent different sub-populations. (C) Drought tolerance indexes (DI) of six drought-tolerant wheat cultivars. The red dots represent the mean value of the drought tolerance index.
Agronomy 13 02968 g004
Table 1. The multiple linear regression analysis of the drought tolerance index of yield traits.
TraitsRegression EquationDI-PH (X1)DI-GNS (X2)DI-GPS (X3)DI-TGW (X4)Adjusted R2p-Value
DI-GWEY = −0.77+ 0.19X1 + 0.80X2 + 0.70X40.00940.0730--0.03900.6421<2.2 × 10⁻¹⁶
DI-GYPY = −0.59 + 0.72X1 + 0.26X3 + 0.50X40.0360--0.0224 0.02770.3987<2.2 × 10⁻¹⁶
DI, drought tolerance index; PH, plant height; GNS, grain number per spike; GPS, grain number per spikelet, TGW, thousand grain weight; GWE, grain weight per spike; GYP, grain yield per plot.
Disclaimer/Publisher’s Note: The statements, opinions and data contained in all publications are solely those of the individual author(s) and contributor(s) and not of MDPI and/or the editor(s). MDPI and/or the editor(s) disclaim responsibility for any injury to people or property resulting from any ideas, methods, instructions or products referred to in the content.

