Article

Genome-Wide Association Study for Spike Traits and Distribution of Two QTLs for Grain Number in Chinese Wheat Cultivars

1
State Key Laboratory of Crop Stress Biology for Arid Areas, College of Agronomy, Northwest A&F University, Yangling 712100, China
2
Hainan Yazhou Bay Seed Laboratory, Yazhou 572025, China
*
Author to whom correspondence should be addressed.
These authors contributed equally to this work.
Agronomy 2023, 13(10), 2538; https://doi.org/10.3390/agronomy13102538
Submission received: 19 August 2023 / Revised: 28 September 2023 / Accepted: 28 September 2023 / Published: 30 September 2023
(This article belongs to the Special Issue The Environmental Adaptation of Wheat)

Abstract

:
Spike traits play an important role in improving wheat yield. However, the application of reported spike-related loci remains unclear. Here, we assessed six spike-related traits across seven different environments using 406 wheat accessions. A negative correlation was observed between two components of wheat yield: thousand kernel weight (TKW) and grain number per spike (GN). Nonetheless, TKW and GN were significantly higher in modern cultivars compared to landraces. Two reliable quantitative trait loci (QTLs) related to GN, QGN.nwafu-4A and QGN.nwafu-7A, were identified through genome-wide associate analysis. QGN.nwafu-4A showed pleiotropy on GN, kernel number per spikelet and spike length. Both elite haplotypes of QGN.nwafu-7A were prominently present in Chinese modern cultivars, particularly those released after the year 2000. Elite haplotype A of QGN.nwafu-7A was significantly prevalent in Chinese Yellow and Huai wheat zone, while elite haplotype D of QGN.nwafu-7A was concentrated in other wheat-growing regions of China. This observation suggests distinct preferences in wheat cultivation across various agro-ecological regions. Conversely, elite haplotype A of QGN.nwafu-4A was more common in introduced cultivars from abroad. This divergence may be attributed to the reduced TKW of haplotype A. Overall, these findings provide valuable insights into the application of these two QTLs in high-yield wheat breeding.

1. Introduction

Wheat (Triticum aestivum L.) is a major staple food crop worldwide, contributing approximately 20% of the global calories and protein in human diets [1]. Increasing wheat yield stands as a long-term goal for breeding and remains crucial for ensuring global food security. Wheat yield is a complicated trait primarily determined by three components: thousand kernel weight (TKW), grain number per spike (GN), and spike number per unit area (SN) [2]. GN plays a crucial role in determining the potential yield of wheat, and recent studies have indicated that variations in grain number per spike have a more significant impact on wheat grain yield than variations in grain size [3,4]. The architecture of the spike inflorescence significantly influences GN [5]. The wheat spike consists of a rachis, numerous spikelets, and each spikelet produces an indeterminate number of florets along the rachilla [6,7]. GN can be dissected into two subcomponents: spikelets per spike and grains per spikelet [8]. Consequently, the morphology and development of the spikelet or floret are key factors determining the number of grains per spike in wheat.
In recent decades, significant advancements in wheat genome sequencing and high-throughput genotyping systems have propelled association analysis into a pivotal tool for understanding the basis of yield potential and gene identification [9,10,11,12]. Numerous genetic loci associated with grain number per spike have been successfully identified [2,5,13], and several genes regulating floret fertility and spikelet number have been cloned. For example, Grain Number Increase 1 (GNI1), which encodes an HD-Zip I transcription factor, has been found responsible for increasing both fertile floret and grain number [14]. TEOSINTE BRANCHED1 (TB1) regulates wheat inflorescence architecture and increases wheat grain numbers [15]. TaCol-B5 modifies spike architecture and enhances grains per spike in wheat [16]. Both DUO-B1 and FRIZZY PANICLE (FZP) genes, encoding APETALA2/ethylene response transcription factors, regulate spike inflorescence architecture and grain numbers [7,17,18]. The Q gene, a significant component in the domestication process of wheat, plays a crucial role in controlling spike morphogenesis and contributing to higher grain yield [5,19]. Additionally, both the dwarfing genes Rht-B1 and Rht-D1, as well as the photoperiod sensitivity gene Ppd-D1, are associated with the number of grains per spike [20,21]. Previous studies have focused on the function of these genes, but the selection and application of genes in molecular breeding programs remain largely unexplored.
Significant influence of the environment and intricate relationships among yield component traits are evident across the ten distinct ecological wheat zones in China, which collectively encompass the full spectrum of environmental conditions experienced by wheat globally [22]. Different wheat regions exhibit diverse ecological environments, thereby influencing the overall spike structure of plants. Extensive variations in allele frequency, driven by ecological selection, have played a pivotal role in shaping plant architecture and influencing the growing season during yield improvement [23]. Understanding the genetic basis of grain number variation and uncovering the mechanisms governing their selection and application across different regions of China assumes paramount significance. The integration of this knowledge into forthcoming breeding programs is the key to continual advancements in wheat yields.
In this study, a resampled genome-wide association study (GWAS) analysis was conducted to investigate six distinct spike traits across diverse environments and identify valuable spike-related QTLs. A total of 66 significant QTLs were identified, among which two reliable QTLs were directly associated with grain number (GN). Further investigation was performed to understand the distribution of different haplotypes in various cultivars and wheat-growing regions. Two haplotypes of QGN.nwafu-4A and four haplotypes of QGN.nwafu-7A were identified. Haplotype A of the QGN.nwafu-7A was significantly enriched among Chinese modern cultivars, particularly in those released after the year 2000 and in the Yellow and Huai wheat zone of China. These findings provide valuable guidance for the deliberate selection and application of these QTLs in modern wheat breeding, taking into consideration their distinctive concentrations within different wheat-growing environments.

2. Materials and Methods

2.1. Plant Materials and Field Trials

A total of 406 bread wheat accessions collected from China, the United States, and the International Center for Agricultural Research in the Dry Areas (ICARDA) were used in this study. The accessions comprised 60 breeding lines, 87 landraces (LA), and 259 modern cultivars (MC). Among the modern cultivars, there were 207 Chinese MC and 52 introduced accessions, originating from different regions, including Chinese Yellow and Huai wheat zone (Y&H), Yangtze River wheat zone (YTS), other wheat zones of China (OTW), and abroad zones (Table S1).
The wheat accessions were planted and harvested at two different locations: Chongzhou (Sichuan Province, 30°63′ N, 103°67′ E) in 2018–2019 (E1) and Yangling (Shaanxi Province, 34°28′ N, 108°70′ E) in 2018–2021. This provided a total of seven different growth environments (Table S1). At Yangling, field trials were conducted with two different sowing dates: normal sowing (NS) at around 2 October and late sowing (LS) at around 15 January of the following year. The experiment employed a random block design with three replicates. Each individual line comprised ten plants, and the row span was set at 100 cm, with a 20 cm gap between rows. Field management followed local wheat production practices.

2.2. Phenotyping and Data Analysis

Upon reaching the maturation stage, a comprehensive phenotypic evaluation was conducted on the wheat population across seven environments. For phenotypic evaluation, five representative plants per genotype from each replication were selected. The traits that were evaluated included spike length (SL), grain number per spike (GN), spikelet number per spike (SNPS), fertile spikelets per spike (FS), thousand kernel weight (TKW), and kernel number per spikelet (KPS). SL was measured from the base to the tip of the spike, excluding awns. GN, SNPS, and FS were counted as the number of grains, total spikelets, and fertile spikelets per spike, respectively. The grain number data are missing in environment E5 due to adverse weather conditions during the anthesis and harvest stages. TKW was measured by randomly counting a thousand grains from each replication using an automatic seed test and a thousand kernels weighter (Wanshen-SC-G, Hangzhou, China). KPS was calculated as the ratio of GN to SNPS. Furthermore, the infertile spikelet ratio (ISR) was calculated as the ratio of (SNPS-FS) to SNPS.
The best linear unbiased prediction (BLUP) for target traits across different environments was calculated using the R package “lme4” [24]. Phenotypic variation, frequency distribution, and Pearson’s correlations among different environments were obtained using the BLUP data in SPSS 25 (IBM SPSS, Armonk, NY, USA). Broad-sense heritability (h2) across environments was estimated following the method described by Smith et al. [25]. Statistical significance was assessed using Student’s t test (p < 0.05) and one-way ANOVA, followed by Tukey’s test (p < 0.05) with GraphPad Prism (v8.0.1).

2.3. Genome-Wide Association Study and Linkage Disequilibrium Analysis

The genome-wide association study (GWAS) was conducted using FarmCPU [26] by the GAPIT version 3 in R (v3.6.1). This approach incorporates population structure and kinship results as covariates to reduce the occurrence of false positives [27,28]. We conducted association mapping using a resampling-based multiple SNP model, following a method previously applied successfully in maize [29,30]. The SNP data were generated using population RNA-seq, as described by Wang et al. [31]. In total, 157,050 SNPs were randomly distributed across all 21 wheat chromosomes and utilized for genotyping. Detailed information regarding these SNP data can be found in our earlier study [32].
The phenotypic data used in this study comprised the mean values from three replicates for each trait within a single environment, as well as the BLUP values amalgamated across all environments. Resample GWAS [29] was performed using R software with 100 iterations, where each iteration randomly selected 60% of the inbred lines. Given that the p value adjusted by a false discovery rate of 0.05 was overly restrictive, we considered SNPs detected at p < 1.0 × 10⁻⁴ and identified at least 5 times in 100 resamples (resample model inclusion probability (RMIP) threshold of 0.05) as significant associations. The SNP with the minimum p value for each locus was defined as the peak SNP (pSNP). Manhattan and quantile–quantile (Q–Q) plots were visualized using the “qqman” R package.
Linkage disequilibrium (LD) was estimated by calculating the squared allele frequency correlation using the “−r2” command in PopLDdecay software (v3.4.2) [33]. The LD decay was calculated and plotted with the following parameters: “-bin1 1000 -break 5000 -bin2 5000”. The LD decay distance for the whole genome was approximately 3 Mb, as shown in Figure S2. This corresponds to r2 > 0.1 and was considered to represent the limits of a QTL/locus. The corresponding effect and phenotypic variance explained (PVE) were estimated and outputted using R software.

2.4. Haplotype Analysis

QTL information relevant to the candidate genes was meticulously extracted from the obtained QTL dataset, which exclusively included biallelic QTLs. Based on the results of LD block analysis, we performed haplotype classification using significant markers that were closely linked to the peak SNP within each QTL. Haplotype analysis was conducted in R (v3.6.1) to investigate whether these loci can induce phenotypic change through a random sampling substitution test involving 1000 iterations. The significance of the results was assessed using Student’s t-test or one-way ANOVA, followed by Tukey’s test. To effectively visualize and present the findings, the outcomes were elegantly depicted using GraphPad Prism (v8.0.1).

3. Results

3.1. Variation and Correlation Analysis of Spike-Related Traits

A comprehensive collection of 406 bread wheat accessions was amassed for this study (Table S1). To characterize these accessions, six spike-related traits were evaluated, including spike length (SL), grain number per spike (GN), spikelet number per spike (SNPS), thousand kernel weight (TKW), kernel number per spikelet (KPS), and infertile spikelet ratio (ISR). This evaluation was conducted across seven environments, and it was observed that late sowing significantly reduced the performance of five spike-related traits, except for kernel number per spikelet (Table S1).
The distribution patterns of all six traits exhibited a continuous variation (Figure 1a), implying that these spike-related traits are quantitative in nature, influenced by a multitude of genes or QTLs. Across various environments, SL showed the highest heritability, while ISR showed the lowest heritability. Notably, two key components of wheat yield, namely thousand kernel weight (TKW) and grain number per spike (GN), exhibited strong heritability exceeding 70% (Table 1).
Correlation analysis revealed that TKW was negatively correlated with GN, SNPS, and SL. Conversely, GN showed positive correlations with KPS and SNPS (Figure 1b). These intricate interconnections indicate the complexity of wheat yield traits.

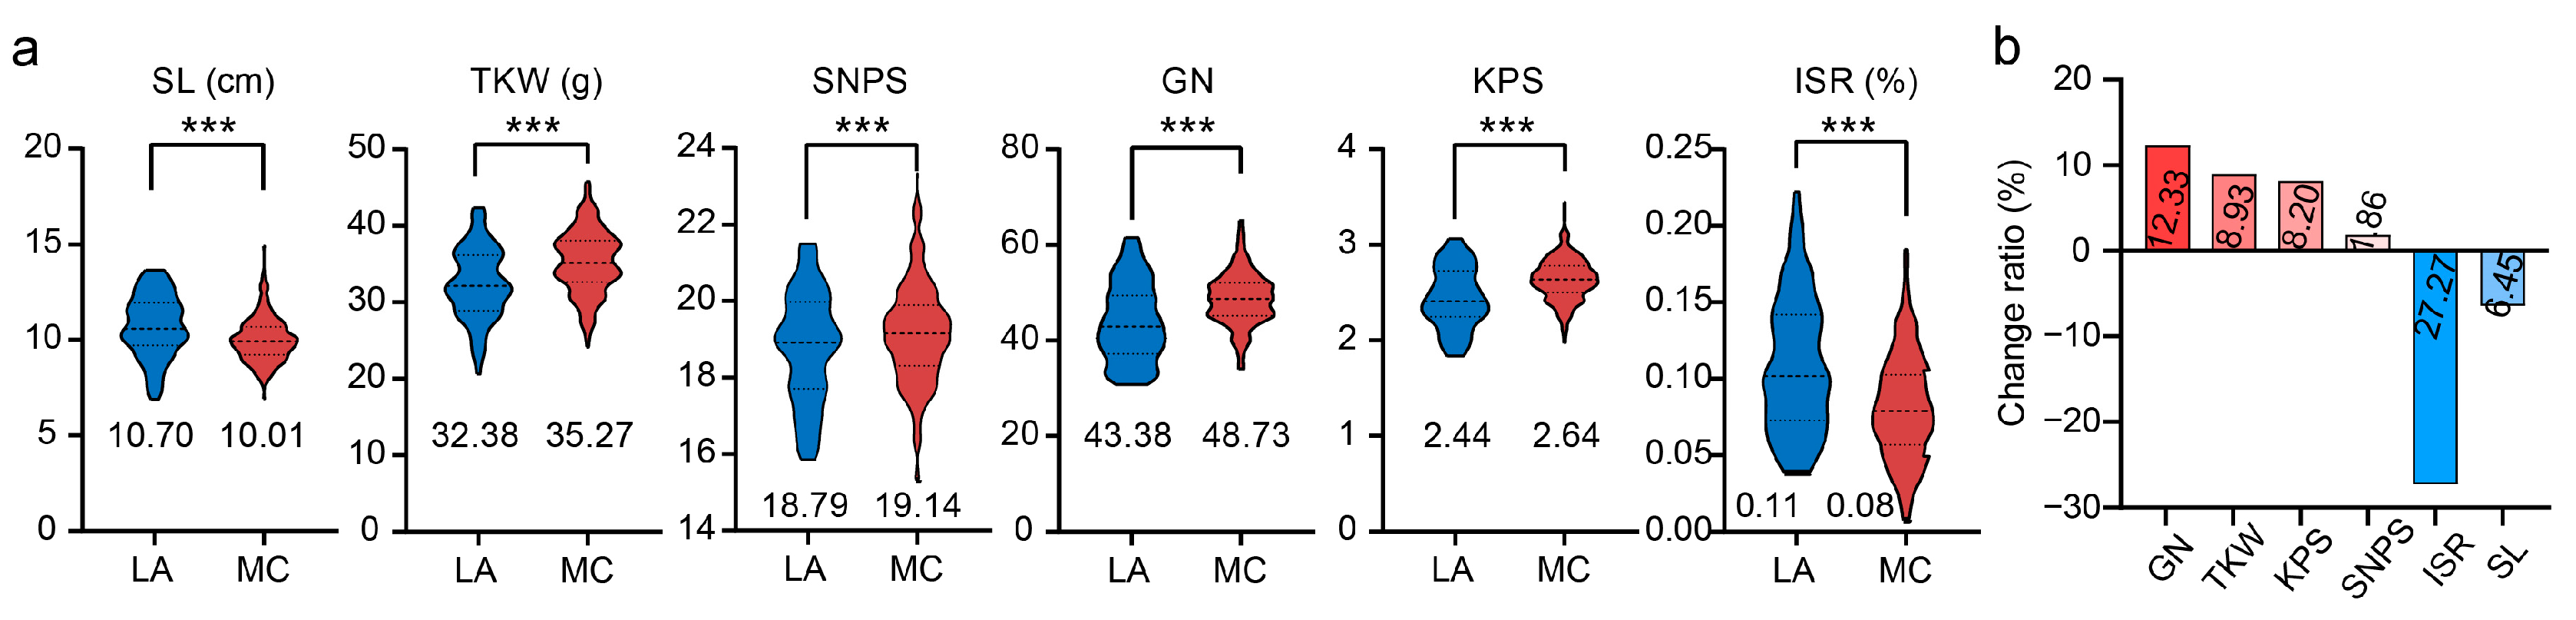
3.2. Variation of Spike-Related Traits during Modern Breeding

Improving spike-related traits stands as a crucial objective in the pursuit of high-yield wheat breeding [34]. Considering this, an in-depth investigation was conducted, focusing on the distinctions between landraces (LA) and modern cultivars (MC). In comparison to LA, MC exhibited significantly reduced SL but higher levels of TKW, GN, and KPS (Figure 2). Notably, TKW and GN showed remarkable improvements of 12.33% and 8.93%, respectively (Figure 2). Furthermore, in a converse trend, MC exhibited a lower ISR as compared to LA (Figure 2), highlighting a distinct preference for high-yield characteristics in modern breeding processes.

3.3. GWAS of Spike-Related Traits in Seven Environments

GWAS were performed for six spike-related traits using the resample model inclusion probability [35]. QTLs that were identified across environments (based on BLUP value, E0) and detected in at least two environments were considered stable QTLs. Additionally, QTLs that have been previously identified as major QTLs were also regarded as stable. As a result, a total of 66 stable QTLs (p < 1.0 × 10⁻⁴, RMIP ≥ 5) were identified in at least two environments or reported by previous studies (Table S2, Figure 3 and Figure S1).
Among the six spike-related traits, SL and TKW exhibited the highest number of identified QTLs, and SNPS, GN, and KPS fell in the middle range, while the number of QTLs associated with ISR was the lowest (Table S3). This observation is consistent with the heritability levels of these respective traits (Table 1).
A total of 17 QTLs harboring reported genes or loci were identified, with five of them previously reported and documented previously reported and documented (Table 2, Figure 4). QSL.nwafu-2D.1, QSL.nwafu-2D.2, and QSL.nwafu-5A.5 have been consistently observed in various studies focusing on SL. Both QGN.nwafu-4A and QGN.nwafu-7A showed the same or close physical locations with previous studies. Notably, QGN.nwafu-4A was previously regarded solely as a locus influencing GN. However, our study revealed its role as a pleiotropic locus, impacting not only GN but also KPS and SL (Table 2). This discovery indicates a genetic association among these traits. Consequently, these five loci, which have been reported multiple times (Figure 4), possess significant credibility as reliable QTLs. Specifically, the two QTLs associated with GN were singled out for further analysis to elucidate their potential application in high-yield breeding initiatives.

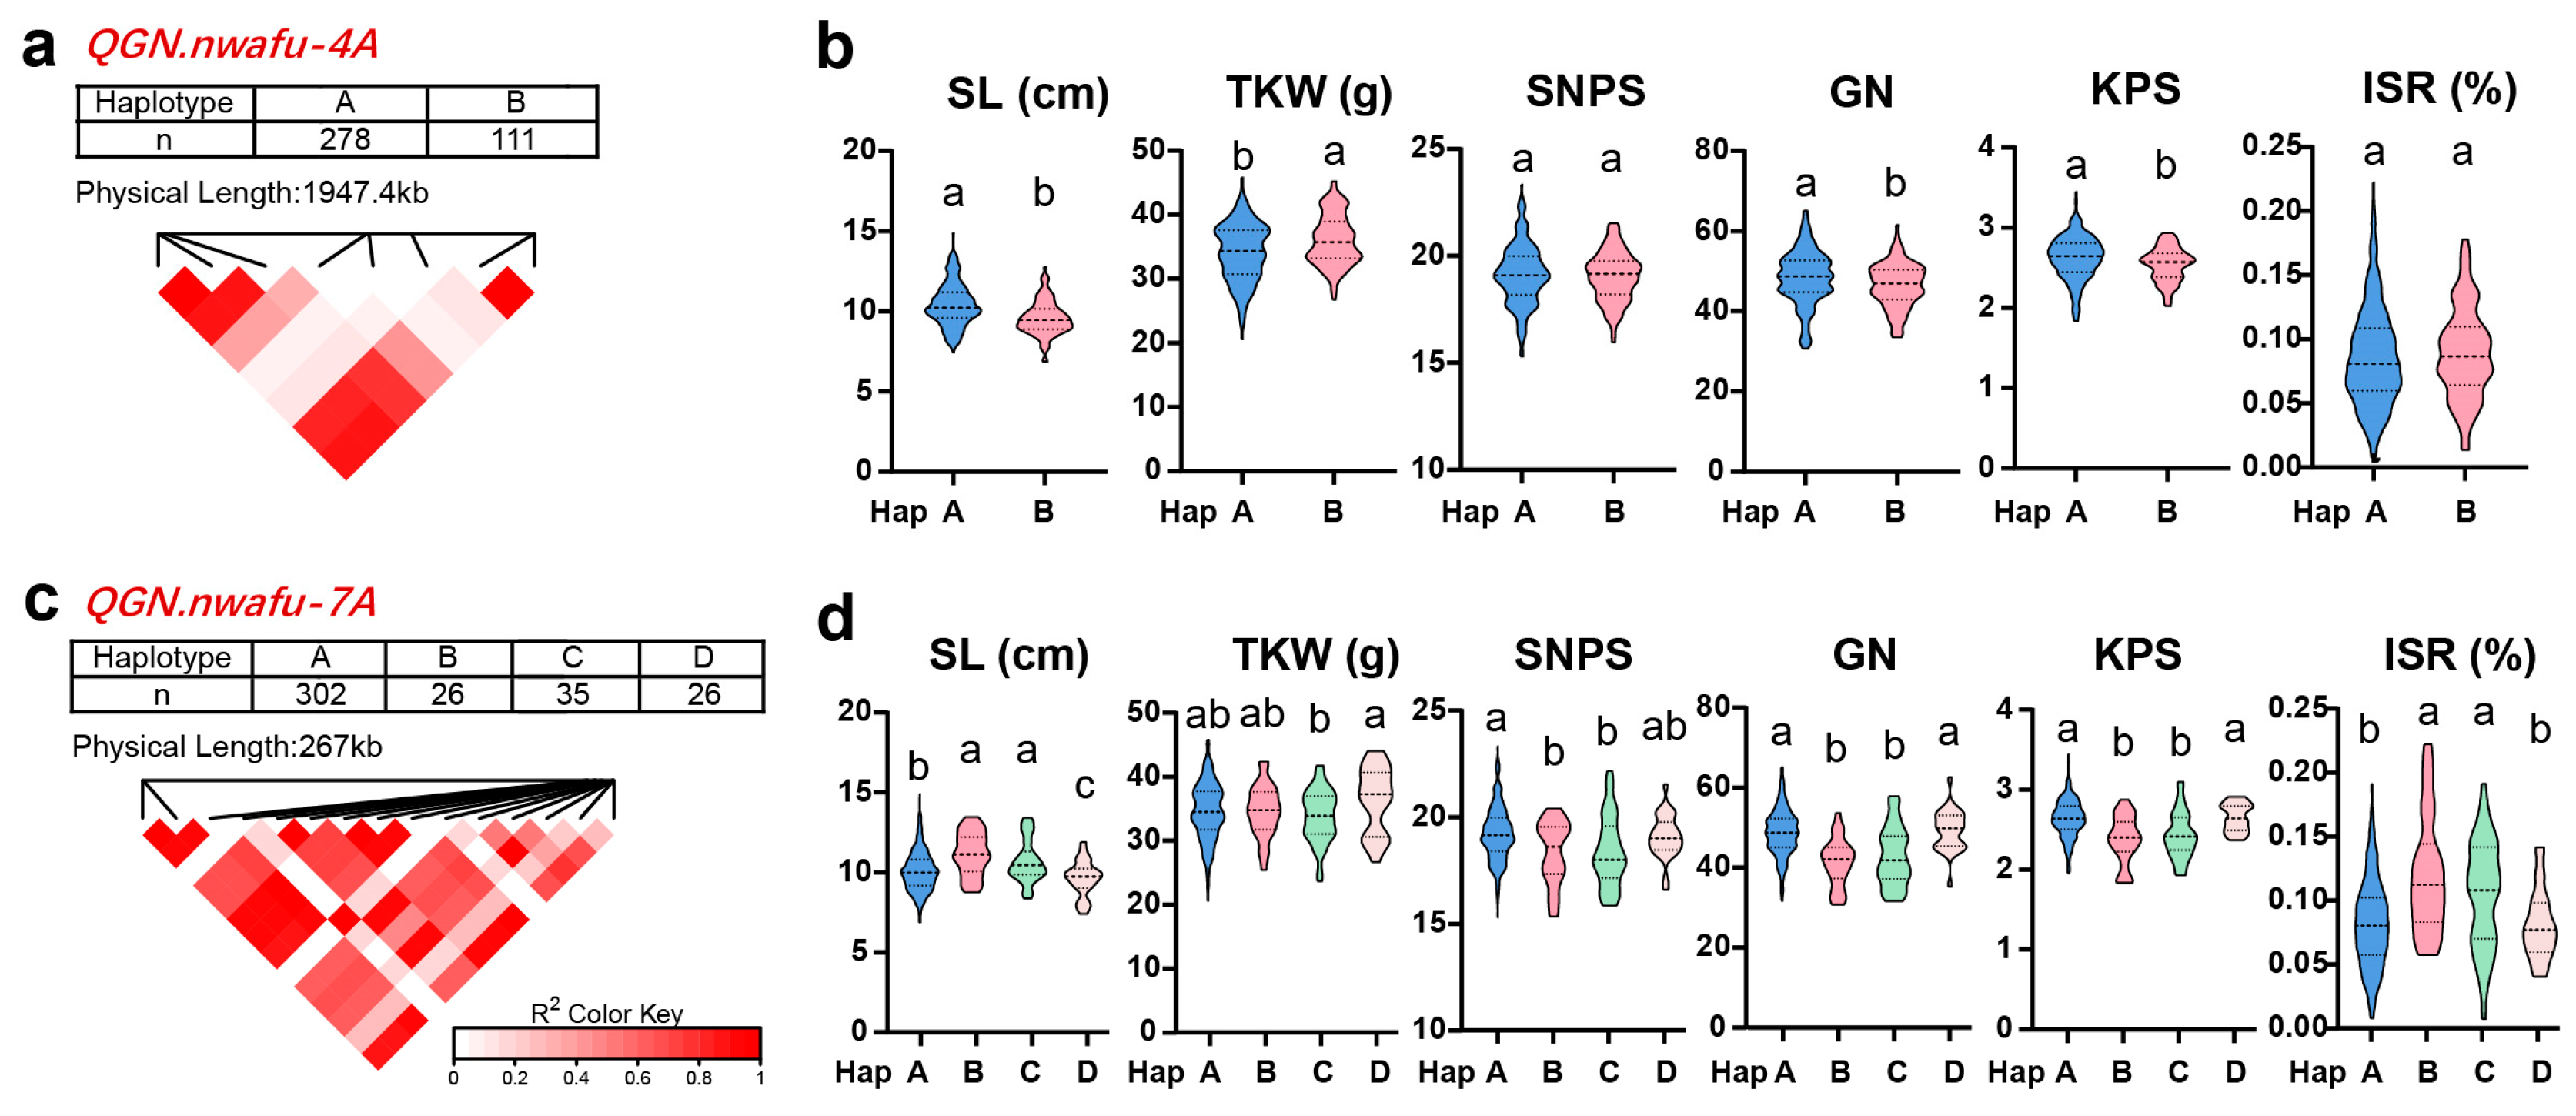
3.4. Haplotype Analysis of Reported QTLs of GN in Modern Wheat Breeding

Haplotypes were defined based on the combination of significant SNPs identified for the two QTLs of GN. Two and four haplotypes were identified for QGN.nwafu-4A and QGN.nwafu-7A, respectively (Figure 5). Among them, the major haplotype for the pleiotropic QGN.nwafu-4A, referred to as Hap-A, showed a significantly higher GN, KPS, and SL. However, it exhibited a diminishing effect on TKW, and no statistical difference was observed between SNPS and ISR, which is consistent with the negative correlation between GN and TKW. Regarding QGN.nwafu-7A, although Hap-A was the major haplotype, both Hap-A and Hap-D displayed significantly higher GN and KPS, as well as lower SL and ISR (Figure 5). This observation aligns with modern breeding selection trends that aim for increased grain number (Figure 2). Notably, only Hap-D of QGN.nwafu-7A exhibited a simultaneous increase in GN and TKW, highlighting a potential application of this allele in future high-yield breeding.

3.5. Selection and Application for QGN.nwafu-4A and QGN.nwafu-7A during Modern Breeding

The distribution frequency of haplotypes within the germplasm was analyzed, revealing a significant concentration of only Hap-A from QGN.nwafu-7A in MC when compared to LA (Figure 6a,b). While both Hap-A and Hap-D of QGN.nwafu-7A exhibited notably higher grain numbers than other haplotypes, Hap-D did not demonstrate a pronounced enrichment in MC, whereas Hap-A showed a distinct enrichment, especially in cultivars released after the year 2000 (Figure 6c,d). For the two haplotypes of pleiotropic QGN.nwafu-4A, no significant variance in frequency distribution was observed between MC and LA. However, the frequency of the superior Hap-A from QGN.nwafu-4A exhibited a declining trend as the breeding process advanced (Figure 6c). This observation could be attributed to the lower TKW associated with Hap-A (Figure 5b), highlighting the complexity of wheat high-yield breeding and the need to strike a balance among yield components.

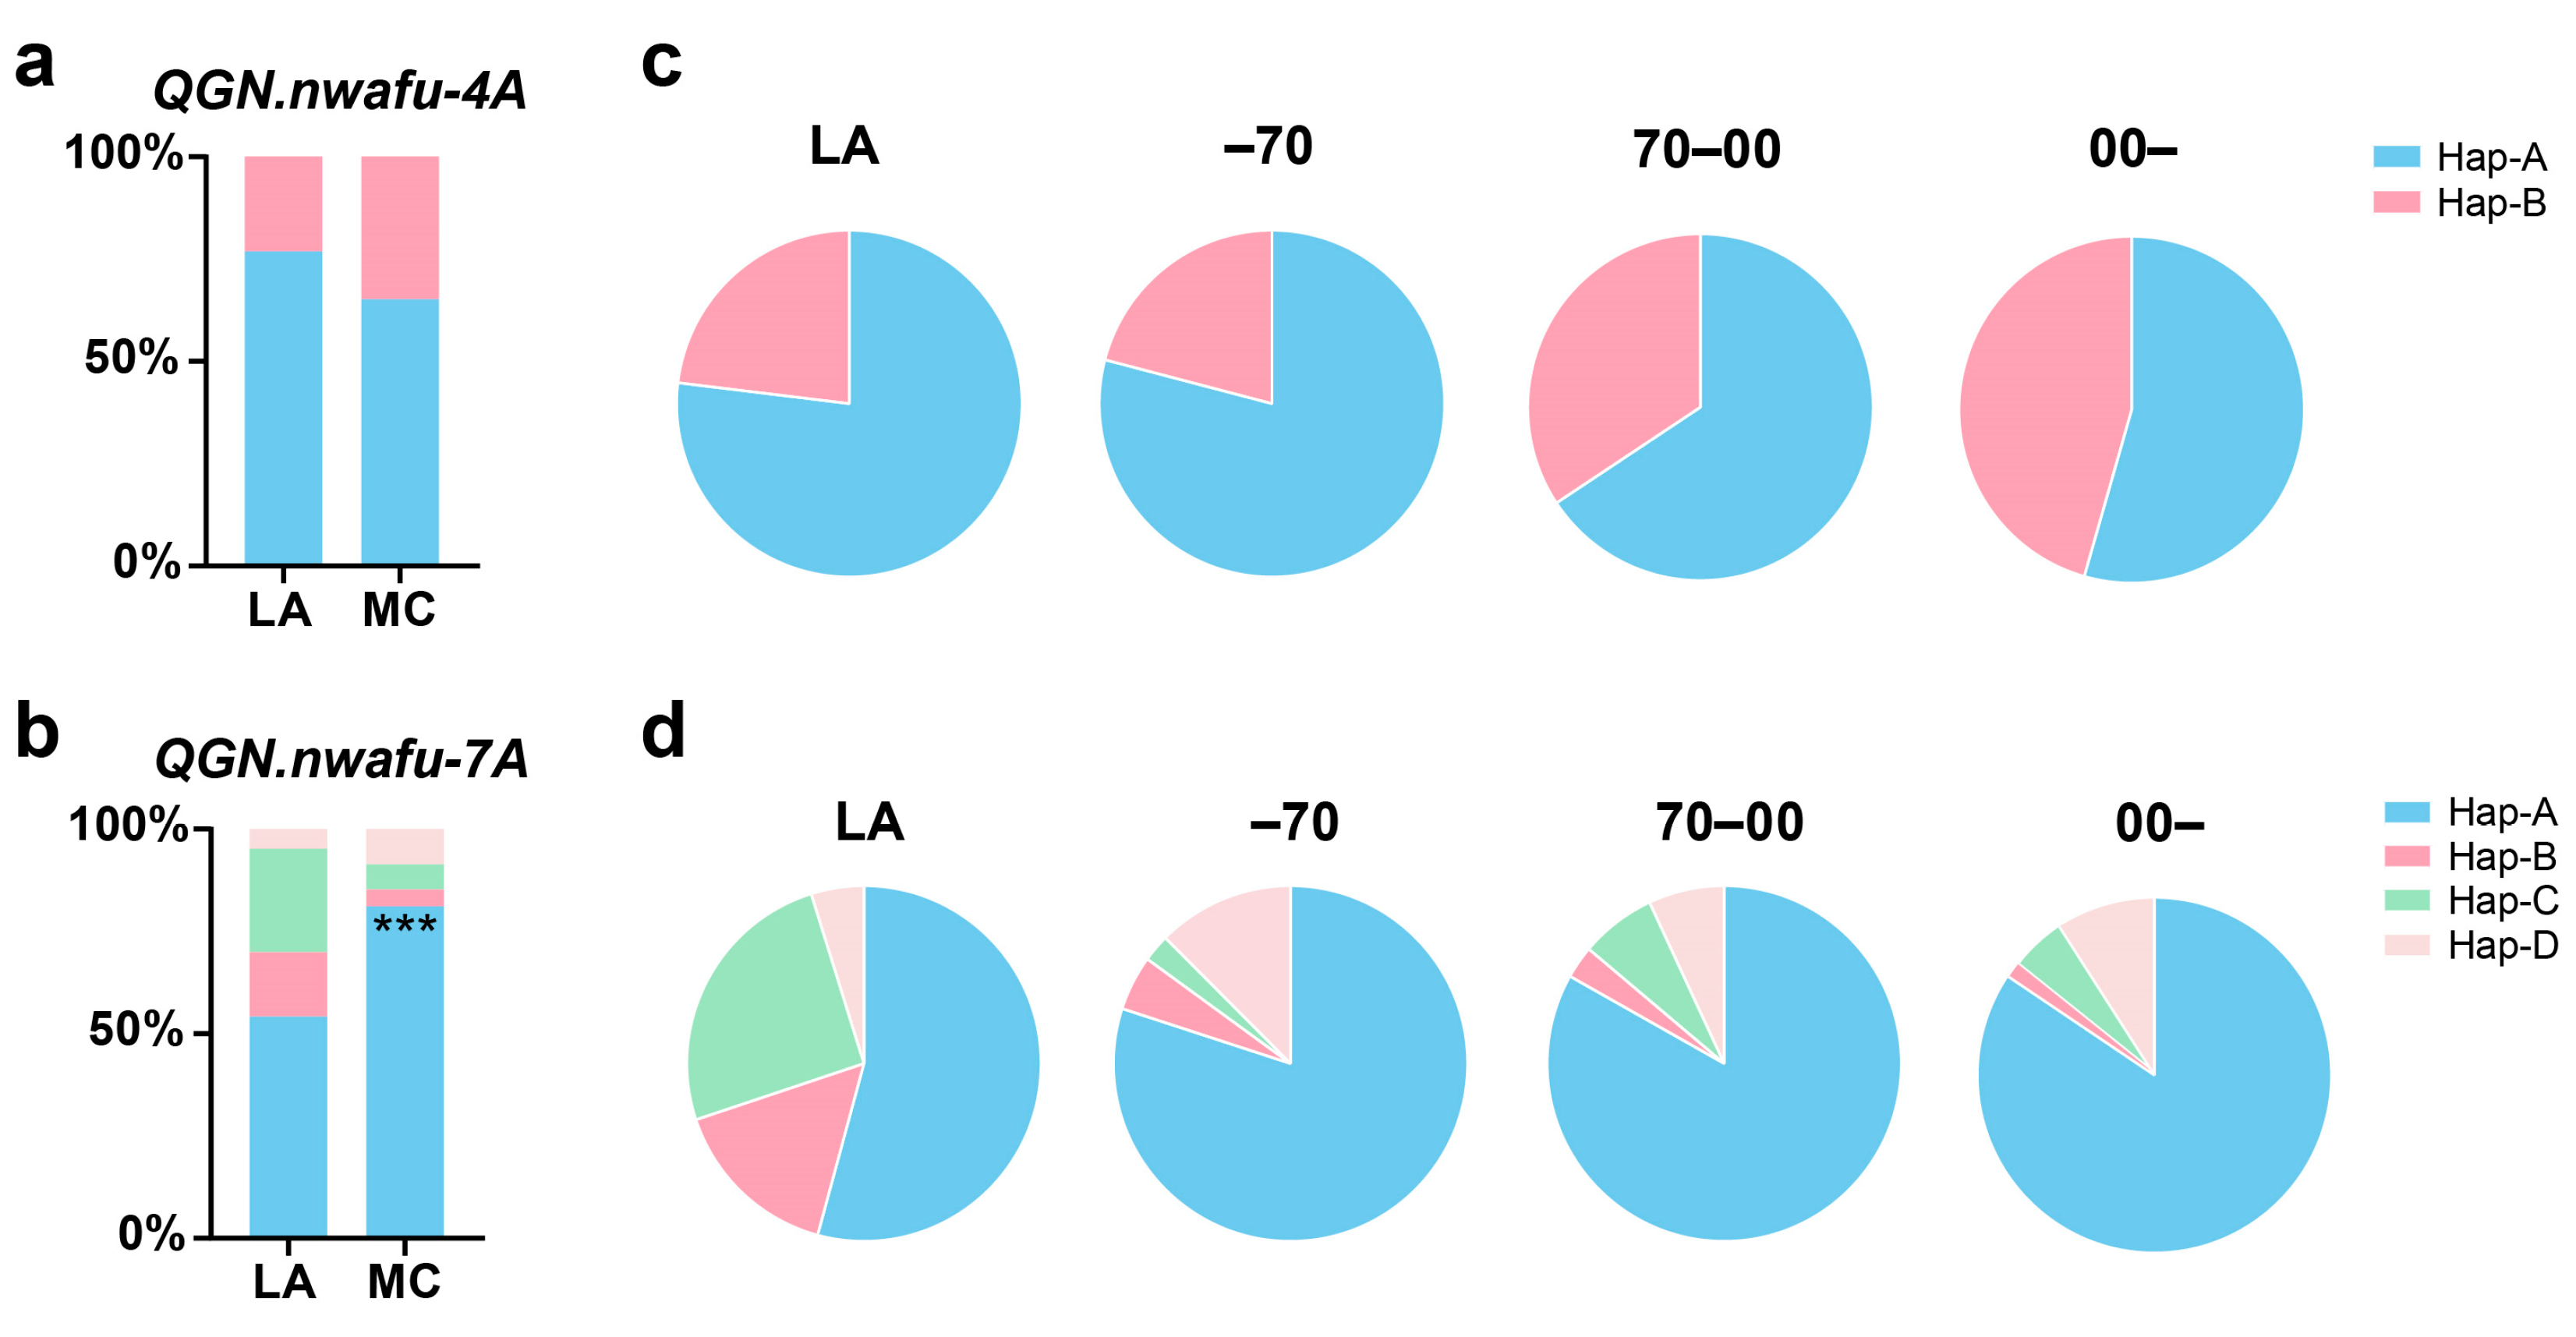
3.6. Selection and Application for QGN.nwafu-4A and QGN.nwafu-7A in Different Chinese Wheat Regions

The grain number exhibited a significant increase in both cultivars from Chinese modern cultivars (CMC) or introduced abroad cultivars (IC), with a particularly significant increase observed in CMC from the Yellow and Huai wheat zone (Y&H), as compared to LA (Figure 7a,b). Although no significant selection preferences were found for QGN.nwafu-4A between LA and MC, the frequency of Hap-B of QGN.nwafu-4A increased in CMC in Y&H, while the frequency of Hap-A of QGN.nwafu-4A increased in IC compared to LA (Figure 7c). These results suggest that the elite haplotype of QGN.nwafu-4A is not fully selected in Chinese modern wheat breeding, indicating the potential utilization of excellent germplasm from abroad for future wheat variety improvement. Conversely, the frequency of elite haplotypes of QGN.nwafu-7A increased in CMC, with haplotype A and haplotype D concentrated in Y&H and other wheat zones of China (OTW), respectively (Figure 7d). Interestingly, no significant selection preferences were found for each haplotype of QGN.nwafu-4A and QGN.nwafu-7A in the middle and lower reaches of the Yangtze River winter wheat zone (YTR), which is consistent with the lower GN observed in this Chinese wheat region (Figure 7b). This implies a potential application of this locus for future wheat breeding in this region.

4. Discussion

4.1. The Contribution of Grain Number to Wheat Yield

Wheat (Triticum aestivum L.) is one of the most widely cultivated food crops. Enhancing grain yield is a crucial task to ensure global food and nutritional security. The complexity of wheat yield is attributed to the interaction of three vital components: thousand kernel weight (TKW), grain number per spike (GNS), and spike number per unit area (SN) [2]. Among these components, GNS, which is affected by spike development and structure, exerts a substantial influence on grain productivity and overall yield [51]. Therefore, achieving an optimal spike structure and grain number is a pivotal objective in wheat breeding efforts.
However, improving grain yield through the selection process encounters significant challenges primarily due to three factors: (1) the pronounced interaction between genotypes and environmental conditions, (2) relatively low heritability, and (3) the complex genetic architecture of this trait, which depends on several related traits [52]. Thus, selecting for grain yield indirectly via highly heritable and related traits would be a practicable way. In our study, both GN and TKW showed higher broad-sense heritability (h2) (Table 1), indicating the significance of these two traits in determining wheat yield. Most studies have attributed the increased wheat yields to increases in GN, TKW, or both [2,53,54]. However, recent investigations from Ireland [3] and the winter wheat regions of north China [4] have suggested that wheat grain yield is more profoundly impacted by fluctuations in grain number per spike than alterations in grain size. In the north China region, breeding and selection have been focused on increasing both grain number per spike and grain weight, depending on the specific positions of the grains within the spike. It has been observed that grain number may have a more significant impact on yield than grain weight [4]. Interestingly, our findings indicate that GN is significantly higher in the Yellow and Huai wheat region (located in north China), in contrast to the Yangtze River Winter wheat zone (located in middle China). These results support the conclusion that GN could be a crucial and potentially more important trait determining high wheat yield in this wheat region. Moreover, GN exhibited a negative correlation with TKW. Conversely, GN showed significant positive correlations with KPS and SNPS (Figure 1b). These results highlight the complexity and correlations between GN and other yield-related traits.

4.2. Enrichment of Spike-Related QTLs Based on GWAS Assay

In contrast to bi-parental mapping populations, which have limitations in identifying a restricted set of alleles, genome-wide association studies (GWAS) based on natural populations provide a broader genetic landscape and have proven to be an effective strategy for detecting numerous genetic loci associated with complex traits [49,55,56,57]. GWAS for yield-related traits is an effective method for detecting multi-allelic variation [53,58]. In this study, a total of 406 wheat accessions were genotyped in GWAS using 157,050 high- quality SNPs. We identified 66 stable and reported QTLs, among which 17 QTLs overlapped with previously mapped QTLs. Additionally, five QTLs were repeatedly reported, showing close physical location and association with the same spike trait as previous studies (Table S2 and Table 2). These findings underscore the reliability of our GWAS results and provide additional insights into the reported wheat QTLs.
In addition, we observed a relatively high number of QTLs associated with TKW and GN, while the number of QTLs identified for ISR was comparatively lower (Table S3), consistent with the heritability of these traits (Table 1). Our analysis identified five reliable QTLs, among which QGN.nwafu-4A and QGN.nwafu-7A were found to be reliable QTLs for GN (Figure 4), in agreement with [36,49,50]. Specifically, QGN-4A showed a pleiotropy for GN, KPS, and SL in our study (Table 2, Figure 3 and Figure 4).

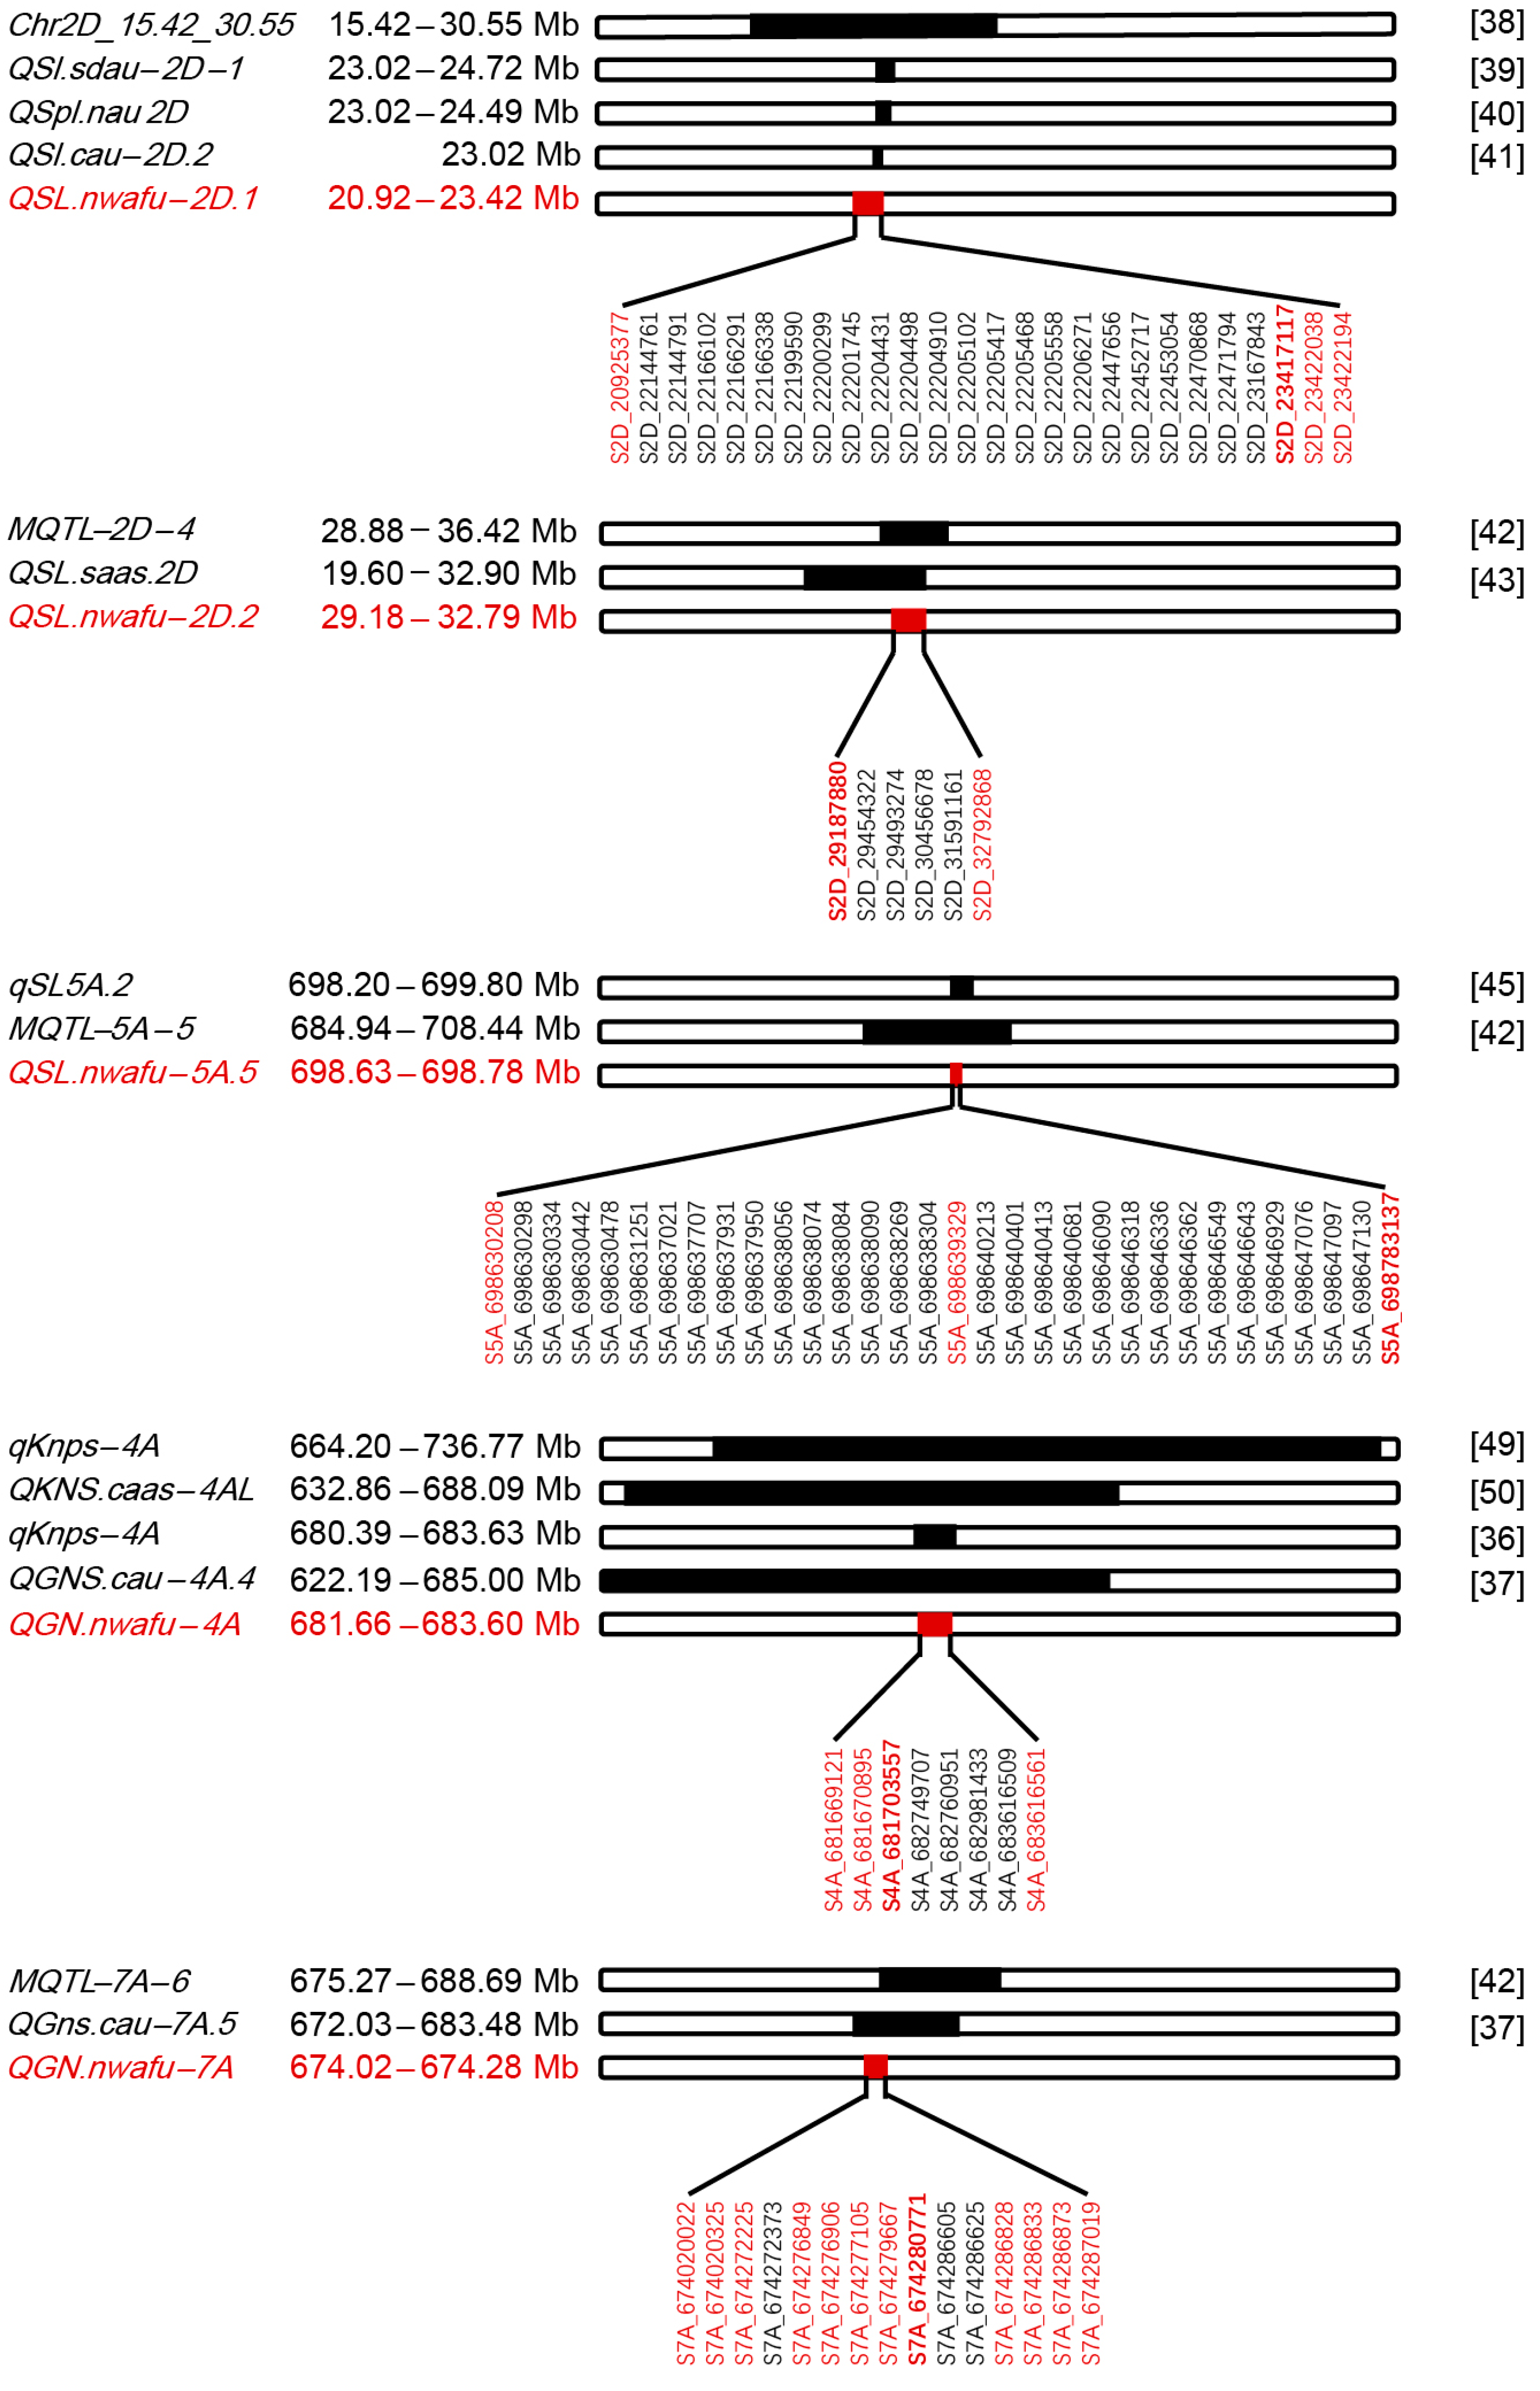
4.3. Repetitive and Novel QTLs of Spike-Related Traits Compared with Previous Research

Although spike-related traits are complex quantitative traits and greatly influenced by environments, previous studies have reported the identification of QTLs associated with these traits distributed across all wheat chromosomes [2,36,37,42,50,59,60,61,62,63]. In this study, we detected 66 QTLs governing six spike-related traits, primarily located on chromosomes 1B, 2A, 2B, 2D, 3B, 4A, 4B, 5A, 5B, 6B, and 7A (Table 2 and Table S2). Among these QTLs, we identified 16, 21, 11, 8, 7, and 3 QTL for SL, TKW, SNPS, GN, KPS, and ISR, respectively.
In previous studies, a QTL for GN has been repeatedly detected in the genomic interval of 622.19–731.77 Mb on chromosome 4A [36,37,49,50]. In this study, we detected QGN.nwafu-4A within the genomic interval of 681.66–683.60 Mb on 4A chromosome (Table 2), which aligns with the previously reported region. Intriguingly, QGN.nwafu-4A partially overlaps with QSL.nwafu-4A.1 and QKPS.nwafu-4A (Table S2), indicating a correlation among these spike-related traits. In addition, we identified QGN.nwafu-7A as a stable QTL, with Hap-A contributing to the improvement of grain number during wheat breeding (Figure 6b,d). QGN.nwafu-7A maps to the same region as a previously detected QTL [37,42] and colocalizes with the recently described WAPO-A1 gene (at 674.07 Mb), which affects the total number of spikelets per spike [64]. This suggests that WAPO-A1 could be the candidate gene for QGN.nwafu-7A. Additionally, QGN.nwafu-2A.2 showed a similar genomic region as previously reported (Table S2), but it is distant from the GNI-A1 gene (on chromosome 2A, 626.0–631.4 Mb), which is a major gene determining floret fertility and grain number [14]. Thus, we speculated that QGN.nwafu-2A.2 is not allelic to GNI-A1.
Out of the 16 QTLs detected for SL, five showed partial or complete overlap with previously reported QTLs. Notably, QSL.nwafu-2D.1 and QSL.nwafu-2D.2 overlap with several previous reported QTLs, and QSL.nwafu-5A.5 has been detected in equivalent regions and reported in multiple studies. Moreover, the identification of QSL.nwafu-2D.2 and QSL.nwafu-5A.5 narrowed the physical region to 3. 61 Mb and 0.15 Mb, respectively (Table 2), which further advances the search for genes related to spike length.
Regarding TGW, four QTLs, namely QTKW.nwafu-3A, QTKW.nwafu-4B.1, QTKW.nwafu-4B.2, and QTKW.nwafu-7D, were found to show the same or very close physical location as previous studies [2,45,46] (Table S2). For KPS, QKPS.nwafu-4A, QKPS.nwafu-4B.1, and QKPS.nwafu-4B.1, were detected on chromosomes 4A and 4B, consistent with earlier reports. Notably, QKPS.nwafu-4B.1 colocalizes with the Rht-B1 gene, which has been reported as a regulator of grain weight [65]. Thus, we speculate that Rht-B1 might be a potential candidate gene influencing KPS, given its association with grain yield [21]. Additionally, two significant QTLs for SNPS, QSNPS.nwafu-2D and QSNPS.nwafu-4A, were detected on chromosomes 2D and 4A, aligning with findings from previous studies [47,48] (Table S2).
Furthermore, we identified 11 novel stable QTLs for SL located on chromosomes 1B, 3B, 4A, 5A, 5B, and 6B. Additionally, we discovered 17 novel stable QTLs for TKW located on chromosome 4A. Moreover, nine novel stable QTLs for SNPS were detected on chromosomes 1B, 1D, 2A, 4B, 5B, 6B, and 7A. For GN, 5 novel stable QTLs for GN were found on chromosomes 1A, 2B, 5A, and 6B. In addition, four novel stable QTLs for KPS were detected on chromosomes 1B, 2A, 2B, and 5A. Finally, three novel stable QTLs for ISR were detected on chromosomes 2B and 6B (Table S2). These newly identified QTLs provide valuable resources for the exploration of genes related to spike traits.

4.4. Selection and Application of GN-Related QTLs in Wheat Breeding

Although numerous QTLs underlying grain number per spike have been identified in wheat [2,66,67,68], the practical selection and integration of these QTLs in the breeding process have not been extensively explored. Haplotype analysis, a powerful technique for allele assessment, has been effectively employed to investigate the functionality, selection, and evolution of genes related to yield, as demonstrated in studies such as that of TaCWI [69]. In this study, we conducted haplotype analyses on two previously identified QTLs related to GN using a combination of discerned significant SNPs. Hap-A of the pleiotropic QTL QGN.nwafu-4A showed a superior effect, and both Hap-A and Hap-D of QGN.nwafu-7A exhibited a superior effect on GN, KPS, and ISR (Figure 5).
Compared to LA, the traits of TKW, SNPS, GN, and KPS showed significant improvement in MC, corresponding to the goal of achieving high grain yield in wheat breeding [2]. Furtherly, the Hap-A of QGN.nwafu-7A displayed a higher frequency in the MC than in LA, especially in cultivars released after the year 2000. However, no distinct haplotype pattern of the pleiotropic QGN.nwafu-4A was observed between MC and LA (Figure 6). Moreover, the haplotypes of QGN.nwafu-7A.2 were concentrated across different wheat regions in China. The superior Hap-A was concentrated in Yellow and Huai wheat zone, while the superior Hap- D was enriched in other wheat zones of China (OTW) (Figure 7). This highlights a wide applicability of the elite QGN.nwafu-7A haplotype in Chinese modern wheat breeding, indicating distinct selection preferences among different wheat regions in China. In contrast, the superior haplotype of QGN.nwafu-4A was significantly enriched in the varieties from abroad, with no significant enrichment in the main wheat zones of China. This variation in distribution frequency across different wheat regions may be attributed to the ecological selection effect driven by differing climate conditions in these regions.

5. Conclusions

In summary, a total of 66 stable and previously reported QTLs associated with wheat spike traits were detected through GWAS. Among them, two reliable QTLs related to GN were identified. Haplotype analysis showed that the superior haplotypes of these two GN-related QTLs have been selected during modern breeding process, particularly in cultivars released after the year 2000. The frequency of haplotype distribution showed that the superior haplotypes of QGN.nwafu-7A, but not QGN.nwafu-4A, were concentrated in Chinese wheat zones, providing a clue for further high-yield breeding.

Supplementary Materials

The following supporting information can be downloaded at: https://www.mdpi.com/article/10.3390/agronomy13102538/s1, Figure S1: Manhattan and Q–Q plots for spike-related traits; Table S1: The information and phenotypes of 406 wheat accessions in seven environments; Table S2: Summary of stable and reported QTLs identified by GWAS of six spike-related traits; Table S3: Statistics of QTL numbers for six spike-related traits in multiple environments.

Author Contributions

J.W. and Y.C. conducted the experiments and wrote the paper; J.W., Y.C. and X.L. constructed the graphics; Y.C. and Z.L. collated and statistically analyzed the data; S.X. designed the experiment; S.X. and M.L. reviewed the paper. All authors have read and agreed to the published version of the manuscript.

Funding

This research was funded by the Hainan Yazhou Bay Seed Laboratory (B21E18101), “Integration of Two Chains” Key Research and Development Projects of Shaanxi Province “Wheat Seed Industry Innovation Project”, and Key R&D of Yangling Seed Industry Innovation Center (Ylzy-xm-01).

Data Availability Statement

The datasets supporting the results of this article are included within the main text and the Supplementary Materials. The phenotypes and SNP data are available at https://iwheat.net/resource/ (accessed on 10 April 2021) for free download.

Conflicts of Interest

The authors declare no conflict of interest.

References

  1. Tadesse, W.; Sanchez-Garcia, M.; Assefa, S.G.; Amri, A.; Bishaw, Z.; Ogbonnaya, F.C.; Baum, M. Genetic Gains in Wheat Breeding and Its Role in Feeding the World. Crop Breed. Genet. Genom 2019, 1, e190005. [Google Scholar]
  2. Cao, S.; Xu, D.; Hanif, M.; Xia, X.; He, Z. Genetic architecture underpinning yield component traits in wheat. Theor. Appl. Genet. 2020, 133, 1811–1823. [Google Scholar] [CrossRef] [PubMed]
  3. Lynch, J.P.; Doyle, D.; McAuley, S.; McHardy, F.; Danneels, Q.; Black, L.C.; White, E.M.; Spink, J. The impact of variation in grain number and individual grain weight on winter wheat yield in the high yield potential environment of Ireland. Eur. J. Agron. 2017, 87, 40–49. [Google Scholar] [CrossRef]
  4. Feng, F.; Han, Y.; Wang, S.; Yin, S.; Peng, Z.; Zhou, M.; Gao, W.; Wen, X.; Qin, X.; Siddique, K.H.M. The Effect of Grain Position on Genetic Improvement of Grain Number and Thousand Grain Weight in Winter Wheat in North China. Front. Plant Sci. 2018, 9, 129. [Google Scholar] [CrossRef] [PubMed]
  5. Sreenivasulu, N.; Schnurbusch, T. A genetic playground for enhancing grain number in cereals. Trends Plant Sci. 2012, 17, 91–101. [Google Scholar] [CrossRef] [PubMed]
  6. Hanif, M.; Langer, R.H.M. The Vascular System of the Spikelet in Wheat (Triticum aestivum L.). Ann. Bot. 1972, 36, 721–727. [Google Scholar] [CrossRef]
  7. Wang, Y.; Du, F.; Wang, J.; Wang, K.; Tian, C.; Qi, X.; Lu, F.; Liu, X.; Ye, X.; Jiao, Y. Improving Bread Wheat Yield through Modulating an Unselected AP2/ERF Gene. Nat. Plants. 2022, 8, 930–939. [Google Scholar] [CrossRef]
  8. Sakuma, S.; Schnurbusch, T. Of floral fortune: Tinkering with the grain yield potential of cereal crops. New Phytol. 2020, 225, 1873–1882. [Google Scholar] [CrossRef]
  9. Kole, C.; Muthamilarasan, M.; Henry, R.; Edwards, D.; Sharma, R.; Abberton, M.; Batley, J.; Bentley, A.; Blakeney, M.; Bryant, J.; et al. Application of Genomics-Assisted Breeding for Generation of Climate Resilient Crops: Progress and Pro-spects. Front. Plant Sci. 2015, 6, 563. [Google Scholar] [CrossRef]
  10. International Wheat Genome Sequencing Consortium (IWGSC). Shifting the Limits in Wheat Research and Breeding Using a Fully Annotated Reference Genome. Science 2018, 361, eaar7191. [Google Scholar] [CrossRef]
  11. Henry, R.J.; Furtado, A.; Rangan, P. Wheat seed transcriptome reveals genes controlling key traits for human preference and crop adaptation. Curr. Opin. Plant Biol. 2018, 45, 231–236. [Google Scholar] [CrossRef]
  12. Segura, V.; Vilhjálmsson, B.J.; Platt, A.; Korte, A.; Seren, Ü.; Long, Q.; Nordborg, M. An Efficient Multi-Locus Mixed-Model Approach for Genome-Wide Association Studies in Structured Populations. Nat. Genet. 2012, 44, 825–830. [Google Scholar] [CrossRef] [PubMed]
  13. Zhang, L.; Liu, D.; Guo, X.; Yang, W.; Sun, J.; Wang, D.; Zhang, A. Genomic Distribution of Quantitative Trait Loci for Yield and Yield-Related Traits in Common Wheat. J. Integr. Plant Biol. 2010, 52, 996–1007. [Google Scholar] [CrossRef] [PubMed]
  14. Sakuma, S.; Golan, G.; Guo, Z.; Ogawa, T.; Tagiri, A.; Sugimoto, K.; Bernhardt, N.; Brassac, J.; Mascher, M.; Hensel, G.; et al. Unleashing floret fertility in wheat through the mutation of a homeobox gene. Proc. Natl. Acad. Sci. USA 2019, 116, 5182–5187. [Google Scholar] [CrossRef] [PubMed]
  15. Dixon, L.E.; Greenwood, J.R.; Bencivenga, S.; Zhang, P.; Cockram, J.; Mellers, G.; Ramm, K.; Cavanagh, C.; Swain, S.M.; Boden, S.A. TEOSINTE BRANCHED1 Regulates Inflorescence Architecture and Development in Bread Wheat (Triticum aestivum L.). Plant Cell 2018, 30, 563–581. [Google Scholar] [CrossRef]
  16. Zhang, X.; Jia, H.; Li, T.; Wu, J.; Nagarajan, R.; Lei, L.; Powers, C.; Kan, C.C.; Hua, W.; Liu, Z.; et al. TaCol-B5 Modifies Spike Architecture and Enhances Grain Yield in Wheat. Science 2022, 376, 180–183. [Google Scholar] [CrossRef]
  17. Dobrovolskaya, O.; Pont, C.; Sibout, R.; Martinek, P.; Badaeva, E.; Murat, F.; Chosson, A.; Watanabe, N.; Prat, E.; Gautier, N.; et al. FRIZZY PANICLE Drives Supernumerary Spikelets in Bread Wheat. Plant Physiol. 2015, 167, 189–199. [Google Scholar] [CrossRef]
  18. Li, Y.; Li, L.; Zhao, M.; Guo, L.; Guo, X.; Zhao, D.; Batool, A.; Dong, B.; Xu, H.; Cui, S.; et al. Wheat FRIZZY PANICLE Activates VERNALIZATION1-A and HOMEOBOX4-A to Regulate Spike Development in Wheat. Plant Biotechnol. J. 2021, 19, 1141–1154. [Google Scholar] [CrossRef]
  19. Zhang, J.; Xiong, H.; Guo, H.; Li, Y.; Xie, X.; Xie, Y.; Zhao, L.; Gu, J.; Zhao, S.; Ding, Y.; et al. Identification of the Q Gene Playing a Role in Spike Morphology Variation in Wheat Mutants and Its Regulatory Network. Front. Plant Sci. 2021, 12, 807731. [Google Scholar] [CrossRef]
  20. Okada, T.; Jayasinghe, J.E.A.R.M.; Eckermann, P.; Watson-Haigh, N.S.; Warner, P.; Hendrikse, Y.; Baes, M.; Tucker, E.J.; Laga, H.; Kato, K.; et al. Effects of Rht-B1 and Ppd-D1 loci on pollinator traits in wheat. Theor. Appl. Genet. 2019, 132, 1965–1979. [Google Scholar] [CrossRef]
  21. Achilli, A.L.; Roncallo, P.F.; Larsen, A.O.; Dreisigacker, S.; Echenique, V. Population structure, allelic variation at Rht-B1 and Ppd-A1 loci and its effects on agronomic traits in Argentinian durum wheat. Sci. Rep. 2022, 12, 9629. [Google Scholar] [CrossRef] [PubMed]
  22. Sun, Q.M.; Zhou, R.H.; Gao, L.F.; Zhao, G.Y.; Jia, J.Z. The Characterization and Geographical Distribution of the Genes Responsible for Vernalization Requirement in Chinese Bread Wheat. J. Integr. Plant Biol. 2009, 51, 423–432. [Google Scholar] [CrossRef] [PubMed]
  23. Yang, J.; Zhou, Y.; Hu, W.; Zhang, Y.; Zhou, Y.; Chen, Y.; Wang, X.; Zhao, H.; Cao, T.; Liu, Z. Unlocking the Rela-tionships among Population Structure, Plant Architecture, Growing Season, and Environmental Adaptation in Henan Wheat Cultivars. BMC Plant Biol. 2020, 20, 469. [Google Scholar] [CrossRef] [PubMed]
  24. Bates, D.; Mächler, M.; Bolker, B.; Walker, S. Fitting Linear Mixed-Effects Models Using Lme4. arXiv 2014, arXiv:1406.5823. [Google Scholar]
  25. Smith, S.E.; Kuehl, R.O.; Ray, I.M.; Hui, R.; Soleri, D. Evaluation of Simple Methods for Estimating Broad-Sense Heritability in Stands of Randomly Planted Genotypes. Crop Sci. 1998, 38, 1125–1129. [Google Scholar] [CrossRef]
  26. Liu, X.; Huang, M.; Fan, B.; Buckler, E.S.; Zhang, Z. Iterative Usage of Fixed and Random Effect Models for Powerful and Efficient Genome-Wide Association Studies. PLoS Genet. 2016, 12, e1005767. [Google Scholar] [CrossRef]
  27. Liu, Z.; Zhao, P.; Lai, X.; Wang, X.; Ji, W.; Xu, S. The Selection and Application of Peduncle Length QTL Qpl_6d.1 in Modern Wheat (Triticum aestivum L.) Breeding. Theor. Appl. Genet. 2023, 136, 32. [Google Scholar] [CrossRef]
  28. Lipka, A.E.; Tian, F.; Wang, Q.; Peiffer, J.; Li, M.; Bradbury, P.J.; Gore, M.A.; Buckler, E.S.; Zhang, Z. GAPIT: Genome association and prediction integrated tool. Bioinformatics 2012, 28, 2397–2399. [Google Scholar] [CrossRef]
  29. Tian, F.; Bradbury, P.; Brown, P.; Sun, Q.; Flint-Garcia, S.; Rocheford, T.; McMullen, M.; Holland, J.; Buckler, E. Genome-Wide Association Study of Leaf Architecture in the Maize Nested Association Mapping Population. Nat. Genet. 2011, 43, 159–162. [Google Scholar] [CrossRef]
  30. Hirsch, C.N.; A Flint-Garcia, S.; Beissinger, T.M.; Eichten, S.R.; Deshpande, S.; Barry, K.; McMullen, M.D.; Holland, J.B.; Buckler, E.S.; Springer, N.; et al. Insights into the Effects of Long-Term Artificial Selection on Seed Size in Maize. Genetics 2014, 198, 409–421. [Google Scholar]
  31. Wang, X.; Zhao, P.; Guo, X.; Liu, Z.; Ma, X.; Zhao, Y.; Lai, X.; Huang, L.; Wang, W.; Han, D. Population Sequencing Reveals Rht-D1b Contributing the Bigger Seedling Root to Modern Wheat Cultivars. bioRxiv 2022.
  32. Liu, Z.; Lai, X.; Chen, Y.; Zhao, P.; Wang, X.; Ji, W.; Xu, S. Selection and application of four QTLs of grain protein content in modern wheat cultivars. J. Integr. Agric. 2023. [CrossRef]
  33. Zhang, C.; Dong, S.-S.; Xu, J.-Y.; He, W.-M.; Yang, T.-L. PopLDdecay: A fast and effective tool for linkage disequilibrium decay analysis based on variant call format files. Bioinformatics 2019, 35, 1786–1788. [Google Scholar] [CrossRef] [PubMed]
  34. Bailey-Serres, J.; Parker, J.E.; Ainsworth, E.A.; Oldroyd, G.E.D.; Schroeder, J.I. Genetic strategies for improving crop yields. Nature 2019, 575, 109–118. [Google Scholar] [CrossRef]
  35. Valdar, W.; Holmes, C.C.; Mott, R.; Flint, J. Mapping in Structured Populations by Resample Model Averaging. Genetics 2009, 182, 1263–1277. [Google Scholar] [CrossRef] [PubMed]
  36. Cui, F.; Zhang, N.; Fan, X.; Zhang, W.; Zhao, C.; Yang, L.; Pan, R.; Chen, M.; Han, J.; Zhao, X. Utilization of a Wheat660k Snp Array-Derived High-Density Genetic Map for High-Resolution Mapping of a Major QTL for Kernel Number. Sci. Rep. 2017, 7, 3788. [Google Scholar] [CrossRef] [PubMed]
  37. Guan, P.; Lu, L.; Jia, L.; Kabir, M.R.; Zhang, J.; Lan, T.; Zhao, Y.; Xin, M.; Hu, Z.; Yao, Y.; et al. Global QTL Analysis Identifies Genomic Regions on Chromosomes 4A and 4B Harboring Stable Loci for Yield-Related Traits Across Different Environments in Wheat (Triticum aestivum L.). Front. Plant Sci. 2018, 9, 529. [Google Scholar] [CrossRef] [PubMed]
  38. Wang, Z.; Deng, Z.; Kong, X.; Wang, F.; Guan, J.; Cui, D.; Sun, G.; Liao, R.; Fu, M.; Che, Y.; et al. Indels Identification and Association Analysis with Spike and Awn Length in Chinese Wheat Mini-Core Collection. Int. J. Mol. Sci. 2022, 23, 5587. [Google Scholar] [CrossRef]
  39. Deng, Z.; Cui, Y.; Han, Q.; Fang, W.; Li, J.; Tian, J. Discovery of Consistent QTLs of Wheat Spike-Related Traits under Nitrogen Treatment at Different Development Stages. Front. Plant Sci. 2017, 8, 2120. [Google Scholar] [CrossRef]
  40. Wu, X.; Cheng, R.; Xue, S.; Kong, Z.; Ma, Z. Precise Mapping of a Quantitative Trait Locus Interval for Spike Length and Grain Weight in Bread Wheat (Triticum Aestivum L.). Mol. Breed. 2014, 33, 129–138. [Google Scholar] [CrossRef]
  41. Zhai, H.; Feng, Z.; Li, J.; Liu, X.; Xiao, S.; Ni, Z.; Sun, Q. QTL Analysis of Spike Morphological Traits and Plant Height in Winter Wheat (Triticum Aestivum L.) Using a High-Density Snp and Ssr-Based Linkage Map. Front. Plant Sci. 2016, 7, 1617. [Google Scholar] [CrossRef] [PubMed]
  42. Yang, Y.; Amo, A.; Wei, D.; Chai, Y.; Zheng, J.; Qiao, P.; Cui, C.; Lu, S.; Chen, L.; Hu, Y. Large-scale integration of meta-QTL and genome-wide association study discovers the genomic regions and candidate genes for yield and yield-related traits in bread wheat. Theor. Appl. Genet. 2021, 134, 3083–3109. [Google Scholar] [CrossRef] [PubMed]
  43. Li, Y.; Gao, J.; Zhang, R.; Song, G.; Zhang, S.; Li, W.; Li, G. Identification of New QTL for Yield-Related Traits in Chinese Landrace and Elite Wheat Varieties through a Genome-Wide Linkage Mapping. Euphytica 2020, 216, 1–14. [Google Scholar] [CrossRef]
  44. Chen, D.; Wu, X.; Wu, K.; Zhang, J.; Liu, W.; Yang, X.; Li, X.; Lu, Y.; Li, L. Novel and Favorable Genomic Regions for Spike Related Traits in a Wheat Germplasm Pubing 3504 with High Grain Number Per Spike under Varying Environments. J. Integr. Agric. 2017, 11, 34–49. [Google Scholar] [CrossRef]
  45. Pang, Y.; Liu, C.; Wang, D.; Amand, P.S.; Bernardo, A.; Li, W.; He, F.; Li, L.; Wang, L.; Yuan, X.; et al. High-Resolution Ge-nome-Wide Association Study Identifies Genomic Regions and Candidate Genes for Important Agronomic Traits in Wheat. Mol. Plant 2020, 13, 1311–1327. [Google Scholar] [CrossRef]
  46. Li, F.; Wen, W.; He, Z.; Liu, J.; Jin, H.; Cao, S.; Geng, H.; Yan, J.; Zhang, P.; Wan, Y.; et al. Genome-wide linkage mapping of yield-related traits in three Chinese bread wheat populations using high-density SNP markers. Theor. Appl. Genet. 2018, 131, 1903–1924. [Google Scholar] [CrossRef]
  47. Zhou, Y.; Conway, B.; Miller, D.; Marshall, D.; Cooper, A.; Murphy, P.; Chao, S.; Brown-Guedira, G.; Costa, J. Quantitative Trait Loci Mapping for Spike Characteristics in Hexaploid Wheat. Plant Genome 2017, 10, 1–15. [Google Scholar] [CrossRef]
  48. Jantasuriyarat, C.; Vales, M.I.; Watson, C.J.W.; Riera-Lizarazu, O. Identification and mapping of genetic loci affecting the free-threshing habit and spike compactness in wheat (Triticum aestivum L.). Theor. Appl. Genet. 2003, 108, 261–273. [Google Scholar] [CrossRef]
  49. Cui, F.; Zhao, C.; Ding, A.; Li, J.; Wang, L.; Li, X.; Bao, Y.; Li, J.; Wang, H. Construction of an integrative linkage map and QTL mapping of grain yield-related traits using three related wheat RIL populations. Theor. Appl. Genet. 2014, 127, 659–675. [Google Scholar] [CrossRef]
  50. Gao, F.; Wen, W.; Liu, J.; Rasheed, A.; Yin, G.; Xia, X.; Wu, X.; He, Z. Genome-Wide Linkage Mapping of QTL for Yield Components, Plant Height and Yield-Related Physiological Traits in the Chinese Wheat Cross Zhou 8425B/Chinese Spring. Front. Plant Sci. 2015, 6, 1099. [Google Scholar] [CrossRef]
  51. Luo, X.; Yang, Y.; Lin, X.; Xiao, J. Deciphering spike architecture formation towards yield improvement in wheat. J. Genet. Genom. 2023, in press. [CrossRef] [PubMed]
  52. Sheoran, S.; Jaiswal, S.; Raghav, N.; Sharma, R.; Sabhyata; Gaur, A.; Jaisri, J.; Tandon, G.; Singh, S.; Sharma, P.; et al. Genome-Wide Association Study and Post-genome-Wide Association Study Analysis for Spike Fertility and Yield Related Traits in Bread Wheat. Front. Plant Sci. 2021, 12, 820761. [Google Scholar] [CrossRef] [PubMed]
  53. Li, F.; Wen, W.; Liu, J.; Zhang, Y.; Cao, S.; He, Z.; Rasheed, A.; Jin, H.; Zhang, C.; Yan, J.; et al. Genetic architecture of grain yield in bread wheat based on genome-wide association studies. BMC Plant Biol. 2019, 19, 168. [Google Scholar] [CrossRef] [PubMed]
  54. Pretini, N.; Vanzetti, L.S.; Terrile, I.I.; Donaire, G.; González, F.G. Mapping QTL for spike fertility and related traits in two doubled haploid wheat (Triticum aestivum L.) populations. BMC Plant Biol. 2021, 21, 353. [Google Scholar] [CrossRef]
  55. Breseghello, F.; Sorrells, M.E. QTL analysis of kernel size and shape in two hexaploid wheat mapping populations. Field Crop. Res. 2007, 101, 172–179. [Google Scholar] [CrossRef]
  56. Gahlaut, V.; Jaiswal, V.; Singh, S.; Balyan, H.S.; Gupta, P.K. Multi-Locus Genome Wide Association Mapping for Yield and Its Contributing Traits in Hexaploid Wheat under Different Water Regimes. Sci. Rep. 2019, 9, 19468. [Google Scholar] [CrossRef]
  57. Saini, D.K.; Chopra, Y.; Singh, J.; Sandhu, K.S.; Kumar, A.; Bazzer, S.; Srivastava, P. Comprehensive evaluation of mapping complex traits in wheat using genome-wide association studies. Mol. Breed. 2022, 42, 1. [Google Scholar] [CrossRef]
  58. Marigorta, U.M.; Rodríguez, J.A.; Gibson, G.; Navarro, A. Replicability and Prediction: Lessons and Challenges from GWAS. Trends Genet. 2018, 34, 504–517. [Google Scholar] [CrossRef]
  59. Quarrie, S.A.; Steed, A.; Calestani, C.; Semikhodskii, A.; Lebreton, C.; Chinoy, C.; Steele, N.; Pljevljakusić, D.; Waterman, E.; Weyen, J.; et al. A High-Density Genetic Map of Hexaploid Wheat (Triticum aestivum L.) from the Cross Chinese Spring X Sq1 and Its Use to Compare QTLs for Grain Yield across a Range of Environments. Theor. Appl. Genet. 2005, 110, 865–880. [Google Scholar] [CrossRef]
  60. Cuthbert, J.L.; Somers, D.J.; Brûlé-Babel, A.L.; Brown, P.D.; Crow, G.H. Molecular mapping of quantitative trait loci for yield and yield components in spring wheat (Triticum aestivum L.). Theor. Appl. Genet. 2008, 117, 595–608. [Google Scholar] [CrossRef]
  61. Jia, H.; Wan, H.; Yang, S.; Zhang, Z.; Kong, Z.; Xue, S.; Zhang, L.; Ma, Z. Genetic dissection of yield-related traits in a recombinant inbred line population created using a key breeding parent in China’s wheat breeding. Theor. Appl. Genet. 2013, 126, 2123–2139. [Google Scholar] [CrossRef] [PubMed]
  62. Liu, G.; Jia, L.; Lu, L.; Qin, D.; Zhang, J.; Guan, P.; Ni, Z.; Yao, Y.; Sun, Q.; Peng, H. Mapping QTLs of yield-related traits using RIL population derived from common wheat and Tibetan semi-wild wheat. Theor. Appl. Genet. 2014, 127, 2415–2432. [Google Scholar] [CrossRef] [PubMed]
  63. Shi, W.; Hao, C.; Zhang, Y.; Cheng, J.; Zhang, Z.; Liu, J.; Yi, X.; Cheng, X.; Sun, D.; Xu, Y.; et al. A Combined Association Mapping and Linkage Analysis of Kernel Number Per Spike in Common Wheat (Triticum aestivum L.). Front. Plant Sci. 2017, 8, 1412. [Google Scholar] [CrossRef] [PubMed]
  64. Kuzay, S.; Xu, Y.; Zhang, J.; Katz, A.; Pearce, S.; Su, Z.; Fraser, M.; Anderson, J.A.; Brown-Guedira, G.; DeWitt, N.; et al. Identification of a Candidate Gene for a QTL for Spikelet Number Per Spike on Wheat Chromosome Arm 7AL by High-Resolution Genetic Mapping. Theor. Appl. Genet. 2019, 132, 2689–2705. [Google Scholar] [CrossRef]
  65. Guan, P.; Shen, X.; Mu, Q.; Wang, Y.; Wang, X.; Chen, Y.; Zhao, Y.; Chen, X.; Zhao, A.; Mao, W.; et al. Dissection and Validation of a QTL Cluster Linked to Rht-B1 Locus Controlling Grain Weight in Common Wheat (Triticum aestivum L.) Using near-Isogenic Lines. Theor. Appl. Genet. 2020, 133, 2639–2653. [Google Scholar] [CrossRef]
  66. Hu, J.; Wang, X.; Zhang, G.; Jiang, P.; Chen, W.; Hao, Y.; Ma, X.; Xu, S.; Jia, J.; Kong, L.; et al. QTL mapping for yield-related traits in wheat based on four RIL populations. Theor. Appl. Genet. 2020, 133, 917–933. [Google Scholar] [CrossRef]
  67. Isham, K.; Wang, R.; Zhao, W.; Wheeler, J.; Klassen, N.; Akhunov, E.; Chen, J. QTL mapping for grain yield and three yield components in a population derived from two high-yielding spring wheat cultivars. Theor. Appl. Genet. 2021, 134, 2079–2095. [Google Scholar] [CrossRef]
  68. Sun, C.; Zhang, F.; Yan, X.; Zhang, X.; Dong, Z.; Cui, D.; Chen, F. Genome-wide association study for 13 agronomic traits reveals distribution of superior alleles in bread wheat from the Yellow and Huai Valley of China. Plant Biotechnol. J. 2017, 15, 953–969. [Google Scholar] [CrossRef]
  69. Jiang, Y.; Jiang, Q.; Hao, C.; Hou, J.; Wang, L.; Zhang, H.; Zhang, S.; Chen, X.; Zhang, X. A yield-associated gene TaCWI, in wheat: Its function, selection and evolution in global breeding revealed by haplotype analysis. Theor. Appl. Genet. 2014, 128, 131–143. [Google Scholar] [CrossRef]
Figure 1. Variation and correlations for spike-related traits. (a) Frequency distribution of spike-related traits in the 406 wheat accessions based on BLUP values. SL: spike length; GN: grain number per spike; SNPS: spikelet number per spike; TKW: thousand kernel weights; KPS: kernel number per spikelet; ISR: infertile spikelet ratio. (b) Pearson’s correlation coefficients of spike-related traits in the 406 wheat accessions. Correlation coefficients among the six traits were calculated based on the BLUP values across seven environments. “**”: p < 0.01.
Agronomy 13 02538 g001
Figure 2. Variations of spike-related traits during modern breeding. (a) Variations of spike-related traits between landraces (LA) and modern cultivars (MC). “***” indicate significant differences by Student’s test (p < 0.001). (b) Change ratio of spike-related traits between LA and MC.
Agronomy 13 02538 g002
Figure 3. Manhattan and Q–Q plots for grain number per spike (GN). The physical location of the point indicated by the arrow coincides with the reported QTLs qKnps-4A [36] and QGns.cau-7A.5 [37], respectively.
Agronomy 13 02538 g003
Figure 4. The physical position of five reliable QTLs and previous loci. The black marks the reported QTL and the SNPs of reported QTL, the red marks the QTLs and the significant SNPs identified by our GWAS. The bold red marks the peak SNP.
Agronomy 13 02538 g004
Figure 5. Variations in haplotypes of five QTLs controlling spike-related traits. Linkage disequilibrium (LD) heatmap of SNPs within the LD block of QGN.nwafu-4A (a) and QGN.nwafu-7A (c). The haplotypic effects of QGN.nwafu-4A (b) and QGN.nwafu-7A (d). Hap: haplotype. Different letters indicate significant differences calculated by one-way ANOVA, followed by Tukey’s test (p < 0.05).
Agronomy 13 02538 g005
Figure 6. Frequency variation of different haplotypes during modern breeding. (a,b) The distribution frequency and changes of each haplotype for QGN.nwafu-4A (a) and QGN.nwafu-7A (b) in LA and MC. (c,d) The distribution frequency of each haplotype for QGN.nwafu-4A (c) and QGN.nwafu-7A (d) in different years. The significance was tested by chi-square test, “***”: p < 0.001. LA: landraces. MC: Modern cultivars. −70: cultivars developed before 1970 year; 70−00: cultivars developed from 1970 to 2000 year; 00−: cultivars developed after 2000 year.
Agronomy 13 02538 g006
Figure 7. The grain numbers and haplotype distribution of two GN QTLs in different wheat regions. (a) The grain number per spike among LA, CMC, and IC. Different letters indicate significant differences calculated by one-way ANOVA, followed by Tukey’s test (p < 0.05). (b) The grain number per spike in Chinese different wheat regions. Different letters indicate significant differences calculated by one-way ANOVA, followed by Tukey’s test (p < 0.05). (c,d) The distribution frequency of each haplotype for QGN.nwafu-4A (c) and QGN.nwafu-7A (d) in different wheat regions. Y&H: Yellow and Huai wheat zone. YTR: the middle and lower reaches of the Yangtze River winter wheat zone. OTW, other wheat zones of China; IC, introduced abroad cultivars. The significance was tested by chi-square test, “***”: p < 0.001.
Agronomy 13 02538 g007
Table 1. Statistics of six spike-related traits in seven environments based on BLUP values.
TraitMeanMinMaxCV (%)h2
SL (cm)10.066.0016.5616.950.92
TKW (g)35.0912.3371.7121.370.82
SNPS19.3912.3325.8012.030.81
GN48.7221.0078.6020.330.78
KPS2.531.143.8118.740.72
ISR0.120.000.5943.950.46
Note: SL: spike length; GN: grain number per spike; SNPS: spikelet number per spike; TKW: thousand kernel weights; KPS: kernel number per spikelet; ISR: infertile spikelet ratio. CV: coefficient of variation. h2: broad-sense heritability.
Table 2. Some of the stable QTLs for spike-related traits identified by resampling GWAS.
TraitsQTLspSNPChrPos (Mb)EnvPVE (%)RMIPQTLs Detected in Previous Studies
TraitsBibliography
SLQSL.nwafu-2D.1S2D_234171172D20.92–23.420/1/2/3/4/5/6/77.59–11.325–44SL[38,39,40,41]
QSL.nwafu-2D.2S2D_291878802D29.18–32.79/0/4/5
6/7
9.6617–38SL[42,43]
QSL.nwafu-4A.1S4A_6817035574A681.70–683.610/3/54.69–5.995–46SL[44]
QSL.nwafu-5A.2S5A_5863083935A586.30/1/3
/5
4.48–6.086–12SL[42]
QSL.nwafu-5A.5 *S5A_6987831375A698.63–698.786/74.21–5.085–39SL[45]
GN, TKW[42]
TKWQTKW.nwafu-3AS3A_334239103A33.42–35.390/4/55.07–6.415–13TKW[46]
QTKW.nwafu-4B.1S4B_407524684B36.15–40.750/4/74.15–6.645–8GN[45]
QTKW.nwafu-4B.2S4B_441851624B44.180/3/74.28–5.366–18GN[45]
QTKW.nwafu-7DS7D_554125607D55.410/4/53.11–4.575–12TKW[2]
SNPSQSNPS.nwafu-2DS2D_6289375842D628.930/4/64.34–5.325–30FS[47]
QSNPS.nwafu-4AS4A_5970242514A597.020/65.83–7.556SNPS[48]
GNQGN.nwafu-2AS2A_7153072742A715.30–715.330/2/44.56–5.385–20TKW[37]
QGN.nwafu-4A *S4A_6817035574A681.70/64.69–7.887–10GN[36,37,49,50]
QGN.nwafu-7AS7A_6742807717A674.02–674.280/2/45.28–8.685–31GN[37,42]
KPSQKPS.nwafu-4A *S4A_6817035574A681.66–681.700/67.56–7.885–9GN[36,49,50]
QKPS.nwafu-4B.1S4B_275224534B27.52–30.860/2/6
7
8.07–11.495–9GN, KPS[21]
QKPS.nwafu-4B.2 *S4B_410138104B36.15–41.010/25.58–7.395–19GN[45]
SL: spike length; GN: grain number per spike; SNPS: spikelet number per spike; TKW: thousand kernel weights; KPS: kernel number per spikelet; ISR: infertile spikelet ratio. pSNP: peak SNP; Chr: chromosome; Pos: physical position of the QTL in the reference genome; Env: environments; PVE: phenotypic variation explained; RMIP: resample model inclusion probability. Bold indicates the QTL was reported repeatedly and identified by the same trait as previous studies. Underline indicates the QTL showed pleiotropy. * Marks the QTL that has been reported, even if they were only identified in two environments.
Disclaimer/Publisher’s Note: The statements, opinions and data contained in all publications are solely those of the individual author(s) and contributor(s) and not of MDPI and/or the editor(s). MDPI and/or the editor(s) disclaim responsibility for any injury to people or property resulting from any ideas, methods, instructions or products referred to in the content.

