Abstract
This study aimed to investigate the effects of drought stress at the flowering stage on the physiological and molecular responses of the genes involved in the brassinosteroid pathway of two chickpea cultivars (ILC1799: drought tolerant, and ILC3279: drought sensitive). The drought resulted in significant reductions in chlorophyll a, chlorophyll b, total chlorophyll and carotenoid content in both cultivars, and had significantly lesser effects on the tolerant cultivar, Samin, compared to that of ILC3279. However, the relative water content, the osmotic potential and the cell membrane stability were less affected by drought in both cultivars. The proline content and peroxidase activity increased significantly under drought stress in both cultivars, with a higher amount in Samin (ILC1799). Members of the BES1 family positively mediate brassinosteroid signaling and play an important role in regulating plant stress responses. The expression of these genes was analyzed in chickpea cultivars under drought. Further, a genome-wide analysis of BES1 genes in the chickpea genome was conducted. Six CaBES1 genes were identified in total, and their phylogenetic tree, gene structures, and conserved motifs were determined. CaBES1 gene expression patterns were analyzed using a transcription database and quantitative real-time PCR analysis. The results revealed that the expression of CaBES1 genes are different in response to various plant stresses. The expression levels of CaBES1.1, CaBES1.2, CaNAC72 and CaRD26 genes were measured by using qRT-PCR. The relative expression of CaBES1.2 in the drought conditions was significantly downregulated. In contrast to CaBES1.1 and CaBES1.2, the expression of CaRD26 and CaNAC72 showed a significant increase under drought stress. The expression of CaRD26 and CaNAC72 genes was significantly higher in the Samin cultivar compared to that of ILC3279 cultivars.
1. Introduction
Chickpea (Cicer arietinum L.) is the second most-produced legume after soybeans worldwide [1]. Iran, with 2% of the world’s total chickpea production, was the eighth-largest producer of chickpeas [1]. The chickpea is an important crop in Iran’s dryland farming system, serving as a nitrogen-fixing legume in rotation with cereals. It is also a significant source of proteins, minerals, carbohydrates, fibers, and other useful compounds, especially for low-income populations [2].
Drought stress during the flowering stage is the major cause of yield loss in chickpeas [3]. Among various factors limiting chickpea growth, drought stress, especially at the end of the growing season, can cause a 33 to 45 percent reduction in yield [4]. Drought stress is very common in semi-arid regions, such as the major part of Iran. Drought stress reduces the photosynthesis rate by changing the chlorophyll components and damaging the photosynthetic machinery [5]. Reactive oxygen species (ROS) damage chloroplasts and are the main reason for chlorophyll decrease under drought conditions [6]. Plants neutralize ROS through both enzymatic and non-enzymatic processes [7]. Enzymatic scavenging enzymes include catalase, superoxide dismutase, glutathione peroxidase, and ascorbate peroxidase, while non-enzymatic antioxidants include ascorbic acid, glutathione, and flavonoids [8]. Plants also accumulate osmolytes such as proline, glycine betaine, and carbohydrates to protect themselves against drought [9].
Brassinosteroids (BRs) are natural plant hormones essential for growth and development. They function similarly to steroid hormones in animals and play a crucial role in various processes through a complex signaling pathway [10]. Preliminary studies have shown that BRs are involved in the regulation of various physiological, biochemical, and developmental plant processes, including cell elongation in stems and roots, leaf expansion, photomorphogenesis, flowering, enzyme activation, male sterility, stomata development, and resistance to abiotic stress [11]. However, the role of BRs in drought stress is more complicated [12]. Several studies have shown that the application of exogenous BRs can increase drought tolerance in plants [13]. In contrast, a few other studies have shown that mutations in BR-related genes lead to increased drought tolerance [14,15].
BRI1-Ethylmethylsulfone-Suppressor 1 (BES1), or brassinazole resistant (BZR), is a new group of plant transcription factors activated by BRs within cells. BES1 regulates the expression of downstream BR-associated genes [16]. The BES1 genes are induced by different abiotic stresses, including drought, ABA, NaCl, and jasmonic acid [12]. It has been reported that BES1 (BZR) mediates the interaction between BR and drought signaling pathways in wheat. BES1 activates the wheat GST1 (TaGST1) and increases the drought response [17]. Moreover, BES1 targets the drought-induced transcription factor RD26 in Arabidopsis [18]. RD26 is a transcription factor that increases plant drought tolerance by promoting downstream drought-responsive gene expression [19]. RD26 is a member of the NAC family. The NAC family is one of the largest families of plant-specific transcription factors (TFs) and plays crucial regulatory roles in a wide range of developmental and stress response processes in plants.
Gene fusion expression studies have revealed that RD26 is constitutively expressed in both roots and shoots during drought and salinity stress treatments [20]. RD26 is among the genes targeted by BES1 and is suppressed by BR signaling [12]. Drought stress-induced BR signaling blocks the transcriptional inhibition of RD26, resulting in the accumulation of RD26 proteins [12]. These accumulated RD26 proteins limit BR signaling by binding to BES1 and acting against its transcriptional activity [11].
Drought stress during the flowering stage poses a major threat to chickpea yield, causing a significant reduction in productivity. This stress is common in semi-arid regions like Iran and negatively affects photosynthesis and chlorophyll content. However, studies have shown that BRs are involved in regulating various plant processes and can enhance drought tolerance in plants. BES1, a transcription factor activated by BRs, plays a crucial role in the interaction between BR and drought signaling pathways. The regulatory mechanisms of BES1/BZR1 transcription factors in Arabidopsis and rice have been well studied [16,21]. The genome-wide identification and characterization of BES1/BZR1 genes have also been described in Solanum tuberosum L. [22], Chinese cabbage (Brassica rapa ssp. pekinensis) [23], Glycine max [24], Cucumis sativus [25], and Beta vulgaris [26].
Understanding the regulatory mechanisms of BES1/BZR1 transcription factors in chickpea plants will provide valuable insights into improving drought tolerance in this important legume crop. The chickpea, one of the most important legumes in the world, has a smaller genome size (730 Mb) compared to other pulse crops like lentils (Lens culinaris L.) and fava beans (Vicia faba L.) [27]. The reference genome for the chickpea species Kabuli, desi, and wild Cicer is accessible [28]. In the current study, we identified members of the CaBES1 gene families and CaRD26 gene homologs from the chickpea genome based on homology, and characterized their gene structures and expression patterns under normal and drought conditions at the flowering stage. We also measured variations in key physiological indicators in response to drought stress at the flowering stage in two chickpea cultivars.
2. Materials and Methods
The chickpea drought-sensitive cultivar ILC3279 and the drought-tolerant cultivar ILC1799 (Samin) genotypes [29] were obtained from the office of agriculture (Jihad Keshavarzi) seed bank in Kurdistan province. To ensure their health, the seeds were treated with fungicide before being cultivated. They were planted in pots containing a mixture of farmland field, sand, and manure in a ratio of 2:2:1, with each pot having a capacity of 11 kg of soil. In each pot, seven seeds were planted at a depth of 5 cm. The experiment followed a factorial design and utilized a Randomized Complete Block Design with three replications. Drought treatment was initiated at the flowering stage, specifically when the plants reached 50% flowering. This treatment involved reducing the soils’ water contents to 20% of the field capacity (FC = 20%). In contrast, the control treatment maintained humid conditions with a field capacity of 100% (FC = 100%). Until the flowering stage, all pots were irrigated once every two days. Subsequently, in the drought-treated pots, irrigation was provided at 20% of the field capacity. The field capacity was determined by monitoring the weight of the pots, which were weighed daily to calculate the field capacities.
Eight days after the drought treatments were applied at the flowering stage, leaf samples were collected for various measurements. These included assessing osmotic potential, membrane stability, relative water content (RWC), chlorophyll and carotenoid content, and peroxide enzyme activity. To preserve the samples, the leaf samples were frozen in liquid nitrogen and stored at −80 °C for subsequent gene expression analysis. For each treatment, three pots, each containing three plants, were measured.
2.1. Physiological Traits
To measure the relative water content (RWC), the leaves were carefully separated from each plant in the pots using a sharp knife, and their fresh weight was determined. The leaves were then placed in deionized water in the dark at room temperature for 24 h. After removing excess water, the leaves were weighed again using drying paper. Subsequently, the leaves were placed in an oven at 70 °C for 48 h to determine their dry weights. The relative leaf water content was then calculated [29]. The osmotic potential of chickpea leaves in both the normal and drought conditions was determined using a KNAUER K-7400S osmometer (Berlin, Germany), following the previously described method [30].
To determine membrane stability, the electrolyte leakage method was employed [31]. Leaf samples isolated from the plants were initially washed multiple times with deionized water to remove any electrolytes present on the leaf surface. The samples were then placed in 10 mL of deionized water in a capped falcon tube and kept at room temperature (25 °C) for 24 h. After 24 h, the initial electrical conductivity (L1) was measured and recorded using an EC meter. To completely remove the leaf tissue and eliminate all electrolytes, the falcon tubes and their contents were autoclaved for 15 min. After reaching room temperature, the electrical conductivity (L2) and the electrolyte leakage rate were measured again. The electrolyte leakage percentage was determined using the formula: Electrolyte Leakage% = (L1/L2), and the membrane stability was calculated as 1 − electrolyte leakage × 100.
The proline content was measured as previously described [32]. Briefly, 0.2 g of leaf tissue was ground and homogenized in 4 mL of 3% (w/v) sulfosalicylic acid. The resulting solution was filtered using filter paper. Two milliliters of the homogenate were mixed with 2 mL of ninhydrin reagent and 2 mL of glacial acetic acid. The test tubes were then placed in a 100 °C water bath for 1 h. The samples were immediately transferred to an ice pack to stop the reaction and were then brought to room temperature. After adding 4 mL of toluene to the tubes, they were vigorously mixed for 30 s. The optical absorption of the upper solution was then measured at 520 nm.
Chlorophyll and carotenoids were extracted and measured according to Lichtenthaler (1987). The upper-third portion of three plants per treatment was ground and homogenized in 80% acetone. The absorbance was measured at 663 nm and 647 nm for chlorophyll and 470 nm for carotenoids [33].
Peroxidase activity was measured following the previously described protocol [34]. The increase in absorbance at 470 nm was monitored for 3 min, and the enzyme activity was measured in units per milligram of protein.
2.2. The Identification and Analysis of CaBES1 Genes
The genomes of Cicer arietinum were searched for BES1 genes using BLASTp with 8 protein sequences of AtBES1/AtBZR1 from A. thaliana as queries, with an E-value threshold of 1 × 10⁻⁵. The obtained sequences were then analyzed using the Pfam tool to identify the conserved BES1_N domain. MEME SUIT (https://meme-suite.org/meme/ (accessed on 27 November 2023)) was used to identify conserved motifs in the BES1 proteins [35].
The molecular weights and isoelectric points of the candidate BES1 proteins were determined using Protparam (https://web.expasy.org/protparam/ (accessed on 27 November 2023)) [36]. The subcellular locations of the proteins were predicted using Plant-mPLoc.
Gene structures were determined using the GSDS 2.0 online tool (http://gsds.gao-lab.org/ (accessed on 27 November 2023)) [37], with CaBES1 and At-BES1/AtBZR1 genes and CDS sequences as inputs. The chromosomal locations of the BES1/BZR1 genes in Medicago truncatula, Phaseolus vulgaris, and Cicer arietinum were analyzed based on position information from the Phytozome database. The results were visualized for each species’ chromosomes using the shinyCircos software. Gene duplication events were analyzed using a method described by [38]. The OrthoMCL program was used to identify gene pairs between Medicago truncatula, Phaseolus vulgaris, and Cicer arietinum [39].
To compare the retrieved CaBES1 sequences with AtBES1, a phylogenetic tree was built using the Molecular Evolution Genetic Analysis (MEGA) software, version X [40]. The evolutionary history was inferred using the neighbor-joining method with a bootstrap value of 1000. The genetic distance was estimated using the p-distance method.
2.3. Expression Analysis
The RNA-Seq data with SRA Accession numbers: SRP136396 and SRR1066056 and expression patterns of CaBES1-like genes in abiotic stresses were downloaded from the SRA database using SRA Toolkit’s. By using TopHat alignment software, reads were aligned to the Cicer arietinum reference genome. The SAMtools (v0.1.19) command program was used to sort and convert the alignment data. The calculation of mapped reads and normalization was performed using BEDTools (v2.16.2) and DESeq’s tools, respectively. Finally, heat maps and clusters were drawn using a ggplots package in R (v3.4.1) software from log2- (TPM+1) transformed values of CaBES1-like genes.
2.4. RNA Extraction
The total RNA was extracted from 100 mg of young leaf tissue by using an RNX-PlusTM Kit (Sinaclon) based on the supplier’s protocols. For the elimination of genomic DNA, RNase-free Dnase I (Fermentas, #N0521) was used. The quantity and quality of RNA were determined using spectrophotometry via the nano-drop device (Nano-Drop Thermo Scientific–2000C, Rockford, IL, USA) at wavelengths 260 and 280 and electrophoresis on the agarose gel. The cDNA synthesis was conducted from 1.0 mg of total RNA using M-MuLV Reverse Transcriptase (RevertAid Erststrang-cDNA-Synthesekit, Thermo ScientificTM, Rockford, IL, USA) using the supplier’s instructions in a final volume of 20 µL.
2.5. Primer Design
The sequence of genes with accession numbers CaRD26 (XM_004487622.2), CaNAC72 (XM_004514293.2), CaIF4A (XM_004513380.2), CaGAPDH (AJ010224.1), CaBES1.1 (XM_012719103.1) and CaBES1.2 (XM_004500981.2) were obtained from NCBI. Primers were designed using Primer3 (Web version 4.1.0). The sequences and characteristics of both forward and reverse primers are listed in Table 1. Primer-BLAST and Oligo Analyzer web-based software (V.3.1) were used to investigate the specificity of primers.

Table 1.
Primer sequences used for quantitative real-time PCR.
2.6. Real Time PCR Analysis
Real-time PCR was conducted in an Applied Biosystems StepOneTM Real-Time PCR System (Rockford, IL, USA) in a volume of 15 µL containing 8.0 µL of 2× Syber Green QPCR Mix (Yektatejhiz, Iran), 1 µL of diluted cDNA, 0.5 µmol/L of both forward and reverse primers, and 5.0 µL of Rnase-free water. The PCR program was performed in the following steps: denaturation at 94 °C for 3 min, followed by 40 cycles comprising 94 °C for 20 s and 60 °C for 20 s. The PCR efficiency was calculated on five log serial dilutions for primers in both specific and reference genes. The specificity of amplification was checked using the melting curve analysis by increasing temperature from 60 to 95 °C (0.5 °C per 10 s) and gel electrophoresis. To check the genomic DNA contamination, control PCR reactions using RNA as a template were performed. In real-time PCR expression analysis, three independent biological replicates and three technical replicates of each biological sample were used. The Ca IF4A and CaGAPDH were used as reference genes to normalize and quantify gene expression. For calculating the relative expression of each gene, its Ct value was normalized to the Ct value of the reference gene [41].
2.7. Statistical Analysis
Both physiological and real-time expression data were analyzed using SAS version 9.1 (SAS Institute, Inc., Cary, NC, USA). A factorial two-way analysis of variance (ANOVA) with LSD post hoc test was used to reveal significant differences among treatments.
3. Results
3.1. The Physiological Characters of Two Chickpea Cultivars under Drought Conditions
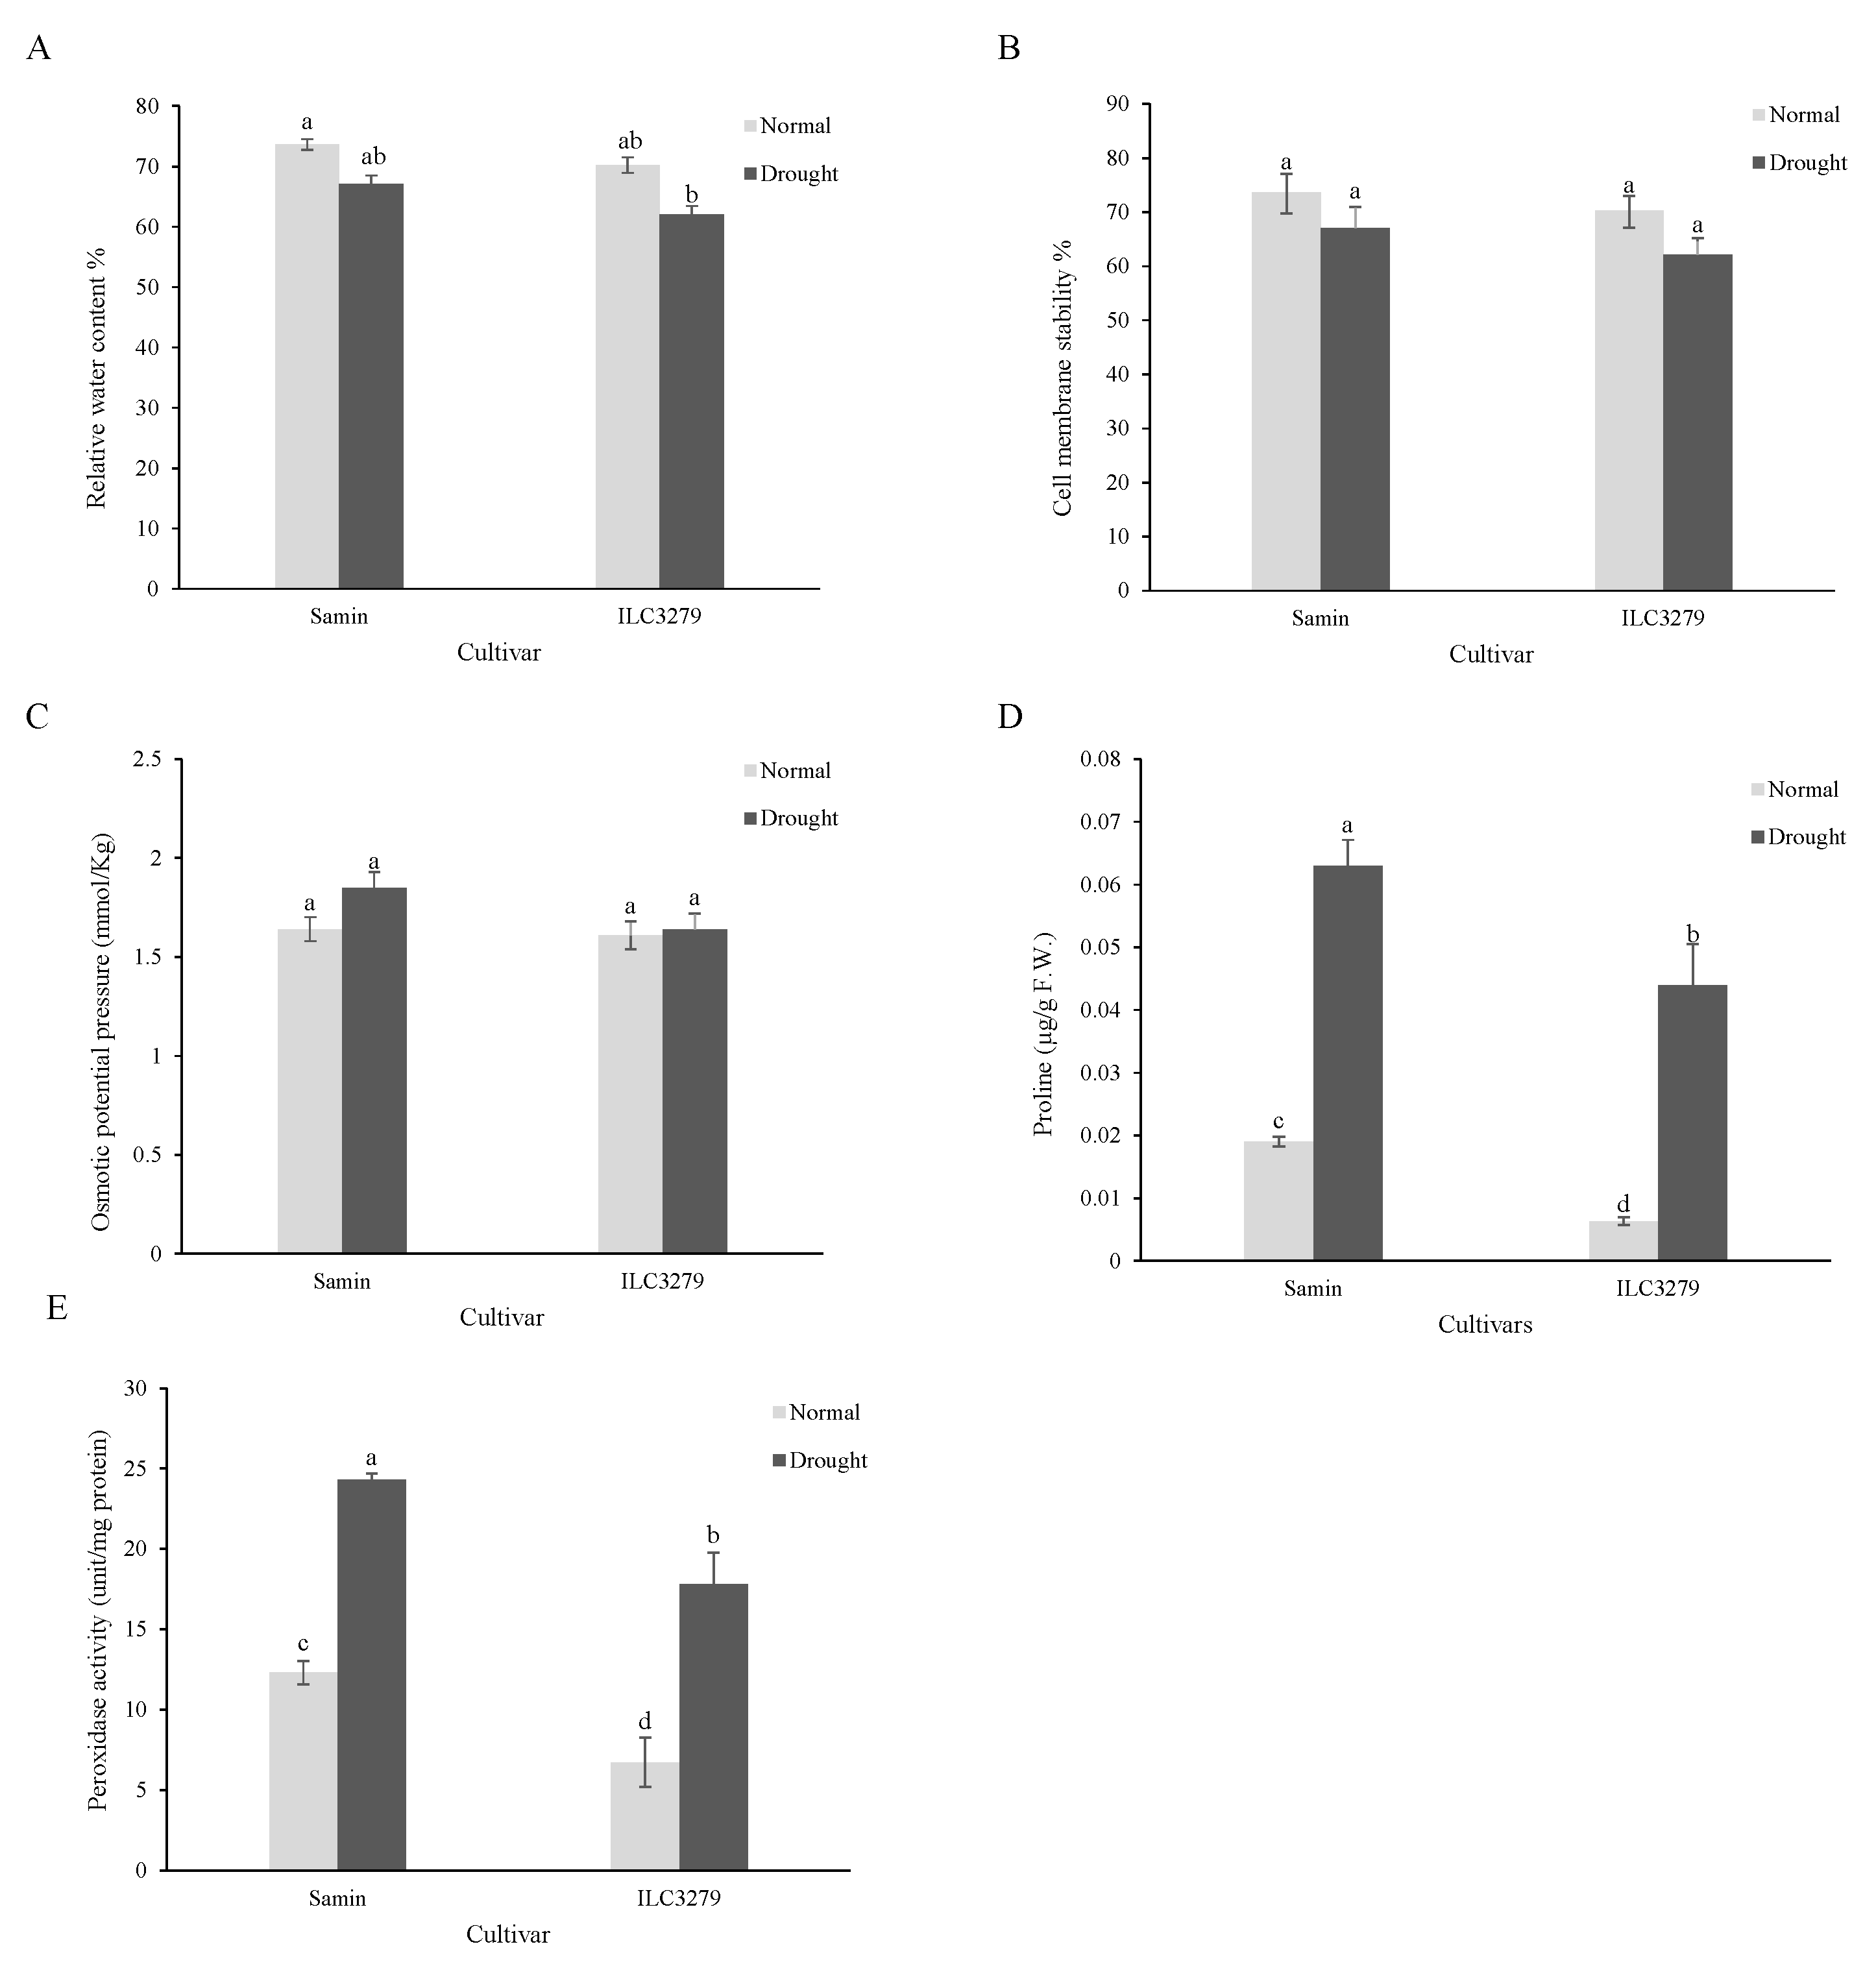
The results of the physiological character analysis under drought stress showed that the RWCs of Samin and ILC3279 cultivars after about seven days of drought (20% FC) had declined by 9 and 12%, respectively, which was not significantly different compared to normal conditions (Figure 1A). The cell membrane damage examined by the electrolyte leakage of the leaf did not change significantly in both cultivars, Samin and ILC3279, under normal and drought-stress conditions (Figure 1B). Osmotic potential of the leaf also decreased in Samin, but was not significantly different from that of normal conditions. The osmotic potential in ILC3279 in drought conditions and normal conditions was similar to that of Samin (Figure 1C). The proline content of both cultivars increased significantly with drought stress. The proline content of Samin under drought-stress conditions increased 5.1 and 10.1 times higher in Samin and ILC3279, respectively. Also, a significant difference in proline content was observed between the two cultivars in both normal and stress conditions (Figure 1D), and peroxidase activity was increased under drought conditions significantly. However, there was a significant difference between Samin and ILC3279 cultivars in both normal and drought conditions. The peroxidase activity twice in Samin and three times in ILC3279 was greater compared to the normal condition (Figure 1E).

Figure 1.
Relative water content (RWC) (A), cell membrane stability (B), osmotic potential pressure (C), proline content (D) and peroxidase activity (E) in the normal (FC = 100%) and drought-stressed (FC = 20%) conditions at the flowering stage in the two chickpea cultivars, Samin and ILC3279. The mean values are from three replications of each treatment with five plants for each cultivar. Different letters indicate the significance (p < 0.05) difference in treatments using LSD test.
Under drought-stress conditions, the chlorophyll a content significantly decreased in both Samin and ILC3279 (Figure 2A). Also, the chlorophyll a content in the Samin cultivar in both normal and drought conditions was significantly higher than that of ILC3279. The amount of chlorophyll b showed a similar pattern to that of Chlorophyll a. The total chlorophyll content decreased by 25% and 34.4% in drought conditions in Samin and ILC3279 cultivars, respectively (Figure 2B,C). The carotenoid content decreased in both cultivars under drought stress; however, in ILC3279, the decrease was significant under drought stress (Figure 2D).
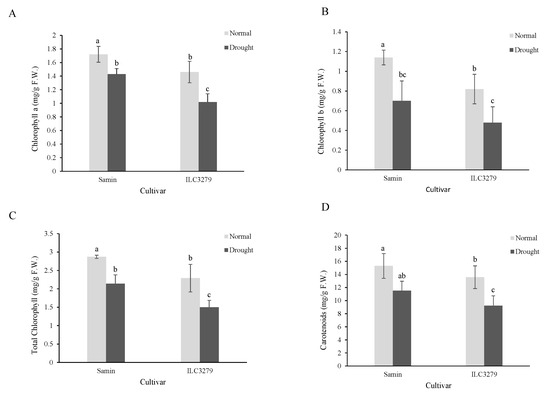
Figure 2.
Chlorophyll a (A), b (B), total (C) and carotenoids (D) in the normal (FC = 100%) and drought-stressed (FC = 20%) conditions at the flowering stage in the two chickpea cultivars, Samin and ILC3279. The mean values are from three replications of each treatment with five plants for each cultivar. Different letters indicate the significance (p < 0.05) difference in treatments using LSD test.
3.2. The Identification of CaBES1 Genes in Chickpea Plants
To find the entire putative CaBES1 gene, the Arabidopsis AtBES1/AtBZR1 protein sequence was used as a query to search the chickpea genome according to the obtained result. Finally, a total of six candidates of CaBES1-like genes with the usual BES1_N domain were recognized in the chickpea, and they were named CaBES1.1 to CaBES1.6, in order (Table 2). The size of proteins ranged from 252 to 671 amino acids, the molecular weights varied from 26,346.96 to 7,4967.30 Da, and the predicted isoelectric points ranged from 5.45 to 9.38. According to their functions as transcription factors, all six CaBES1-like proteins were expected to be localized in the nucleus (Table 2).
Table 2.
The basic information of CaBES1 genes.
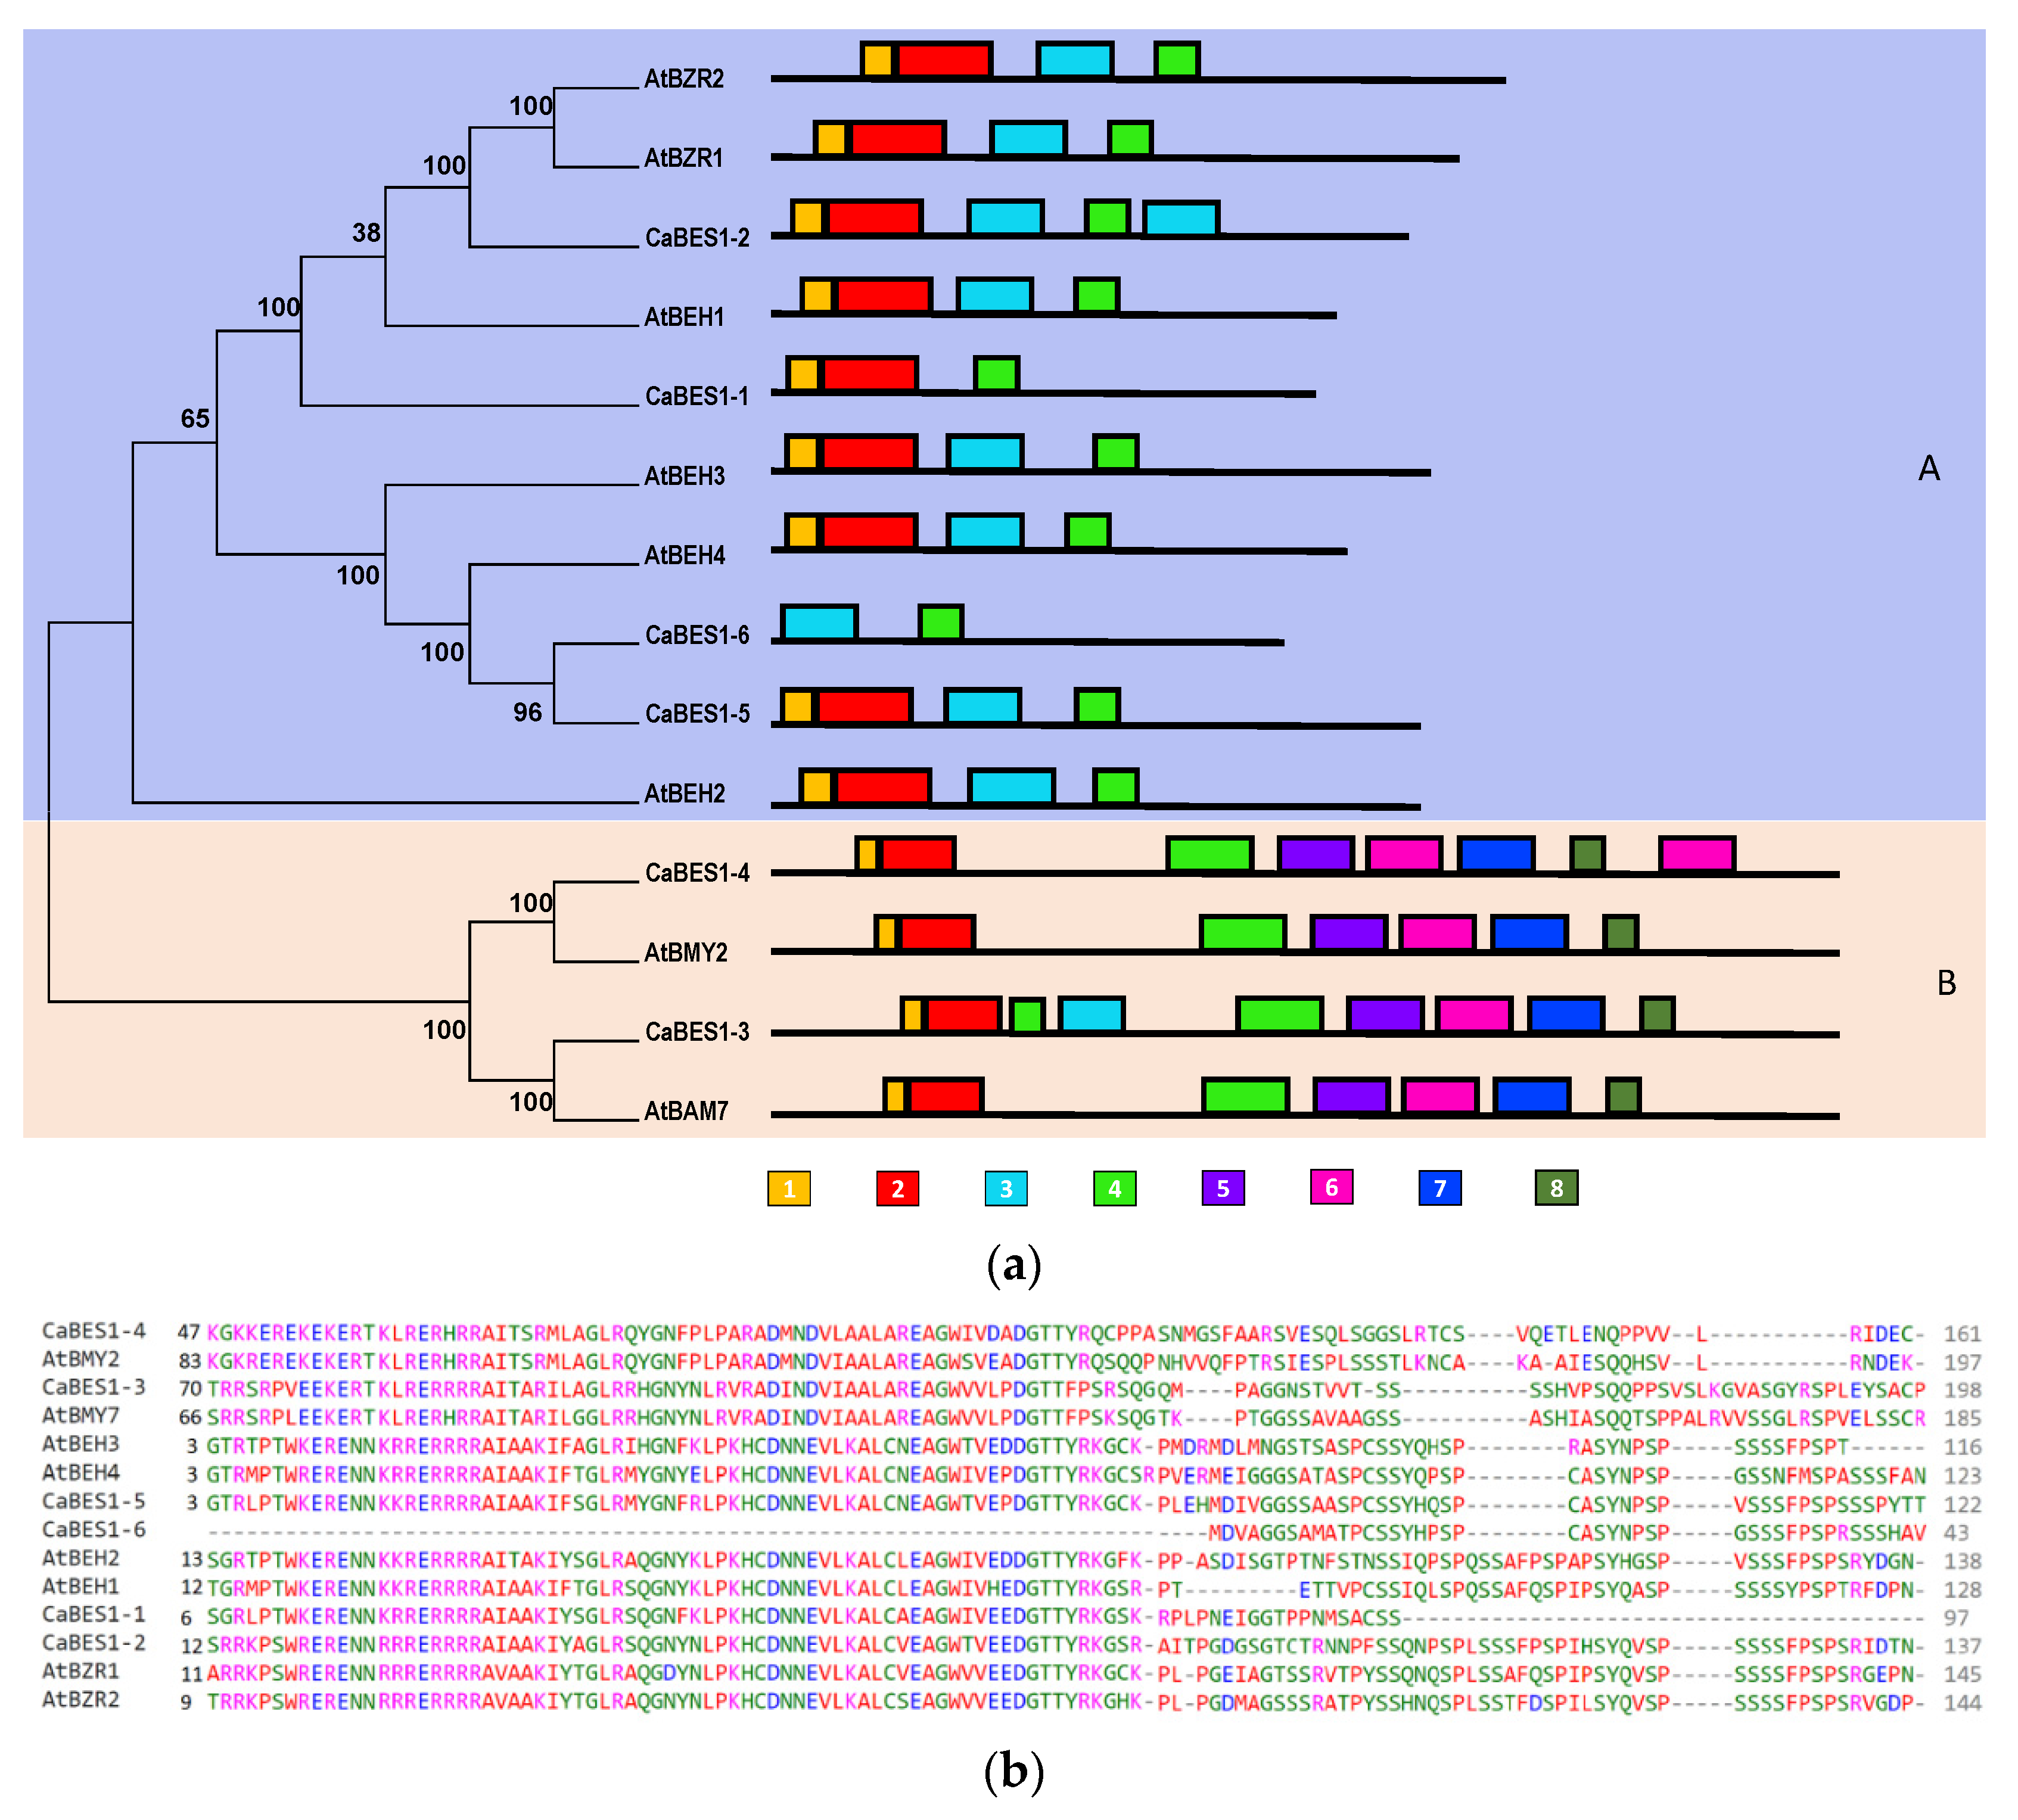
To classify the CaBES1-like genes, a phylogenetic tree using the neighbor-joining algorithm for the chickpea and Arabidopsis BES1 family protein sequences was constructed (Figure 3a). There were multiple alignments of Arabidopsis and chickpea BES1 protein sequences (Figure 3b). According to the bootstrap numbers and the topology of the phylogenetic tree, six CaBES1-like genes were visibly clustered into two clades, A and B. Clade A contained four members (CaBES1.1, CaBES1.2, CaBES1.5, CaBES1.6) and Clade B had two members (CaBES1.3 and CaBES1.4). Each clade had a similar motif distribution and gene structure (Figure 3(aA), Figure 4 and Figure 5A).
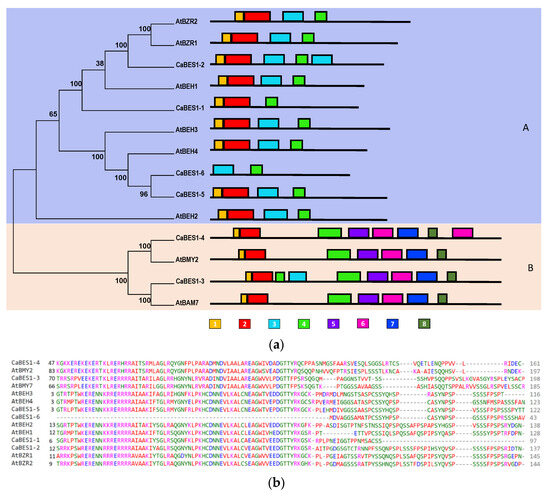
Figure 3.
Phylogenetic and multiple alignments of BES1-like genes in Arabidopsis and chickpea. (a) Phylogenetic relationships and conserved motifs of BES1-like genes in Arabidopsis and chickpea using the neighbor-joining method. Clades (A,B) were shown with violet and pink, respectively. The distribution of conserved motifs of BES1-like proteins. Different motifs were indicated by different colored boxes numbered under the picture. (b) Multiple alignments of the N-terminal domain of chickpea and Arabidopsis BES1-like genes.
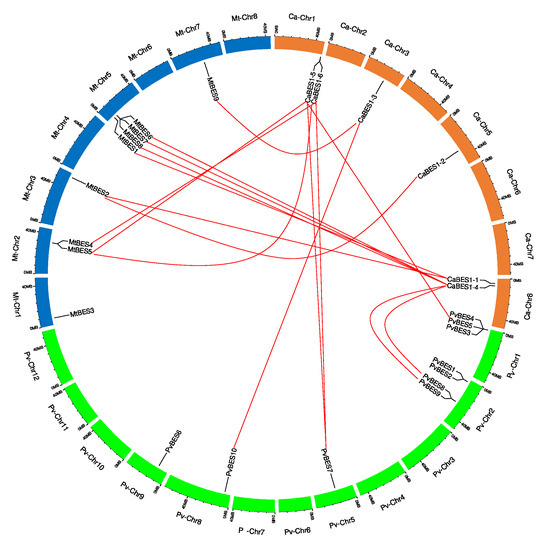
Figure 4.
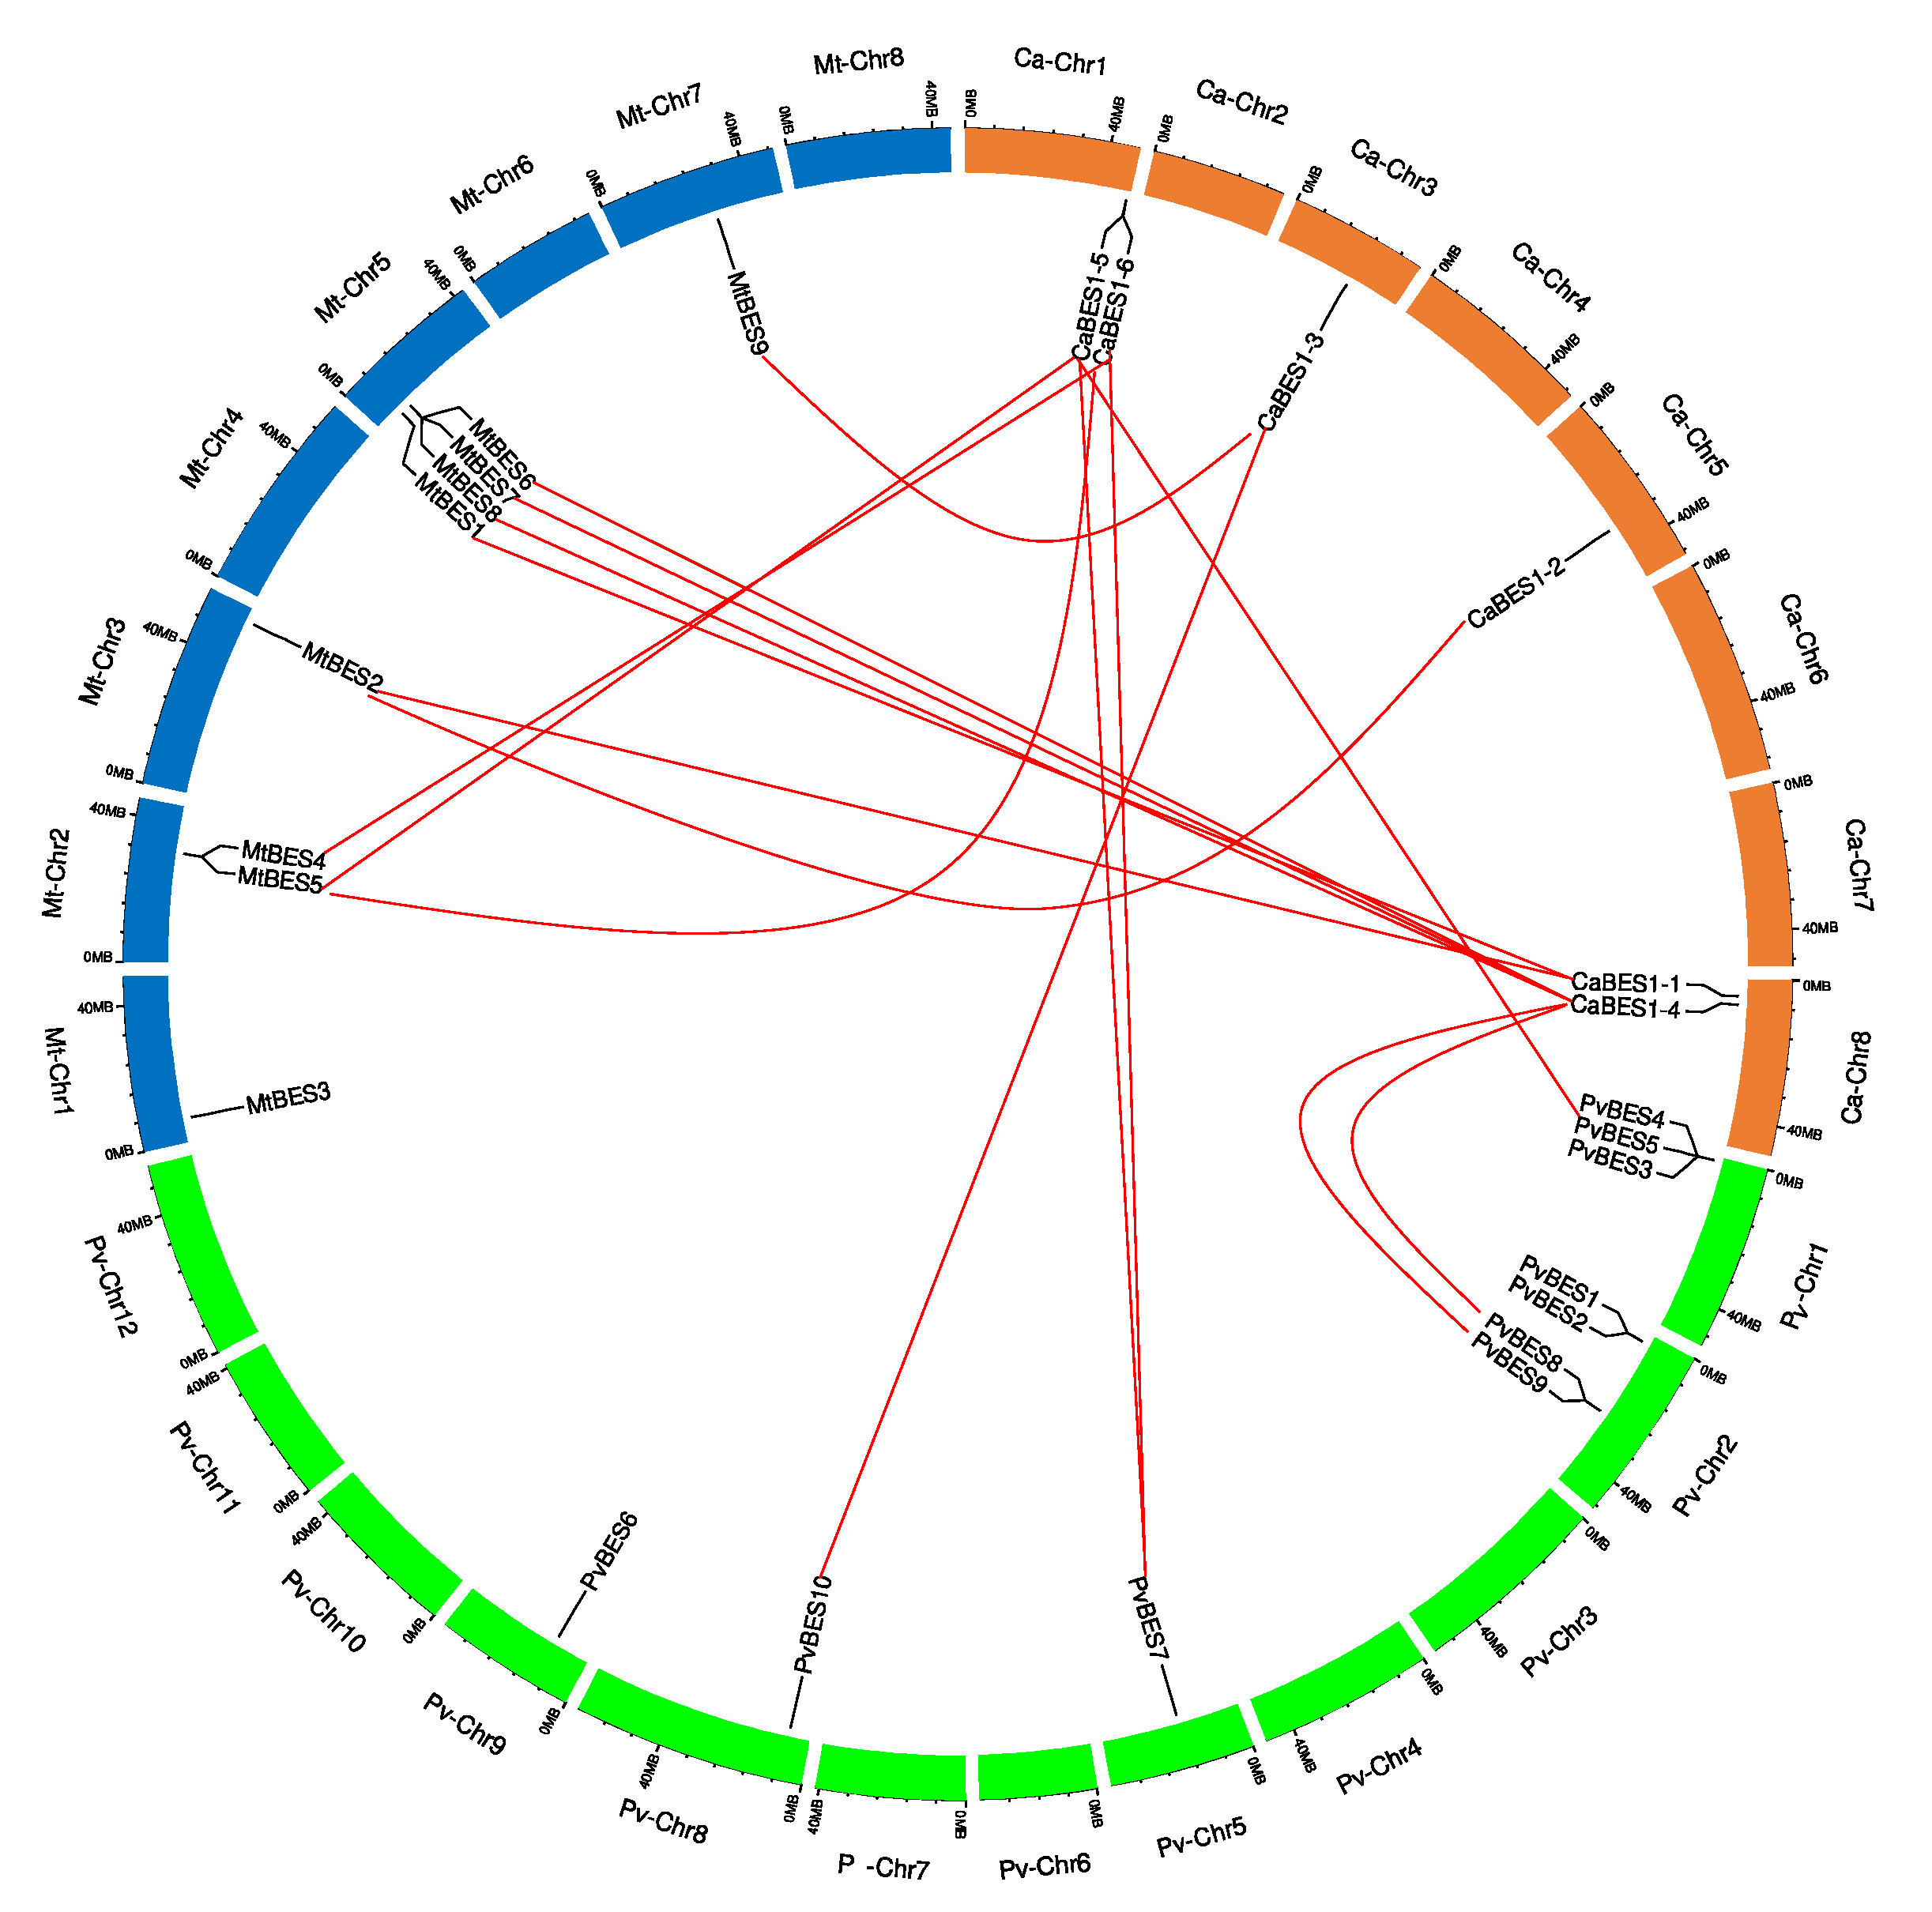
The distribution of BES1/BZR1 genes and gene pair analyses. Distribution of ZmBES1/BZR1 genes on the Medicago truncatula (Mt) chromosomes (blue color), Phaseolus vulgaris (Ph) chromosomes (green color) and Cicer arietinum (Ca) chromosomes (orange color). The chromosome number is indicated at the top of each chromosome. The numbers below each gene and the bottom of the chromosome indicate the gene positions and chromosome sizes. The orthologous and paralogous pairs of Ca:Mt and Ca:Pv are connected by red lines.
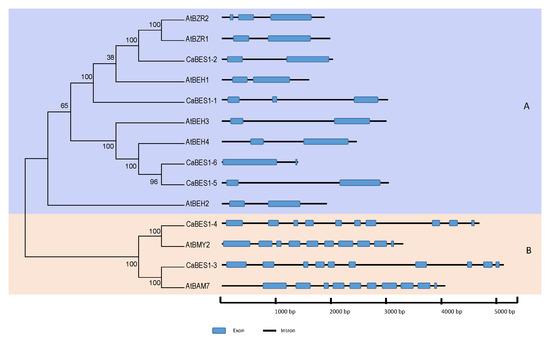
Figure 5.
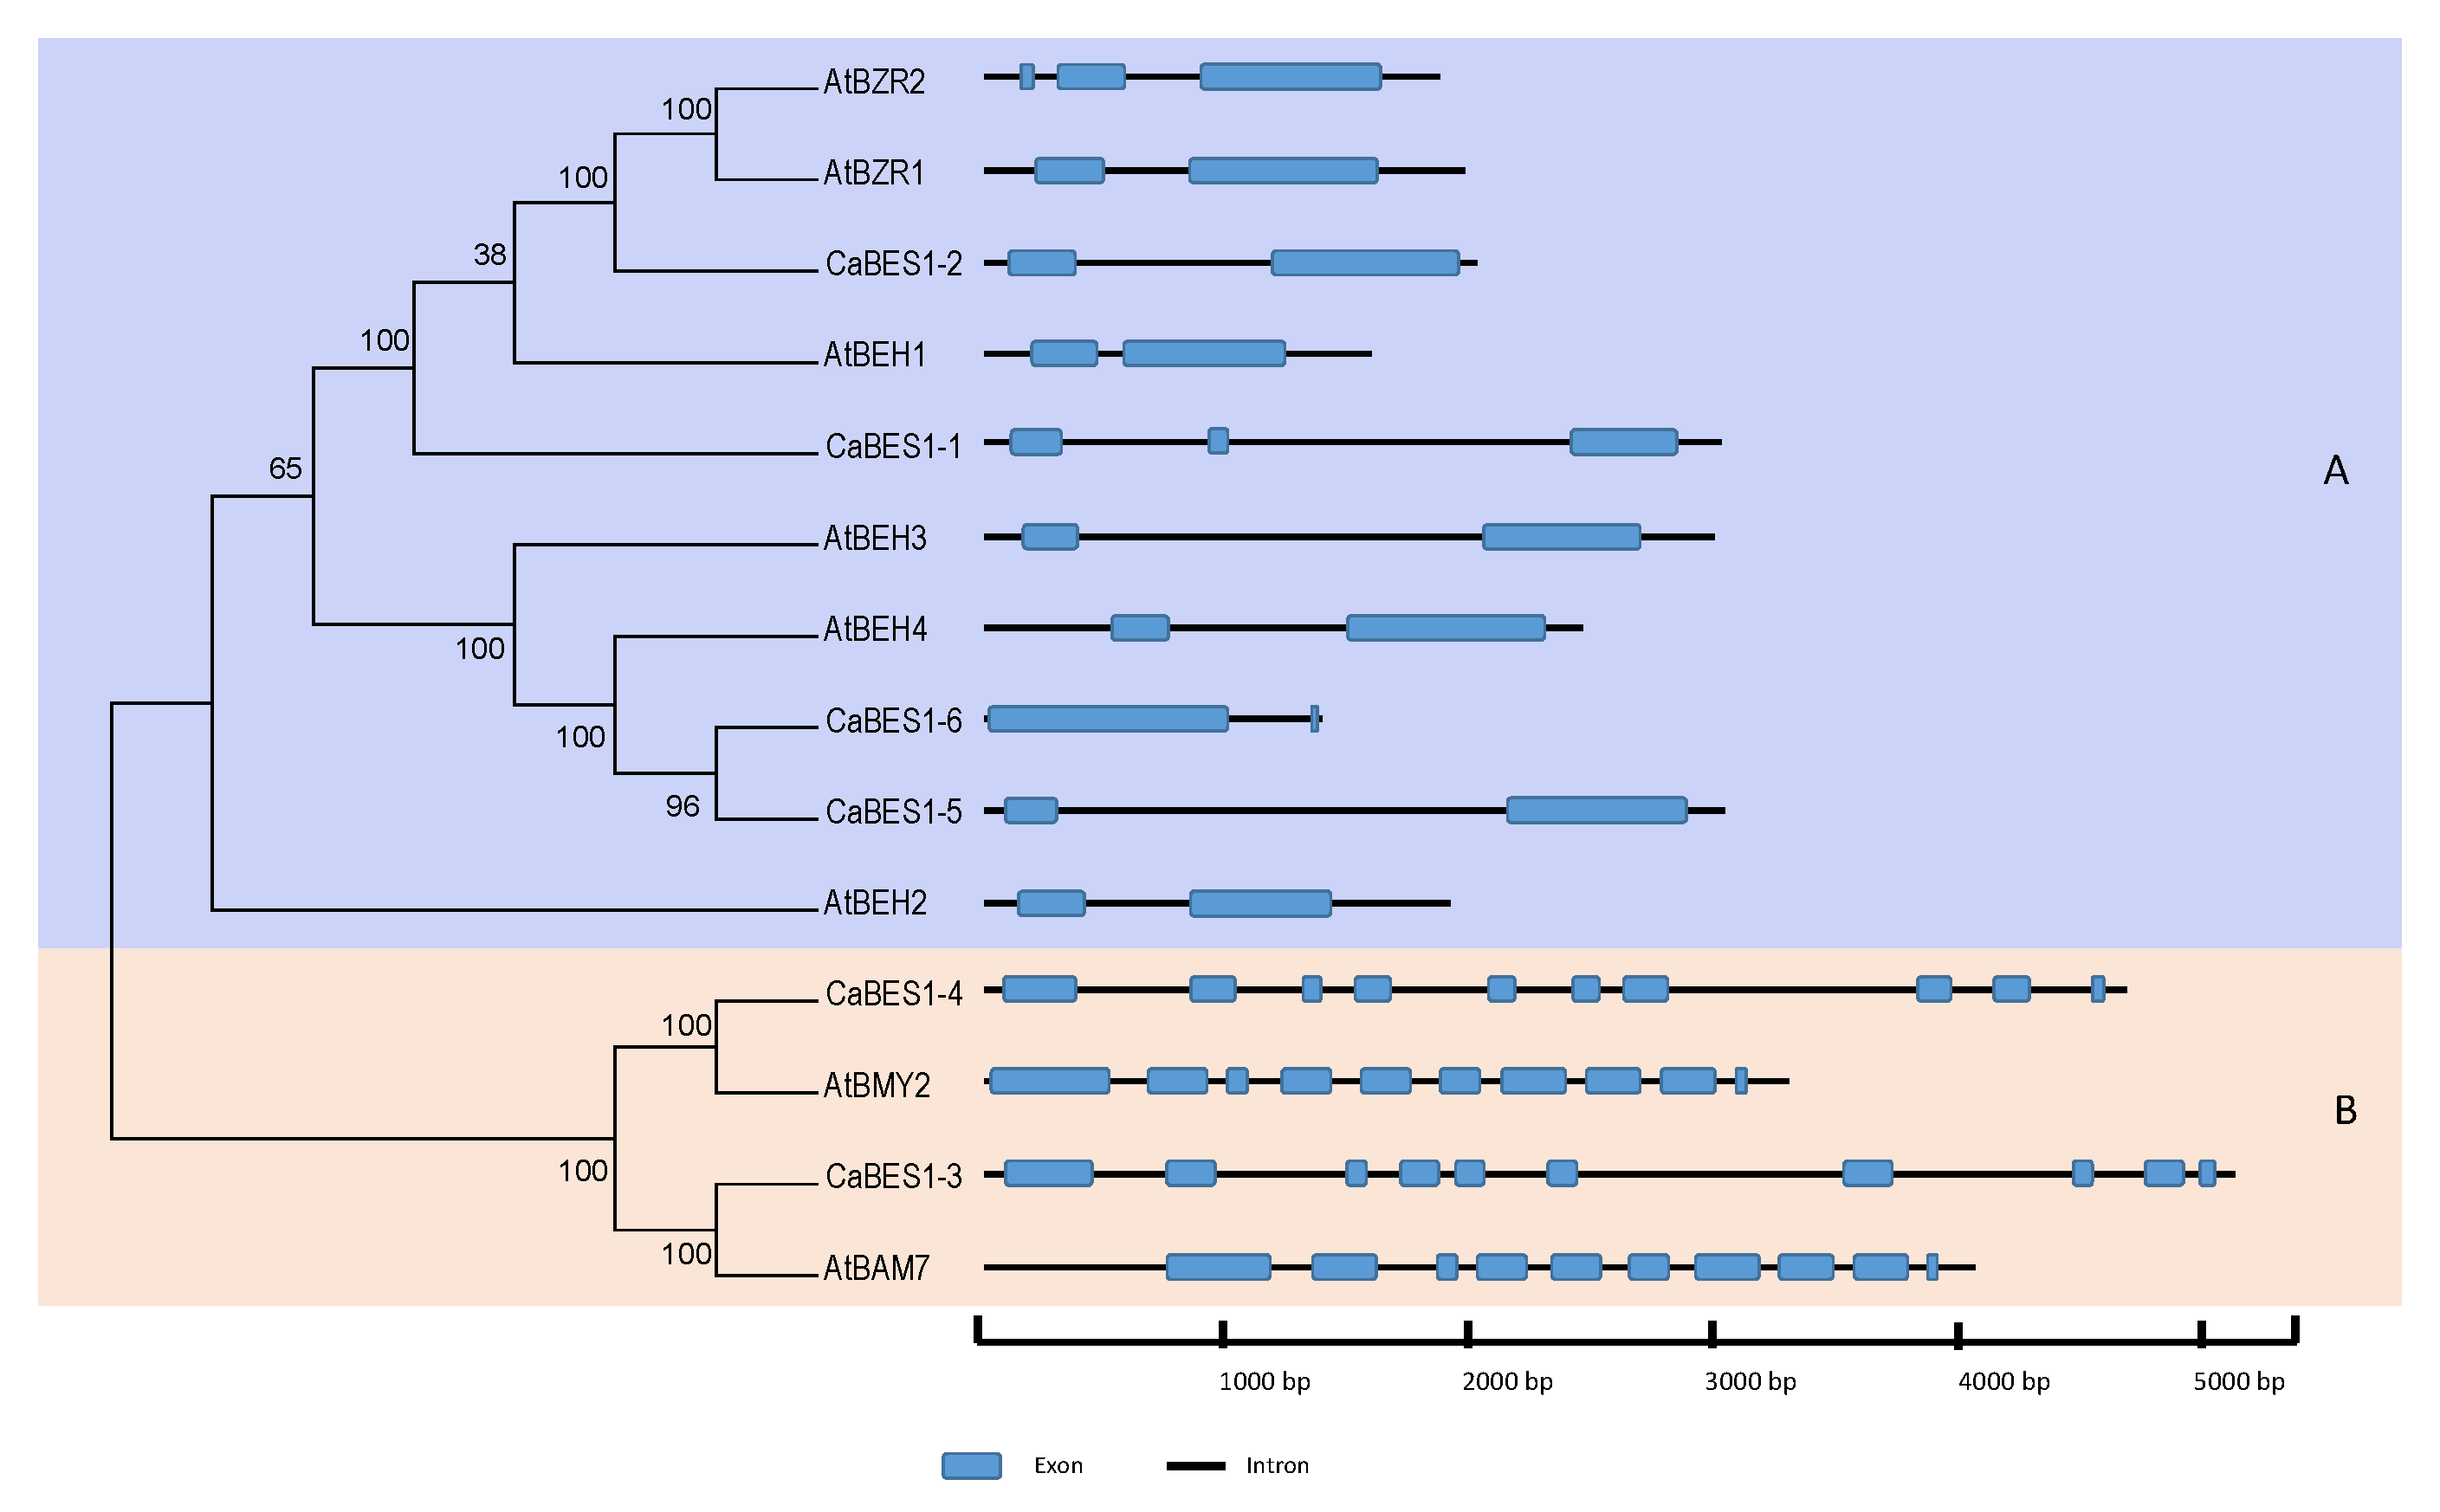
Phylogenetic analysis of BES1 genes. Phylogenetic relationships and gene structures including numbers and patterns of exons and introns in BES1 genes in Arabidopsis and chickpea. Blue balloons and black lines, respectively, show the exon and intron regions of the gene. Clades (A,B) were shown with violet and pink.
CaBES1 genes were distributed unevenly on the eight chickpea chromosomes. The distribution of BES1 genes on Phaseolus vulgaris and Medicago truncatula chromosomes was, indeed, uneven. CaBES1.5 and CaBES1.6 were located on chromosome 1, CaBES1.3 on chromosome 3, CaBES1.2 on chromosome 5, and the remaining two (CaBES1.1 and CaBES1) on chromosome 8. All CaBES1 gene orthologs were found on the Phaseolus vulgaris and Medicago truncatula chromosomes and have been depicted in Figure 4.
A conserved motif analysis of the obtained sequences was conducted using the MEME program and the eight motifs were predicted as is shown in Figure 3. The detail for each motif and the result of the annotation are summarized in Table 3. The number of conserved motifs in each CaBES1 varied between two and seven. Subfamily A contained four motifs, whereas subfamily B contained seven motifs. Among the predicted motifs, two of them did not have any annotation information (Motif 1 and 8) but other motifs like 3 and 4 were predicted to contain DNA-binding transcription factor activity, and Motifs 4, 5, 6 and 7 contained beta-amylase activity. Motifs 4, 5, 6 and 7 were just observed in Clade B and Motif 3 was present only in Clade A. Motif 1 and 2 were present in all of the analyzed sequences except CaBES1.6 (Figure 3).
Table 3.
Conserved motifs of CaBES1 proteins generated by MEME analysis.
The analysis of gene structure revealed that sequences in Clade A had 2 to 3 exons, whereas the gene structure in Clade B differed, as all four sequences had 10 exons (Figure 5).
3.3. RNA-Seq Expression of BES1 Genes
The expression analysis of the CaBES1 family was conducted using two previously reported Illumina RNA-Seq data in chickpea studies including: (A) one study with the overall design of the analysis of RNA expression in different tissue samples (root and shoot tissues of 10-day-old seedlings subjected to control (kept in water), desiccation (transferred on folds of tissue paper), salinity (transferred to a beaker containing 150 mM NaCl solution) and cold (kept in water at 4 ± 1 °C) stress for 5 h), and (B) another study to characterize drought adaptive strategies in two C. reticulatum genotypes (Savur 063 and Kalkan 064) and two chickpea cultivars, including ICC_8058 as drought-susceptible and ICC 14778 as drought-tolerant, under various drought conditions. In total, the transcription levels and patterns of the CaBES1 gene family were considerably diverse. The expression of NAC genes CaNAC4 (CaRD26), CaNAC72, CaNAC55 and CaNAC57 showed differential patterns among the control and different treatments (Figure 6). CaBES1.1 showed constantly high levels of expression in most samples under any condition. CaBES1.6 in study A, in all the conditions, had a low expression, but in the second study, CaBES1.5 had a low expression (Figure 7). CaRD26 showed a higher expression in roots in both the control and cold-stress conditions, as well as salinity in shoots, while CaNAC72 showed a higher expression in shoots in both control and salinity-stress conditions. In general, all four genes showed differences in treatments. The results revealed that the expression of CaRD26 decreased in the roots under stress conditions. However, in the shoots, the expression of CaRD26 increased, particularly under desiccation stress.
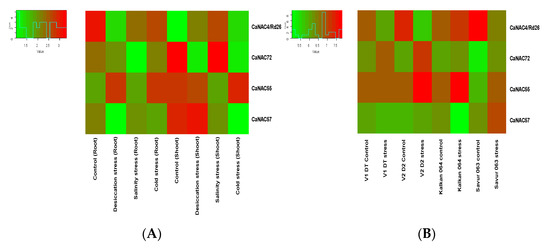
Figure 6.
Expression patterns of four CaNAC genes in chickpeas in two different studies. (A) RNA expression in different tissue samples in 10-day-old seedlings under desiccation, salinity and cold stress for 5 h. (B) Analysis of gene expression in two C. reticulatum genotypes (Savur-063 and Kalkan-064) and two chickpea cultivars including ICC 14778 as drought-tolerant (V1-DT) and ICC_8058 as drought-susceptible (V2-DS) and under various drought conditions.
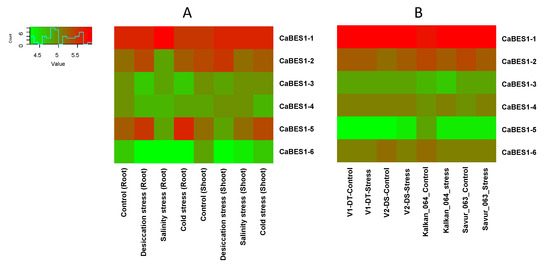
Figure 7.
Expression patterns of CaBES1 genes in chickpea in two different studies. (A) RNA expression in different tissue samples in 10-day-old seedlings under desiccation, salinity and cold stress for 5 h. (B) Analysis of gene expression in two C. reticulatum genotypes (Savur-063 and Kalkan-064) and two chickpea cultivars including ICC 14778 as drought-tolerant (V1-DT) and ICC_8058 as drought-susceptible (V2-DS) and under various drought conditions.
Furthermore, the findings demonstrated a reduction in RD26 gene expression under drought stress in two drought-resistant (V1-DT) and drought-tolerant (V2-DS) cultivars of C. arietiumn. Notably, this decrease in expression was more pronounced in the sensitive cultivar (V2-DS).
3.4. The Expression of CaBES1.1, CaBES1.2, CaRD26 and CaNAC72 under Drought Stress
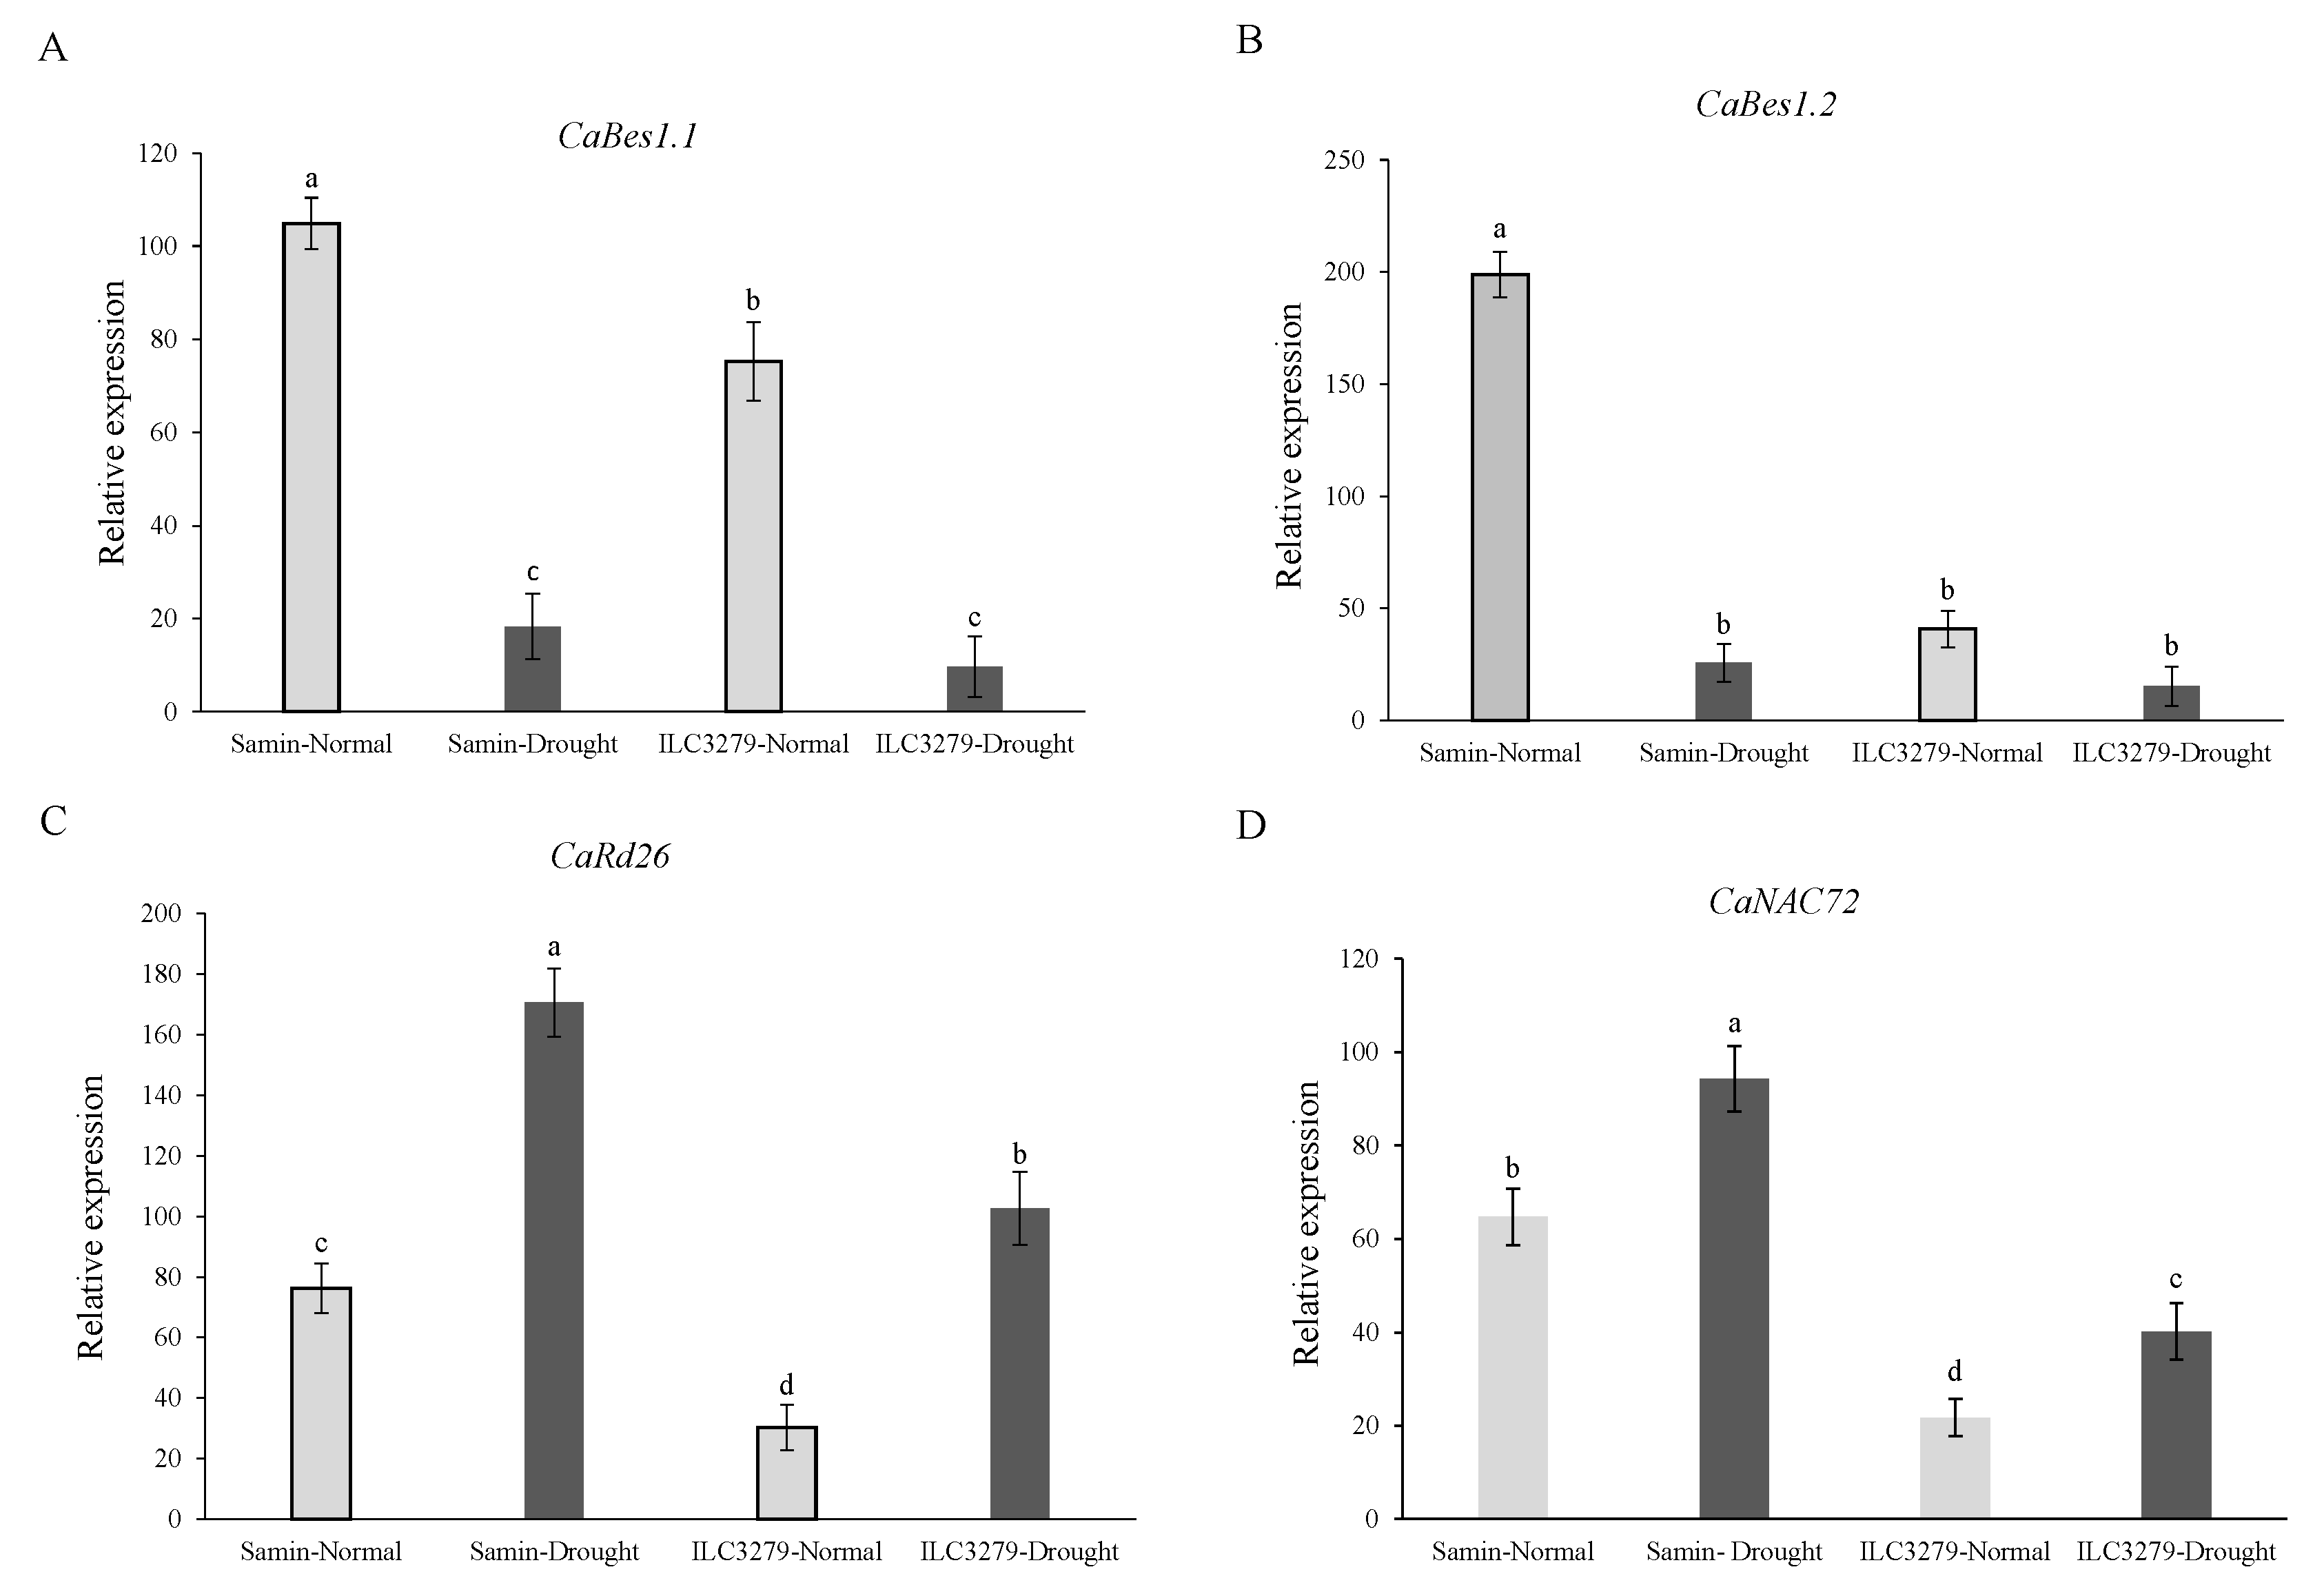
The ANOVA showed significant (p < 0.01) differences in the relative expression levels of the CaBES1.1, CaBES1.2, CaRD26 and CaNAC72 genes between cultivars and stress treatments. The CaBES1.1 expression was differentially downregulated under drought (FC = 20%) and its expression decreased 5.7 and 7.8 times more than that of well-watered (FC = 100%) conditions in Samin and ILC3279, respectively (Figure 8A). The relative expression of CaBES1.2 in the drought and normal conditions had a similar pattern as CaBES1.1, while the fold changes were 7.7 and 3.3 times reduced for CaBES1.2 (Figure 8B). In contrast to CaBES1.1 and CaBES1.2, the expression of CaRD26 and CaNAC72 showed a significance increase under drought stress (Figure 8C,D). The relative expression level of CaRD26 increased 2.2 and 3.4 times in Samin and ILC3279 under drought conditions, respectively. The expression of the CaNAC72 gene was also different between the Samin and ILC3279 cultivars, while the fold change was lower than that of CaRD26.
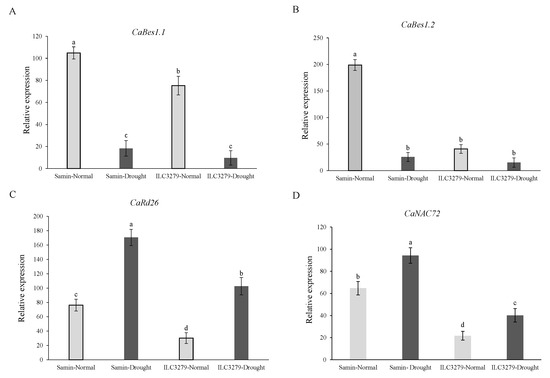
Figure 8.
The relative expression level of the CaBES1.1, CaBES1.2, CaRD26 and CaNAC72 genes in the well-watered (FC = 100%) and drought-stressed (FC = 20%) conditions at the flowering stage in the two chickpea cultivars, Samin and ILC3279. Values are means with standard deviation. Different letters on bars designate a significant difference at p < 0.01. CaBES1.1 expression level (A), CaBES1.2 expression level (B), expression level of CaRD26 (C), expression level of CaNAC72 (D).
4. Discussion
In the current study, we measured some physiological traits and expressions of the genes in the brassinosteroid signaling pathways in two chickpea cultivars, Samin and ILC3279, under normal and drought conditions. ILC3279 is considered a susceptible cultivar based on its grain yield and drought-tolerance score [42]. Samin (ILC1799) showed terminal drought tolerance [42]. Among the studied physiological traits, RWC, osmotic potential and cell membrane damage were changed slightly both in cultivars under normal and drought conditions. The result of Grag et al. (2016) showed that chickpea drought-tolerant genotype ICC4958 and drought-sensitive genotype ICC1882 did not show a significance difference in RWC under drought and salinity stress conditions [43]. The authors concluded that among phenotypic traits, the root system differences and overall phenology play key roles in contrasting drought tolerance of the tolerant and sensitive genotypes.
The amount of proline was significantly higher in both genotypes under drought conditions, and in the tolerant cultivar Samin it was significantly higher in both normal and drought conditions. In chickpea cultivars, during drought stress in field conditions, both at vegetative growth and anthesis, the amount of proline was increased in the drought-tolerant cultivar ILC482 compared to that of the sensitive cultivar Pirouz [44]. In addition, proline content in both the roots and nodules of ILC3279 was increased under drought stress after the reproductive stage (before maturity) [45]. In an analysis of the proteome of two tolerant (C. reticulatum) and sensitive (C. arietinum) species under drought stress, the amount of proline was higher in the tolerant species after drought stress [46]. Therefore, by consideration of the developmental stage and the amount of stress, the proline content maybe acted as a drought tolerant index in the chickpea. In spite of the debate on the role of proline in drought stress, it is suggested that proline has a role in free radical scavenging, the buffering of cellular redox potential and the stabilizing of cellular structure [47].
The peroxidase activity in both cultivars was significantly increased under drought conditions at the flowering stage, but in Samin it was significantly higher than that of ILC3279. Drought stress generates oxidative stress through the stomatal conductivity and reduction of internal CO2, which causes the production of free radicals [48]. Accumulation ROS is one of the biochemical changes that occurs in plants under drought stress. Several reports showed that drought stress increases the amount of ROS production. Plant resistance to different environmental stresses may be related to the activity level of enzymes responsible for trapping free radicals. The POD enzyme plays a key role in detoxifying H2O2, removing malondialdehyde, which causes the peroxidation of the membrane, and maintaining the stability of the cell wall [49].
The concentration of these radicals at certain levels activates the signal transduction pathway and helps plant cells. Conversely, the high level of these radicals leads to damaging consequences on plant cells. An antioxidant enzyme such as peroxidase detoxifies these radicals. In most of the previous studies in chickpea cultivars under drought stresses, the activities of these enzymes were increased. Drought treatment in three the chickpea cultivars Bivaniej, ILC482 (both drought tolerant) and Pirouz (drought sensitive) at the flowering stage resulted in significantly higher peroxidase [49]. In the chickpea cultivar ILC-482, under control and drought treatments, the highest peroxidase activity was observed in severe stress conditions, which was almost double compared to in the non-stress treatment. Similarly, drought stress increased peroxidase activity in chickpea cultivars ICC4958, while the amount of increase in ICC4958 was significantly higher compared to that of JG315 and DCP 92-3 [50]. Drought stress increases the content of hydrogen peroxide and other reactive oxygen species and increases lipid peroxidation, and this increases the activity of antioxidant enzymes such as peroxides. In chickpea cultivars resistant to drought stress, hydrogen peroxide and lipid peroxidation levels are lower and the activity of antioxidant enzymes is seen to a greater extent.
Drought stress at the flowering stage significantly decreased the amount of chlorophyll a, b, and total chlorophyll and carotenoids contents in both cultivars. However, the amount of chlorophyll a, b, and total chlorophyll and carotenoids were higher in both the normal and drought conditions for Samin compared to ILC3279. Drought stress in chickpea cultivars usually decreases chlorophyll and carotenoids contents, but other responses, depending on the developmental stage, the duration and severity of stress and genotypes, have been observed. For example, drought stress in both vegetative and flowering stages in three cultivars, Bivaniej, ILC482 and Pirouz, significantly reduced chlorophyll content [49]. In another study, 35 chickpea genotypes were checked under normal and drought stress and the result showed that chlorophyll and carotenoid content in all genotypes were decreased by drought and drought-tolerant genotypes gathered more carotenoids than that of sensitive genotypes [51], whereas drought stress in two cultivars, Gokce and Canitez, had a different effect on chlorophyll and carotenoid contents. In drought conditions, the total chlorophyll and carotenoids did not change in Gokce, but the total chlorophyll increased in Canitez at the end of the treatment [52]. One of the major reasons for the decrease in chlorophyll content may be related to the production of free radicals and the damaging photosynthesis pigments [53].
The BES1 gene family plays an important role in plant growth and development. Several studies have been performed in the plants; however, most of these works focus on the bioinformatics analysis of this gene. Using the sequence of BES1 protein sequences from several plants, and also using the conservation of their domains, six highly reliable BES1 protein sequences (E-value = 0.0001) were isolated in the chickpea genome. The BES1 gene family has been earlier described in several plants, including Arabidopsis, cucumber, tomato, apple, Chinese cabbage, potato, maize, and rapeseed (Brassica napus) [21,22,23,24,25,26]. The number of BES1 gene families are very variable. For example, in apple, potato, maize and cucumber, the number BES1 gene families, that have been identified are 22, 9, 11, 6, respectively. In legumes, the number of BZR gene families for pigeon pea, soybean, common bean, mung bean, chickpea and Barrel medic are 6, 16, 7, 5, 6 and 7, respectively [25].
In the current study, we conducted the expression analyses of CaBES1 genes in C. arietinum using both RNA-Seq datasets and qRT-PCR. The expression levels and patterns of CaBES1 gene family members varied considerably in different tissues, treatments and species. CaBES1.1 exhibited a constantly high level of expression in most samples overall and CaBES1.6 had a lower level of expression. The overexpression of OsBES1-3 and OsBES1-5 in rice increased the root growth of transgenic lines under drought stress, and transgenic Arabidopsis lines with overexpressed cotton GhBES1-4 showed salt tolerance [51]. The overexpression of PtrBES1-7 in Populus trichocarpa enhanced tolerance to drought stress by improving the ability to scavenge reactive oxygen species and antioxidant enzymes superoxide dismutase and peroxidase [54,55]. Previous studies showed that BES1 genes were induced by different abiotic stresses such as drought, heat, salinity, cold and ABA [56]. The expression level of most of the ZmBES1/BZR1 genes’ members in maize were induced by the ABA and the light treatments [17,57]. Also, the promoter cis-elements analysis of ZmBES1/BZR1 genes showed many classes of light-responsive elements and ABA-responsive elements (ABRE) [50]. Also, drought, salinity, cold and ABA in Brassica rapa induced the expression of BrBZR genes [58]. BES1 and RD26 coordinate drought tolerance and plant growth in Arabidopsis [10]. Moreover, few studies showed that BES1/BZR1 in Arabidopsis might regulate the cold and drought tolerance through networking with two transcription factors RD26 (a NAC transcription activation factor) and WRKY54, or through the regulation of the transcription factors CBF, WRKY6, PYL6 and RD26 [10,57,59,60]. Our results in two chickpea cultivars with different responses to drought stress are in agreement with that of Arabidopsis. The overexpression of the ZmBES1/BZR1-3 and ZmBES1/BZR1-9 genes in Arabidopsis decreased drought tolerance and transgenic plants displayed drought-sensitive phenotypes as well as increasing in stomatal aperture and downregulated gene expression [61]. They concluded that ZmBES1/BZR1-3 and ZmBES1/BZR1-9 negatively regulate drought tolerance via different pathways in transgenic Arabidopsis. The expression of CaBES1 genes in both cultivars under drought stress was downregulated, while the expression of CaRD26 was upregulated significantly. These results show that the mechanism of the BES1 gene in interaction with RD26 in drought stress in chickpea and Arabidopsis may be similar.
5. Conclusions
Our results showed that the two chickpea cultivars chosen in this study respond differently to drought stress at the flowering stage. Samin, used as a drought-tolerant cultivar, produced more proline and peroxidase enzymes compared to that of ILC3279. Using a genome-wide search in chickpea, six CaBES1 genes were identified. CaBES1 and CaRD26 genes were differentially regulated by various abiotic stresses, but especially by drought. Under drought conditions, the expression of CaBES1 genes decreased, while the expression of the CaRD26 genes increased. This comprehensive study on the effects of drought stress on physiological and molecular responses in two chickpea cultivars, Samin and ILC3279, holds significant implications for both agricultural research and practical applications. Understanding the distinct physiological traits and gene expression patterns in these cultivars under drought conditions provides valuable insights into enhancing chickpea’s resilience against environmental stressors. The identified differences in chlorophyll content, proline accumulation, and peroxidase activity shed light on potential markers for drought tolerance, enabling breeders to develop more robust, stress-resistant chickpea varieties. Moreover, the in-depth analysis of the brassinosteroid pathway, particularly focusing on BES1 and RD26 genes, not only expands our knowledge of these molecular mechanisms in chickpea but also offers potential targets for genetic modification, aiming to improve drought tolerance not only in chickpea but potentially in other crop species as well. These findings bridge the gap between fundamental plant biology and agricultural productivity, paving the way for innovative strategies to mitigate the impact of drought stress on crucial crops like chickpea.
Author Contributions
Data curation, K.F., K.M. and A.S.; methodology, K.F., B.B. and A.S.; software, X.L.; visualization, X.L.; writing—original draft preparation, B.B.; writing—review and editing, B.B. and J.Z. All authors have read and agreed to the published version of the manuscript.
Funding
This article was supported by the Jilin Agricultural University high-level researcher grant (JAUHLRG20102006). This work was financially supported by the University of Kurdistan.
Informed Consent Statement
Informed consent was obtained from all subjects involved in the study.
Data Availability Statement
Data are contained within the article.
Conflicts of Interest
The authors declare no conflict of interest.
Abbreviations
| BR | Brassinosteroids |
| BES1 | BRI1-ethylmethylsulfone-suppressor1 |
| NAC | (NAM, ATAF and CUC) |
| RD26 | Response to desiccation 26 |
| FC | Field capacity |
| RWC | Relative water contents |
| qRT-PCR | Quantitative real-time PCR |
| EC | Electrical conductivity |
| MEGA | Molecular Evolution Genetic Analysis |
References
- FAOSTAT. FAOSTAT Statistical Database. Food and Agriculture Organization of the United Nations, Rome—References—Scientific Research Publishing. 2020. Available online: https://www.scirp.org/(S(351jmbntvnsjt1aadkposzje))/reference/referencespapers.aspxreferenceid=3058619 (accessed on 26 November 2023).
- Bisht, N.; Tiwari, S.; Singh, P.C.; Niranjan, A.; Singh Chauhan, P. A multifaceted rhizobacterium Paenibacillus lentimorbus alleviates nutrient deficiency-induced stress in Cicer arietinum L. Microbiol. Res. 2019, 223–225, 110–119. [Google Scholar] [CrossRef] [PubMed]
- Tiwari, P.N.; Tiwari, S.; Sapre, S.; Tripathi, N.; Payasi, D.K.; Singh, M.; Thakur, S.; Sharma, M.; Tiwari, S.; Tripathi, M.K. Prioritization of physio-biochemical selection indices and yield-attributing traits toward the acquisition of drought tolerance in chickpea (Cicer arietinum L.). Plants 2023, 12, 3175. [Google Scholar] [CrossRef] [PubMed]
- Kashiwagi, J.; Krishnamurthy, L.; Purushothaman, R.; Upadhyaya, H.D.; Gaur, P.M.; Gowda, C.L.L.; Ito, O.; Varshney, R.K. Scope for improvement of yield under drought through the root traits in chickpea (Cicer arietinum L.). Field Crops Res. 2015, 170, 47–54. [Google Scholar] [CrossRef]
- Yang, X.; Lu, M.; Wang, Y.; Wang, Y.; Liu, Z.; Chen, S. Response mechanism of plants to drought Stress. Horticulturae 2021, 7, 50. [Google Scholar] [CrossRef]
- Manivannan, P.; Jaleel, C.A.; Sankar, B.; Kishorekumar, A.; Somasundaram, R.; Lakshmanan, G.M.A.; Panneerselvam, R. Growth, biochemical modifications and proline metabolism in Helianthus Annuus L. as Induced by drought Stress. Colloids Surf. B Biointerfaces 2007, 59, 141–149. [Google Scholar] [CrossRef] [PubMed]
- Smirnoff, N. The role of active oxygen in the response of plants to water deficit and desiccation. New Phytol. 1993, 125, 27–58. [Google Scholar] [CrossRef] [PubMed]
- Apel, K.; Hirt, H. Reactive oxygen species: Metabolism, oxidative stress, and signal transduction. Annu. Rev. Plant Biol. 2004, 55, 373–399. [Google Scholar] [CrossRef]
- Khan, M.S.; Ahmad, D.; Khan, M.A. Utilization of genes encoding osmoprotectants in transgenic plants for enhanced abiotic stress tolerance. Electron. J. Biotechnol. 2015, 18, 257–266. [Google Scholar] [CrossRef]
- Bergonci, T.; Ribeiro, B.; Ceciliato, P.H.O.; Guerrero-Abad, J.C.; Silva-Filho, M.C.; Moura, D.S. Arabidopsis thaliana RALF1 Opposes brassinosteroid effects on root cell elongation and lateral root formation. J. Exp. Bot. 2014, 65, 2219–2230. [Google Scholar] [CrossRef]
- Nolan, T.M.; Vukasinović, N.; Liu, D.; Russinova, E.; Yin, Y. Brassinosteroids: Multidimensional regulators of plant growth, development, and stress responses. Plant Cell 2020, 32, 298–318. [Google Scholar] [CrossRef]
- Ye, H.; Liu, S.; Tang, B.; Chen, J.; Xie, Z.; Nolan, T.M.; Jiang, H.; Guo, H.; Lin, H.Y.; Li, L.; et al. RD26 mediates crosstalk between drought and brassinosteroid signaling pathways. Nat. Commun. 2017, 8, 14573. [Google Scholar] [CrossRef] [PubMed]
- Kagale, S.; Divi, U.K.; Krochko, J.E.; Keller, W.A.; Krishna, P. Brassinosteroid confers tolerance in Arabidopsis thaliana and Brassica napus to a range of abiotic stresses. Planta 2007, 225, 353–364. [Google Scholar] [CrossRef] [PubMed]
- Beste, L.; Nahar, N.; Dalman, K.; Fujioka, S.; Jonsson, L.; Dutta, P.C.; Sitbon, F. Synthesis of hydroxylated sterols in transgenic Arabidopsis plants alters growth and steroid metabolism. Plant Physiol. 2011, 157, 426–440. [Google Scholar] [CrossRef] [PubMed]
- Feng, Y.; Yin, Y.; Fei, S. Down-regulation of BdBRI1, a putative brassinosteroid receptor gene produces a dwarf phenotype with enhanced drought tolerance in Brachypodium distachyon. Plant Sci. 2015, 234, 163–173. [Google Scholar] [CrossRef] [PubMed]
- Yin, Y.; Vafeados, D.; Tao, Y.; Yoshida, S.; Asami, T.; Chory, J. A new class of transcription factors mediates brassinosteroid-regulated gene expression in Arabidopsis. Cell 2005, 120, 249–259. [Google Scholar] [CrossRef] [PubMed]
- Cui, X.Y.; Gao, Y.; Guo, J.; Yu, T.F.; Zheng, W.J.; Liu, Y.W.; Chen, J.; Xu, Z.S.; Ma, Y.Z. BES/BZR transcription factor TaBZR2 positively regulates drought responses by activation of TaGST1. Plant Physiol. 2019, 180, 605–620. [Google Scholar] [CrossRef] [PubMed]
- Yu, X.; Li, L.; Zola, J.; Aluru, M.; Ye, H.; Foudree, A.; Guo, H.; Anderson, S.; Aluru, S.; Liu, P.; et al. A Brassinosteroid transcriptional network revealed by genome-wide identification of BESI target genes in Arabidopsis thaliana. Plant J. 2011, 65, 634–646. [Google Scholar] [CrossRef]
- Tran, L.S.P.; Nakashima, K.; Sakuma, Y.; Simpson, S.D.; Fujita, Y.; Maruyama, K.; Fujita, M.; Seki, M.; Shinozaki, K.; Yamaguchi-Shinozaki, K. Isolation and functional analysis of Arabidopsis stress-inducible NAC transcription factors that bind to a drought-responsive Cis-element in the early responsive to dehydration stress 1 promoter. Plant Cell 2004, 16, 2481–2498. [Google Scholar] [CrossRef]
- Li, Q.F.; He, J.X. BZR1 interacts with HY5 to mediate brassinosteroid- and light-regulated cotyledon opening in Arabidopsis in darkness. Mol. Plant 2016, 9, 113–125. [Google Scholar] [CrossRef]
- Bai, M.Y.; Zhang, L.Y.; Gampala, S.S.; Zhu, S.W.; Song, W.Y.; Chong, K.; Wang, Z.Y. Functions of OsBZR1 and 14-3-3 proteins in brassinosteroid signaling in rice. Proc. Natl. Acad. Sci. USA 2007, 104, 13839–13844. [Google Scholar] [CrossRef]
- Zhu, W.; Jiao, D.; Zhang, J.; Xue, C.; Chen, M.; Yang, Q. Genome-wide identification and analysis of BES1/BZR1 transcription factor family in potato (Solanum tuberosum. L). Plant Growth Regul. 2020, 92, 375–387. [Google Scholar] [CrossRef]
- Wu, P.; Song, X.M.; Wang, Z.; Duan, W.K.; Hu, R.; Wang, W.L.; Li, Y.; Hou, X. Genome-Wide Analysis of the BES1 Transcription factor family in Chinese cabbage (Brassica rapa ssp. Pekinensis). Plant Growth Regul. 2016, 80, 291–301. [Google Scholar] [CrossRef]
- Li, Q.; Guo, L.; Wang, H.; Zhang, Y.; Fan, C.; Shen, Y. In silico genome-wide identification and comprehensive characterization of the BES1 gene family in soybean. Heliyon 2019, 5, e01868. [Google Scholar] [CrossRef] [PubMed]
- Ma, S.; Ji, T.; Liang, M.; Li, S.; Tian, Y.; Gao, L. Genome-wide identification, structural, and gene expression analysis of BRI1-EMS-suppressor 1 transcription factor family in Cucumis sativus. Front. Genet. 2020, 11, 583996. [Google Scholar] [CrossRef] [PubMed]
- Wang, W.; Sun, Y.Q.; Li, G.L.; Zhang, S.Y. Genome-wide identification, characterization, and expression patterns of the BZR transcription factor family in sugar beet (Beta vulgaris L.). BMC Plant Biol. 2019, 19, 191. [Google Scholar] [CrossRef] [PubMed]
- Li, Y.; Ruperao, P.; Batley, J.; Edwards, D.; Khan, T.; Colmer, T.D.; Pang, J.; Siddique, K.H.M.; Sutton, T. Investigating drought tolerance in chickpea using genome-wide association mapping and genomic selection based on whole-genome resequencing data. Front. Plant Sci. 2018, 9, 190. [Google Scholar] [CrossRef] [PubMed]
- Kumar, A.; Elston, J. Genotypic differences in leaf water relations between Brassica juncea and B. napus. Ann. Bot. 1992, 70, 3–9. [Google Scholar] [CrossRef]
- Sabaghpour, S.H.; Ferayedi, Y.; Kamel, M.; Mahmoodi, A.A.; Mahdeyeh, M.; Mahmoodi, F.; Saeed, A.; Kanoni, H.; Pouralibaba, H.R.; Khaledahmadi, M.; et al. Samin, a new drought tolerance, large seed size and high potential yield chickpea cultivar for spring planting on cold dryland condition of Iran. Res. Achiev. Field Hortic. Crops 2017, 6, 111–121. [Google Scholar]
- Ball, R.A.; Oosterhuis, D.M. Measurement of root and leaf osmotic potential using the vapor-pressure osmometer. Environ. Exp. Bot. 2005, 53, 77–84. [Google Scholar] [CrossRef]
- Tripathy, J.N.; Zhang, J.; Robin, S.; Nguyen, T.T.; Nguyen, H.T. QTLs for cell-membrane stability mapped in rice (Oryza sativa L.) under drought stress. Theor. Appl. Genet. 2000, 100, 1197–1202. [Google Scholar] [CrossRef]
- Bates, L.S.; Waldren, R.P.; Teare, I.D. Rapid determination of free proline for water-stress studies. Plant Soil 1973, 39, 205–207. [Google Scholar] [CrossRef]
- Lichtenthaler, H.K. Chlorophyll fluorescence signatures of leaves during the autumnal chlorophyll breakdown. J. Plant Physiol. 1987, 131, 101–110. [Google Scholar] [CrossRef]
- Herzog, V.; Fahimi, H.D. A new sensitive colorimetric assay for peroxidase using 3,3′-Diaminobenzidine as hydrogen donor. Anal. Biochem. 1973, 55, 554–562. [Google Scholar] [CrossRef] [PubMed]
- Bailey, T.L.; Boden, M.; Buske, F.A.; Frith, M.; Grant, C.E.; Clementi, L.; Ren, J.; Li, W.W.; Noble, W.S. MEME SUITE: Tools for motif discovery and searching. Nucleic Acids Res. 2009, 37 (Suppl. S2), W202–W208. [Google Scholar] [CrossRef] [PubMed]
- Gasteiger, E.; Hoogland, C.; Gattiker, A.; Duvaud, S.E.; Wilkins, M.R.; Appel, R.D.; Bairoch, A. Protein Identification and Analysis Tools on the ExPASy Server; Humana Press: Totowa, NJ, USA, 2005; pp. 571–607. [Google Scholar]
- Hu, B.; Jin, J.; Guo, A.Y.; Zhang, H.; Luo, J.; Gao, G. GSDS 2.0: An upgraded gene feature visualization server. Bioinformatics 2015, 31, 1296–1297. [Google Scholar] [CrossRef] [PubMed]
- Wang, Y.; Jia, L.; Tian, G.; Dong, Y.; Zhang, X.; Zhou, Z.; Luo, X.; Li, Y.; Yao, W. shinyCircos-V2.0: Leveraging the creation of Circos plot with enhanced usability and advanced features. iMeta 2023, 2, e109. [Google Scholar] [CrossRef]
- Chen, F.; Mackey, A.J.; Stoeckert, C.J.; Roos, D.S. OrthoMCL-DB: Querying a comprehensive multi-species collection of ortholog groups. Nucleic Acids Res. 2006, 34, D363–D368. [Google Scholar] [CrossRef] [PubMed]
- Kumar, S.; Stecher, G.; Li, M.; Knyaz, C.; Tamura, K. MEGA X: Molecular Evolutionary Genetics Analysis across Computing Platforms. Mol. Biol. Evol. 2018, 35, 1547. [Google Scholar] [CrossRef] [PubMed]
- Livak, K.J.; Schmittgen, T.D. Analysis of relative gene expression data using real-time quantitative PCR and the 2(-Delta Delta C(T)) method. Methods 2001, 25, 402–408. [Google Scholar] [CrossRef]
- Sabaghpour, S.H.; Mahmodi, A.A.; Saeed, A.; Kamel, M.; Malhotra, R. Study on chickpea drought tolerance lines under dryland condition of Iran. Indian J. Crop Sci. 2006, 1, 70–73. [Google Scholar]
- Garg, R.; Shankar, R.; Thakkar, B.; Kudapa, H.; Krishnamurthy, L.; Mantri, N.; Varshney, R.K.; Bhatia, S.; Jain, M. Transcriptome analyses reveal genotype- and developmental stage-specific molecular responses to drought and salinity stresses in chickpea. Sci. Rep. 2016, 6, srep19228. [Google Scholar] [CrossRef] [PubMed]
- Mafakheri, A.; Siosemardeh, A.; Bahramnejad, B.; Struik, P.; Sohrabi, Y. Effect of drought stress on yield, proline and chlorophyll Contents in Three Chickpea Cultivars. Aust. J. Crop Sci. 2010, 4, 580–585. [Google Scholar]
- Kaur, D.; Grewal, S.K.; Kaur, J.; Singh, S.; Singh, I. Water Deficit Stress Tolerance in Chickpea Is Mediated by the Contribution of integrative defence systems in different tissues of the plant. Funct. Plant Biol. 2016, 43, 903–918. [Google Scholar] [CrossRef] [PubMed]
- Çevik, S.; Akpinar, G.; Yildizli, A.; Kasap, M.; Karaosmanoğlu, K.; Ünyayar, S. Comparative physiological and leaf proteome analysis between drought-tolerant chickpea Cicer reticulatum and drought-sensitive chickpea C. arietinum. J. Biosci. 2019, 44, 20. [Google Scholar] [CrossRef] [PubMed]
- Kaur, G.; Asthir, B.J.B.P. Proline: A key player in plant abiotic stress tolerance. Biol. Plant 2015, 59, 609–619. [Google Scholar] [CrossRef]
- Sarker, U.; Oba, S. Drought stress enhances nutritional and bioactive compounds, phenolic acids and antioxidant capacity of amaranthus leafy vegetable. BMC Plant Biol. 2018, 18, 258. [Google Scholar] [CrossRef]
- Mafakheri, A.; Siosemardeh, A.; Bahramnejad, B.; Struik, P.; Sohrabi, Y. Effect of drought stress and subsequent recovery on protein, carbohydrate contents, catalase and peroxidase activities in three chickpea (‘Cicer arietinum’) cultivars. Aust. J. Crop Sci. 2011, 5, 1255–1260. [Google Scholar]
- Patel, P.K.; Hemantaranjan, A. Salicylic acid induced alteration in dry matter partitioning, antioxidant defence system and yield in chickpea (Cicer arietinum L.) under drought stress. Asian J. Crop Sci. 2012, 4, 86–102. [Google Scholar] [CrossRef]
- Talebi, R.; Ensafi, M.H.; Baghebani, N.; Karami, E.; Mohammadi, K. Physiological Responses of Chickpea (Cicer arietinum) Genotypes to Drought Stress. Available online: https://www.researchgate.net/publication/236008585_Physiological_responses_of_chickpea_Cicer_arietinum_genotypes_to_drought_stress (accessed on 27 December 2022).
- Macar, T.; Ekmekçi, Y. Alterations in photochemical and physiological activities of chickpea (Cicer arietinum L.) cultivars under drought stress. J. Agron. Crop Sci. 2009, 195, 335–346. [Google Scholar] [CrossRef]
- Herbinger, K.; Tausz, M.; Wonisch, A.; Soja, G.; Sorger, A.; Grill, D. Complex interactive effects of drought and ozone stress on the antioxidant defence systems of two wheat cultivars. Plant Physiol. Biochem. 2002, 40, 691–696. [Google Scholar] [CrossRef]
- Sun, Z.; Liu, X.; Zhu, W.; Lin, H.; Chen, X.; Li, Y.; Ye, W.; Yin, Z. Molecular traits and functional exploration of BES1 gene Family in plants. Int. J. Mol. Sci. 2022, 23, 4242. [Google Scholar] [CrossRef]
- Yang, J.; Wu, Y.; Li, L.; Li, C. Comprehensive analysis of the BES1 gene family and its expression under abiotic stress and hormone treatment in Populus trichocarpa. Plant Physiol. Biochem. 2022, 173, 1–13. [Google Scholar] [CrossRef] [PubMed]
- Tang, W.; Yuan, M.; Wang, R.; Yang, Y.; Wang, C.; Oses-Prieto, J.A.; Kim, T.W.; Zhou, H.W.; Deng, Z.; Gampala, S.S.; et al. PP2A activates brassinosteroid-responsive gene expression and plant growth by dephosphorylating BZR1. Nat. Cell Biol. 2011, 13, 124–131. [Google Scholar] [CrossRef] [PubMed]
- Yu, H.; Feng, W.; Sun, F.; Zhang, Y.Y.; Qu, J.T.; Liu, B.; Lu, F.; Yang, L.; Fu, F.; Li, W. Cloning and characterization of BES1/BZR1 transcription factor genes in maize. Plant Growth Regul. 2018, 86, 235–249. [Google Scholar] [CrossRef]
- Saha, G.; Park, J.I.; Jung, H.J.; Ahmed, N.U.; Kayum, M.A.; Kang, J.G.; Nou, I.S. Molecular characterization of BZR transcription factor family and abiotic stress induced expression profiling in Brassica rapa. Plant Physiol. Biochem. 2015, 92, 92–104. [Google Scholar] [CrossRef] [PubMed]
- Li, Y.; Chen, Q.; Nan, H.; Li, X.; Lu, S.; Zhao, X.; Liu, B.; Guo, C.; Kong, F.; Cao, D. Overexpression of GmFDL19 enhances tolerance to drought and salt stresses in soybean. PLoS ONE 2017, 12, e0179554. [Google Scholar] [CrossRef] [PubMed]
- Chen, J.; Nolan, T.M.; Ye, H.; Zhang, M.; Tong, H.; Xin, P.; Chu, J.; Chu, C.; Li, Z.; Yina, Y. Arabidopsis WRKY46, WRKY54, and WRKY70 Transcription factors are involved in brassinosteroid-regulated plant growth and drought responses. Plant Cell 2017, 29, 1425–1439. [Google Scholar] [CrossRef] [PubMed]
- Feng, W.; Liu, Y.; Cao, Y.; Zhao, Y.; Zhang, H.; Sun, F.; Yang, Q.; Li, W.; Lu, Y.; Zhang, X.; et al. Maize ZmBES1/BZR1-3 and-9 transcription factors negatively regulate drought tolerance in transgenic Arabidopsis. Int. J. Mol. Sci. 2022, 23, 6025. [Google Scholar] [CrossRef]


Disclaimer/Publisher’s Note: The statements, opinions and data contained in all publications are solely those of the individual author(s) and contributor(s) and not of MDPI and/or the editor(s). MDPI and/or the editor(s) disclaim responsibility for any injury to people or property resulting from any ideas, methods, instructions or products referred to in the content. |
© 2023 by the authors. Licensee MDPI, Basel, Switzerland. This article is an open access article distributed under the terms and conditions of the Creative Commons Attribution (CC BY) license (https://creativecommons.org/licenses/by/4.0/).