Article

The Decreased Availability of Soil Moisture and Canopy Conductance Dominate Evapotranspiration in a Rain-Fed Maize Ecosystem in Northeastern China

1
Institute of Atmospheric Environment, China Meteorological Administration, Shenyang 110166, China
2
Jinzhou Ecology and Agriculture Meteorological Center, Liaoning Meteorological Bureau, Jinzhou 121001, China
3
College of Agronomy, Shenyang Agricultural University, Shenyang 110866, China
4
Key Laboratory of Agrometeorological Disasters, Shenyang 110166, China
5
Jinzhou Meteorological Service, Liaoning Meteorological Bureau, Jinzhou 121001, China
*
Authors to whom correspondence should be addressed.
Agronomy 2023, 13(12), 2941; https://doi.org/10.3390/agronomy13122941
Submission received: 23 October 2023 / Revised: 18 November 2023 / Accepted: 23 November 2023 / Published: 29 November 2023
(This article belongs to the Section Water Use and Irrigation)

Abstract

:
Evapotranspiration (ET) determines the crop productivity in rain-fed agriculture. Global climate change alters the trade-off between soil water supply and atmospheric demand, energy partitioning, and community biophysical and structural properties; however, the interactive effects of these biotic and abiotic factors on ET and its components remain unclear. ET was measured in 2005–2020 in a rain-fed maize ecosystem in northeastern China using the eddy covariance method. By decomposing ET into transpiration (T) and evaporation (E) with the Shuttleworth–Wallace model, we investigated the abiotic and biotic interactive effects on ET and its components at annual levels. Results showed that available energy and albedo exhibited no significant time-series trends, but the Bowen ratio exhibited an increasing trend. Precipitation exhibited no significant trends; however, soil water content (SWC) decreased with time, accompanied by significantly increased air temperature (Ta) and a vapor pressure deficit (VPD). The ET decline was controlled by T, rather than E. The T decline was mainly controlled by canopy conductance and SWC. CO2 concentrations and the VPD exhibited indirect effects on T by reducing canopy conductance, while Ta and precipitation had indirect effects on T by reducing SWC. Our results indicated that decreasing ET may be more severe with crop physiological adaptability for a decreased SWC. Aiming to enhance water resource efficiency, the practice of returning crop residues to the field to reduce soil evaporation, coupled with adjusting the sowing time to mitigate the risk of seasonal droughts during critical growth stages, represents an effective strategy in agricultural water resource management.

1. Introduction

Evapotranspiration (ET) is the second largest flux in the global water cycle, and an important process that couples water, energy, and carbon cycles [1,2]. ET returns 70% of the total global precipitation to the atmosphere via evaporation (E) from the land surface and transpiration via plants (T) [3]. Globally, agricultural ecosystems consume 7404 Gm3 a−1 of water through ET [4]. Rain-fed agriculture accounts for 80% of the word’s agricultural land [5,6], contributing 60% of the world’s crop production and high on-farm water consumption (5173 Gm3 a−1) [4,7]. Changes in soil water supply and atmospheric water demand caused by climate change and human disturbance will have profound negative effects on evapotranspiration, yield, and the climate system [8,9]. Rising CO2 concentrations and variability in precipitation necessitates thorough investigations of the patterns and drivers of ET and its components in rain-fed agroecosystems to ensure sustainable agriculture water management [10]. However, the interactive effects between these abiotic factors on ET and its components, and the underlying biological mechanisms, remain unclear [11].
In theory, variability in ET and its components is controlled by several interacting environmental and biophysical factors, such as surface energy partitioning between sensible (H) and latent (LE) heat; a balance between soil water supply and atmospheric water demand; the redistribution ratio of precipitation through the crop canopy, in terms of throughfall, stemflow, and precipitation interception; and crop physiological adaptability [12,13,14]. The effect of available energy on ET depends on water availability [15]. In wet areas, the vapor concentration in stomata and in the soil can be regarded as saturated, with the vapor concentration in the atmosphere becoming the main factor for ET [16]. In conditions of adequate moisture, ET increases with the rising vapor pressure deficit (VPD) and the available energy is the controlling factor in the changes in ET [16]. Nonetheless, ET is suppressed by soil water stress, especially during the plant growing season [17,18]. More available energy partitioned into sensible heat can lead to an increase in the temperature, VPD, and drought stress [14,19]. Consequently, the interactive effects of water supply and energy partitioning on ET need to be further explored [15].
Plants affect the hydrological cycle through modifying the distribution of water applied during rainfall [20]. With warmer temperatures, rising CO2 concentrations, and variable precipitation, physiological adaptability of plants may also influence ET variability through complex land–atmosphere interactions. The natural ecosystem responds to climate change and elevated CO2 with the biological regulation of the physiology and structure of vegetation [21]. An elevated CO2 concentration in the atmosphere exerts two opposite effects on ET [22]. On one hand, an elevated atmospheric CO2 concentration reduces stomatal conductance, resulting in lower water transpiration through leaves [23]. On the other hand, leaf area may increase with the CO2 fertilization effect, leading to higher ET [24]. At the same time, if water supply is less than water consumption in conditions of low atmospheric humidity and large VPDs, stomata respond with hydropassive closure [25]. However, an elevated CO2 level reduced annual ET in most terrestrial ecosystems, indicating that the negative impact of CO2’s physiological effects on ET (e.g., stomata closure) overwhelmed the positive impact of global greening driven by CO2 fertilization [21]. Therefore, ET and its components are expected to be affected by the interaction between abiotic and biotic variables.
Climate change leads to an increase in the frequency of droughts and dry spells across large parts of northeastern China, including many areas vital for agricultural production [14,26]. A prolonged drought affected 52.3–62.0% of the area in northeastern China in the past 15 years, with a temperature rise of 0.035 °C a−1 and a precipitation decrease of 13.3 mm 10 yr−1 [27]. Rain-fed spring maize is a major crop in northeastern China, accounting for 57.2% of the planted area, 33.8% of the crop yield, and 64.3% of the total maize yield in China [27,28]. In this study, we used eddy covariance to measure ET during 2005–2020 in a rain-fed maize ecosystem in northeastern China, and decomposed it into transpiration (T) and evaporation (E) with the Shuttleworth–Wallace model [29,30]. Our objectives were to (1) partition the available energy for sensible heat and latent heat; (2) determine the impact of vapor pressure deficit and soil water content on ET; (3) establish the effects of crop physiological adaptability to decreased available soil moisture, warmer temperatures, and rising CO2 concentrations; and (4) explore how the interactions between biotic and abiotic variables affect ET and its components.

2. Materials and Methods

2.1. Site Description

This study was conducted at the Jinzhou flux observation site (41°08′ N, 121°12′ E, and 23.3 m above sea level), a member of ChinaFLUX, located at Jinzhou Agrometeorological Experimental Station, Liaoning Province, in northeastern China. The study area is influenced by a representative temperate monsoon climate, with mean annual air temperature of 10.4 °C and annual precipitation of 556.2 mm (and 503.0 mm in the growing season), based on meteorological records from 1991 to 2020 from a nearby national weather station. The mean annual air temperature increases at a rate of approximately 1.0 °C 10 a−1, and annual precipitation decreases at a rate of 9.7 mm 10 a−1. There are two prevailing wind directions in Jinzhou, north–northeast in winter and south–southeast in summer. The soil type is silty clay loam. The soil pH is 6.3 with an average soil bulk density of 1.6 g cm−3 [31]. Spring maize is the primary crop in the area [31,32].
Rain-fed maize was generally sown every year during mid-April to mid-May, and harvested from mid-September to early October, depending on air temperature and soil moisture conditions without irrigation [33,34]. Ji et al. [35] pointed out that the threshold of water supply for maize growth was 361–741 mm, and that the appropriate threshold was 451–556 mm in the northeast China. The precipitation during the growing season met the need of the water supply for maize growth. Details on maize growth periods are provided in Supplementary Table S1. Crops were fertilized with a chemical fertilizer (NH4HCO3) during the planting period (1000 kg ha−1). The average crop density was 48,500 plants ha−1. The maximum leaf area index (LAI) reached 4.4 m2 m−2 during the tasseling period, and the maximum crop height was 2.8 m during the filling period. After harvest, crop residues, including aboveground stems and leaves, were left on the soil surface, while grain was removed from the agroecosystem.

2.2. Evapotranspiration and Auxiliary Measurements

2.2.1. Eddy Covariance Measurements

An above-canopy flux system, mounted at 4 m on a tower, consisted of an open-path CO2/H2O analyzer (LI-7500, Licor Biosciences Inc., Lincoln, NE, USA) and a three-dimensional sonic anemometer (CSAT, Campbell Scientific Inc., Logan, UT, USA). CO2/H2O concentration and three-dimensional wind velocity measurements were taken at 10 Hz with a data logger (CR5000, Campbell Scientific Inc., Logan, UT, USA), and 30 min mean fluxes were calculated since June, 2004. The CO2/H2O analyzer was periodically calibrated to avoid an instrument drift.
The flux tower was located approximately in the center of the maize field, with at least a 380 m radius. The representative area of the flux footprint climatology was 0.02–0.36 km−2 in the growing season, and 0.38–0.44 km−2 in the non-growing season, calculated with a footprint model proposed by Kormann and Meixner using the data from 2005 to 2020 [36,37].
The data underwent quality control and processing using standardized methods in accordance with FLUXNET [38]. The number of valid data points after quality control is presented in Table S3 in Zhang et al.’s study [37]. To ensure a continuous dataset and estimate annual fluxes, marginal distribution sampling was employed to fill data gaps [37].

2.2.2. Meteorological Variable Measurements

Radiation measurements were taken using a four-component net radiometer (CNR-1, Kipp & Zonen, Delft, The Netherlands) and included downward shortwave radiation (DR), upward shortwave radiation (UR), downward longwave radiation (DLR), and upward longwave radiation (ULR) at a height of 5 m above the ground. A quantum sensor of photosynthetically active radiation (PAR) (Li190SB, LI-COR Inc., Lincoln, NE, USA) was installed at a height of 4 m above the ground. Soil heat flux (G) plates (HFP01, Hukeflux Inc., Delft, The Netherlands) were placed at a depth of 0.08 m. Meanwhile, downward and upward shortwave radiation as well as net radiation were also measured and shared by a nearby national weather station.
Air temperature (Ta) and relative humidity were measured with an HMP45C (Vaisala, Campbell Scientific Inc., Logan, UT, USA) at heights of 4 and 6 m above the ground. Precipitation (PPT) was monitored with a tipping bucket (52202, RM Young Inc., Traverse City, MI, USA). Soil volumetric water content (SWC) at 10 cm depth was measured with Eazy-AG50 (Sentek Inc., Stepney, Australia). All meteorological and soil variables were recorded at 1 Hz with a datalogger (CR23X, Campbell Scientific Inc., Logan, UT, USA), and 30 min means were calculated. Additionally, SWC at 10, 20, 30, 40, and 50 cm depths were manually measured on the 8th, 18th, and 28th day of each month [39].

2.2.3. Biological Variable Measurements

The daily LAI was obtained based on the empirical relationship between intermittently observed LAI and 16-day NDVI. Firstly, LAI was observed intermittently when 75% of the maize crops in the study area were grown to seven leaves via jointing, tasseling, and filling. In brief, five individuals were randomly selected as replicates. All leaves were collected per individual. The length and width of each leaf were manually measured. Leaf area was the product of the length (leafL) and width (leafw) of a leaf, corrected by a coefficient of 0.7 [39]. Consequently, LAI was calculated as follows:
L A I = C r o p   d e n s i t y × i = 1 n L e a f L × L e a f w × 0.7 5
where n was the total number of leaves of the five individuals in the study site.
Secondly, the empirical relationship between the observed LAI and NDVI was established during the maize growing season. In every growth stage, the average NDVI before and after an LAI observation is considered as the NDVI of maize for that growth stage, and the correlations between LAI and NDVI are shown in Table S2 in Zhang et al.’s study [38]. Then, according to the correlations, the 16-day LAI values were calculated using the 16-day NDVI values. The daily LAI values were finally obtained through linear interpolation of the 16-day LAI.
NDVI observations were performed at an approximately 250 spatial resolution and 16-day temporal resolution, derived from the National Aeronautics and Space Administration (NASA) website (https://modis.gsfc.nasa.gov/data/, accessed on 22 October 2023).

2.3. Statistical Analyses

2.3.1. ET Partitioning with the Shuttleworth–Wallace Model

ET was decomposed into T and E using the Shuttleworth–Wallace model [30]. The methodology of the Shuttleworth–Wallace model and key parameters could be found in Hu et al. [40,41]. In brief, key parameters were optimized with the Monte Carlo method using eddy covariance data from the site. Bulk canopy and soil surface resistance were estimated by introducing the Ball–Berry model and the soil–surface resistance equation, respectively [41]. The Shuttleworth–Wallace model addressed key problems of estimating bulk canopy conductance and achieved good simulation results in different ecosystems [40]. In this study, there was good agreement between the observed and modeled data (y = 0.99x, n = 126,907, R2 = 0.76, p < 0.001) at half-hourly and (y = 0.747x + 115.82, n = 16, R2 = 0.79, p < 0.001) at annual levels, and between the observed and predicted data (y = 1.01x, n = 127,351, R2 = 0.74, p < 0.001) at half-hourly and (y = 0.723x + 132.35, n = 16, R2 = 0.75, p < 0.001) at annual levels.

2.3.2. Structural Equation Modeling (SEM)

Pearson’s correlation analyses were used to evaluate the effects of environmental and biotic variables on ET (SPSS18.0, Chicago, IL, USA). Linear regressions were used to describe the effects of environmental and biotic variables on ET and its components (Matlab 2016a, MathWorks, Natick, MA, USA). A structural equation model (SEM) was established to relate energy, water, and vegetation properties to temporal variability in ET and its components (AMOS 22.0, Chicago, IL, USA). In brief, (1) the hypothesized causal relationships among variables were developed based on the prior knowledge of how climate, soil, and vegetation variables affect ET; then, (2) stepwise regression was used to select significant independent variables among all variables. We chose the final models with high-fit statistics. The SEM models were evaluated using the Chi-squared test (χ2, p > 0.05).

3. Results

3.1. Allocation of Available Energy into Sensible and Latent Heat Fluxes

Net radiation above the canopy (Rn) (p > 0.05, Figure 1a), net radiation above the soil surface (Rns), and the soil heat flux (G) (p > 0.05, Figure 1b) did not exhibit significant changes over the observation period (2005–2020), demonstrating that the annual energy available for sensible heat (H) and latent heat (LE) fluxes did not vary with time. However, H increased (p < 0.001, Figure 1c) and LE decreased (p = 0.017, Figure 1d) over time, resulting in increases in the Bowen ratio (β) (p < 0.001, Figure 1d). The opposite trends of LE and H indicated that the energy allocated to evapotranspiration significantly declined over time (Figure 1d).
Furthermore, the annual downward shortwave radiation (DR) (p = 0.009, Figure 2a), photosynthetically active radiation (PAR) (p < 0.001, Figure 2a), and the upward shortwave radiation (UR) (p = 0.004, Figure 2b) exhibited significant increasing trends for 2005–2020 for our radiation measurement and a nearby national weather station. However, the relatively constant albedo (p > 0.05, Figure 2b) indicated that the surface characteristics of soil and plants did not vary over time.
Downward longwave radiation (DLR) (p = 0.36, Figure 2c) did not change over time, while upward longwave radiation (ULR) (p = 0.016, Figure 2d) and air temperature (p = 0.019, Figure 2d) increased significantly with time. In addition, the Budyko’s curve showed that the aridity index was >1 (Supplementary Figure S1), reflecting a water supply limitation rather than an energy demand for ET.

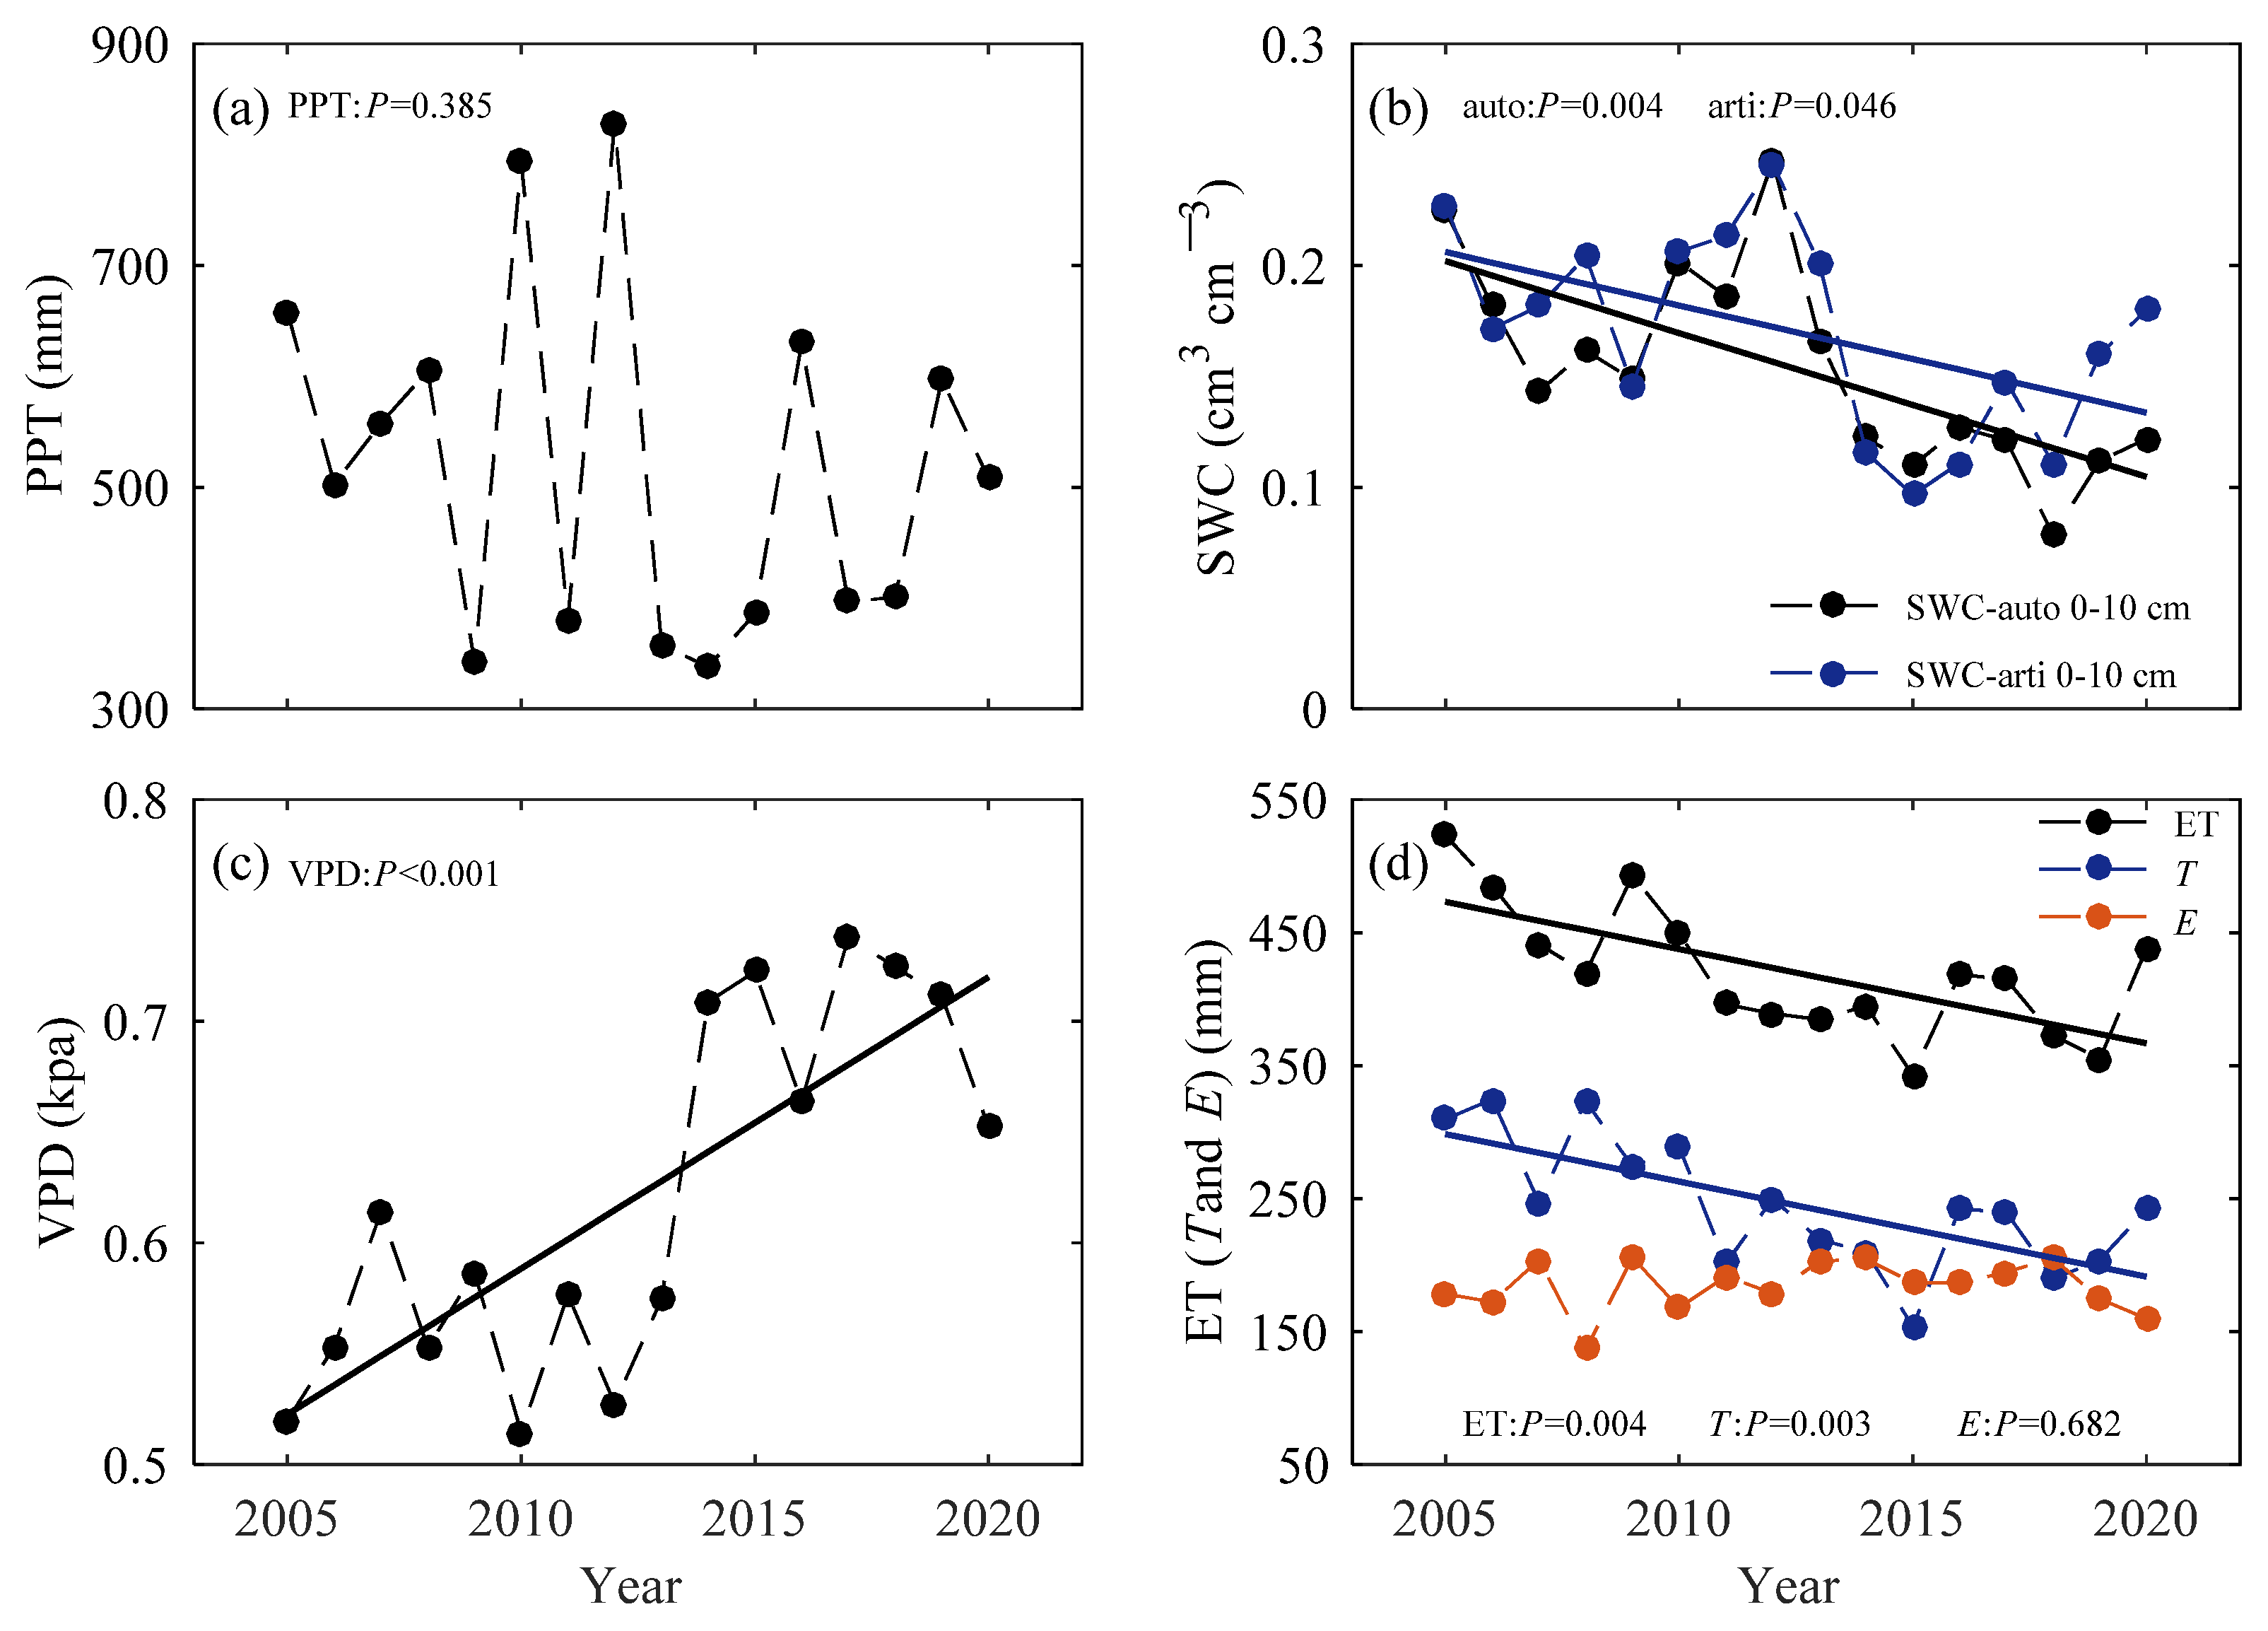
3.2. Allocation of Available Water to Soil Water and Evapotranspiration

Annual precipitation (PPT) (p = 0.385, Figure 3a) varied, but did not show a trend over time, while cumulative precipitation during the critical period of the crop water requirement (June to July) (p = 0.004, Supplementary Figure S2a) decreased significantly over time (2005–2020). Soil water content (SWC) at 0–10 cm depths exhibited a decline over time (Figure 3b). The decline in SWC in the critical growth period (Supplementary Figure S2b) was faster than that of the annual average value. These results indicated that soil water supply capacity decreased during the observation period.
Meanwhile, the annual (p < 0.001, Figure 3c) and periodic (from June to July, p < 0.001, Supplementary Figure S2c) vapor pressure deficit (VPD) increased significantly, accompanied by a significantly increased air temperature (Figure 2d), indicating that the atmospheric demand for ET was increasing.
Annual evapotranspiration (p = 0.004, Figure 3d) and transpiration (p = 0.003, Figure 3d) exhibited significant decreasing trends, and those from June to July decreased faster (p < 0.001, Supplementary Figure S2d). In comparison, annual evaporation did not vary over time (Figure 3d), being the same as that from June to July (Figure S2d). T decreased with decreasing ET, indicating that the soil water supply for plant demand was decreasing (Figure 3, Supplementary Figure S2).

3.3. Environmental Control on Evapotranspiration and Its Components

Pearson’s correlation analyses showed that the temporal variability in ET and its components were regulated by energy and water conditions during 2005–2020 (Supplementary Table S2) and from June to July phases during the study period (Supplementary Table S3). The structural equation model further showed that E and T explained 85% of the variation in annual ET (Figure 4). The standardized direct effects of E and T on ET were 0.33 (p = 0.001) and 0.96 (p < 0.001), respectively, indicating that the decreasing trend in ET was mainly controlled by T.
Energy and water variables explained 69 and 58% of variation in annual E and T, respectively. The strongest direct pathway of influence on E was the VPD (0.92), followed by SWC (0.79), while PPT (−0.17) and surface net radiation (Rns) (0.51) were the weakest. This indicated that the variability in E was jointly controlled by the soil water supply capacity and atmospheric water demand. The strongest direct pathway of influence on T was the VPD (−0.59). This effect was larger than that of SWC (0.22), suggesting that the variability in T was mainly controlled by the atmospheric water demand. SWC was controlled by PPT and air temperature, while the VPD was regulated by air temperature.

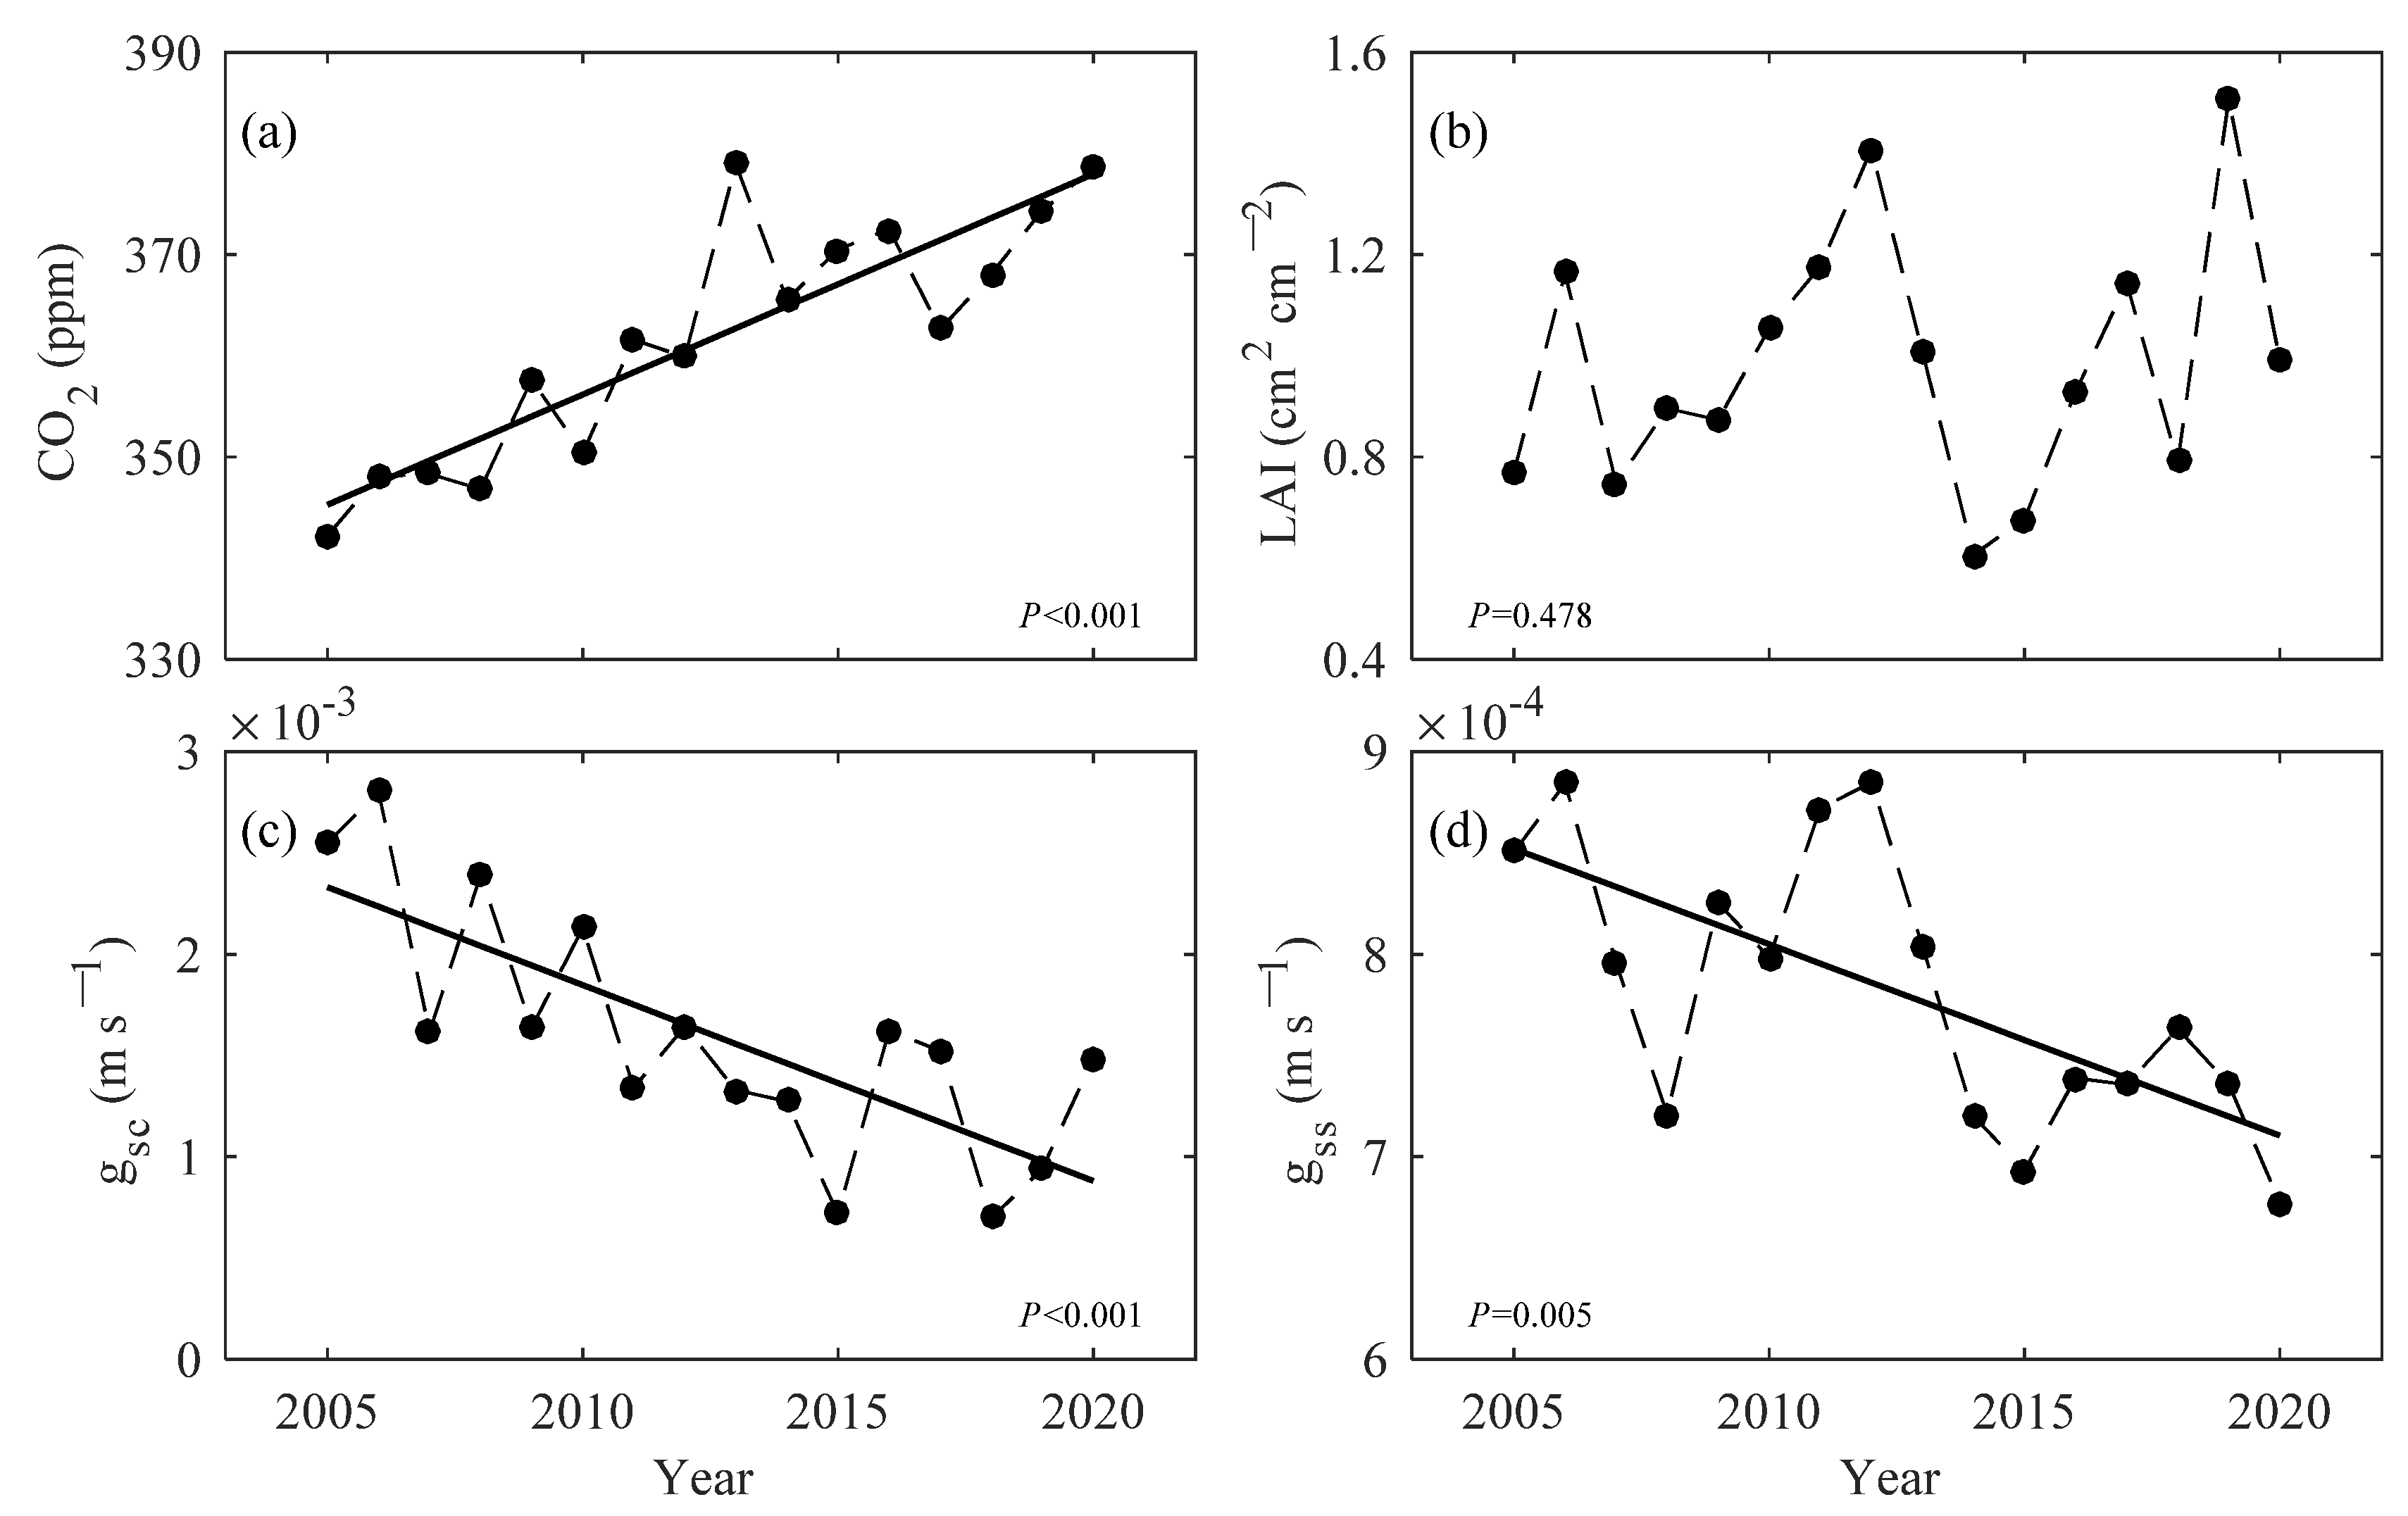
3.4. Biological Control on Evapotranspiration and Its Components

The effects of bulk canopy stomatal conductance (gsc), atmospheric CO2, and canopy structure (leaf area index, LAI) on T were investigated by decomposing ET into T and E. Annual atmospheric CO2 above the canopy increased over time (p < 0.001, Figure 5a), but LAI did not (p = 0.478, Figure 5b). Both canopy stomatal conductance (gsc) (p < 0.001, Figure 5c) and soil surface conductance (gss) (p = 0.005, Figure 5d) significantly decreased over time.
Adding the interaction of biotic and abiotic factors into the SEM increased the percent of explained variability in T by 17% (Figure 6). The strongest direct pathway of influence on T was gsc (0.66), followed by SWC (0.38). Both the VPD (−0.52) and CO2 concentration (−0.57) showed negative effects on the variability in gsc.

4. Discussion

4.1. Joint Limitation of Atmospheric Demand and Soil Moisture on ET

Relatively stable available energy (Figure 1a,b) declines in latent heat and increases in the Bowen ratio (β) (Figure 1d) during the observation period (2005–2020) indicated that available energy allocated to evapotranspiration decreased. The relatively constant albedo (Figure 2b) demonstrated that the changes in available energy partitioning were independent of soil and vegetation properties. The Bowen ratio in the study area (0.5 to 1.2) was higher than that in an irrigation agroecosystem (0.24–0.29) in the North China Plain [8]. This indicated that the water supply might be the most limiting factor for ET [42], as precipitation is the main water source in rain-fed agroecosystems [43]. Meanwhile, Budyko’s curve also revealed that ET was limited by the water supply rather than energy demand (Supplementary Figure S1) [44,45,46]. Furthermore, an increased available energy allocated to sensible heat led to an increase in air temperature (Figure 2d), which would further exacerbate the water limitation of ET [47]. The annual average energy balance ratio (EBR) was 75% (Supplementary Table S4), indicating that the agroecosystem in this study was approximately in an energy balance from 2005 to 2020 [48]. The missing energy might be consumed by plants through photosynthesis, stored in the canopy, and lost due to the flow distortion of a sonic anemometer [49,50]. The neglect of the missing energy would not affect the ratio of energy partitioning [50].
Our study demonstrated that increasing the atmospheric water demand and declining soil water supply jointly determined the decreasing trend in ET (Figure 4). This co-regulation mechanism had been observed in multiple natural ecosystems [19,51,52,53] but had been seldom investigated in agroecosystems [54]. By decomposing ET into T and E using the Shuttleworth–Wallace model [29,30], we found that a decline in T was the dominant driver of the decreasing trend in ET, while E did not vary with time (Figure 3d). In conditions of a sufficient soil water supply, an increased VPD would enhance evaporation [15]. However, low SWC was always accompanied by a high VPD because drier soils evaporate less [47]. In this study area, SWC decreased and the VPD increased over time (Figure 3b). These results indicated that insufficient water supply might partially offset the stimulating effect of the VPD on evaporation, ultimately resulting in a relatively constant E. In contrast to E, plants partly closed the stomata to adapt to the increasing VPD and decreasing SWC, avoiding xylem desiccation [19,54,55].
Variability in the precipitation regime (total precipitation and seasonal distribution) [56] was expected to exacerbate the limiting effect of drought stress on ET. In this study, we found that the decline in SWC during the critical maize growth period was faster than that in the annual average SWC (Figure 3b and Supplementary Figure S2b). The reason for this may be that the cumulated precipitation during the critical period of the crop water requirement decreased (Supplementary Figure S2a), even though annual precipitation did not change during the observation period (Figure 3a). The synchronization of seasonal variations of precipitation and soil moisture (Supplementary Figure S3), and the significant positive correlation between soil water content and precipitation (Supplementary Table S5) showed that precipitation was the major source of soil water.

4.2. Physiological Adaptability of Plants to Climate Change

Previous studies demonstrated that seasonal variations in transpiration were jointly determined by canopy structures (e.g., leaf area indexes) and canopy conductance [57,58]. However, our results showed that the inter-annual variation in transpiration was determined by canopy conductance rather than canopy structure or albedo (Figure 6, Supplementary Table S2). The reason for these differences might be that the cultivars and planting densities of maize in the rain-fed agriculture ecosystem in this study did not change over time, resulting in relatively constant canopy structures (Figure 5b) and albedos (Figure 2b). Canopy conductance decreased with the VPD and increased with soil water content (Figure 5c, Supplementary Table S2), indicating that maize decreased its canopy conductance at a cost of reducing the photosynthetic rate to adapt to drought stress [54]. Chen et al. [54] demonstrated that the limiting effect of soil water on stomatal conductance was higher than that of the VPD with increasing water stress.
Increases in CO2 concentration and temperature also contributed to the decrease in canopy conductance, thereby reducing transpiration (Figure 6, Supplementary Table S2). For example, plants partly close their stomata in response to increased CO2 concentrations to maintain a near constant CO2 concentration inside the leaf [25,59]. High air temperature always accompanies a high VPD (Supplementary Tables S2 and S3) [19]. However, increasing the CO2 concentration, photosynthetically active radiation (PAR), and air temperature may alleviate the limiting effect of water stress on yield because plants trade water for carbon through the stomata [59,60,61]. The “fertilization effect” helps to maintain a high CO2 supply capacity [62]. In addition, significantly increased PAR (Figure 2a) and air temperature (Figure 2d) help to promote high rates of photosynthetic carboxylation (CO2 demand capacity) [63]. Consequently, increasing CO2, PAR, and air temperature may result in a relatively high yield and water use efficiency due to the compensation effect of increasing the CO2 supply and demand capacity [59].

4.3. Implications for Farmland Water Management

Several agricultural water management practices can be used to maintain crop yields in rain-fed farmlands. For example, (1) straw may be retained on the soil surface to reduce soil evaporation. Crop residues exhibited negative effects on E in this study area (Figure S4); however, excessive amounts of straw may delay soil temperature warming in spring [38]. Further, (2) sowing may be adjusted to avoid seasonal droughts during the critical period of crop growth. A sowing experiment demonstrated that the yield of crops sown on 20 May was larger than that for crops sown on 20 April, 30 April, and 10 May (Figure S5). The reason for this was that the tasseling stage of maize sowed on 20 May occurred on 24 July, avoiding the seasonal drought due to soil moisture replenishment and because of the precipitation in August.

4.4. Limitation and Future Directions

Due to the limitations in the timeframe and resources of the research plan, this study did not consider the impacts of variations in the distribution ratios of throughfall, stem flow, and rainfall interception on ET through the crop canopy [20]. Additionally, it did not address the changes in relevant moisture indicators at the leaf scale, such as leaf relative water content and leaf water potential. Canopy structural alterations influence the redistribution of precipitation. Leaf relative water content is a crucial indicator of plant water status, and is closely linked to photosynthesis and overall water use efficiency. Leaf water potential provides a more comprehensive assessment of moisture conditions, aiding in the understanding of plant responses to water stress [55]. Future studies on field water balances should further investigate the distribution ratios of throughfall, stem flow, and rainfall interception through the crop canopy, along with variations in leaf relative water content, water potential, and related parameters. This approach will help reveal the sensitivity of plants to changes in water availability, providing a more comprehensive understanding of the dynamic processes of field water balances [55]. Simultaneously, integrating observational data with crop growth models, and adjusting model parameters locally, can enhance the accurate simulation of crop growth conditions in the study area. This integration will lead to a more precise assessment of crop yield and water use efficiency [54]. This study specifically focuses on the interannual variations in evapotranspiration and its components of rain-fed spring maize in northeastern China, emphasizing the environmental and biological influencing factors. The extrapolation of these findings to the interannual variations in evapotranspiration and specific influencing factors for other crops, such as rice and soybeans, in the study region remains uncertain and requires further investigation.

5. Conclusions

Abiotic and biotic controls of evapotranspiration (ET) at an annual scale were investigated during 2005–2020 with an eddy covariance dataset for rain-fed spring maize to learn about interannual variability in ET and its components in northeastern China. Our results showed that the available energy in the study area shows no significant trend, but there is a noticeable shift in energy allocation, with more being directed towards sensible heat and a gradual decrease in latent heat allocation. In comparison to energy constraints, water availability is the primary factor limiting evapotranspiration. Annual precipitation does not exhibit a significant trend, but there is a substantial decline in precipitation during critical periods of crop water demand. The VPD significantly increases, indicating an augmented atmospheric water demand. The SWC experiences a marked decrease, particularly during critical crop water demand periods, suggesting a reduction in soil water supply. ET and T exhibit a significant decreasing trend, while E shows no discernible interannual variation. E increases with the rising VPD and decreases with the decreasing SWC, with the two effects offsetting each other. T is positively correlated with both the SWC and VPD, where the increased atmospheric water demand and insufficient soil water supply lead to a decline in T, consequently causing a reduction in ET. The increase in the VPD and CO2 indirectly affects plant transpiration by influencing gsc, with the elevated VPD and CO2 promoting a reduction in gsc. Therefore, the decrease in soil water supply and stomatal conductance in rain-fed spring maize fields in northeastern China results in a reduction in the evapotranspiration of an ecosystem. This study underscores the imperative need to develop appropriate agricultural water management practices to enhance the soil water supply capacity and sustain yields in rain-fed farmlands. Returning crop residues to the field to minimize soil evaporation, coupled with adjusting sowing times to alleviate the risk of seasonal drought during critical growth stages, may represent an effective strategy for agricultural water resource management.

Supplementary Materials

The following supporting information can be downloaded at: https://www.mdpi.com/article/10.3390/agronomy13122941/s1. Table S1: Time line of spring maize growth stages from 2005 to 2020 at the Jinzhou flux observation site; Table S2: A correlation matrix of environmental and biotic factors and annual evapotranspiration (ET) during 2005–2020; Table S3: A correlation matrix of environmental and biotic factors and evapotranspiration (ET) in the critical period of crop water requirement during June to July of 2005–2020; Table S4: Energy balance and distribution in the rain-fed maize ecosystem; Table S5: The correlations of seasonal precipitation (PPT) and soil volumetric water content; Figure S1: Budyko’s curve describing the relationship between the aridity index (PET/PPT) and evaporative index (ET/PPT). Dotted line A–B defines the energy-limit to potential evapotranspiration (PET), and dotted line B–C defines the water-limit of precipitation (PPT) to actual evapotranspiration (ET), df = 16; Figure S2: Inter-annual variation in precipitation (PPT) (a), soil water content (SWC) (b), vapor pressure deficit (VPD) (c), and evapotranspiration (ET), transpiration (T) and evaporation (E) (d) in the critical period of crop water requirement (June-July) during 2005–2020; Figure S3: Seasonal and annual dynamics of daily soil volumetric water content (SWC, a, blue), precipitation (PPT, a, red), evapotranspiration (ET, b) from 2005 to 2020; Figure S4: The correlation of crop residues and evaporation (E); Figure S5: Yield of maize on different sowing date.

Author Contributions

Conceptualization, T.Z.; methodology, R.J.; data curation, Q.G. and G.Z.; writing—original draft, H.Z.; writing—review and editing, H.Z., T.Z. and S.C.; funding acquisition, H.Z. and R.J. All authors have read and agreed to the published version of the manuscript.

Funding

This study was supported by the Joint Open Fund of Institute of Atmospheric Environment, China Meteorological Administration, Shenyang and Liaoning Provincial Key Laboratory of Agricultural Meteorological Disasters (No. 2023SYIAEKFMS22); the Applied and Basic Research Project of Department of Science and Technology of Liaoning Province, China (No. 2022JH2/101300193, No. 2023JH2/101300090); and the Project of the Institute of Atmospheric Environment, China Meteorological Administration, Shenyang (No. 2022SYIAEJY02).

Data Availability Statement

Data are contained within the article and Supplementary Materials.

Acknowledgments

We would like to thank workers at the Jinzhou Ecology and Agriculture Meteorological Center for collecting data and performing observations of maize development stages and growth statuses. We would also like to thank Xuefa Wen and Jing Wang from the Institute of Geographic Sciences and Natural Resources Research, Chinese Academy of Sciences, for their guidance and valuable suggestions on this study.

Conflicts of Interest

The authors declare no conflict of interest.

References

  1. Jung, M.; Reichstein, M.; Ciais, P.; Seneviratne, S.I.; Sheffield, J.; Goulden, M.L.; Bonan, G.; Cescatti, A.; Chen, J.Q.; de Jeu, R.; et al. Recent decline in the global land evapotranspiration trend due to limited moisture supply. Nature 2010, 467, 951–954. [Google Scholar] [CrossRef]
  2. Fu, Z.; Ciais, P.; Feldman, A.F.; Gentine, P.; Makowski, D.; Prentice, I.C.; Stoy, P.C.; Bastos, A.; Wigneron, J.-P. Critical soil moisture thresholds of plant water stress in terrestrial ecosystems. Sci. Adv. 2022, 8, eabq7827. [Google Scholar] [CrossRef] [PubMed]
  3. Pascolini-Campbell, M.; Reager, J.T.; Chandanpurkar, H.A.; Rodell, M. A 10 per cent increase in global land evapotranspiration from 2003 to 2019. Nature 2021, 593, 543–547. [Google Scholar] [CrossRef] [PubMed]
  4. Mekonnen, M.M.; Hoekstra, A.Y. The green, blue and grey water footprint of crops and derived crop products. Hydrol. Earth Syst. Sci. 2011, 15, 1577–1600. [Google Scholar] [CrossRef]
  5. Rockström, J.; Barron, J.; Fox, P. Water productivity in rain-fed agriculture: Challenges and opportunities for smallholder farmers in drought-prone tropical agroecosystems. Water Product. Agric. Limits Oppor. Improv. 2003, 1, 145–162. [Google Scholar] [CrossRef]
  6. Parent, A.C.; Anctil, F. Quantifying evapotranspiration of a rainfed potato crop in South-eastern Canada using eddy covariance techniques. Agric. Water Manag. 2012, 113, 45–56. [Google Scholar] [CrossRef]
  7. FAO. Faostat. Verified, 3 March 2019. 2019. Available online: http://www.fao.org/faostat/en/#data (accessed on 22 October 2023).
  8. Shen, Y.J.; Zhang, Y.C.; Scanlon, B.R.; Lei, H.M.; Yang, D.W.; Yang, F. Energy/water budgets and productivity of the typical croplands irrigated with groundwater and surface water in the North China Plain. Agric. For. Meteorol. 2013, 181, 133–142. [Google Scholar] [CrossRef]
  9. Ojara, M.A.; Lou, Y.S.; Ongoma, V.; Mumo, L.; Akodi, D.; Ayugi, B.; Ogwang, B.A. Projected changes in East African climate and its impacts on climatic suitability of maize production areas by the mid-twenty-first century. Environ. Monit. Assess. 2021, 193, 831. [Google Scholar] [CrossRef]
  10. Gao, X.; Mei, X.R.; Gu, F.X.; Hao, W.P.; Gong, D.Z.; Li, H.R. Evapotranspiration partitioning and energy budget in a rainfed spring maize field on the Loess Plateau, China. Catena 2018, 166, 249–259. [Google Scholar] [CrossRef]
  11. de Oliveira, G.; Brunsell, N.A.; Sutherlin, C.E.; Crews, T.E.; DeHaan, L.R. Energy, water and carbon exchange over a perennial Kernza wheatgrass crop. Agric. For. Meteorol. 2018, 249, 120–137. [Google Scholar] [CrossRef]
  12. Nazari, M.; Sadeghi, S.M.M.; Van Stan, J.T.; Chaichi, M.R. Rainfall interception and redistribution by maize farmland in central Iran. J. Hydrol. Reg. Stud. 2020, 27, 100656. [Google Scholar] [CrossRef]
  13. Wang, X.W.; Huo, Z.L.; Shukla, M.K.; Wang, X.H.; Guo, P.; Xu, X.; Huang, G.H. Energy fluxes and evapotranspiration over irrigated maize field in an arid area with shallow groundwater. Agric. Water Manag. 2020, 228, 105922. [Google Scholar] [CrossRef]
  14. Yue, P.; Zhang, Q.; Ren, X.; Yang, Z.; Li, H.; Yang, Y. Environmental and biophysical effects of evapotranspiration in semiarid grassland and maize cropland ecosystems over the summer monsoon transition zone of China. Agric. Water Manag. 2022, 264, 107462. [Google Scholar] [CrossRef]
  15. Condon, L.E.; Atchley, A.L.; Maxwell, R.M. Evapotranspiration depletes groundwater under warming over the contiguous United States. Nat. Commun. 2020, 11, 873. [Google Scholar] [CrossRef] [PubMed]
  16. Pan, R. Plant Physiology; Higher Education Press: Beijing, China, 2012. [Google Scholar]
  17. Zhou, Y.C.; Cheng, X.L.; Fan, J.W.; Harris, W. Patterns and controls of foliar nitrogen isotope composition on the Qinghai-Tibet Plateau, China. Plant Soil 2016, 406, 265–276. [Google Scholar] [CrossRef]
  18. Fu, Z.; Ciais, P.; Makowski, D.; Bastos, A.; Stoy, P.C.; Ibrom, A.; Knohl, A.; Migliavacca, M.; Cuntz, M.; Šigut, L.; et al. Uncovering the critical soil moisture thresholds of plant water stress for European ecosystems. Glob. Chang. Biol. 2022, 28, 2111–2123. [Google Scholar] [CrossRef]
  19. Grossiord, C.; Buckley, T.N.; Cernusak, L.A.; Novick, K.A.; Poulter, B.; Siegwolf, R.T.W.; Sperry, J.S.; McDowell, N.G. Plant responses to rising vapor pressure deficit. N. Phytol. 2020, 226, 1550–1566. [Google Scholar] [CrossRef]
  20. Lin, M.; Sadeghi, S.M.M.; Van Stan, J.T. Partitioning of Rainfall and Sprinkler-Irrigation by Crop Canopies: A Global Review and Evaluation of Available Research. Hydrology 2020, 7, 76. Available online: https://www.mdpi.com/2306-5338/7/4/76 (accessed on 22 October 2023). [CrossRef]
  21. Wu, C.; Wang, J.; Ciais, P.; Peñuelas, J.; Zhang, X.; Sonnentag, O.; Tian, F.; Wang, X.; Wang, H.; Liu, R.; et al. Widespread decline in winds delayed autumn foliar senescence over high latitudes. Proc. Natl. Acad. Sci. USA 2021, 118, e2015821118. [Google Scholar] [CrossRef]
  22. Pan, S.; Pan, N.; Tian, H.; Friedlingstein, P.; Sitch, S.; Shi, H.; Arora, V.K.; Haverd, V.; Jain, A.K.; Kato, E.; et al. Evaluation of global terrestrial evapotranspiration using state-of-the-art approaches in remote sensing, machine learning and land surface modeling. Hydrol. Earth Syst. Sci. 2020, 24, 1485–1509. [Google Scholar] [CrossRef]
  23. Lemordant, L.; Gentine, P.; Swann, A.S.; Cook, B.I.; Scheff, J. Critical impact of vegetation physiology on the continental hydrologic cycle in response to increasing CO2. Proc. Natl. Acad. Sci. USA 2018, 115, 4093–4098. [Google Scholar] [CrossRef] [PubMed]
  24. Zeng, Z.; Piao, S.; Li, L.Z.X.; Wang, T.; Ciais, P.; Lian, X.; Yang, Y.; Mao, J.; Shi, X.; Myneni, R.B. Impact of earth greening on the terrestrial water cycle. J. Clim. 2018, 31, 2633–2650. [Google Scholar] [CrossRef]
  25. Yu, G.; Wang, Q. Ecophysiology of Plant Photosynthesis, Transpiration, and Water Use; Science Press: Beijing, China, 2010. [Google Scholar]
  26. Zhang, H.; Gao, Q.; Chang, S.; Jin, C.; Liang, W.; Cai, F. Interannual variability in carbon exchange in a rain-fed maize in Northeast China and its influencing factors. J. Appl. Meteorol. Sci. 2023, 34, 246–256. [Google Scholar] [CrossRef]
  27. Zhang, Y. Responses and Adapatation of Crop Production to Climate Change in Northeast China; Liaoning Science and Technology Publishing: Shenyang, China, 2016. [Google Scholar]
  28. Chu, Z.; Guo, J.; Zhao, J. Impacts of projected climate change on agricultural climate resources in Northeast China. Acta Geogr. Sin. 2017, 72, 1248–1260. [Google Scholar] [CrossRef]
  29. Shuttleworth, W.J.; Wallace, J.S. Evaporation from sparse crops-an energy combination theory. Q. J. R. Meteorol. Soc. 1985, 111, 839–855. [Google Scholar] [CrossRef]
  30. Hu, Z.; Yu, G.; Zhou, Y.; Sun, X.; Li, Y.; Shi, P.; Wang, Y.; Song, X.; Zheng, Z.; Zhang, L.; et al. Partitioning of evapotranspiration and its controls in four grassland ecosystems: Application of a two-source model. Agric. For. Meteorol. 2009, 149, 1410–1420. [Google Scholar] [CrossRef]
  31. Cai, F.; Zhang, Y.; Mi, N.; Ming, H.; Zhang, S.; Zhang, H.; Zhao, X. Maize (Zea mays L.) physiological responses to drought and rewatering, and the associations with water stress degree. Agric. Water Manag. 2020, 241, 106379. [Google Scholar] [CrossRef]
  32. Mi, N.; Cai, F.; Zhang, Y.; Ji, R.; Zhang, S. Differential responses of maize yield to drought at vegetative and reproductive stages. Plant Soil Environ. 2018, 64, 260–267. [Google Scholar] [CrossRef]
  33. Cai, F.; Zhang, Y.; Ming, H.; Mi, N.; Zhang, S.; Zhang, H.; Xie, Y.; Zhao, X. Comparison of the roles of optimizing root distribution and the water uptake function in simulating water and heat fluxes within a maize agroecosystem. Water 2018, 10, 1090. [Google Scholar] [CrossRef]
  34. Zhou, L.; Wang, Y.; Jia, Q.; Li, R.; Zhou, M.; Zhou, G. Evapotranspiration over a rainfed maize field in northeast China: How are relationships between the environment and terrestrial evapotranspiration mediated by leaf area? Agric. Water Manag. 2019, 221, 538–546. [Google Scholar] [CrossRef]
  35. Ji, R. Handbook of Meteorological Services for Food Crops in Liaoning Provinece; Liaoning Science and Techinology Publishing House: Shenyang, China, 2022. [Google Scholar]
  36. Zhang, H.; Wen, X. Flux footprint climatology estimated by three analytical models over a subtropical soniferous plantation in Southeast China. J. Meteorol. Res. 2015, 29, 654–666. [Google Scholar] [CrossRef]
  37. Zhang, H.; Zhao, T.; Lyu, S.; Wu, H.; Yang, Y.; Wen, X. Interannual variability in net ecosystem carbon production in a rain-fed maize ecosystem and its climatic and biotic controls during 2005–2018. PLoS ONE 2021, 16, e0237684. [Google Scholar] [CrossRef] [PubMed]
  38. Pastorello, G.; Trotta, C.; Canfora, E.; Chu, H.; Christianson, D.; Cheah, Y.-W.; Poindexter, C.; Chen, J.; Elbashandy, A.; Humphrey, M.; et al. The FLUXNET2015 dataset and the ONEFlux processing pipeline for eddy covariance data. Sci. Data 2020, 7, 225. [Google Scholar] [CrossRef] [PubMed]
  39. Code for Agrometeorological Observation; Meteorology Press China Meteorological Administration: Beijing, China, 1993.
  40. Hu, Z.; Wu, G.; Zhang, L.; Li, S.; Zhu, X.; Zheng, H.; Zhang, L.; Sun, X.; Yu, G. Modeling and partitioning of pegional pvapotranspiration using a satellite-driven water-carbon coupling model. Remote Sens. 2017, 9, 54. [Google Scholar] [CrossRef]
  41. Hu, Z.; Li, S.; Yu, G.; Sun, X.; Zhang, L.; Han, S.; Li, Y. Modeling evapotranspiration by combing a two-source model, a leaf stomatal model, and a light-use efficiency model. J. Hydrol. 2013, 501, 186–192. [Google Scholar] [CrossRef]
  42. Euskirchen, E.S.; Edgar, C.W.; Bret-Harte, M.S.; Kade, A.; Zimov, N.; Zimov, S. Interannual and seasonal patterns of carbon dioxide, water, and energy fluxes from ecotonal and thermokarst-impacted ecosystems on carbon-rich permafrost soils in Northeastern Siberia. J. Geophys. Res. Biogeosci. 2017, 122, 2651–2668. [Google Scholar] [CrossRef]
  43. Babel, W.; Lüers, J.; Hübner, J.; Rebmann, C.; Wichura, B.; Thomas, C.K.; Serafimovich, A.; Foken, T. Long-Term Carbon and Water Vapour Fluxes; Springer International Publishing: Berlin/Heidelberg, Germany, 2017. [Google Scholar]
  44. Budyko, M.I. Climate and Life; Academic Press: Cambridge, MA, USA, 1974. [Google Scholar]
  45. Donohue, R.J.; Roderick, M.L.; McVicar, T.R. On the importance of including vegetation dynamics in Budyko’s hydrological model. Hydrol. Earth Syst. Sci. 2007, 11, 983–995. [Google Scholar] [CrossRef]
  46. Liu, Y.; Qiu, G.; Zhang, H.; Yang, Y.; Zhang, Y.; Wang, Q.; Zhao, W.; Jia, L.; Ji, X.; Xiong, Y.; et al. Shifting from homogeneous to heterogeneous surfaces in estimating terrestrial evapotranspiration: Review and perspectives. Sci. China Earth Sci. 2022, 65, 197–214. [Google Scholar] [CrossRef]
  47. Yuan, W.P.; Zheng, Y.; Piao, S.L.; Ciais, P.; Lombardozzi, D.; Wang, Y.P.; Ryu, Y.; Chen, G.X.; Dong, W.J.; Hu, Z.M.; et al. Increased atmospheric vapor pressure deficit reduces global vegetation growth. Sci. Adv. 2019, 5, 12. [Google Scholar] [CrossRef]
  48. Aubinet, M.; Vesala, T.; Papale, D. Eddy Covariance—A Practical Guide to Measurement and Data Analysis; Springer: Berlin/Heidelberg, Germany, 2012. [Google Scholar]
  49. Mauder, M.; Foken, T.; Cuxart, J. Surface-energy-balance closure over Land: A review. Bound. Layer Meteorol. 2020, 177, 395–426. [Google Scholar] [CrossRef]
  50. Burba, G. Eddy Covariance Method-for Scientific, Regulatory, and Commercial Applications; LI-COR Biosciences: Lincoln, NE, USA, 2022. [Google Scholar]
  51. Novick, K.A.; Ficklin, D.L.; Stoy, P.C.; Williams, C.A.; Bohrer, G.; Oishi, A.C.; Papuga, S.A.; Blanken, P.D.; Noormets, A.; Sulman, B.N.; et al. The increasing importance of atmospheric demand for ecosystem water and carbon fluxes. Nat. Clim. Chang. 2016, 6, 1023–1027. [Google Scholar] [CrossRef]
  52. Liu, L.; Gudmundsson, L.; Hauser, M.; Qin, D.; Li, S.; Seneviratne, S.I. Soil moisture dominates dryness stress on ecosystem production globally. Nat. Commun. 2020, 11, 4892. [Google Scholar] [CrossRef] [PubMed]
  53. Li, H.Q.; Wang, C.Y.; Zhang, F.W.; He, Y.T.; Shi, P.L.; Guo, X.W.; Wang, J.B.; Zhang, L.M.; Li, Y.N.; Cao, G.M.; et al. Atmospheric water vapor and soil moisture jointly determine the spatiotemporal variations of CO2 fluxes and evapotranspiration across the Qinghai-Tibetan Plateau grasslands. Sci. Total Environ. 2021, 791, 148379. [Google Scholar] [CrossRef] [PubMed]
  54. Chen, W.; Liu, S.; Zhao, S.; Zhu, Y.; Feng, S.; Wang, Z.; Wu, Y.; Xiao, J.; Yuan, W.; Yan, W.; et al. Temporal dynamics of ecosystem, inherent, and underlying water use efficiencies of forests, grasslands, and croplands and their responses to climate change. Carbon Balanc. Manag. 2023, 18, 13. [Google Scholar] [CrossRef]
  55. Konings, A.G.; Williams, A.P.; Gentine, P. Sensitivity of grassland productivity to aridity controlled by stomatal and xylem regulation. Nat. Geosci. 2017, 10, 284–288. [Google Scholar] [CrossRef]
  56. Guo, Q.; Hu, Z.; Li, S.; Li, X.; Sun, X.; Yu, G. Spatial variations in aboveground net primary productivity along a climate gradient in Eurasian temperate grassland: Effects of mean annual precipitation and its seasonal distribution. Glob. Chang. Biol. 2012, 18, 3624–3631. [Google Scholar] [CrossRef]
  57. Dennis, B.D.; Christoph, V.A.; Brad, H. Seasonal variation of energy and water vapor exchange rates above and below a boreal jack pine forest canopy. Agric. For. Meteorol. 1997, 102, 28939–28951. [Google Scholar] [CrossRef]
  58. Yue, P.; Zhang, Q.; Zhang, L.; Li, H.Y.; Yang, Y.; Zeng, J.; Wang, S. Long-term variations in energy partitioning and evapotranspiration in a semiarid grassland in the Loess Plateau of China. Agric. For. Meteorol. 2019, 278, 107671. [Google Scholar] [CrossRef]
  59. Keenan, T.F.; Hollinger, D.Y.; Bohrer, G.; Dragoni, D.; Munger, J.W.; Schmid, H.P.; Richardson, A.D. Increase in forest water-use efficiency as atmospheric carbon dioxide concentrations rise. Nature 2013, 499, 324–327. [Google Scholar] [CrossRef]
  60. Still, C.J. 3 Trading water for carbon. Nat. Geosci. 2018, 11, 702–703. [Google Scholar] [CrossRef]
  61. Griebel, A.; Bennett, L.T.; Metzen, D.; Pendall, E.; Lane, P.N.J.; Arndt, S.K. Trading water for carbon: Maintaining photosynthesis at the cost of increased water loss during high temperatures in a temperate forest. J. Geophys. Res. Biogeosci. 2020, 125, e2019JG005239. [Google Scholar] [CrossRef]
  62. Wang, J.; Wen, X.; Zhang, X.; Li, S. The strategies of water–carbon regulation of plants in a subtropical primary forest on karst soils in China. Biogeosciences 2018, 15, 4193–4203. [Google Scholar] [CrossRef]
  63. Farquhar, G.D.; Caemmerer, S.V.; Berry, J.A. A biochemical-model of photosynthetic CO2 assimilation in leaves of C-3 species. Planta 1980, 149, 78–90. [Google Scholar] [CrossRef] [PubMed]
Figure 1. Inter-annual variation in annual net radiation (Rn) above the canopy (a); soil heat flux (G), and net radiation (Rns) above the soil surface (b); and sensible heat flux (H) (c), latent heat flux (LE) and Bowen ratio (β) (d) during 2005–2020 in the study area and at a nearby national weather station.
Agronomy 13 02941 g001
Figure 2. Inter-annual variation in annual downward shortwave (DR) and photosynthetically active radiation (PAR) (a); upward shortwave radiation (UR) and albedo (Albedo) (b); and downward (DLR) (c) and upward longwave radiation (ULR) and air temperature (Ta) above the canopy (d) during 2005–2020 at the study site and at a nearby national weather station.
Agronomy 13 02941 g002
Figure 3. Inter-annual variation in annual precipitation (PPT) (a); soil water content (SWC) obtained from a datalogger (b) and with sampling, vapor pressure deficit (VPD) (c); and evapotranspiration (ET), transpiration (T), and evaporation (E) (d) during 2005–2020.
Agronomy 13 02941 g003
Figure 4. Structural equation modeling results of the relationships among environmental factors with annual evapotranspiration (ET) and its components for years 2005–2020 (χ2 = 18.002, p = 0.389, df = 16). E, evaporation; T, transpiration; Rns, net soil radiation; SWC, soil water content; VPD, vapor pressure deficit; Ta, air temperature; PPT, annual precipitation. Black arrows indicate significant positive relationships, while gray arrows indicate significant negative relationships. ***, p < 0.001; **, p < 0.01.
Agronomy 13 02941 g004
Figure 5. Annual carbon dioxide (CO2) (a), leaf area index (LAI) (b), canopy stomatal conductance (gsc) (c), and soil conductance (gss) (d) for years 2005–2020.
Agronomy 13 02941 g005
Figure 6. Structural equation modeling results of the relationships among environmental and biotic factors with annual evapotranspiration (ET) and its components for years 2005–2020 (χ2 = 33.529, p = 0.393 df = 16). E, evaporation; T, transpiration; gsc, canopy stomatal conductance; Rns, net soil radiation; SWC, soil water content; VPD, vapor pressure deficit; Ta, air temperature; PPT, annual precipitation; CO2, CO2 concentration; LAI, leaf area index; gsc, canopy stomatal conductance; gss, soil surface conductance. Black arrows indicate significant positive relationships, while gray arrows indicate significant negative relationships. ***, p < 0.001; **, p < 0.01.
Agronomy 13 02941 g006
Disclaimer/Publisher’s Note: The statements, opinions and data contained in all publications are solely those of the individual author(s) and contributor(s) and not of MDPI and/or the editor(s). MDPI and/or the editor(s) disclaim responsibility for any injury to people or property resulting from any ideas, methods, instructions or products referred to in the content.

