Article

Effect of Legumes Intercropped with Maize on Biomass Yield and Subsequent Biogas Production

1
Agricultural Research, Ltd., Zahradní 1, 664 41 Troubsko, Czech Republic
2
Department of Agricultural, Food and Environmental Engineering, Faculty of AgriSciences, Mendel University in Brno, Zemědělská 1, 613 00 Brno, Czech Republic
3
Department of Experimental Biology, Section of Microbiology, Faculty of Science, Masaryk University, Kamenice 753/5, 625 00 Brno, Czech Republic
4
Department of Agrochemistry, Soil Science, Microbiology and Plant Nutrition, Mendel University in Brno, Zemědělská 1, 613 00 Brno, Czech Republic
5
Department of Agrosystems and Bioclimatology, Faculty of AgriSciences, Mendel University in Brno, Zemědělská 1, 613 00 Brno, Czech Republic
*
Authors to whom correspondence should be addressed.
Agronomy 2023, 13(11), 2775; https://doi.org/10.3390/agronomy13112775
Submission received: 8 October 2023 / Revised: 31 October 2023 / Accepted: 3 November 2023 / Published: 7 November 2023
(This article belongs to the Special Issue Agricultural Biomass for Bioenergy and Bioproducts)

Abstract

:
The presented study deals with the use of legumes intercropped with maize for the production of biogas from silage. The main goal was to find out whether silages made from mixed cultures can be used in biogas production and how the use of such silages affects qualitative and quantitative parameters of the fermentation process compared with the pure maize silage. Variants prepared were pure cultures of maize, bean, lupin, and white sweet clover. In addition, mixed cultures were prepared of maize and individual legumes. Measured values showed that in terms of dry matter (DM) yield, mixed culture silages are almost of the same or even better quality than silage made from the maize monosubstrate. Compared with the maize monoculture silage, the presence of white lupine, white sweet clover, and broad bean in silages statistically significantly increased the content of DM, ash, and acid detergent fiber (by more than 5%). Bean and lupine in mixed silages with maize significantly increased the content of lipids (on average by more than 1.2%). Legumes in silages were significantly decreasing contents of neutral detergent fiber, crude protein, and starch. Production of biogas from silages of maize monosubstrates and mixed substrates of maize with white lupin, maize with white sweet clover, and maize with broad bean was directly proportional to the content of CAR and starch in these substrates. A perspective variant was the mixed substrate of maize and sweet clover from which biogas production was only 6% lower than that from conventional maize silage. The highest yield was recorded in the maize monosubstrate (0.923 m3/kgVS). Variants of mixed substrates had a yield ranging from 0.804 to 0.840 m3/kgVS.

1. Introduction

Silage made of maize (Zea mays L.) is currently considered to be the most effective material to gain biogas (a mixture of CH4 and CO2) from plant biomass [1]. The fact was also confirmed by Herrmann [2], but Czubaszek et al. [3] mentioned some reservations concerning the negative impact of growing maize on the environment. According to Solinas et al. [4], the production of biomass in order to strengthen energy security makes use of a limited resource (soil), which can be alternatively used to produce food, and this is why using soil for this purpose can be risky for the security of food in the long term. Stinner et al. [5] inform that exactly the production of biogas offers new opportunities for using legumes and hence for their incorporation into the rotation of crops as quality limitations for biogas production are not so high as in their other use. The need for incorporating crops from the family of Fabaceae into crop rotations in order to improve soil fertility and sustainability of agricultural systems is often neglected but the beneficial influence of legumes in the rotation of crops is generally acknowledged [6,7,8,9].
One of the possibilities for effective utilization of legumes is their incorporation into the system of a mixed culture. A mixed culture is understood as growing two different crops on the same field, during the vegetation period. Legume and non-legume mixtures are most often used and most often representatives of Fabaceae and Poaceae families. The definition dwells on the system of growing a mixed culture referred to as “Three sisters”. This system was a basic system of growing food crops used by the original inhabitants of North America, e.g., by the Cherokee people [10]. Mixed culturing is an ancient practice that has remained a dominant agricultural system in many parts of the world [6]. Ofori and Stern [7] claim that a mixed culture of maize and legumes is one of the most frequent and most effective combinations in the exploitation of natural resources. Compared to systems without legumes, the system of a mixed culture with maize and legumes represents an alternative suitable for saving nitrogen, achieving higher productivity per unit time and area [11,12]. Mineral N-fertilizers are saved thanks to the ability of legumes to fix atmospheric nitrogen (N2), which is generally considered a proof that a mixed culture with legumes directly affects increased production of above-ground biomass as compared with monocultures [13,14].
Mixed cultures are further tested in order to enhance sustainable production of biomass on marginal soils in combination with S. hermaphrodita and legumes such as T. pratense and T. repens [15]. Stoltz et al. [16] evaluated mixed cultures from the viewpoint of the source of proteins in the feed, investigating the combination of maize (Zea mays L.) and broad bean (Vicia faba L.). This combination was assessed also by Rezaei-Chianeh et al. [17]. The use of bean and other legumes is also supported with the fact that current modern varieties are highly resistant to diseases [18]. Wahid et al. [1] warn that a higher representation of N-substances in the silage may inhibit the process of fermentation. On the other hand, Hutňan et al. [19] claim that the AD process in the fermenter with only conventional silage is unstable due to the low content of nitrogen, and recommend to add a substrate with a higher N-content for its stabilization, in other words, legumes. These processes are discussed by Mata-Alvarez et al. [20]—using AcoD (anaerobic co-digestion), which is based on the co-fermentation of a mixture of two or more substrates with complementary properties, allowing to increase the production of biogas and to stabilize the process of its generation. Another limiting factor could be substances contained in the biomass of used legumes, which might affect the process of methanogenesis, e.g., coumarin in Melilotus albus MED [21,22]. However, Kintl et al. [23] inform that representation of sweet clover up to 20% in the maize silage increased the production of both biogas and methane in anaerobic co-digestion (AcoD). Nevertheless, the choice of the mixture of substrates leading to a stable AcoD process with a high production of biogas is not simple as it requires experience and technical knowledge about the process.
As long as the system of a mixed culture leads to the more efficient exploitation of natural resources, soil in particular, the global call for sustainable use of the soil in the 21st century will be fulfilled [24]. The authors further claim that rational soil management has to include a system of crop rotation based on legumes with the aim of restoring soil quality and health, and with the emphasis on the sustainability of the agricultural system.
A novel contribution of this study as compared to other similar research works is the verification of the applicability of less common alternative legume species in the mixed cultures with maize grown for the production of biogas both in the area of sustainable management of agricultural soils in order to minimize impacts of growing maize on the soil quality and prevention of potential soil erosion, and in the research focusing on the effect of legumes in silage produced from the mixed culture on the qualitative and quantitative parameters of biogas production.
Goals of the study were as follows: (a) How the quality of produced biogas will be affected by silages made from the mixed culture? (b) What is the production of biogas from silages of mixed cultures as compared with the pure maize silage? (c) Was the silage composition affected by the biomass of legumes therein? The zero hypothesis H0 was as follows: the biomass grown using the technology of a mixed culture (maize and legume) can yield more biogas per unit area than the biomass of pure maize.

2. Materials and Methods

2.1. Information about the Location of the Field Experiment

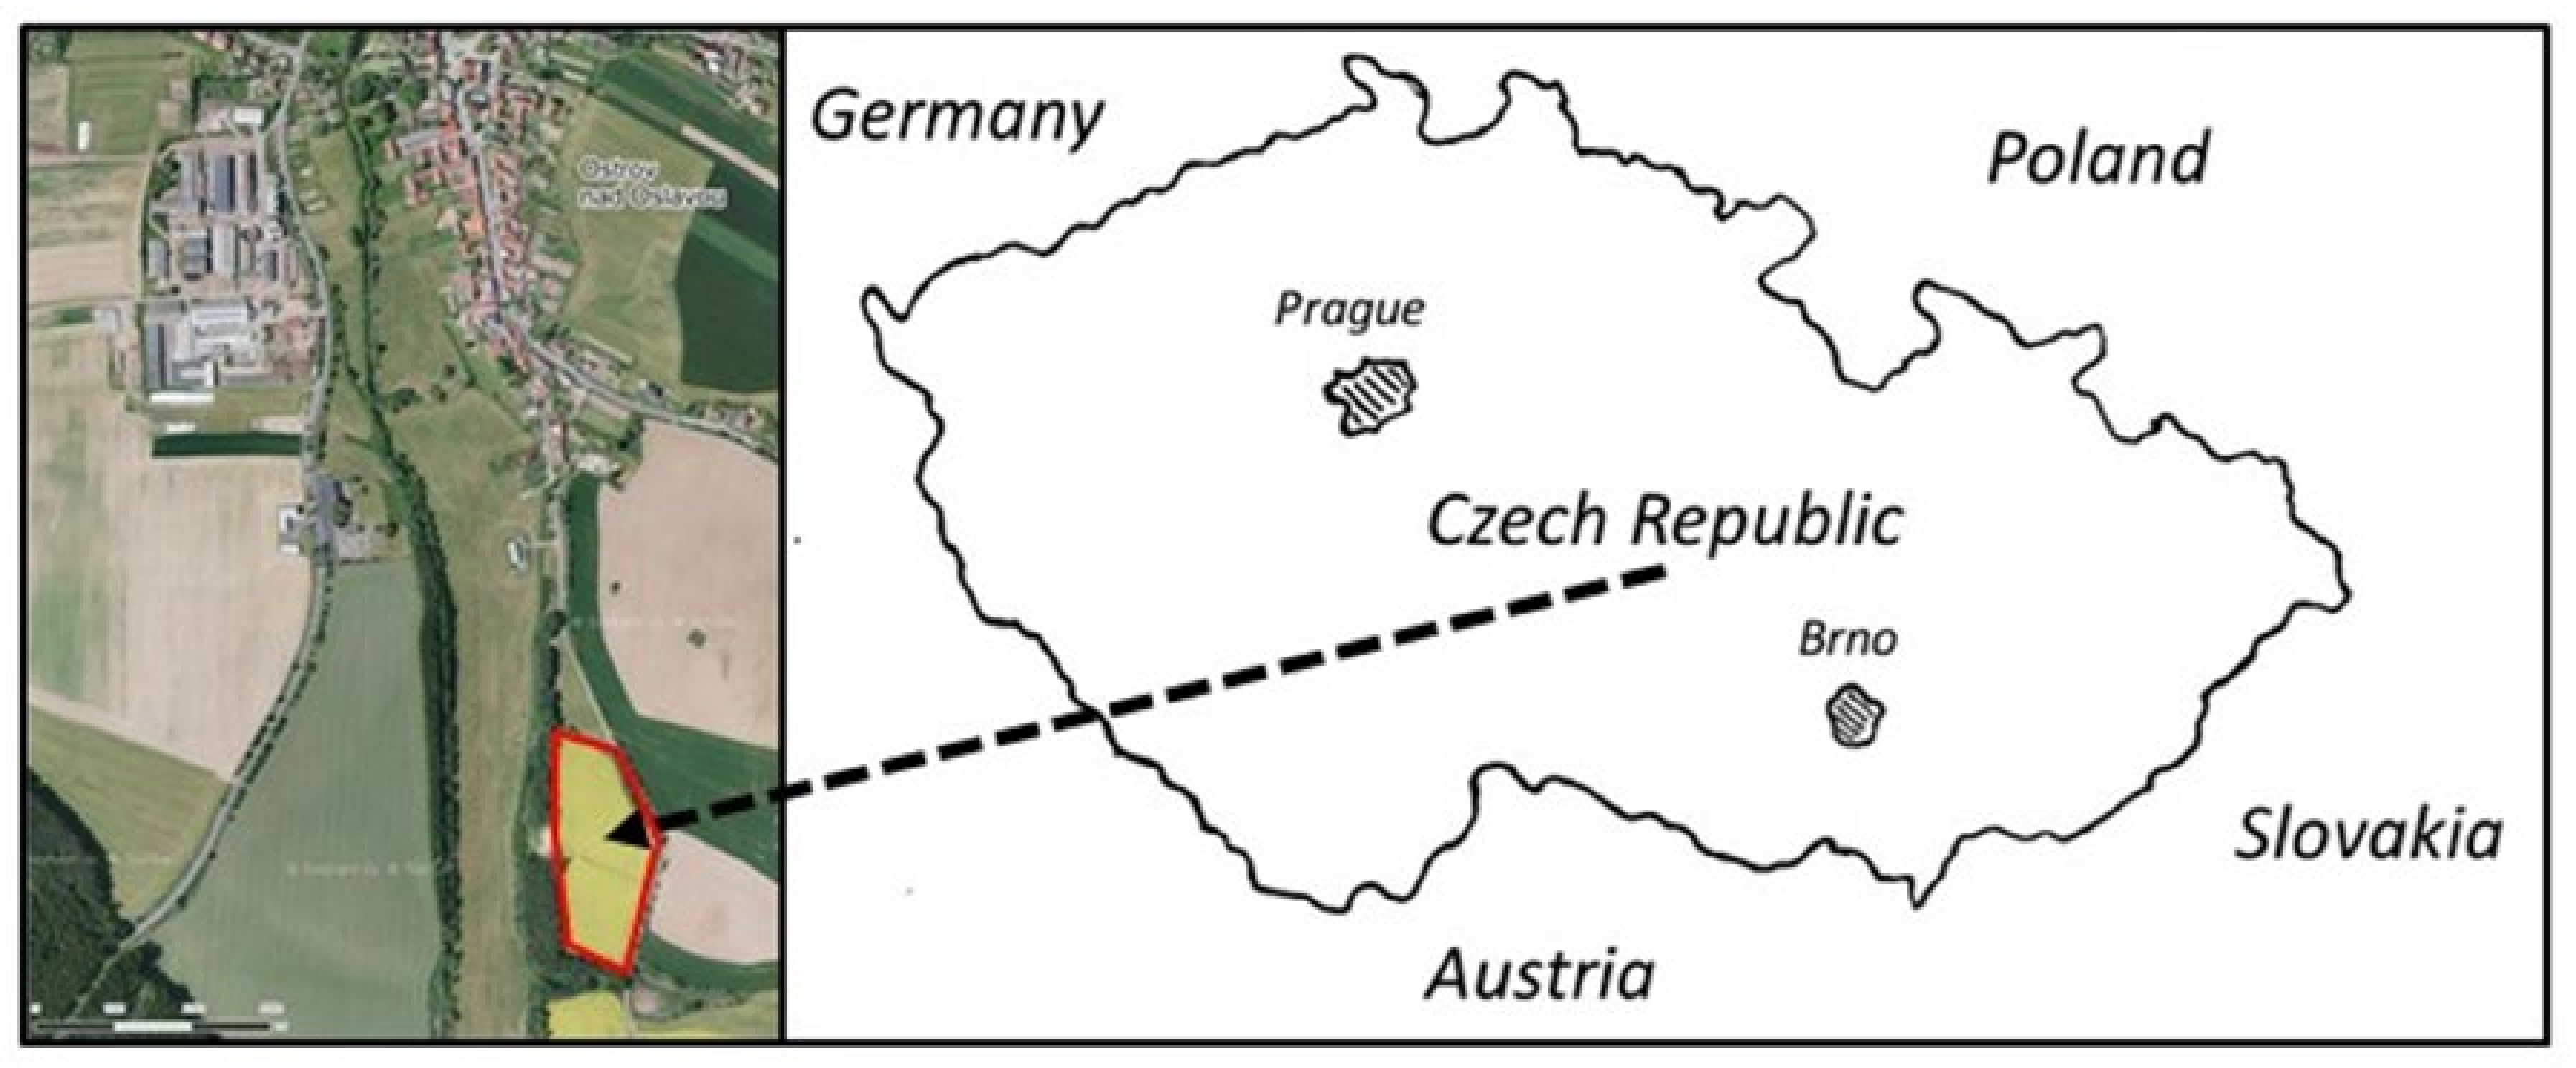
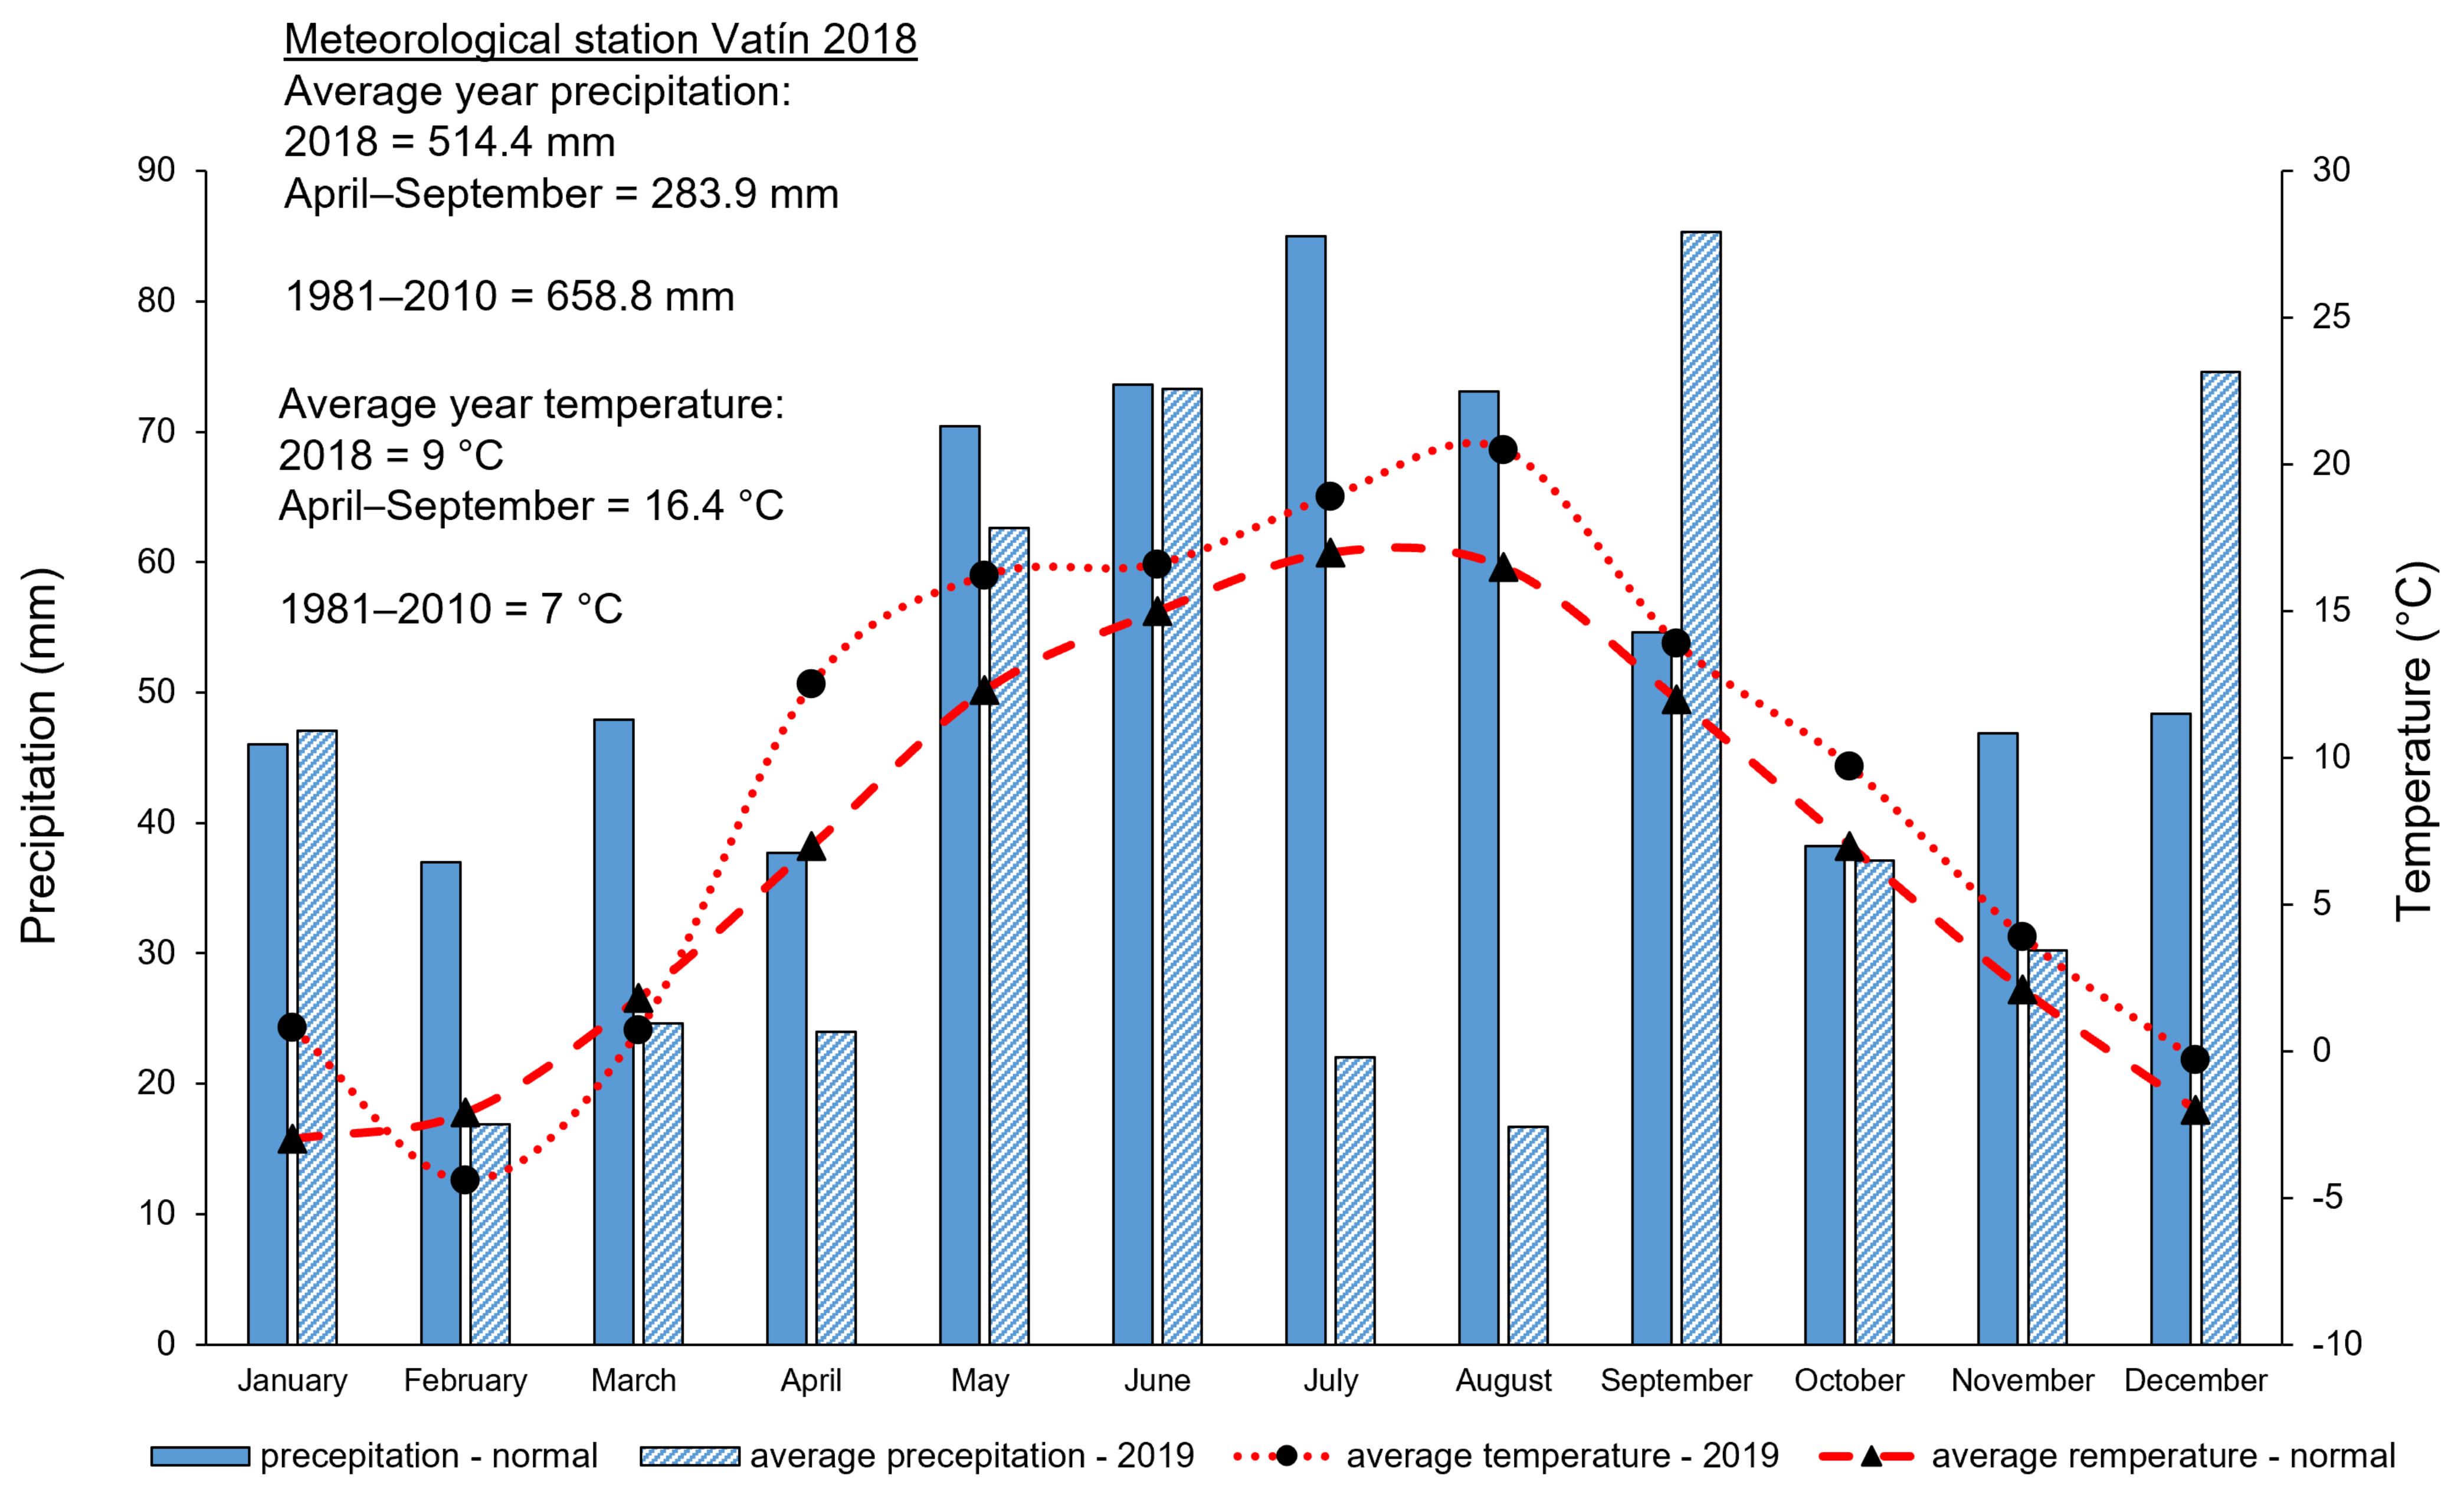
Biogas was produced from plant biomass grown at the Experimental Station for Fodder Crops in Vatín (precise location: 49°28′42.2″ N 15°59′32.8″ E) during the growing season in 2018. The experimental plot was situated approximately 10 km from Žďár nad Sázavou in the Czech Republic, in the mild warm region of Bohemian-Moravian Highland (Českomoravská vysočina) (Figure 1). A detailed climatic characteristic is presented in the climadiagram (Figure 2). Crops (sole crop or mixed culture) were grown on the same soil type: cambisol sandy loam occurring on the deluvium of biotic orthogneiss. A description of the basic parameters of arable soil from the experimental field is shown in Table 1, which shows values of the contents of plant available nutrients in the topsoil layer (0–0.25 m) and soil reaction. The average content of nutrients was found in K, Ca, and Mg. On the other hand, in case of P available to plants, the measured values were slightly lower. The soil reaction was mildly acidic. Soil parameters and their potential influence on the cultivation of crops were evaluated according to Elbl et al. [25].
Prior to the sowing, a whole-area DASA fertilizer was applied (300 kg/ha) in all variants and worked into the soil. The DASA fertilizer (AGRO CS Ltd., Říkov, Czech Republic) contains 26% N (1/3 nitrate form, 2/3 ammonium form) and 13% S (ammonium sulfate).

2.2. Growing Plant Biomass for the Purpose of Silage Preparation—Selection of a Suitable Method

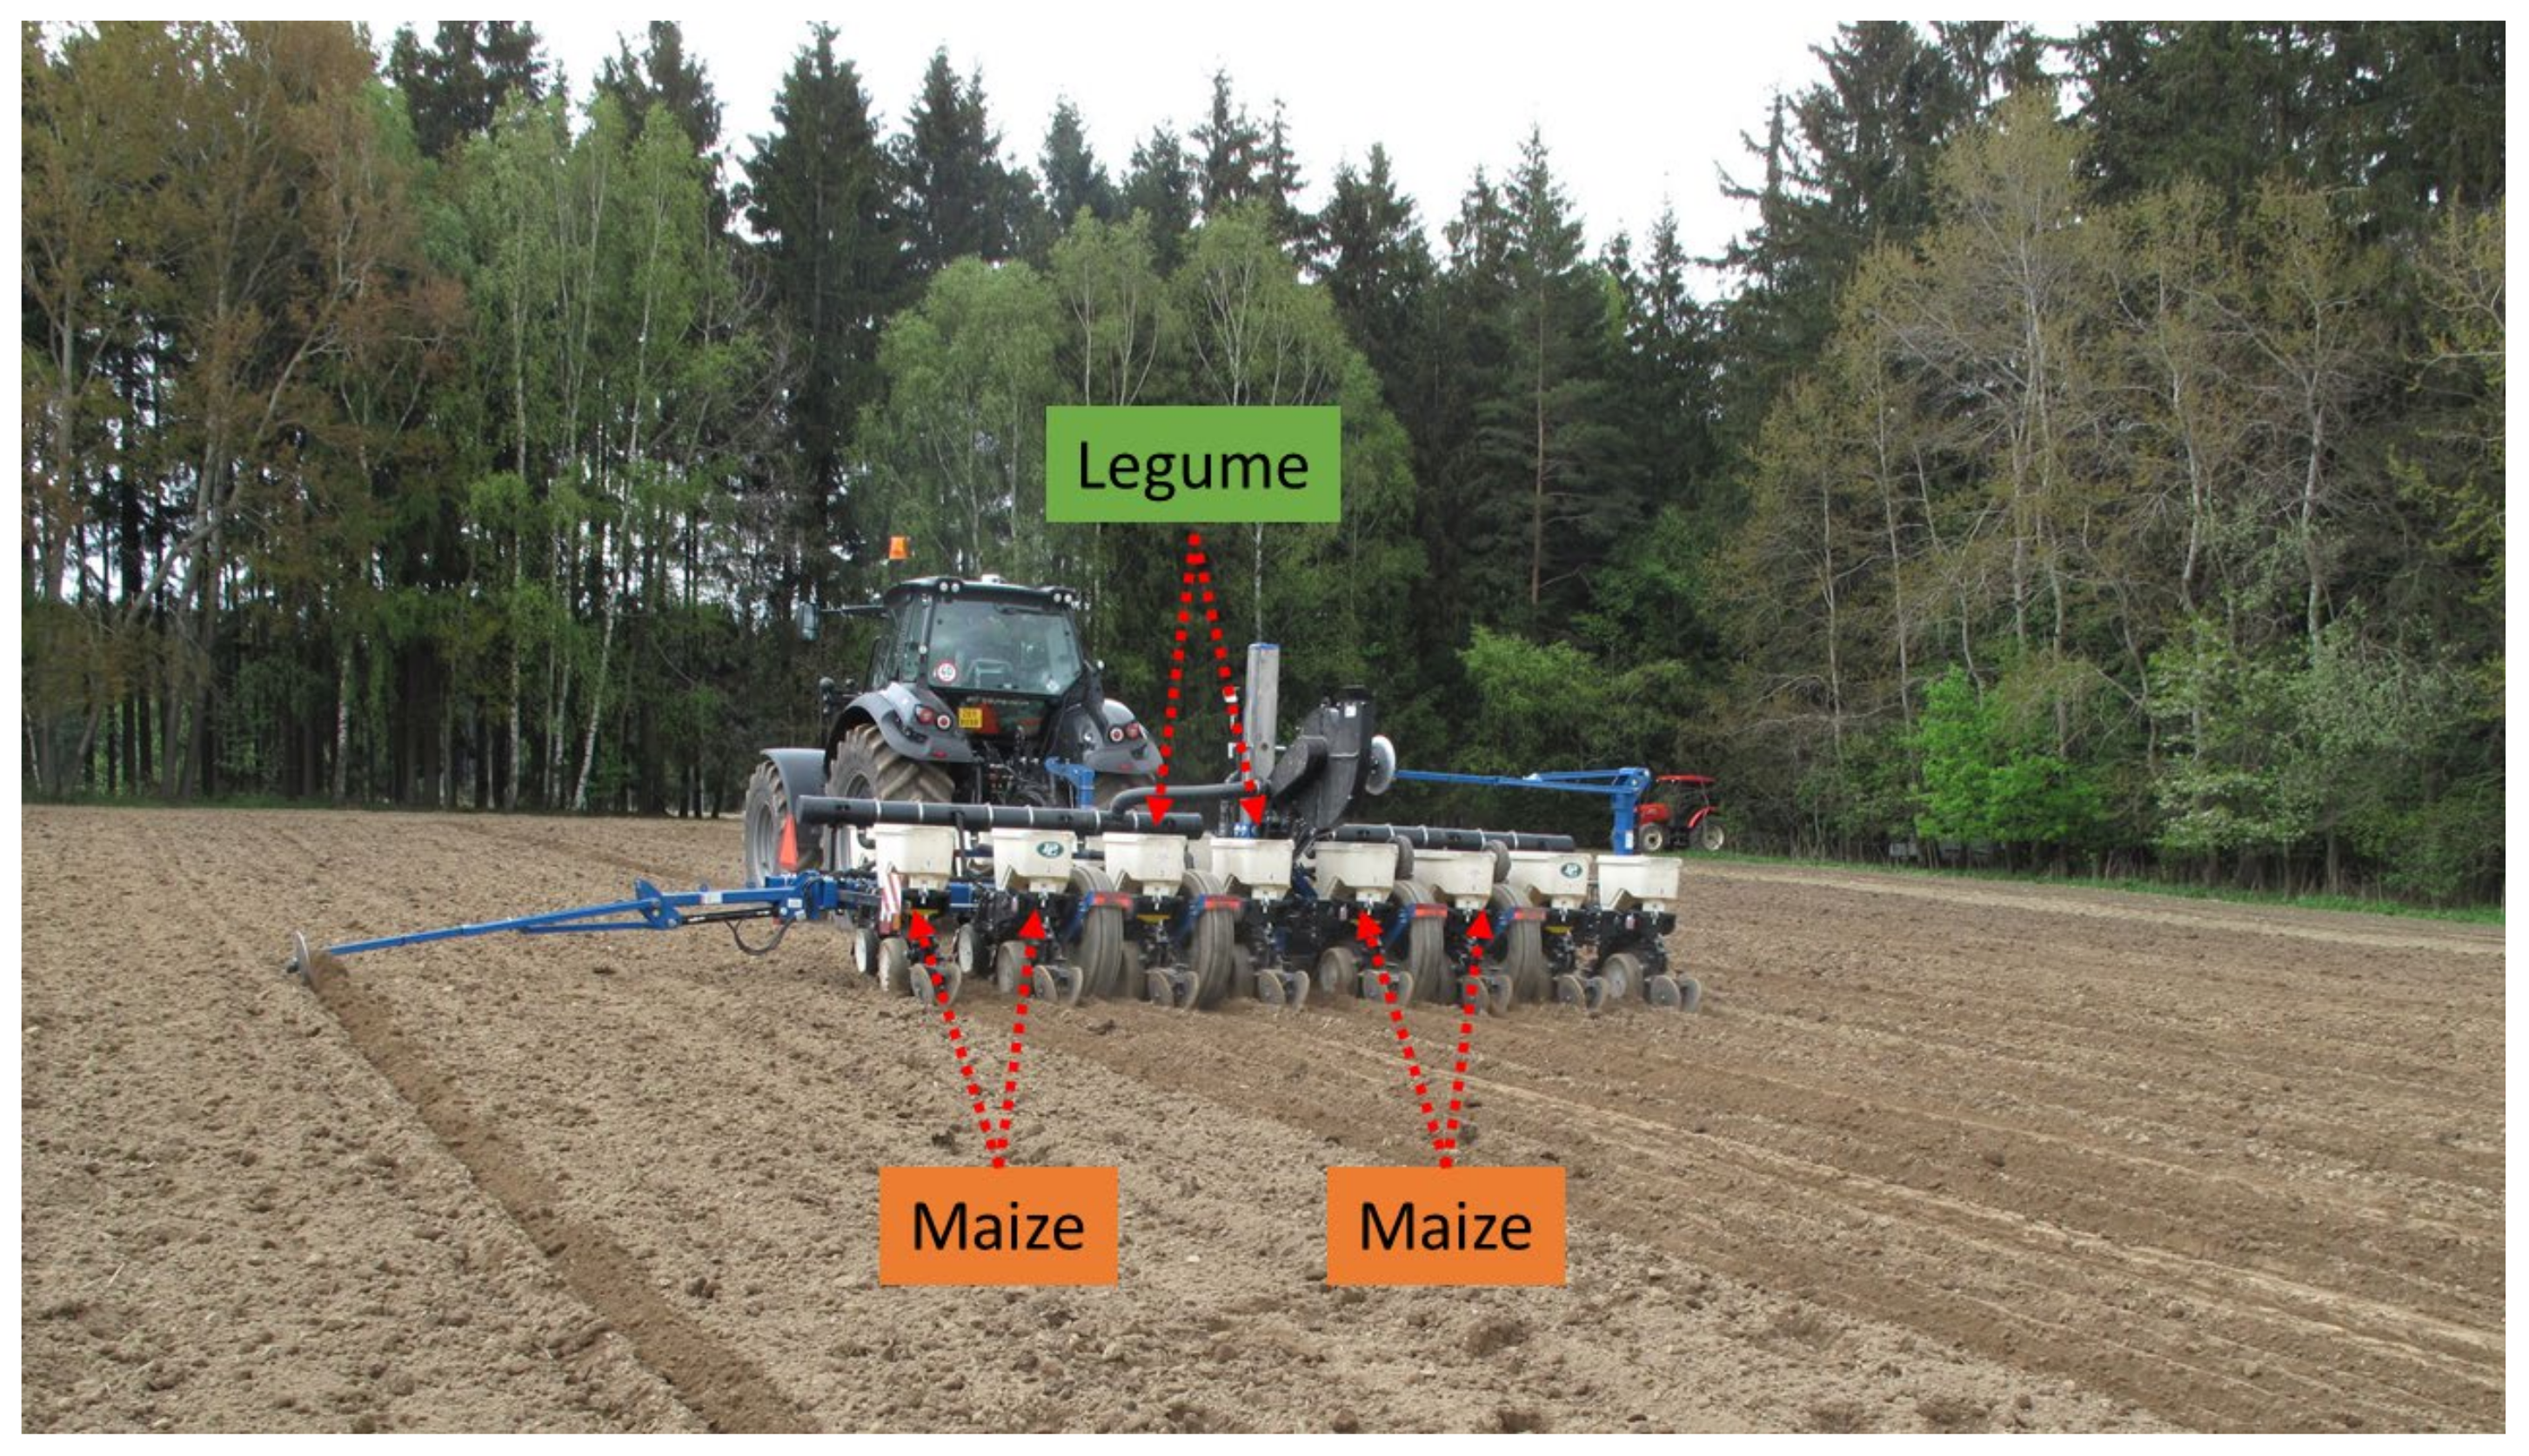
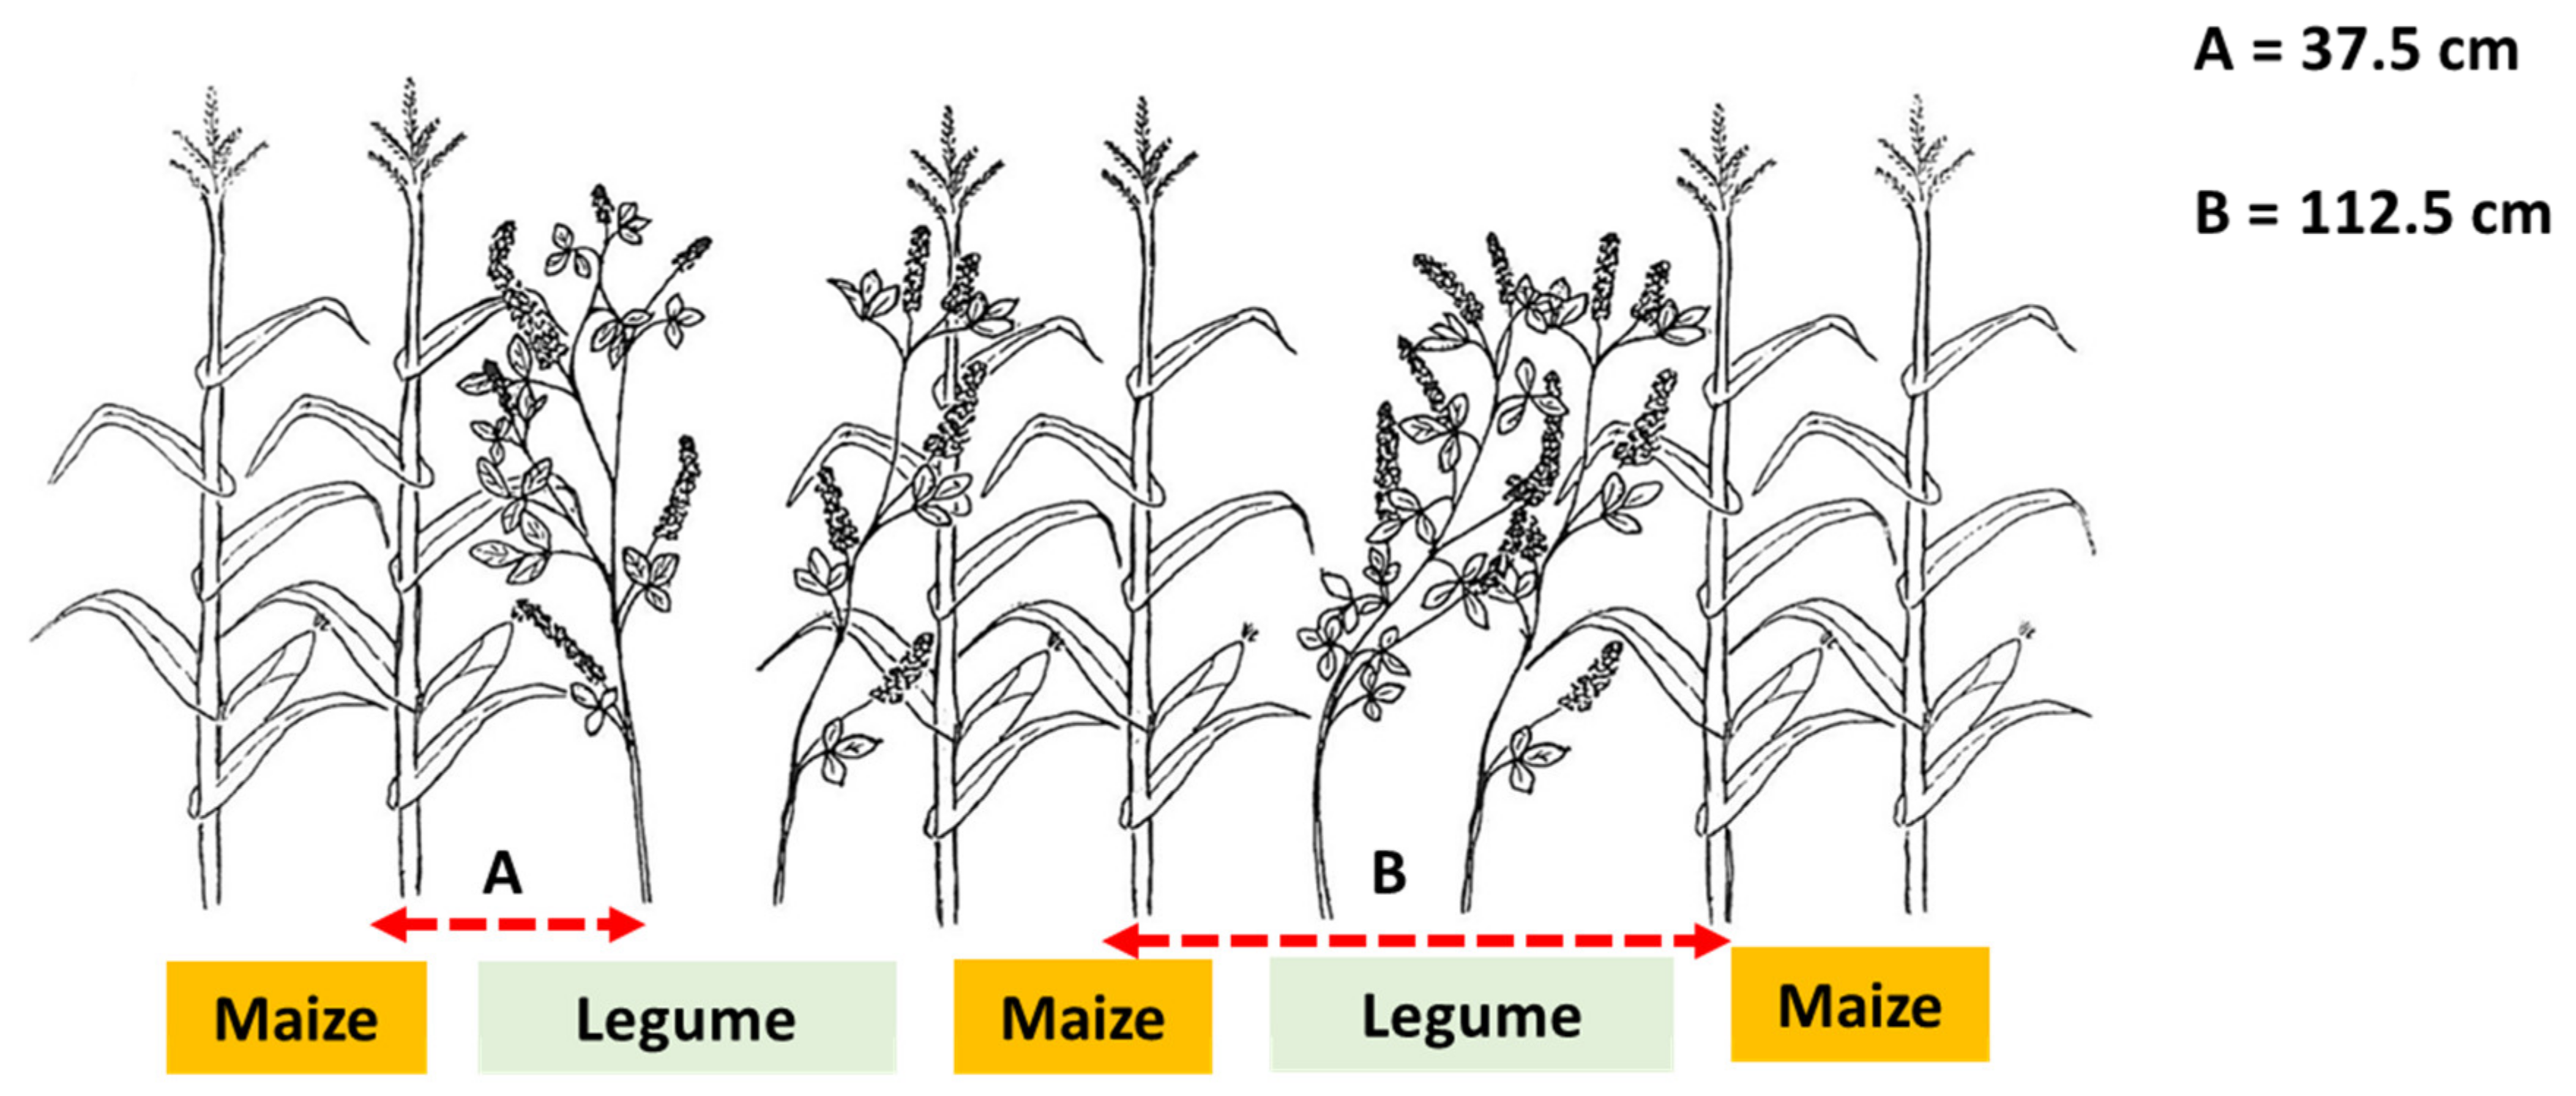
The stands of mixed cultures as well as the pure maize stands were established using an “interplant system” precise sowing machine with the KINZE 3500 vacuum seeding device (Figure 3, Kinze Manufacturing, Williamsburg, IA, USA). Two rows of seeding units (15 pcs) allowed to keep the line spacing of 0.375 m (Figure 4). Seed hoppers of the seeding unit were filled with seeds in such a way that the sowing of two lines of maize alternated with the sowing of two lines of the chosen legume [23].
Stand variants were divided into the following two groups:
(1)
Sole Crop (SC)—Maize
The selected seeds were sown individually on the same date into rows of 0.375 m in width using the Kinze 3500 “Interplant system” seeding machine. The seeding value was 75,000 seeds per ha.
(2)
Mixed cropping (MC)—Legumes + Maize
The mixed culture of maize and legume plants was sown using the Kinze 3500 “Interplant system” seeding machine. Seeding was carried out in one operation. Seed hoppers (carts) were filled so that two rows of maize alternated with two rows of legume in the mixed crop stand at the same spacing between the rows—0.375 m. The seed rate in the mixed crop was 150 thousand seeds per ha: 75 thousand seeds of maize (Zea mays L.) and 75 thousand seeds of selected legumes.
The tested crops are listed in Table 2. These crops were grown to gain biomass for the preparation of shreddings and model micro-silages tested in laboratory fermentors.

2.3. Evaluation of the Yield from Individual Combinations of Mixed Cultures

The amount of produced biomass was determined according to methodology developed by Loučka et al. [28] when the plant biomass was directly collected for sampling from each variant in the BBCH 77-83 maize growth stage (early milk ripeness to early wax ripeness). The method was developed to determine yield in wide-row crops. The principle of biomass sampling is shown in Figure A1.

2.4. Production of Mixed Culture Silage

The plant biomass in the BBCH 77-83 growth stage of maize was collected by hand at a stubble height of 18 cm and chopped to a length of 15–20 mm using the Deutz-Fahr MH 6505 (Deutz-Fahr, Lauingen, Germany) cutter. It is an attached single-row chopper with the feeding and cutting mechanism ending with a sweeper. The cutting mechanism is equipped with 12 knives. The produced shreddings were used to prepare seven variants of silage in three repetitions (Table 3). The method of micro-silage preparation was identical for all three repetitions: 8 kg of shreddings was placed in a mini-silo (container: 150 mm in diameter and 1000 mm in height), together with the inoculant for each silo (Silo Solve EF, Chr. Hansen Holding Ltd., Starovice, Czech Republic), dosed at 5 g + 3.5 L of H2O/t. The prepared plant material was compacted in the mini-silos with a pneumatic press (6000 N/m2). Then, the mini-silos were hermetically sealed and stored in the dark at 28 °C for 90 days to avoid exposure to light. This process for the production of micro-silage was already used and thoroughly tested in the past [23,27,29]. The compaction of shreddings in the mini-silos ranged from 112.2 to 164.7 kgTS/m3 (Table 3).

2.5. Silage Characteristics

Silage characteristics were determined according to Huňady et al. [30], Kintl et al. [31], and standards CSN EN 15934 [32], CSN EN 15935 [33], and ISO 13906 [34]. Frozen silage samples were defrosted at 18 °C before the fermentation test. The overview of used methods for the determination of the selected parameters is given in Table 4.

2.6. Biomethanation Batch Test

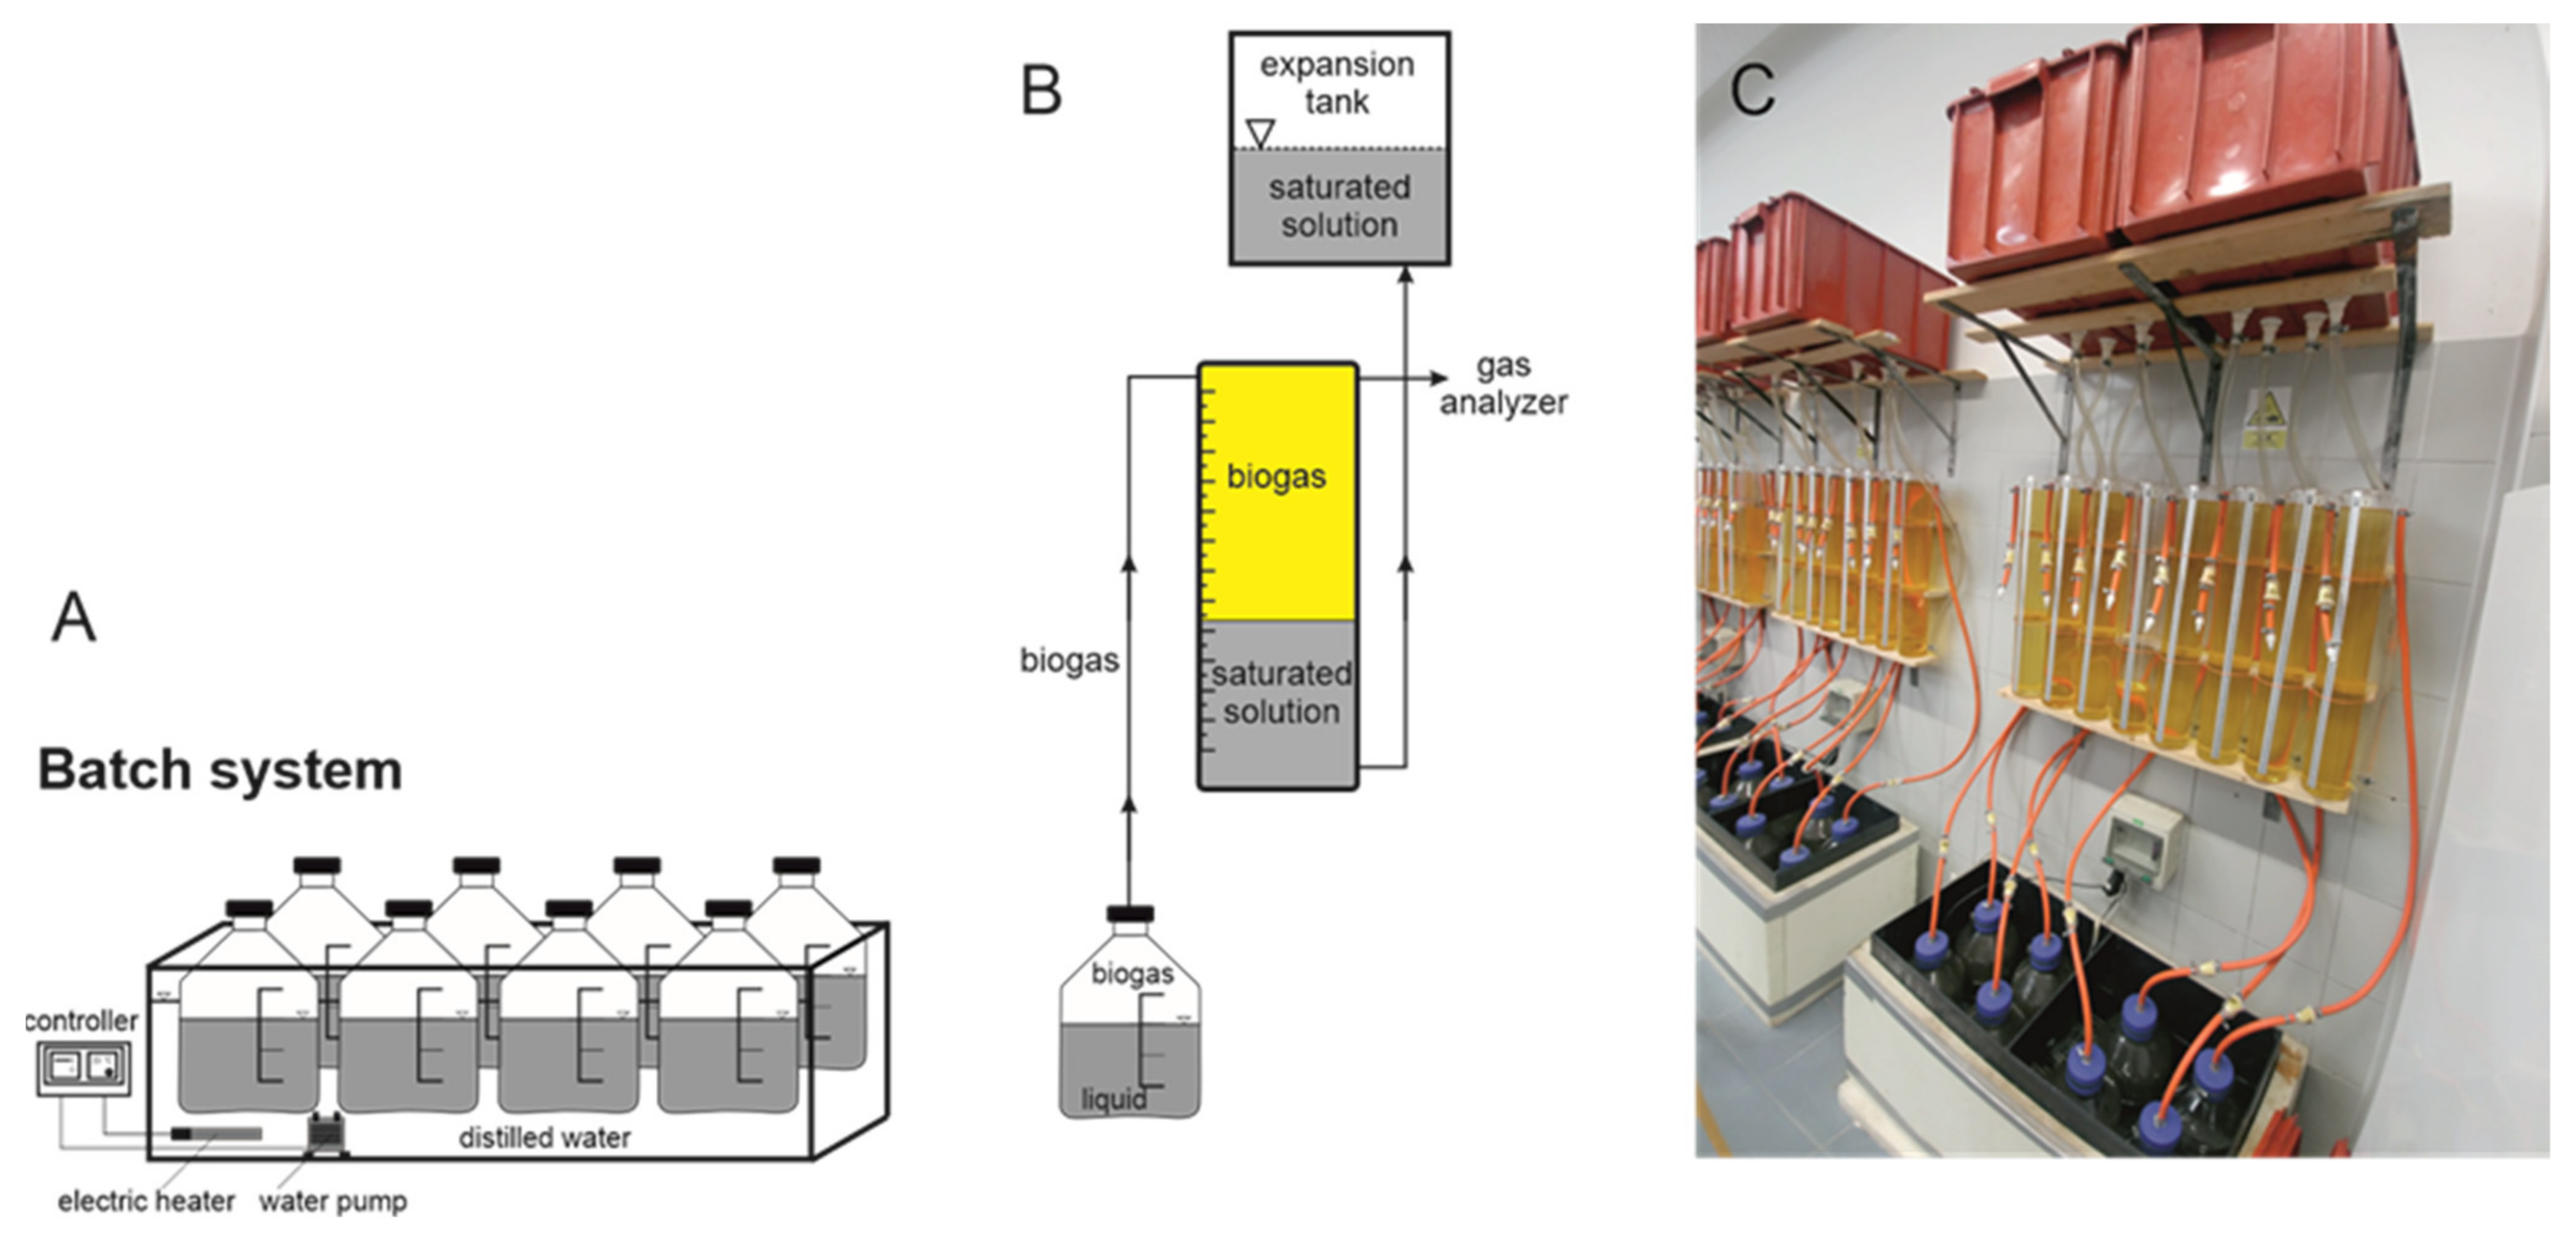
Biomethanation batch tests were performed according to Kintl et al. [39] and Kintl et al. [40]. The produced biogas was measured daily using the method of fluid extrusion with the acidified saturated solution of NaCl being used as a barrier solution. This procedure is in accordance with technical standard VDI 4630. The generated volume of biogas was recalculated to standard temperature and pressure (273.15 K and 1 bar). A detailed characteristic of the inoculum used in the laboratory test is presented in Table 4. Parameters of the biomethane potential test are described in Table 5 and Table 6. The complete test was characterized in detail in Kintl et al. [39]. A scheme of the used apparatus and interconnection of instruments is presented in Figure 5. An analysis of biogas composition was performed according to Kintl et al. [23,29].

2.7. Statistical Analysis—Data Treatment

All parameters of the experiment were measured at least in three repetitions. The experimental data were analyzed using the software Statistica version 12 CZ (Dell Software, Round Rock, TX, USA). Basic statistical parameters (minimum, maximum, median, etc.) were determined using an exploratory data analysis (EDA). The results of the EDA analysis did not reveal any anomalies that would prevent the statistical processing of the measured data. Subsequently, one-way analysis of variance (ANOVA) was calculated. The ANOVA was supplemented with the post hoc Tukey’s HSD test to determine significant differences in the individual parameters among the variants. Above all, interactions between individual parameters and factors affecting the values of these parameters were analyzed with a Principal Component analysis (PCA) and factor analysis (FA). All analyses were calculated at the level of significance p < 0.05.

3. Results and Discussion

3.1. Biomass Yield from the Mixed Culture

Yields (t/ha) were evaluated from four variants: MA-100, MA-95+LU-5, MA-93+WSC-7, and MA-77+FB-23. Fresh matter (FM) and dry matter (DM) yields achieved are presented in Table 7 and Table 8. In the case of variants with mixed cultures (MA-95+LU-5, MA-93+WSC-7, and MA-77+FB-23), both total yields and yields of individual crops are presented.
The highest average yield of fresh matter was achieved with the mixed culture MA-77+FB-23 (61.88 t/ha). The lowest average FM yield was achieved with MA-95+LU-5 (58.12 t/ha). However, there were no statistically significant differences between the individual variants. As to the relative difference, variant MA-77+FB-23 achieved a yield that was only 1% higher than that of control variant MA-100. The variant with the lowest yield reached only 95% of average yield.
Values of dry matter, DM (%), at harvest ranged from 26.9 (MA-100; control) to 28.0 (MA-93+WSC-7). The highest average yield of DM (t/ha) was reached with the mixed culture MA-93+WSC-7 (16.82 t/ha), and the lowest average yield of DM was reached with the mixed culture MA-95+LU-5 (15.78 t/ha). This was the only variant that exhibited a yield lower than MA-100. There were, however, no statistically significant differences between the individual variants.
Comparing the measured values of FM and DM yield (Table 7 and Table 8) in terms of their statistical significance, we arrive at an opinion that the mixed culture had no demonstrable influence on the yield of biomass. Thus, the absence of significant differences between the individual variants indicates that incorporation of legume into one cultivation system with maize does not have to lead to a significantly reduced yield of biomass. A similar experiment with the mixed culture of maize and legume was conducted by Htet et al. [41]. The authors tested a possibility of growing soy and maize but arrived at opposite results. They inform the yield of DM in maize to be 14.5 t/ha, while various variants of mixed cultures of maize with soy exhibited statistically significantly lower yields ranging from 12.1 to 13.2 t/ha. Thus, the cultivation of maize in the mixed culture was almost equally advantageous or even more advantageous than the cultivation of maize in the monoculture. Table 7 shows that results between the individual variants were non-significant. Growing of more than one crop in a mixed culture may often bring higher yields (both environmental and economic) than growing these crops as monocultures [42]. Essential benefits are, among other things, increased soil erosion protection, biological fixation of nitrogen in the soil, and support of microbial activity in the soil [22,24,30,43]. It should be mentioned, however, that these potential benefits differ in the types of mixed cultures, and may be accompanied with reduced biomass yield as compared with the pure culture of maize and hence also silage for the biogas plant. The drop of yield ranges most frequently from 5 to 10% [29,44,45] and it is therefore necessary that the cultivation of a mixed culture is planned differently than the growing of a maize monoculture so that a possible yield decrease does not put the biogas plant operation into danger.

3.2. Qualitative Parameters of Silage

The following parameters were used to describe the quality of silage from individual variants: content of dry matter (DM), ash, neutral detergent fiber (NDF), acido-detergent fiber (ADF), crude fiber (CF), starch, sugars (CAR), proteins (CP), lignin, and lipids (Table 9 and Table 10). These parameters were determined at the end of the ensiling process, i.e., after the opening of silage containers, and their values were converted according to the content of DM.
The content of dry matter (DM) was the highest in the silage from variant MA-93+WSC-7 (29.43%) and the lowest in the silage from monocultures LU-100 (21.54%) and MA-100 (21.23%). According to McDonald et al. [46], an optimum range for DM in maize silage ranges from 28% to 32%. This range was achieved only in the silage variants from mixed cultures MA-93+WSC-7 and MA-77+FB-23. The values indicate that the content of DM was the highest in variants containing WSC and FB: MA-93+WSC-7, MA-77+FB-23, WSC-100, and FB-100. The trend is also corroborated with the statistically significant differences between these two groups of variants. The presence of legume in the mixture with maize statistically significantly increased the content of DM. According to Nabel et al. [15], the DM content in silage from maize biomass or other crops is affected both by environmental factors of the site and by the characteristic of grown crops and their varieties or hybrids. Maize has long been bred to produce biomass for silage used for energy purposes, feeding, and biogas production. Legumes were primarily bred in the past to produce food and feeds rich in proteins or fiber. Therefore, it is clear that before varieties will be bred for use in biogas plants, the crops will mainly exhibit qualitative indicators that will be worse than the specially bred maize varieties. An exception can be some legumes that naturally exhibit, for example, a reduced content of fiber [5,15].
Htet et al. [41] arrived at similar conclusions in their experiments with the mixed culture of maize and soy: variants of silages from mixed cultures always exhibited DM contents higher than silage from a maize monoculture. According to Geren et al. [47], silage from the mixed culture of maize with Vigna unguiculata L. Walp. and Phaseolus vulgaris L. recorded a higher DM yield than maize alone and increased DM content as compared with the maize monoculture.
The content of ash was high in monosubstrates LU-100, FB-100, and WSC-100. On the contrary, the fourth monosubstrate MA-100 exhibited the lowest ash content (4.90%). In mixed variants, the content of ash ranged from 5.68 to 6.28%. Differences in the content of ash were statistically significant between all variants. Contrariwise, Htet et al. [41] inform that the highest content of ash (7.7%) was recorded in the maize monosubstrate as compared with the variants of the mixed culture or maize and soy (7.2–7.3).
The content of neutral detergent fiber (NDF) in % DM ranged on average from 61.57% (LU-100) to 50.07% (MA-77+FB-23). Statistically significant differences were found among all seven variants. A lower NDF content was recorded in variants including FB.
The measured content of NDF in the variant MA-100 was 58.11%. According to other authors, the content of NDF in the MA silage ranges from 38.6% [23] to 55.3% [48]. Htet et al. [41] measured 40.1% in the maize monosubstrate. Kintl et al. [23] reported the value of 48.67% for the content of NDF in the silage of white sweet clover while Titei [49] reported 58.1%.
The content of acid detergent fiber (ADF) ranged on average from 27.68% (MA-100) to 47.97% (LU-100) and the content of crude fiber (CF) ranged on average from 23.48% (MA-100) to 29.57% (LU-100). The contents of ADF and CF represent an important indicator of the degradability of biomass, which enters the process of fermentation [43]. In maize or legumes, of importance is the amount of ears or beans, which contain a lower amount of lignin than the plant stalk [49,50,51]. In the case of maize, the measured ADF and CF values correspond to generally known hybrids determined for use in the process of fermentation [50,52]. In the case of legumes, the availability of comparable data is worse as silages are not so often made from legumes. Kintl et al. [23] inform that white sweet clover contained 31.62% ADF, while Titei [49] reports 40.7%. Tambara et al. [53] inform, for example, that silage prepared only from white clover contained 20.34% of ADF and silage made from red clover contained 25.81% of ADF. These values are 20% lower as compared with the results of our experiment. The authors maintain that the main influence on the content of ADF and other worse degradable substances was not only the crop species but also the method of the production of shreddings.
The content of starch was the highest in MA-100 (19.83%) and the lowest in the variant WSC-100 (0.39%). A higher content of starch in mixed culture variants was recorded in MA-77+FB-23, and in silages from monocultures in MA-100 and FB-100. Statistically significant differences were found between all seven variants (Table 9). Kintl et al. [23] state a value for the maize silage to be 20.7%. Similar values were recorded in other experiments, e.g., Jensen et al. [54] and Khan et al. [55]. The content of starch was demonstrably lower in variants with added legumes or in pure legume silages. This situation has to do with the character of legumes, which naturally contain the amount of protein-based substances larger than starch or CAR [53,56]. Mustafa et al. [56] inform, for example, that an average starch content in the silage made from legume (pea) was 12.9%, but the content of protein-based substances (CP) was 30.1%. This is a good illustration of the specific properties of silage made from legumes where the content of proteins surmounts the content of starch and CAR.
The content of CAR was 12.37% in MA-100 and ranged in mixed variants from 6.88% (MA-95+LU-5) to 12.68% (MA-77+FB-23, the highest), while in monosubstrates FB-100 and LU-100, it did not exceed 6.51%. The highest CAR content in MA-77+FB-23 can be explained with the fact that the leguminous component FB has a lower content of NDF compared with the MA-100 monosubstrate. The content of CAR in silage was in the negative correlation with the content of NDF (Table 10). This is also why the lowest CAR content (Table 9) was recorded in the variant LU-100 with the highest NDF content (Table 6). Pettersson and Lindgren [57] claim that the CAR content in plants significantly affects a possibility of successful ensiling and the subsequent silage usability in the process of fermentation. Other authors [50,51,52] consider CAR and starch for essential substances determining not only the amount of biogas but also its quality. This is why the values recorded in variants MA-95+LU-5, MA-93+WSC-7, and MA-77+FB-23 can be considered as positive indicators confirming a possibility of using silages made from these mixed cultures in the process of fermentation in the biogas plant.
The content of crude protein (CP) in percentage of DM ranged on average from 10.71% (MA-95+LU-5) to 17.36% (FB-100). The significant highest content of CP was determined in the variants of monosubstrates while the mixed variants exhibited the significant lowest CP contents. A positive correlation (R = 0.50) was found between the content of CP and the content of lignin, which was the lowest in the silages of mixed substrates. Another positive correlation (R = 0.42) was that between the content of CP and the content of ash, which was the highest in the monosubstrates of legumes, too. However, even when it often seems there are correlations between the values obtained through the various measurements of lignin and CP in feeds, the precise correlations are extremely dependent on samples, and further research is needed to determine their character and causes [58]. This may be the reason, Htet et al. [41] state in contrast, that a maize silage in the mixture with common bean (Phaseolus vulgaris) exhibited higher yields of CP (2.2–2.6 t/ha) than the maize monosubstrate, which led them to assume that legumes in the mixture increased the content of CP. A similar conclusion was also presented by Tambara et al. [53], who detected an average content of CP in silages made from sole clovers at 20% but when the clovers were used in the mixture with other crops such as cereals, an increased content of CP was observed. In white sweet clover, Titei [49] reports the content of CP in silage to be 12.7% while Kintl et al. [40] report 14.48%. Popp et al. [21] report the white sweet clover silage to have the CP content of 8.6%, which is markedly lower than the CP content recorded in white sweet clover in our experiment. Sowa-Borowiec et al. [59] reported that the mean content of CP in the dry matter of fresh white sweet clover matter at the time of full flowering was 17.87%
The content of lignin was the highest in the monosubstrates of legumes (7.09–7.63%), while the lowest content of lignin was recorded in M-100 (3.43%). Surprisingly, the content of lignin was decreasing with the increasing content of legumes in the mixed culture, with the differences being statistically significant. Together with ADF and CF, lignin is one of the important parameters of crops grown for silage as the substances are poorly degradable and hence usable in fermentation processes [50,52,53]. In the case of the control variant (Maize-100), the content of lignin corresponded to standard values for monocultural silages made of this crop, similarly as in the case of legumes [50,53,56].
The content of lipids was statistically significantly the highest in MA-77+FB-23 (3.56%) and the lowest in LU-100 (1.13%). In general, the values were not so different than in the other qualitative parameters. Sowa-Borowiec et al. [59] report 2.07% for the dry matter of white sweet clover fresh matter.
Summarizing the results of the qualitative analyses of the maize monosubstrate and all mixed variants of silages (Figure 6), it is possible to state that as compared with the maize monosubstrate, the presence of legumes in silages with maize statistically significantly (Table 8 and Table 9) increased the contents of DM, ash, and ADF, and the FB and LU species were also increasing the content of lipids. Legumes in the silage statistically non-significantly increased the content of CF and lignin. On the other hand, they statistically significantly decreased the content of NDF, CP, and starch, and the LU and WSC species were also decreasing the content of CAR and lipids. The situation follows out from the properties of the crops when maize has been long bred to contain as much CAR and starch and as little lignin as possible [52,60].

3.3. Biogas Yield

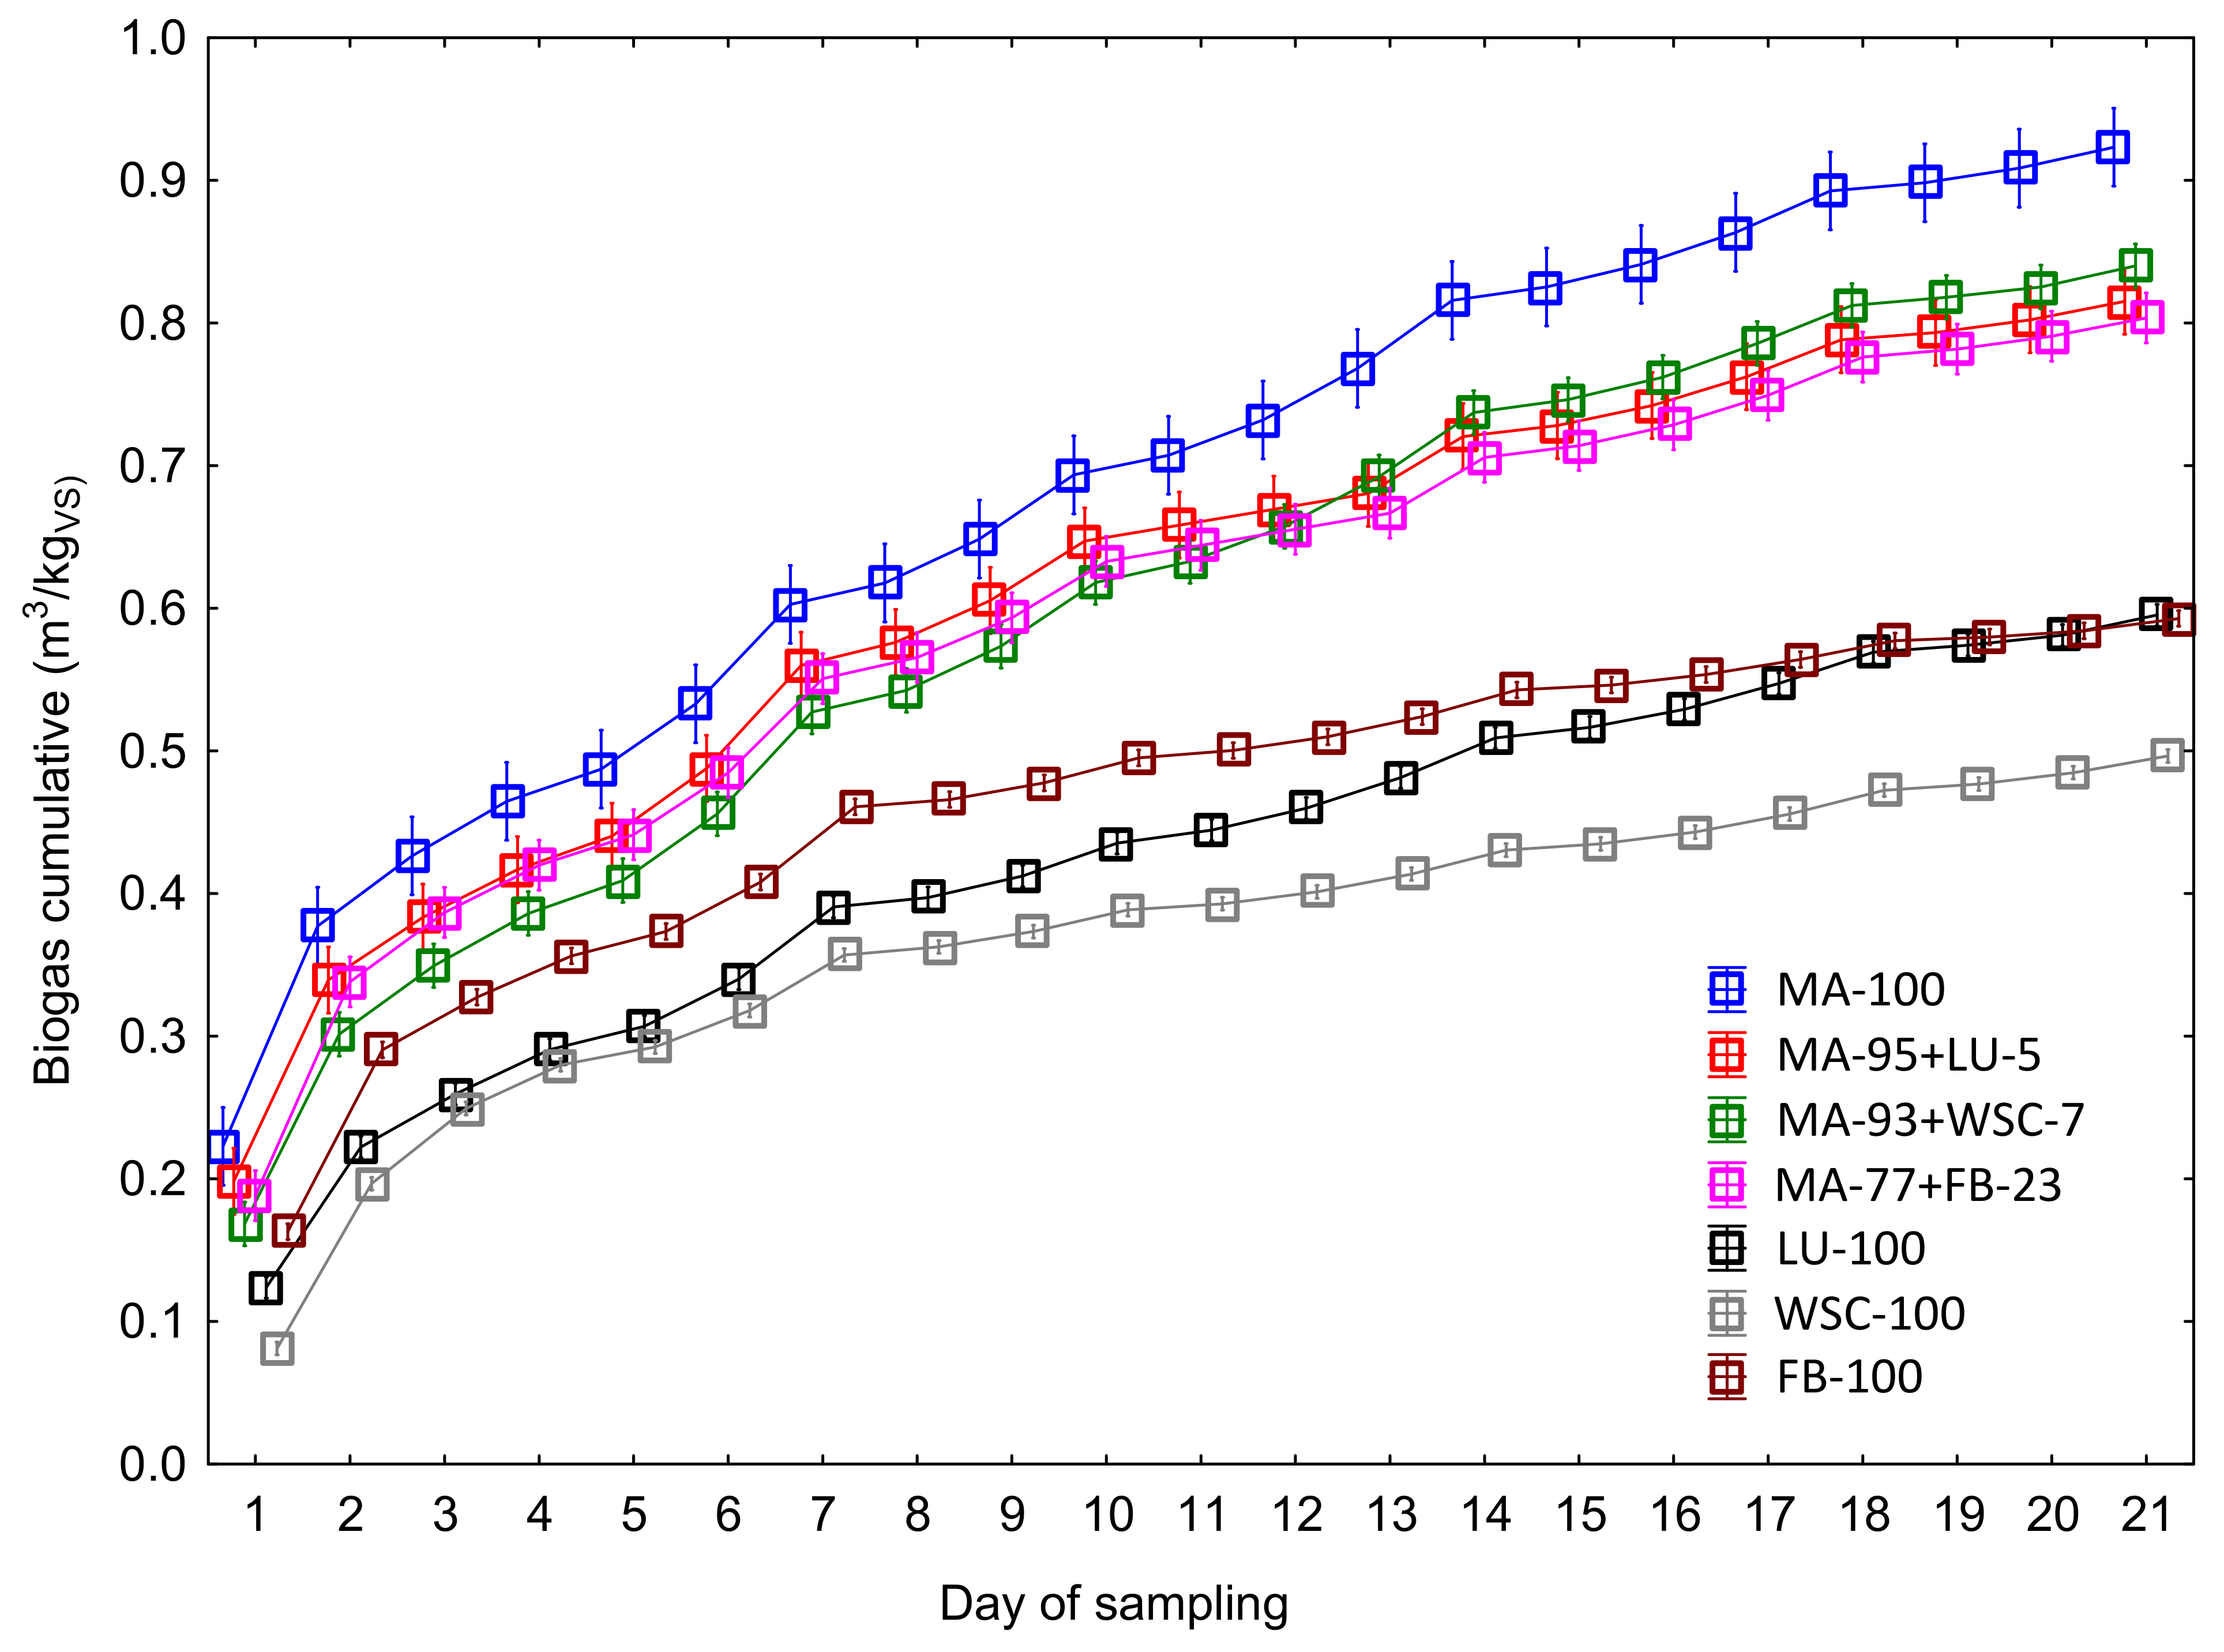
Development of cumulative biogas production from seven silage variants during a period of 21 days is shown in Figure 6. Although the behavior of the curve of cumulative biogas production is similar in all tested mixed silage variants, values of achieved biogas yield differ in individual days of measurement. The highest biogas production was found in variant MA-100 within the individual days of measurement from the beginning of the fermentation process, and was followed by variants of mixed silage MA-95+LU-5, MA-77+FB-23, and MA-95+WSC-7. Compared with MA-100, this group of three mixed silages exhibited a demonstrably lower biogas production from Day 12 of measurement. Mixed silages LU-100 and FB-100 form another group that exhibited different dynamics of biogas production from the beginning, which was lower in individual days as compared with the tested variants MA-100, MA-95+LU-5, MA-77+FB-23, and MA-95+WSC-7. The variant WSC-100 exhibited the demonstrably lowest amount of produced biogas from Day 8.
Looking at the total (cumulative) biogas production presented in Table 11, we can see that the variants can be divided into three groups according to yield (m3/kgVS): (1) The highest yield was recorded in the maize monosubstrate (0.923 m3/kgVS). (2) Variants of mixed substrates with the yield ranging from 0.804 to 0.840 m3/kgVS. (3) The lowest average biogas yield was recorded in the monosubstrates of legumes (from 0.497 to 0.593 m3/kgVS). The differences between the biogas yield in these three groups were statistically significant. Based on a similar experiment with the silage of white sweet clover, Kintl et al. [31] reported a biogas yield of 0.47 m3/kgVS.
Similarly, as the properties of individual crops affect the composition of silage, the quality of silage demonstrably affects the production of biogas [51]. The measured values show that silage with an increased content of maize or only with the content of maize was easier to use for the process of fermentation. As to silage composition, the contents of carbohydrates and crude protein can be considered main positive factors in the process of fermentation [60]. Conversely, the content of lignin represents one of the main negative parameters, which have to be reduced in silage fed into the biogas plant as a source of energy [50,52]. In the case of our experiment, variants exhibiting the highest cumulative biogas production had at the same time the highest content of readily degrading carbohydrates, and this was why they also exhibited the highest values of biogas yield. On the other hand, variants with the increased lignin content (LU-100, WSC-100, and FB-100) demonstrably showed the lowest biogas yield with the absolutely lowest yield being found in WSC-100. It should be further mentioned that some legume species also contain some other anti-nutritional substances such as coumarin, which is typically occurring in lupine, white sweet clover as well as in other legumes [22] and inhibits the process of methanogenesis [61]. This could be another of the reasons for these variants exhibiting the reduced biogas yield. Kadaňková et al. [22] measured, for example, that a sole legume silage can contain even more than 12 mg/kg of coumarin with the coumarin content in the pure maize silage ranging below 0.5 mg/kg. According to Popp et al. [21,61], the content of coumarin in silages prepared from legumes is the main limiting factor for their use in a biogas plant or as feed. Thus, there is a presumption that these anti-nutritional substances might affect the yield and chemical composition of biogas.
Figure 7 presents the production of biogas established on the basis of DM yield per unit area (see Table 9). Statistically significant differences in the production of biogas were found among the variants MA-100 and MA-95+LU-5 and the monocultures of legumes, and also between all variants with maize and legume monosubstrates. Compared with the MA-100 monosubstrate, the production of mixed substrates and legumes was lower by 8% (MA-93+WSC-7) up to 96% (WSC-100). This shows that the biogas production per unit area was (with the exception of MA-95+LU-5) directly proportional to the percentage of maize in the silage. Experimental stands of all variants were treated in the same way, which means that the costs of sowing, fertilization, chemical protection, and harvest were economically similar. The measured values indicated that growing only legumes to be used in the biogas plant would make sense neither for economical nor for operational reasons. On the other hand, it makes sense to grow maize in a mixed culture with legume whose share in the silage should not exceed a certain volume depending on the species. Thus, profitable yield will not decrease and quality of biogas production will not be compromised.
As mentioned above, legume species differ in the composition of their biomass, which affects the quality of silage produced. A common feature is the increased content of lignin. Faba bean and lupine exhibit a typically increased content of proteins in the silage [59,62] while white sweet clover has a typically increased content of coumarin [21,22,61]. Based on the already published data [23,29,31], it is possible to state that the content of lupine in the silage should not exceed 10wt%, but the content of Faba bean and white sweet clover can range from 10 to 20wt% according to technological possibilities of agricultural enterprise. If these conditions are complied with, the production of biogas would not decrease during the fermentation process.

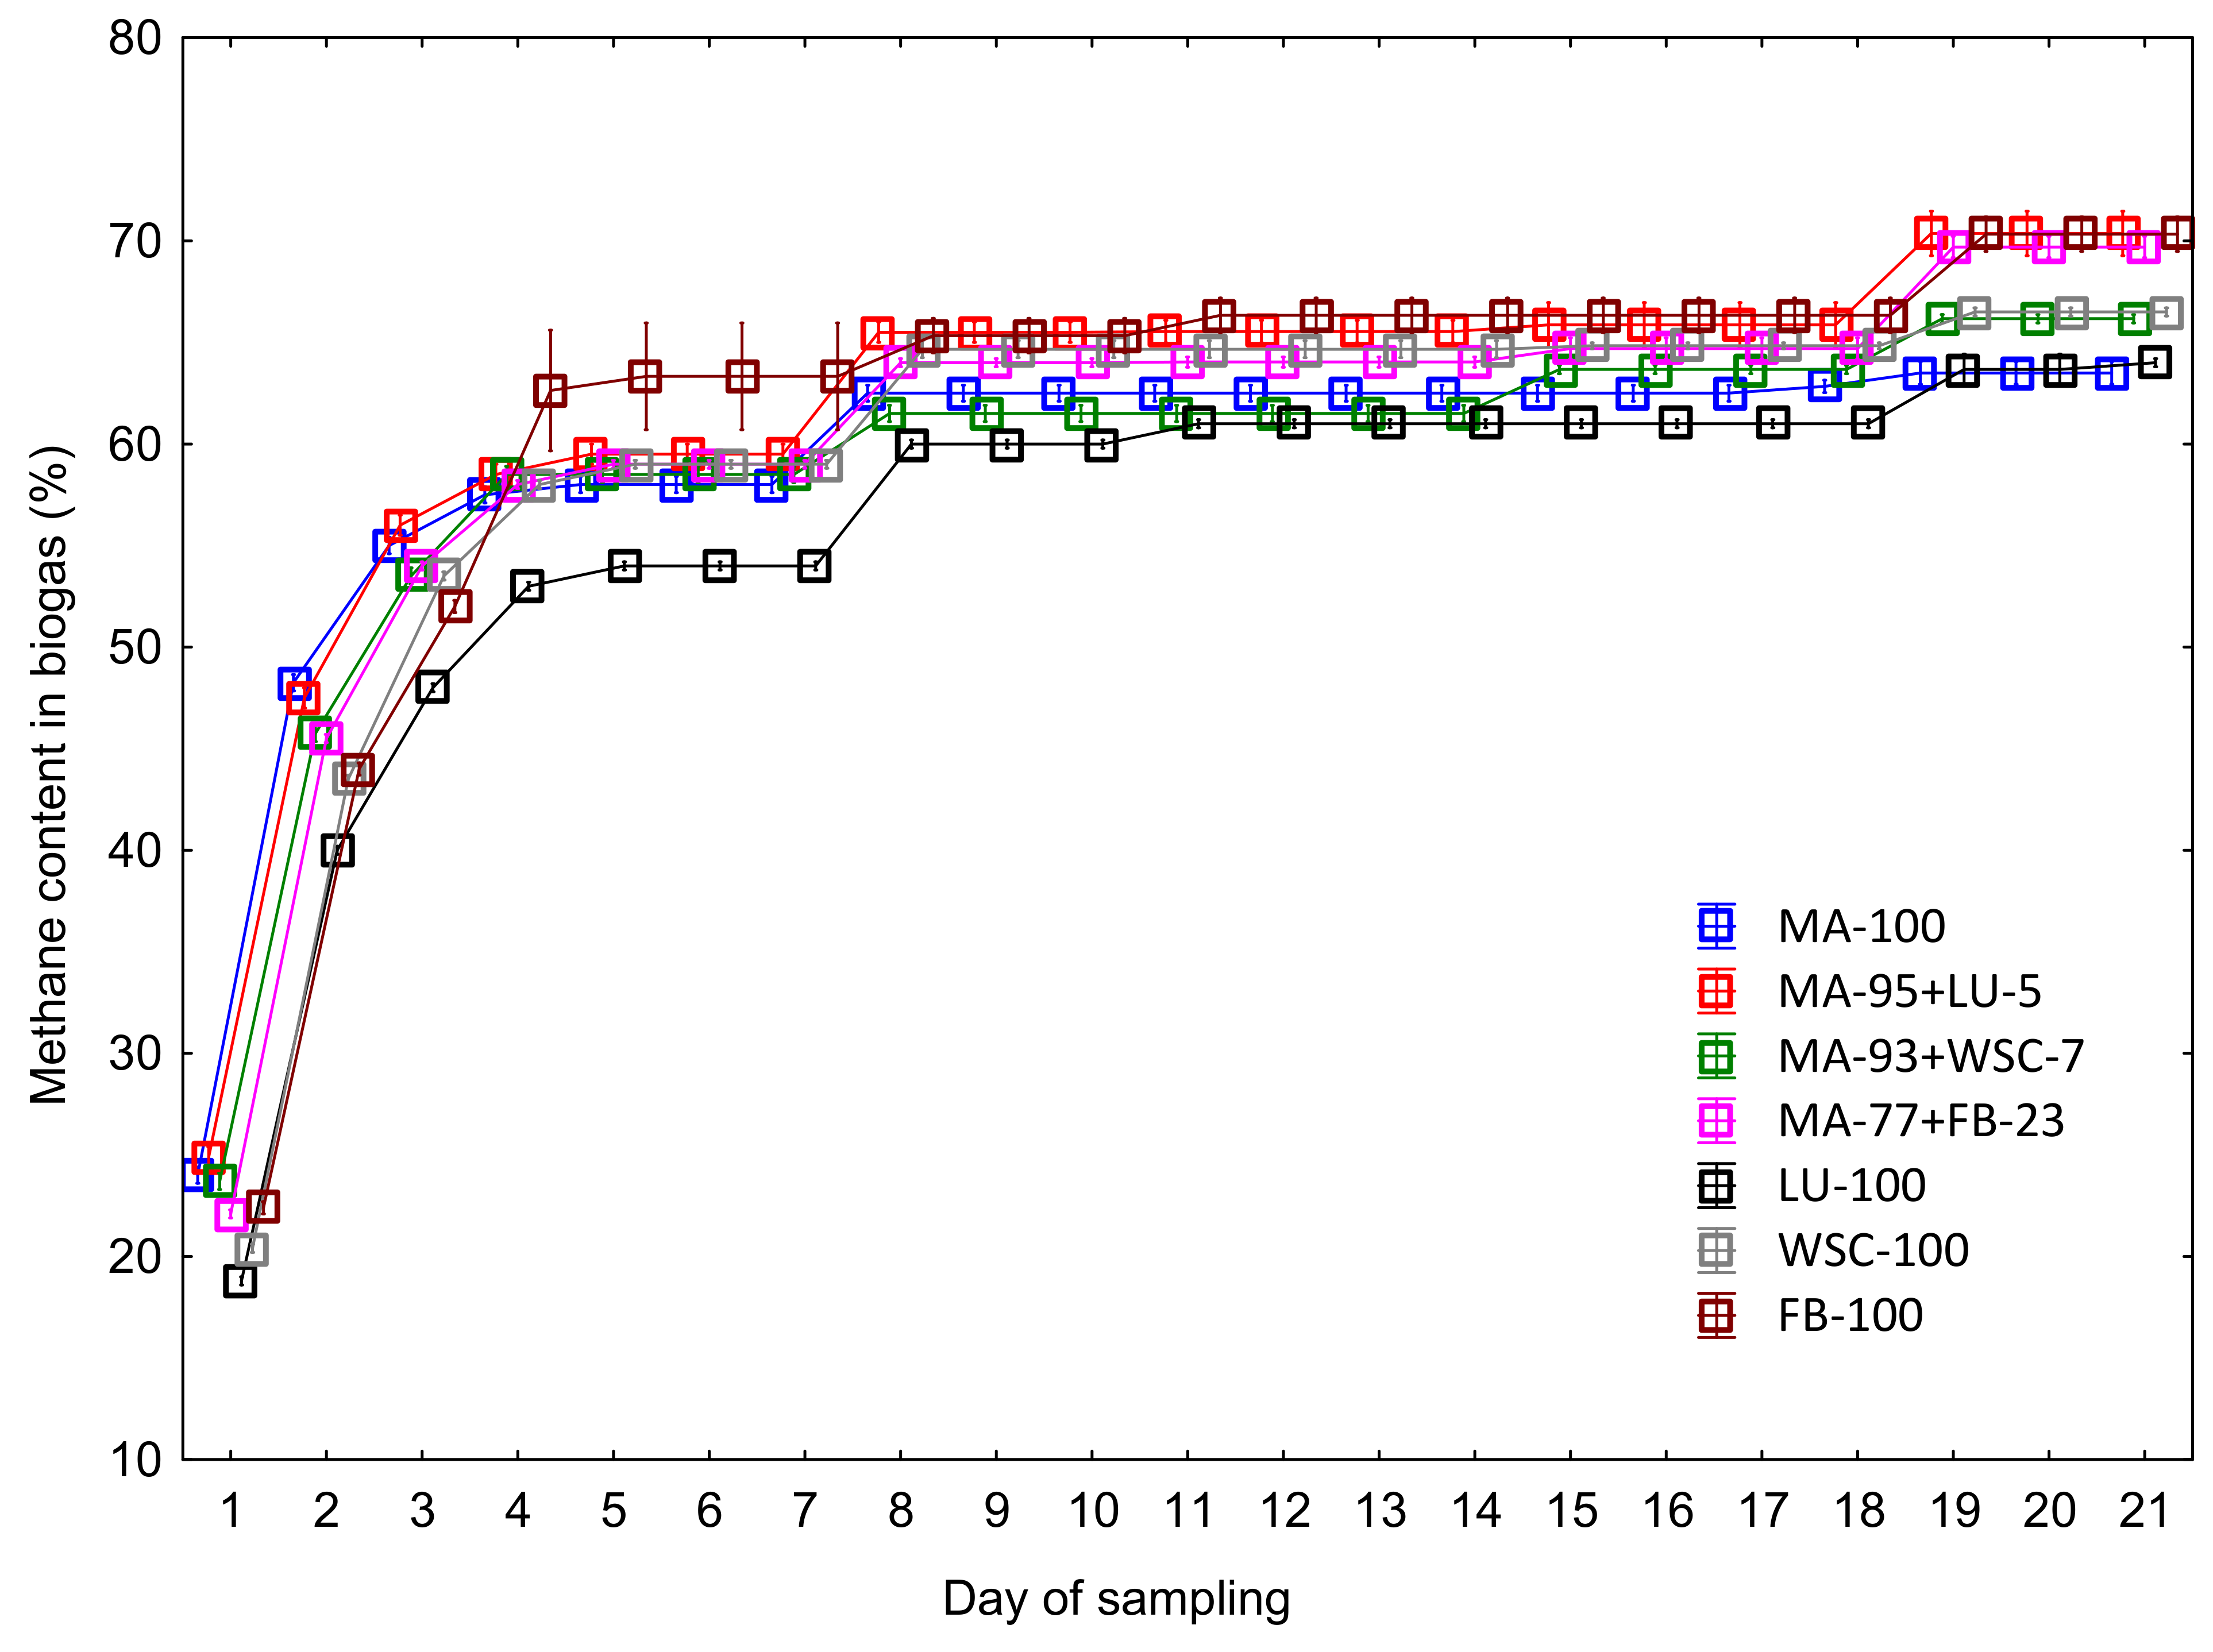
3.4. Methane Content in Biogas

Figure 8 shows the process of methane concentration development in biogas during 21 days. The diagram shows that the most rapid increase in methane concentration occurred in the first 4 days when the methane content in biogas reached values ranging from 53.0%vol (LU-100) to 62.6%vol (FB-100). Another increase by, on average, 3–6%vol was recorded on Day 8 of the fermentation process. From Day 8 of measurement, differences in the chemical composition of biogas (i.e., content of CH4) between the individual variants were very small and non-significant. The last change—a methane concentration increase by, on average, 0.5–4.5%vol—was recorded on Day 19 of measurement when the variants LU-100 and MA-100 exhibited the demonstrably lowest values of methane in biogas.
The highest final content of methane in biogas was recorded in the variant MA-95+LU-5 (70.4%vol) and in the variants with FB (FB-100 and MA-77+FB-23). The lowest final methane concentration was measured in the monosubstrate MA-100 (63.5%vol). It follows from the results that the presence of legumes in silages was increasing the methane concentration as compared with the maize monosubstrate. Differences between the variants were statistically significant (Table 12).
The content of methane is affected by many factors of which the most significant ones include the composition of silage entering the fermentor and conditions in the fermentor [51]. In our experiment, conditions in all laboratory fermentors were identical; however, the composition of entering substrates (silage) was variable (see Table 8 and Table 9). In the case of biogas plants, a lower content of less degradable substances (e.g., lignin) and a higher content of starch are desirable [50,52]. According to Herrmann et al. [52], lignin represents the most important biomass component determining specific yields of methane. The CH4 yield decreases with the increasing content of lignin and share of fiber. These conclusions were, however, not fully reached in our research in which the highest content of lignin was found in silages with the content of legume (Table 10). On the other hand, these variants (MA-93+WSC-7 and MA-77+FB-23) also exhibited a higher content of carbohydrates and a higher or the same content of crude protein. Exactly the contents of carbohydrates and crude protein in silage positively affect the quality of biogas, i.e., methane content [60]. This relation could thus explain the measured values (Figure 8 and Table 11).

3.5. Description of Interaction between Qualitative Parameters of Silage and Production of Biogas

The PCA and factor analysis were performed in order to assess correlations between variables and their influence on the production of biogas. Correlations between the studied parameters are expressed in more detail using the correlation matrix (Table 13).
The correlation matrix indicated that there is a strong relationship among the individual parameters. A significant positive linear dependence was found between the production of biogas and parameters starch (R = 0.72) and CAR (R = 0.76). A negative linear dependence was found between the production of biogas and parameters ash (R = −0.74), ADF (R = −0.74), and lignin (R = −0.92). This indicates that the biogas yield was increasing with the increasing content of starch and CAR and decreasing with the increasing content of ash, ADF, lignin, and CP. The content of methane exhibited a significant positive dependence only on DM (R = 0.65) and lipids (R = 0.62) and negative dependence on NDF (R = −0.79).
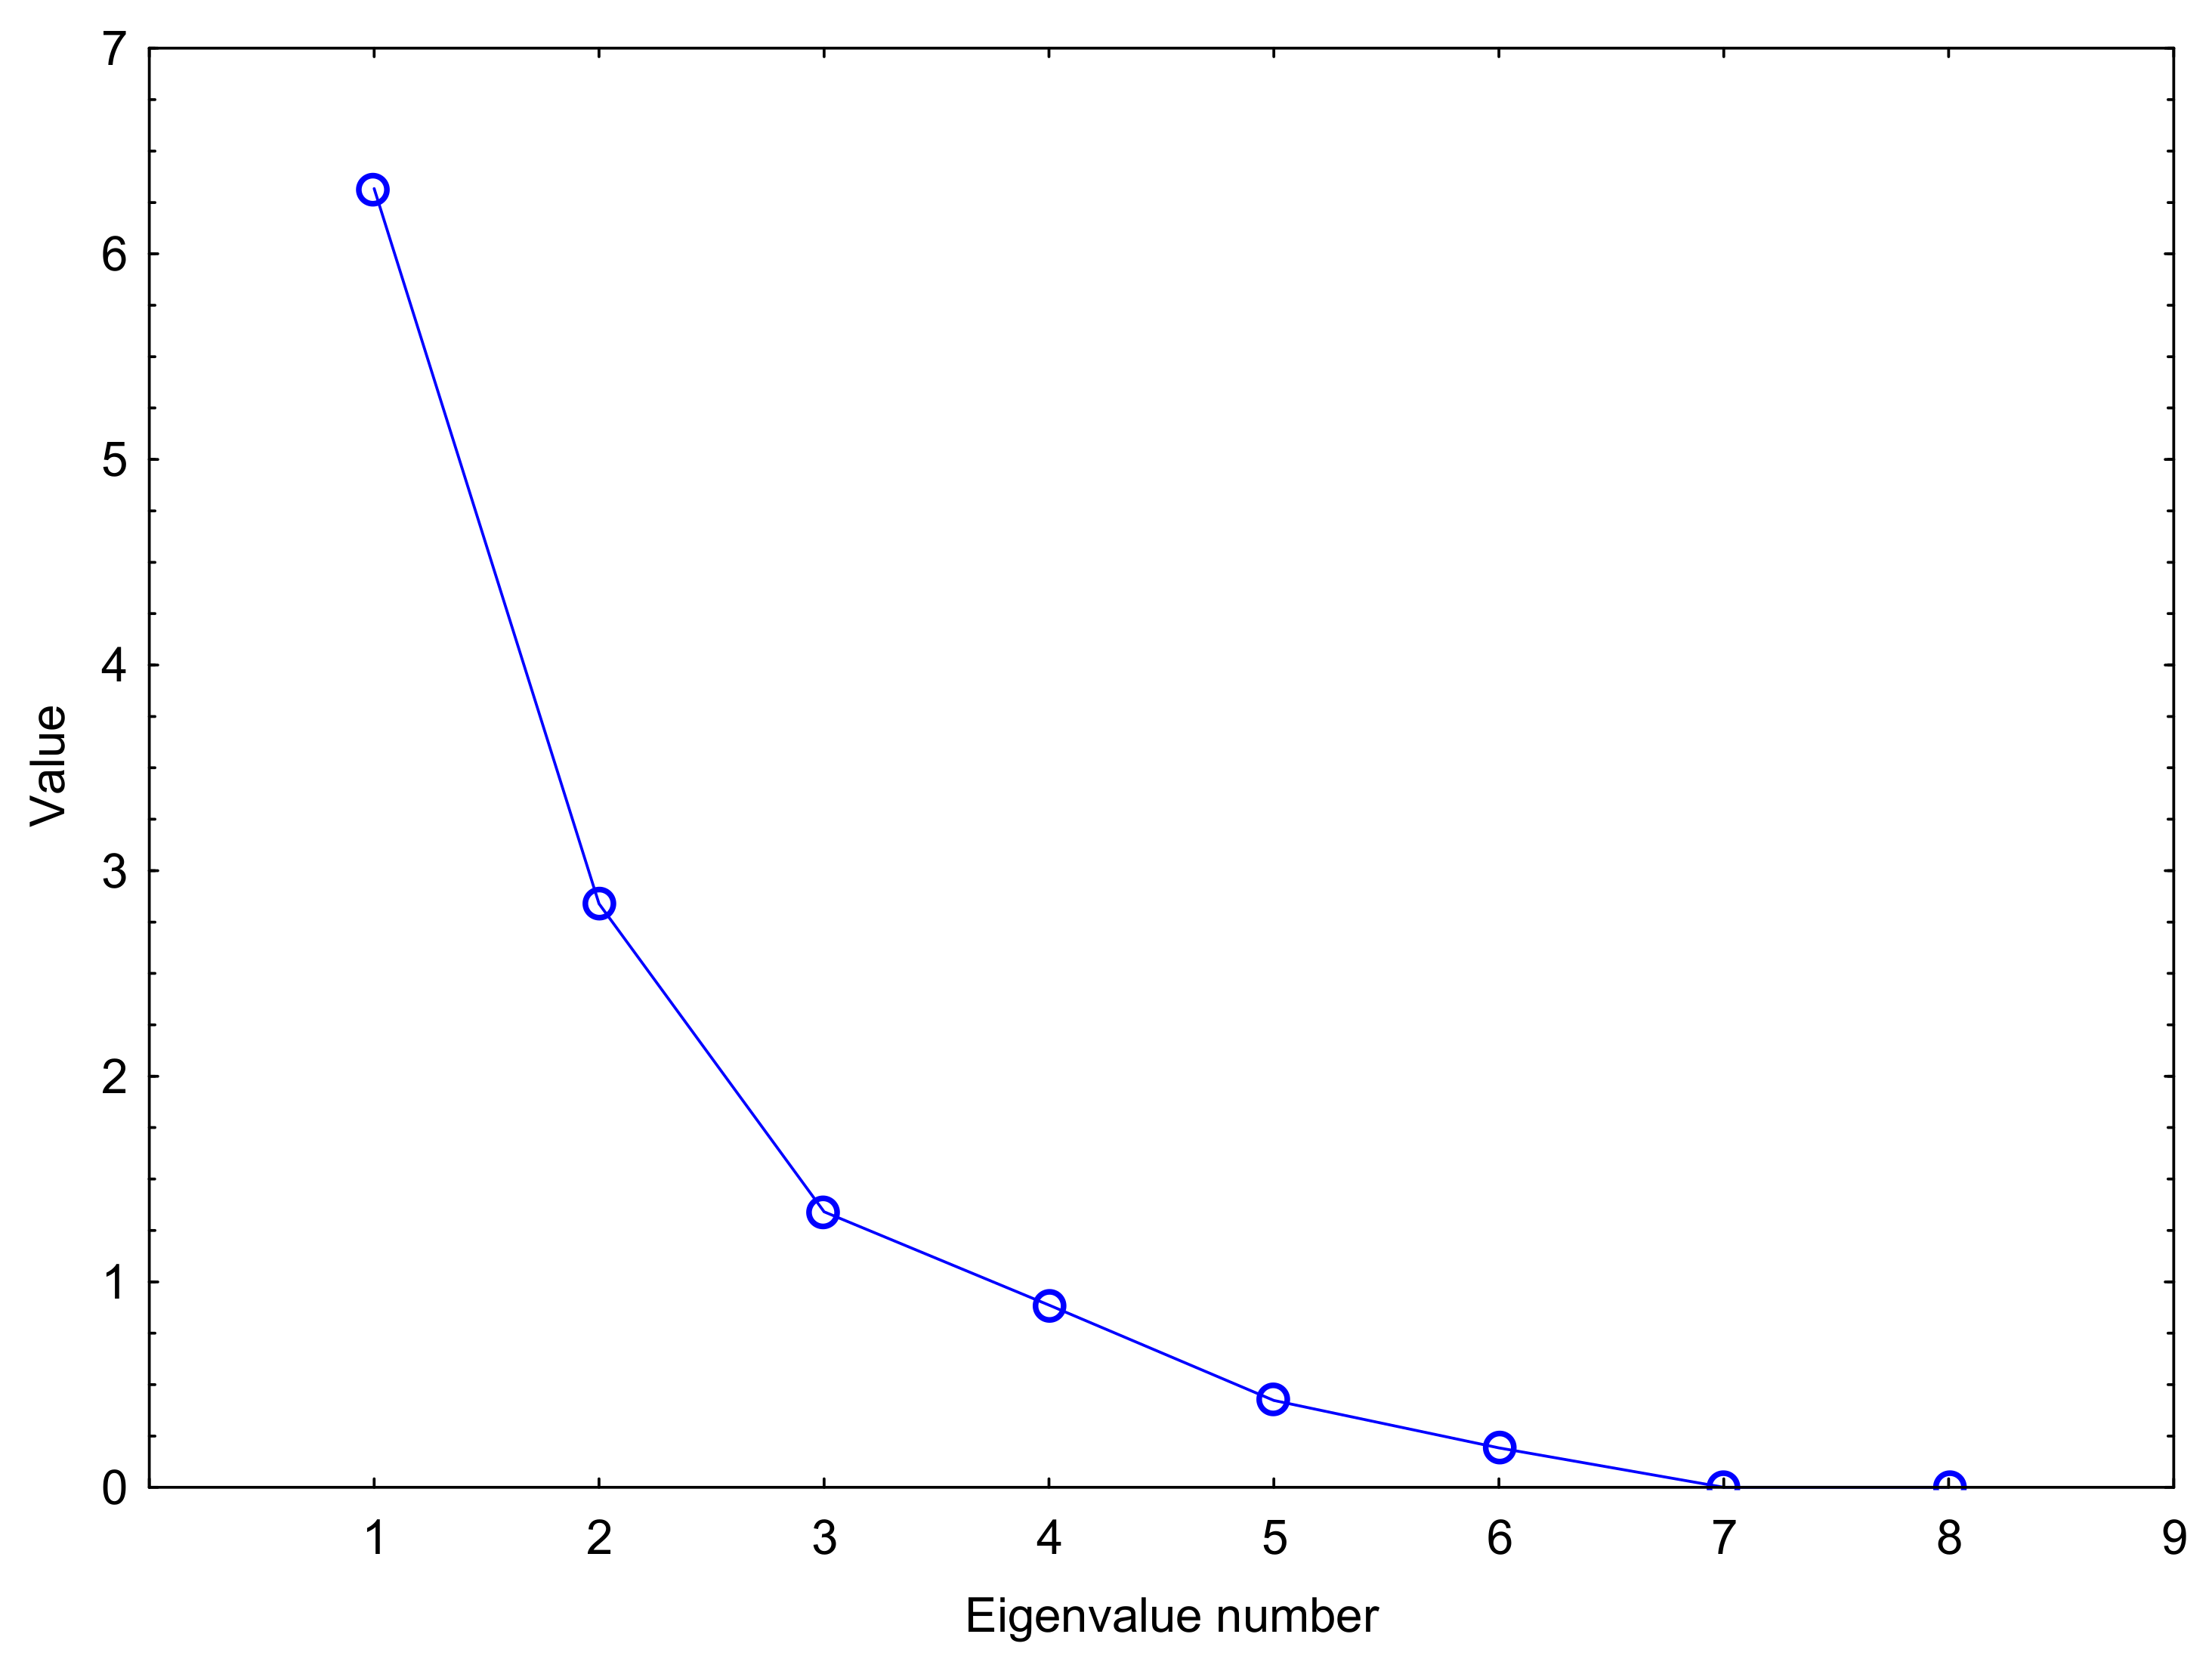
The interaction between silage parameters, biogas production, and methane content was also assessed using the factor analysis and PCA. A scree plot (Figure A2) indicated three significant factors, which could be considered originators of the variability of measured values but only the first two of them were used for a further analysis as loads between the third factor and the variables were very low with only one exception (CP).
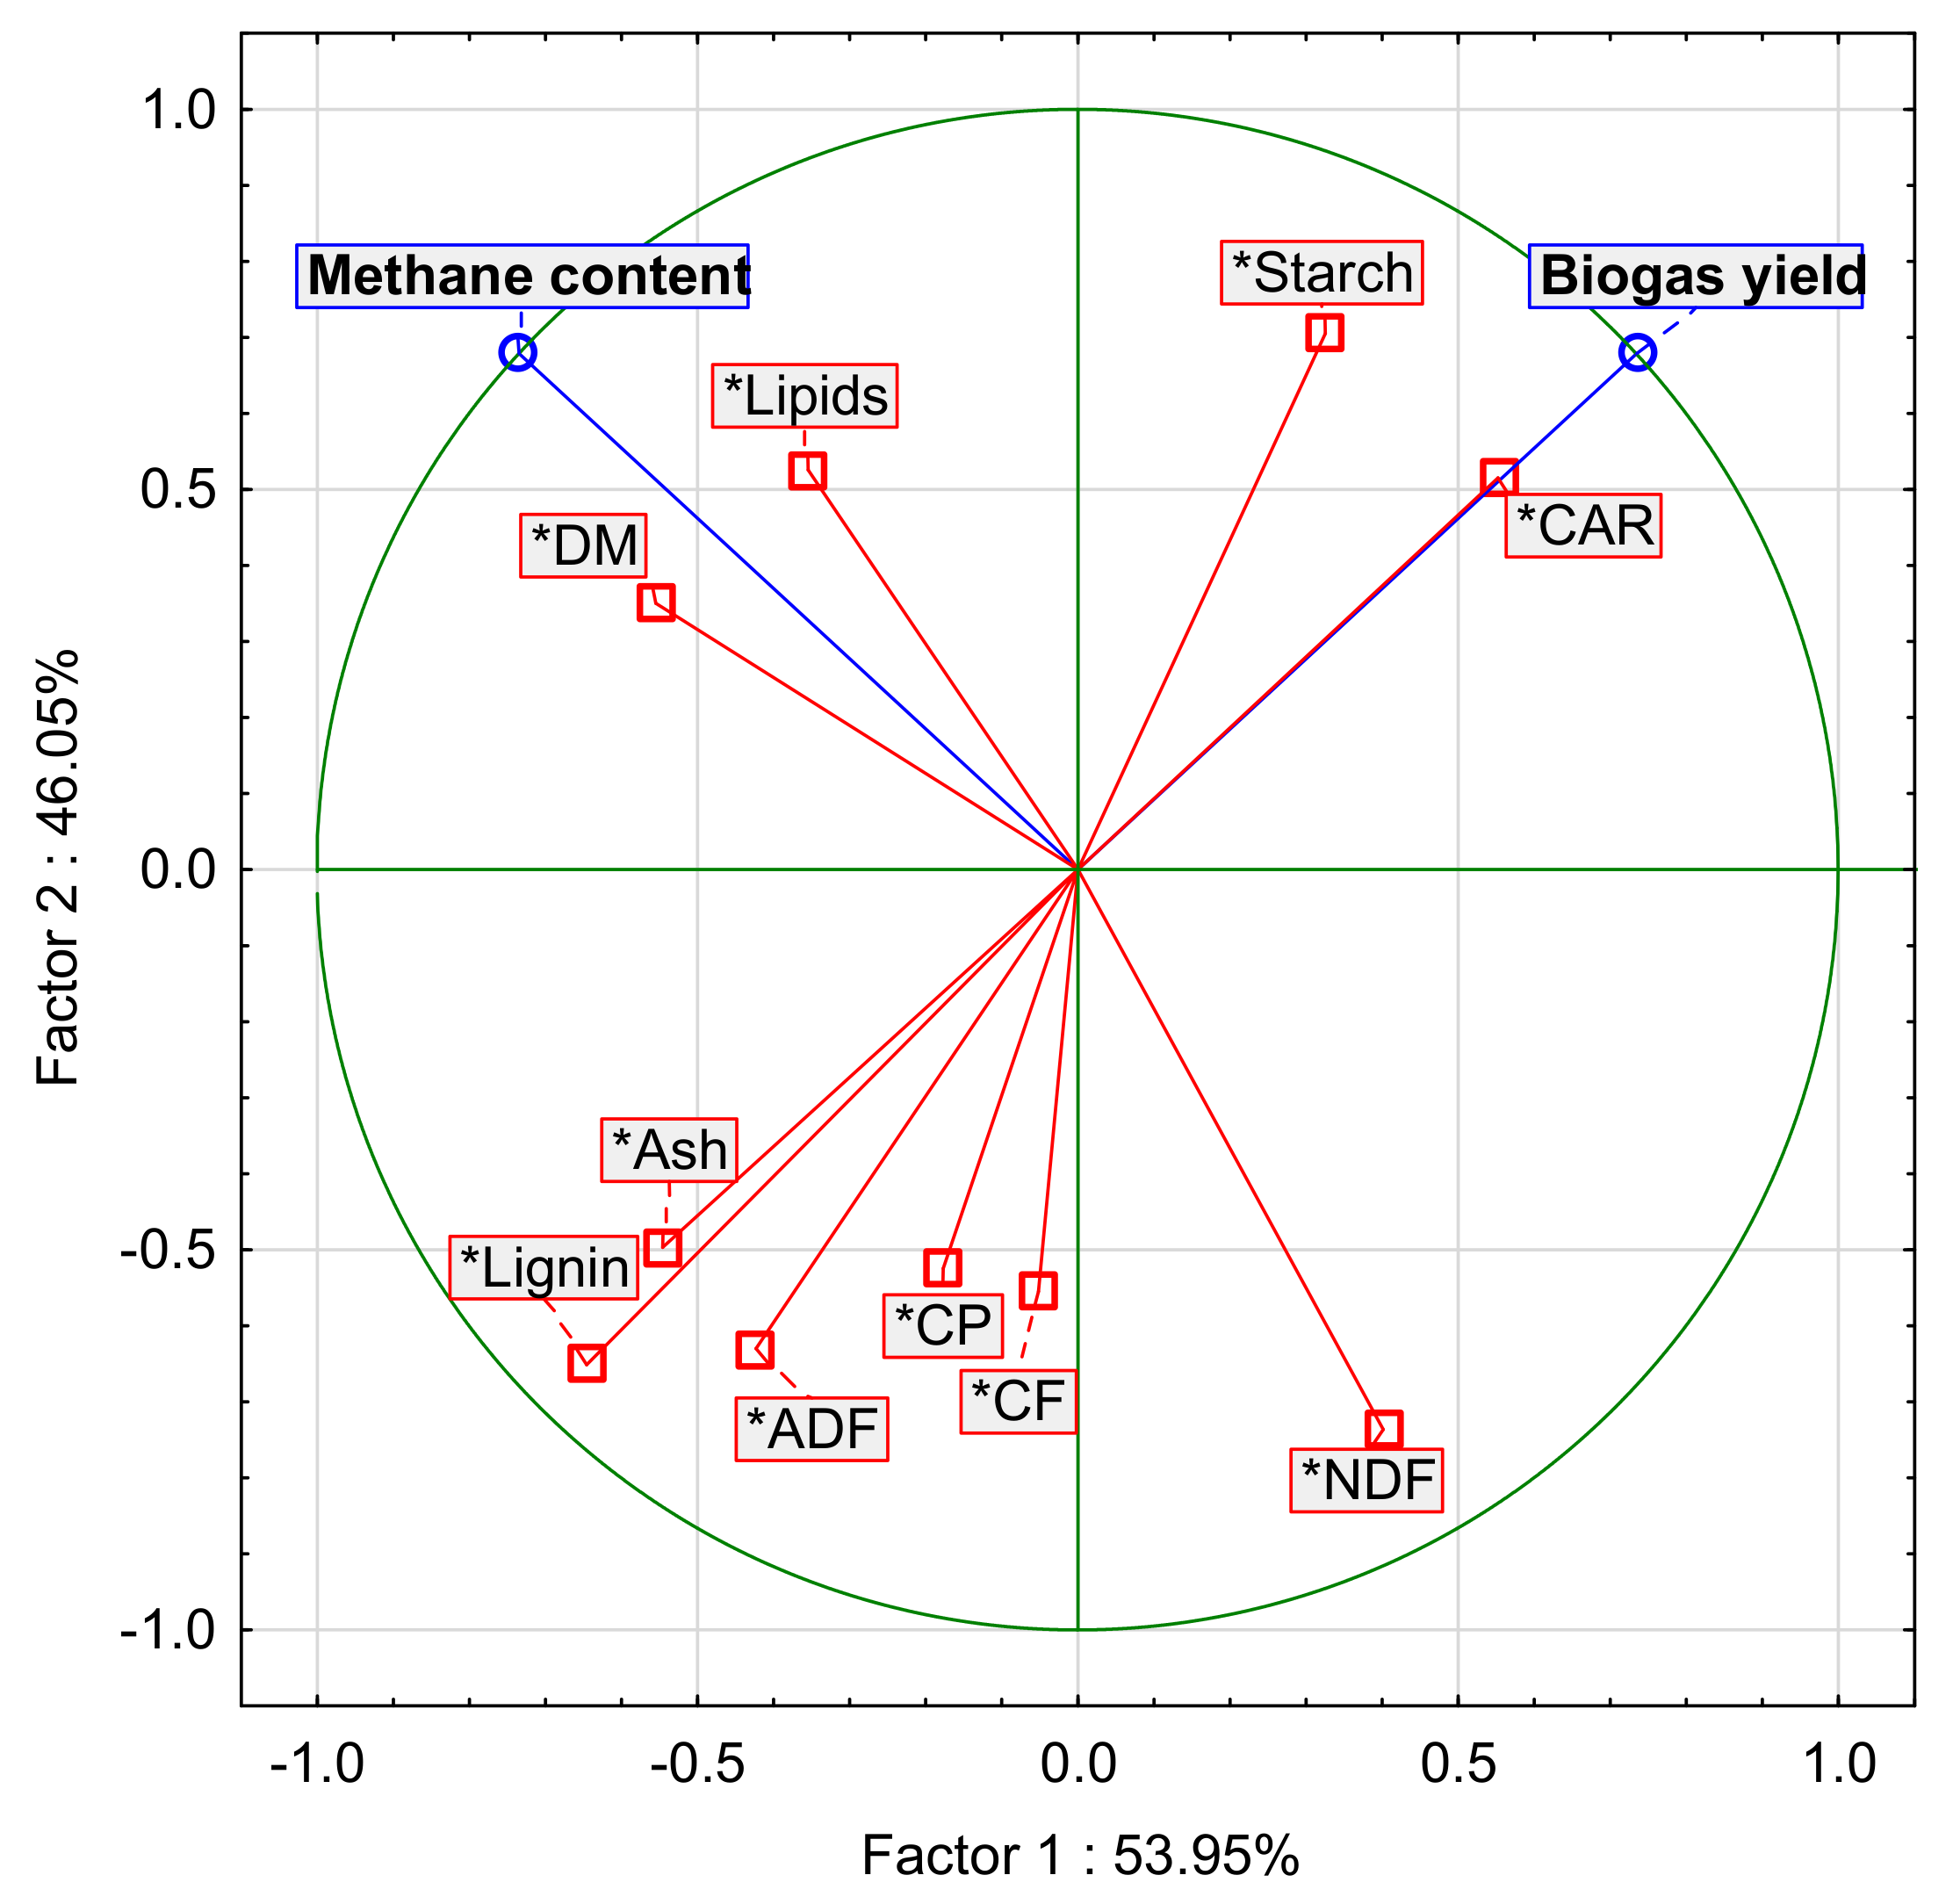
These two main factors (Factor 1 and Factor 2) explained more than 76.3% of the variability of measured values (Figure A3). Factor 1 could be identified as the main factor because it explained more than 52.6% of the variability; on the other hand, Factor 2 explained less than 23.7%. Following the analysis, Figure A2, Figure 9, and correlation of factors and variables (Table 14), it can be stated that Factor 1 represented biogas production and related parameters. Factor 1 strongly positively correlated with the biogas yield as well as with the content of CAR and starch, and strongly negatively correlated with the contents of ash, NDF, ADF, CF, and lignin. Factor 2 represented methane content and related parameters. Parameters strongly positively correlating with Factor 2 included methane content and DM, and negatively correlating with Factor 2 were NDF, biogas yield, and, more weakly, CF. Factor 3 strongly negatively correlated only with the content of CP (R = −0.92).
Figure 9 presents merged projection of averages for individual variants from three replications into the factor plane and factor loads of individual parameters, and represents a comprehensive view of interactions among the monitored parameters and biogas yield and methane content in the respective variants of silage. If the projections of individual variants occur in the factor plane near some silage parameters, it indicates that the parameters have in these variants an influence on biogas yield and methane content, which is directly proportional to their distance where the projection of this influence can be a vector of the effects of the given parameters on several silage variants at the same time, which should be taken into account in the analysis.
The graphical illustration in Figure 9 shows that biogas yield was positively affected by the amount of CAR and starch in the silage. At the same time, it can be seen that the projections of variants MA-100 and MA-93+WSC-7 occurring similarly as the above-mentioned parameters CAR and starch, in the positive zone of the X-axis (Factor 1), exhibited the highest biogas yield. On the other hand, the projections of the variants of legume monosubstrates except for LU-100 occur in Figure 9 in the negative zone of the X-axis (Factor 1), which corresponds to the layout of parameters ash, ADF, and lignin—these parameters had a negative influence on biogas yield, and this is why the variants of legume monosubstrates exhibited the lowest biogas yield.
In the positive zone of the Y-axis Y (Factor 2) in Figure 9, there are parameters methane content, DM, and lipids. In the same zone, there are projections of the silage variants of mixed cultures MA-95+LU-5, MA-77+FB-23, and monosubstrate FB-100, which exhibited the highest methane content and high DM values as well as variant MA-77+FB-23 and content of lipids. High values of DM were also exhibited with WSC-containing substrates. However, a decisive role was apparently played with the fact that variants MA-95+LU-5, MA-77+FB-23, and FB-100 had the statistically significantly lowest content of NDF as compared with the other experimental substrates including substrates with WSC. The zone under the X-axis then contains the projection of variants with a higher content of NDF and lower methane content (MA-100, WSC-100, LU-100) and lipids except for WSC-100. A strong positive dependence existed between parameters methane content and lipids (R = 0.65), while a strong negative dependence existed between parameters methane content together with lipids and parameter NDF (R = −0.79; R = −0.89).
The above analysis can be summarized as follows: nearly none or just a very low negative dependence existed between the value of biogas yield on the one hand and the methane content on the other hand (Figure 9, Table 12 and Table 13). Biogas yield was positively determined with the higher content of CAR and starch in silage and negatively with the high content of ash, ADF, and lignin. These substances had only a minimum or no influence on the methane content, the values of which were positively determined with the higher DM value and with the higher content of lipids as well as with the significantly negatively high content of NDF. Similar conclusions, i.e., the negative action of increased contents of ADF, ash, and lignin on the production of biogas, were also published by Amon et al. [60], Zsubori et al. [50], and Herrmann et al. [52].

4. Conclusions

Our study dealing with possibilities for biogas production from mixed silages of maize and legumes showed mixed effects. Compared with other similar works, a novel contribution of this study was the testing of less common alternative legume species in mixed cultures with maize, grown for the production of biogas in terms of their usability in environment-friendly management of agricultural soils in order to prevent soil erosion and impairment of soil quality as well as in terms of research on the effect of legumes in silage made from the mixed culture on the quality and amount of biogas production.
There were three basic goals: (a) How the quality of biogas produced will be affected by silages made from the mixed culture? (b) What is the production of biogas from silages of mixed cultures as compared with the pure maize silage? (c) Was the quality of silage affected by the biomass of legumes in the silage? Next, the zero hypothesis was tested from a statistical point of view. The three basic goals can be answered as follows:
(A)
The representation of legumes had a demonstrable influence on biogas quality only in the case of lupine.
(B)
There were differences found in the production of biogas. Silages made of a mixed culture exhibited biogas production lower by, on average, 6%.
(C)
Alternative silages that include legumes in addition to the dominant Zea mays exhibit other qualitative indicators, especially in the contents of starch, CAR, and lipids with a positive influence on biogas production, and ash, ADF, NDF, and lignin, which inhibit the process of methanogenesis and hence biogas production. Legumes in silages had a positive influence on the increased content of N-substances (for example, lipids) while their presence reflected negatively in the increased contents of ash and NDF as compared with the pure maize silage, i.e., worse degradable substances unsuitable for biogas production. The measured data show, however, that the biogas production decreased only by 6% and the increased presence of ash and NDF was probably partly compensated with the increased content of lipids.
The H0 hypothesis was not confirmed. Comparing the production of biogas related to unit area, no statistically significant higher biogas production from the mixed substrates of maize silage with legumes was recorded as compared with the biogas production from the monosubstrate of maize silage (MA-100). Compared with the maize silage monosubstrate (MA-100), the production of biogas from the mixed substrates was 12% lower in MA-95+LU-5, 9% lower in MA-93+WSC-7, and 13% lower in MA-77+FB-23.
The effect on biogas quality in terms of increased methane concentration in biogas was confirmed for the mixed samples of silage with admixed legumes. In the samples MA-95+LU-5, MA-93+WSC-7, and MA-77+FB-23, the methane concentration increase ranged from 2.6%vol to 6.9%vol.

Author Contributions

Conceptualization, A.K., I.H. and J.E.; methodology, A.K., I.H., T.V. and J.E.; validation, A.K., I.H., T.V., M.B., J.S., T.H., M.V., J.H., V.S. and J.E.; formal analysis, A.K., I.H., J.S., T.V., M.V. and J.E.; investigation, A.K., I.H., T.V., V.S. and J.E.; resources, A.K. and V.S.; data curation, A.K., I.H. and T.V.; writing—original draft preparation, A.K., I.H., T.V. and V.S.; writing—review and editing, V.S. and J.E.; visualization, A.K., I.H., J.S. and J.E.; supervision, A.K., T.V. and J.E.; project administration, A.K. and V.S.; funding acquisition, A.K. and V.S. All authors have read and agreed to the published version of the manuscript.

Funding

The research was supported by the Ministry of Agriculture of the Czech Republic within the frame of the Long-Term Conception of the Development of the Research Organization Agricultural Research, Ltd. Troubsko and National Agency for Agricultural Research (NAZV), Project: Innovation of maize cropping systems using intercrops to reduce soil degradation and improve water management in changing climate, registration no. QK1910334.

Data Availability Statement

The data are available on request from the corresponding authors.

Conflicts of Interest

Authors Antonín Kintl, Igor Huňady, Julie Sobotková, Jakub Elbl are from Company Agricultural Research, Ltd., Zahradní 1, 664 41 Troubsko, Czech Republic, Company Agricultural Research, Ltd., Zahradní 1, 664 41 Troubsko, Czech Republic had no role in the design of the study; in the collection, analyses, or interpretation of date; in the writing of manuscript, and in the decision to publish the results.

Appendix A. Design of the Field Experiment

Figure A1. Scheme of sampling at harvest. The maize and legume crops were harvested at all times only in the middle part (a) of the respective repetition of each variant. The part is highlighted with red hatching in the scheme. First, the selected plot of maize (a) was harvested using the cutter Deutz-Fahr MH 650 s (b). The prepared maize shreddings were mixed (c). The homogenized matter was sampled (d) for laboratory analyses (modified according to Kintl et al. 2023 [39]—article moldy silages).
Agronomy 13 02775 g0a1

Appendix B. PCA and Factor Analysis

Figure A2. Graph of eigenvalues.
Agronomy 13 02775 g0a2
Figure A3. PCA. Projection of variables on the factor plane (1 × 2).
Agronomy 13 02775 g0a3

References

  1. Wahid, R.; Feng, L.; Cong, W.-F.; Ward, A.J.; Møller, H.B.; Eriksen, J. Anaerobic mono-digestion of lucerne, grass and forbs—Influence of species and cutting frequency. Biomass Bioenerg. 2018, 109, 199–208. [Google Scholar] [CrossRef]
  2. Herrmann, A. Biogas Production from Maize: Current State, Challenges and Prospects. 2. Agronomic and Environmental Aspects. Bioenerg. Res. 2013, 6, 372–387. [Google Scholar] [CrossRef]
  3. Czubaszek, R.; Wysocka-Czubaszek, A.; Wichtmann, W.; Zając, G.; Banaszuk, P. Common Reed and Maize Silage Co-Digestion as a Pathway towards Sustainable Biogas Production. Energies 2023, 16, 695. [Google Scholar] [CrossRef]
  4. Solinas, S.; Fazio, S.; Seddaiu, G.; Roggero, P.P.; Deligios, P.A.; Doro, L.; Ledda, L. Environmental consequences of the conversion from traditional to energy cropping systems in a mediterranean area. Eur. J. Agron. 2015, 70, 124–135. [Google Scholar] [CrossRef]
  5. Stinner, P.W.; Deuker, A.; Schmalfuß, T.; Brock, C.; Rensberg, N.; Denysenko, V.; Trainer, P.; Möller, K.; Zang, J.; Janke, L.; et al. Perennial and Intercrop Legumes as Energy Crops for Biogas Production. In Legumes for Soil Health and Sustainable Management; Meena, R., Das, A., Yadav, G., Lal, R., Eds.; Springer Nature Singapore Pte Ltd.: Singapore, 2018; pp. 139–171. [Google Scholar] [CrossRef]
  6. Hauggaard-Nielsen, H.; Jensen, E.S. Facilitative root interactions in intercrops. Plant Soil. 2005, 274, 237–250. [Google Scholar] [CrossRef]
  7. Ofori, F.; Stern, W.R. Relative sowing time and density of component crops in a maize/cowpea intercrop system. Exp. Agric. 1987, 23, 41–52. [Google Scholar] [CrossRef]
  8. Brooker, R.W.; Bennett, A.E.; Cong, W.-F.; Daniell, T.J.; George, T.S.; Hallett, P.D.; Hawes, C.; Iannetta, P.P.M.; Jones, H.G.; Karley, A.J.; et al. Improving intercropping: A synthesis of research in agronomy, plant physiology and ecology. New Phytol. 2015, 206, 107–117. [Google Scholar] [CrossRef] [PubMed]
  9. Kumawat, A.; Bamboriya, S.D.; Meena, R.S.; Yadav, D.; Kumar, A.; Kumar, S.; Raj, A.; Pradhan, G. Legume-based inter-cropping to achieve the crop, soil, and environmental health security. In Advances in Legumes for Sustainable Intensification, 1st ed.; Meena, R.S., Kumar, S., Eds.; Elsevier Inc.: Amsterdam, The Netherlands, 2022; pp. 307–328. [Google Scholar] [CrossRef]
  10. Landon, A.J. The “how” of the three sisters: The origins of agriculture in Mesoamerica and the human niche. Neb. Anthropol. 2008, 23, 110–124. [Google Scholar]
  11. Seran, T.H.; Brintha, I. Review on Maize based intercropping. J. Agron. 2010, 9, 135–145. [Google Scholar] [CrossRef]
  12. Fu, Z.; Chen, P.; Zhang, X.; Du, Q.; Zheng, B.; Yang, H.; Luo, K.; Lin, P.; Li, Y.; Pu, T.; et al. Maize-legume intercropping achieves yield advantages by improving leaf functions and dry matter partition. BMC Plant Biol. 2023, 23, 438. [Google Scholar] [CrossRef] [PubMed]
  13. Temperton, V.M.; Mwangi, P.N.; Scherer-Lorenzen, M.; Schmid, B.; Buchmann, N. Positive interactions between nitrogen-fixing legumes and four different neighbouring species in a biodiversity experiment. Oecologia 2007, 151, 190–205. [Google Scholar] [CrossRef] [PubMed]
  14. Roscher, C.; Schumacher, J.; Gubsch, M.; Lipowsky, A.; Weigelt, A.; Buchmann, N.; Schmid, B.; Schulze, E.-D. Using plant functional traits to explain diversity-productivity relationships. PLoS ONE 2012, 7, e36760. [Google Scholar] [CrossRef] [PubMed]
  15. Nabel, M.; Schrey, S.D.; Temperton, V.M.; Harrison, L.; Jablonowski, N.D. Legume Intercropping with the Bioenergy Crop Sida hermaphrodita on Marginal Soil Front. Plant Sci. 2018, 9, 905. [Google Scholar] [CrossRef]
  16. Stoltz, E.; Nadeau, E.; Wallenhammar, A.-C. Intercropping Maize and Faba Bean for Silage Under Swedish Climate Conditions. Agric. Res. 2013, 2, 90–97. [Google Scholar] [CrossRef]
  17. Rezaei-Chianeh, E.; Nassab, A.D.M.; Shakiba, M.R.; Ghassemi-Golezani, K.; Aharizad, S.; Shekari, F. Intercropping of maize (Zea mays L.) and faba bean (Vicia faba L.) at different plant population densities. Afr. J. Agric. Res. 2011, 6, 1786–1793. [Google Scholar] [CrossRef]
  18. Ondřej, M.; Huňady, I. Faba bean (Vicia faba L.) Breeding for Resistance to Anthracnose (Ascochyta fabae Speg.) in the Czech Republic. Czech J. Genet. Plant 2007, 43, 61–68. [Google Scholar] [CrossRef]
  19. Hutňan, M.; Špalková, M.; Bodík, I.; Kolesárová, N.; Lazor, M. Biogas Production from Maize Grains and Maize Silage. Pol. J. Environ. Stud. 2010, 19, 323–329. [Google Scholar]
  20. Mata-Alvarez, J.; Dosta, J.; Macé, S.; Astals, S. Codigestion of solid wastes: A review of its uses and perspectives including modeling. Crit. Rev. Biotechnol. 2011, 31, 99–111. [Google Scholar] [CrossRef] [PubMed]
  21. Popp, D.; Schrader, S.; Kleinsteuber, S.; Harms, H.; Sträuber, H. Biogas production from coumarin-rich plants—Inhibition by coumarin and recovery by adaptation of the bacterial community. FEMS Microbiol. Ecol. 2015, 91, fiv103. [Google Scholar] [CrossRef] [PubMed]
  22. Kadaňková, P.; Kintl, A.; Koukalová, V.; Kučerová, J.; Brtnický, M. Coumarin content in silages made of mixed cropping biomass comprising maize and white sweet clover. In Proceedings of the 19th International Multidisciplinary Scientific GeoConference SGEM, Vienna, Austria, 9–11 December 2019; SGEM: Sofia, Bulgaria, 2019; pp. 115–121. [Google Scholar] [CrossRef]
  23. Kintl, A.; Elbl, J.; Vítěz, T.; Brtnický, M.; Skládanka, J.; Hammerschmiedt, T.; Vítězová, M. Possibilities of using white sweetclover grown in mixture with maize for biomethane production. Agronomy 2020, 10, 1407. [Google Scholar] [CrossRef]
  24. Meena, R.S.; Lal, R. Legumes and Sustainable Use of Soils. In Legumes for Soil Health and Sustainable Management; Meena, R., Das, A., Yadav, G., Lal, R., Eds.; Springer Nature Singapore Pte Ltd.: Singapore, 2018; pp. 1–31. [Google Scholar] [CrossRef]
  25. Elbl, J.; Lukas, V.; Sobotková, J.; Huňady, I.; Kintl, A. Effect of Drought on the Development of Deschampsia caespitosa (L.) and Select-ed Soil Parameters during a Three-Year Lysimetric Experiment. Life 2023, 13, 745. [Google Scholar] [CrossRef]
  26. Mehlich, A. Mehlich III soil test extractant. Commun. Soil Sci. Plant Anal. 1984, 15, 1409–1416. [Google Scholar] [CrossRef]
  27. Brtnický, M.; Kintl, A.; Holatko, J.; Hammerschmiedt, T.; Mustafa, A.; Kucerik, J.; Vitez, T.; Prichystalova, J.; Baltazar, T.; Elbl, J. Effect of digestates derived from the fermentation of maize-legume intercropped culture and maize monoculture application on soil properties and plant biomass production. Chem. Biol. Technol. Agric. 2022, 9, 43. [Google Scholar] [CrossRef]
  28. Loučka, R.; Lang, J.; Jambor, V.; Nedělník, J.; Třináctý, J.; Tyrolová, Y.; Kučera, J. Verifikovaný Metodický Postup Získávání a Zpracování Hodnot v Národním Systému Hodnocení Silážních Hybridů Kukuřice; Uplatněná certifikovaná metodika 24/14; ZV spol. s r.o.: Troubsko, Czechia, 2014; 48p. [Google Scholar]
  29. Kintl, A.; Vítěz, T.; Elbl, J.; Vítězová, M.; Hammerschmiedt, T.; Nedělník, J.; Skládanka, J.; Brtnický, M. Mixed Culture of Corn and White Lupine as an Alternative to Silage Made from Corn Monoculture Intended for Biogas Production. BioEnergy Res. 2019, 12, 694–702. [Google Scholar] [CrossRef]
  30. Huňady, I.; Ondrisková, V.; Hutyrová, H.; Kubíková, Z.; Hammerschmiedt, T.; Mezera, J. Use of Wild Plant Species: A Potential for Methane Production in Biogas Plants. Int. J. Renew. Energy Res. 2021, 11, 920–932. [Google Scholar]
  31. Kintl, A.; Huňady, I.; Holátko, J.; Vítěz, T.; Hammerschmiedt, T.; Brtnický, M.; Ondrisková, V.; Elbl, J. Using the Mixed Culture of Fodder Mallow (Malva verticillata L.) and White Sweet Clover (Melilotus albus Medik.) for Methane Production. Fermentation 2022, 8, 94. [Google Scholar] [CrossRef]
  32. ČSN EN 15934. 2012. Available online: https://standards.iteh.ai/catalog/standards/cen/c7e440f9-c400-4318-8ee5-637e7f127c5d/en-15934-2012 (accessed on 20 December 2021).
  33. ČSN EN 15935. 2021. Available online: https://standards.iteh.ai/catalog/standards/cen/04a0cbb3-843f-466a-bb39-39217af45d51/en-15935-2021 (accessed on 20 December 2021).
  34. EN ISO 13906. 2008. Available online: https://standards.iteh.ai/catalog/standards/cen/e2f5874d-0a51-47c7-83f4-30373034cc91/en-iso-13906-2008 (accessed on 20 December 2021).
  35. ISO 20483. 2013. Available online: https://standards.iteh.ai/catalog/standards/iso/86350c42-b475-427b-b7b5-5a5772ed21cd/iso-20483-2013 (accessed on 20 December 2021).
  36. Priego-Capote, F.; Ruiz-Jiménez, J.; García-Olmo, J.; Luque de Castro, M.D. Fast method for the determination of total fat and trans fatty-acids content in bakery products based on microwave-assisted Soxhlet extraction and medium infrared spectroscopy detection. Anal. Chim. Acta 2004, 1–2, 13–20. [Google Scholar] [CrossRef]
  37. EN ISO 6865. 2000. Available online: https://standards.iteh.ai/catalog/standards/cen/884967a3-efbd-46ae-b7b1-a08305f76543/en-iso-6865-2000 (accessed on 20 December 2021).
  38. EN ISO 16472. 2006. Available online: https://standards.iteh.ai/catalog/standards/cen/ce0575c8-8035-4b7d-b757-96d5cbf4645f/en-iso-16472-2006 (accessed on 20 December 2021).
  39. Kintl, A.; Hammerschmiedt, T.; Vítěz, T.; Brtnický, M.; Vejražka, K.; Huňady, I.; Látal, O.; Elbl, J. Possibility of using tannins to control greenhouse gas production during digestate storage. Waste Manag. 2023, 156, 75–83. [Google Scholar] [CrossRef] [PubMed]
  40. Kintl, A.; Vítěz, T.; Huňady, I.; Brtnický, M.; Novák, D.; Lochman, J.; Vítězová, M.; Hammerschmiedt, T.; Holátko, J.; Elbl, J. Anaerobic Fermentation of Silage from the Above-Ground Biomass of Jerusalem Arti-choke (Helianthus tuberosus L.) and Maize (Zea mayse L.) as a New and Promising Input Raw Material for Biogas Production. Appl. Sci. 2022, 12, 11417. [Google Scholar] [CrossRef]
  41. Htet, M.N.S.; Soomro, R.N.; Bo, H. Effects of Different Planting Pattern of Maize (Zea mays L.) and Soybean (Glycine max (L.) Merrill) Intercropping in Resource Consumption on Fodder Yield, and Silage Quality. Am. J. Plant Sci. 2017, 8, 666–679. [Google Scholar] [CrossRef]
  42. Mead, R.; Willey, R. The Concept of a ‘Land Equivalent Ratio’ and Advantages in Yields from Intercropping. Exp. Agric. 1980, 16, 217–228. [Google Scholar] [CrossRef]
  43. Samarappuli, D.; Berti, M.T. Intercropping forage sorghum with maize is a promising alternative to maize silage for biogas production. J. Clean. Prod. 2018, 194, 515–524. [Google Scholar] [CrossRef]
  44. Boehmel, C.; Lewandowski, I.; Claupein, W. Comparing annual and perennial energy cropping systems with different management intensities. Agric. Syst. 2008, 96, 224–236. [Google Scholar] [CrossRef]
  45. Stinner, P.W. The use of legumes as a biogas substrate—Potentials for saving energy and reducing greenhouse gas emissions through symbiotic nitrogen fixation. Energy Sustain. Soc. 2015, 5, 4. [Google Scholar] [CrossRef]
  46. McDonald, P.; Edward, R.A.; Greenhalgh, J.F.D. Animal Nutrition; Longman: Hong Kong, China, 1987. [Google Scholar]
  47. Geren, H.; Avcioglu, R.; Soya, H.; Kir, B. Intercropping of Corn with Cowpea and Bean Biomass Yield and Silage Quality. Afr. J. Biotechnol. 2008, 7, 4100–4104. [Google Scholar]
  48. Papi, N.; Kafilzadeh, F.; Fazaeli, H. Effects of incremental substitution of maize silage with Jerusalem artichoke silage on performance of fat-tailed lambs. Small Rumin. Res. 2017, 147, 56–62. [Google Scholar] [CrossRef]
  49. Titei, V. Evaluation of the Biomass Quality of White Sweetclover, Melilotus albus, and Prospects of Its Use in Moldova. Sci. Papers Ser. A Agron. 2022, 65, 305–312. [Google Scholar]
  50. Zsubori, Z.T.; Pinter, J.; Spitko, T.; Hegyi, Z.; Marton, C.L. Yield and chemical composition of plant parts of silage maize (Zea mays L.) hybrids and their interest for biogas production. Maydica 2013, 58, 34–41. [Google Scholar]
  51. Mulka, R.; Szulczewski, W.; Szlachta, J.; Prask, H. The influence of carbon content in the mixture of substrates on methane production. Clean Technol. Environ. 2016, 18, 807–815. [Google Scholar] [CrossRef]
  52. Herrmann, C.; Idler, C.; Heiermann, M. Biogas crops grown in energy crop rotations: Linking chemical composition and methane production characteristics. Bioresour. Technol. 2016, 206, 25–35. [Google Scholar] [CrossRef] [PubMed]
  53. Tambara, A.A.C.; Sippert, M.R.; Jauris, G.C.; Flores, J.L.C.; Henz, É.L.; Velho, J.P. Production and chemical composition of grasses and legumes cultivated in pure form, mixed or in consortium. Acta Sci. Anim. Sci. 2017, 39, 235–241. [Google Scholar] [CrossRef]
  54. Jensen, C.; Weisbjerg, M.R.; Nørgaard, P.; Hvelplund, T. Effect of maize silage maturity on site of starch and NDF digestion in lactating dairy cows. Anim. Feed Sci. Technol. 2005, 118, 279–294. [Google Scholar] [CrossRef]
  55. Khan, N.A.; Cone, J.W.; Fievez, V.; Hendriks, W.H. Causes of variation in fatty acid content and composition in grass and maize silages. Anim. Feed Sci. Technol. 2012, 174, 6–45. [Google Scholar] [CrossRef]
  56. Mustafa, A.F.; Christensen, D.A.; McKinnon, J.J. Effects of Pea, Barley, and Alfalfa Silage on Ruminal Nutrient Degradability and Performance of Dairy Cows. J. Dairy Sci. 2000, 83, 2859–2865. [Google Scholar] [CrossRef] [PubMed]
  57. Pettersson, K.L.; Lindgren, S. The influence of the carbohydrate fraction and additives on silage quality. Grass Forage Sci. 1990, 45, 223–233. [Google Scholar] [CrossRef]
  58. Reeves, J.B. Relationships Between Crude Protein and Determination of Nondispersible Lignin. J. Dairy Sci. 1997, 80, 692–699. [Google Scholar] [CrossRef]
  59. Sowa-Borowiec, P.; Jarecki, W.; Dzugan, M. The Effect of Sowing Density and Different Harvesting Stages on Yield and Some Forage Quality Characters of the White Sweet Clover (Melilotus albus). Agriculture 2022, 12, 575. [Google Scholar] [CrossRef]
  60. Amon, T.; Amon, B.; Kryvoruchko, V.; Bodiroza, V.; Pötsch, E.; Zollitsch, W. Optimising methane yield from anaerobic digestion of manure: Effects of dairy systems and of glycerine supplementation. Int. Congr. Ser. 2006, 1293, 217–220. [Google Scholar] [CrossRef]
  61. Popp, D.; Plugge, C.M.; Kleinsteuber, S.; Harms, H.; Sträuber, H. Inhibitory Effect of Coumarin on Syntrophic Fatty Acid-Oxidizing and Methanogenic Cultures and Biogas Reactor Microbiomes. Appl. Environ. Microb. 2017, 83, e00438-17. [Google Scholar] [CrossRef]
  62. Abraham, E.M.; Ganopoulos, I.; Madesis, P.; Mavromatis, A.; Mylona, P.; Nianiou-Obeidat, I.; Parissi, Z.; Polidoros, A.; Tani, E.; Vlachostergios, D. The Use of Lupin as a Source of Protein in Animal Feeding: Genomic Tools and Breeding Approaches. Int. J. Mol. Sci. 2019, 20, 851. [Google Scholar] [CrossRef]
Figure 1. Experimental field location (marked with red hatching) within the Czech Republic.
Agronomy 13 02775 g001
Figure 2. The course of selected meteorological parameter in the Vatín field experimental station during the period (1981–2010) and in experimental year 2018. The values of average monthly temperatures and precipitation amounts are presented.
Agronomy 13 02775 g002
Figure 3. Establishment of the experimental stand.
Agronomy 13 02775 g003
Figure 4. Arrangement of the stand of mixed cultures (modified according to Brtnický et al. [27]). Red arrows represent the distance between individual plants. The value of this distance is shown in the upper right corner of Figure 4.
Agronomy 13 02775 g004
Figure 5. Scheme of micro-fermentors measuring biogas production and composition according to Kintl et al. [39]. (A) water bath; (B) illustration of the connection of the fermenter to the gas tank, gas analyzer and expansion tank; (C) equipment placed in the laboratory.
Agronomy 13 02775 g005
Figure 6. Production of biogas (m3/kgVS) during the laboratory experiment (duration = 21 days, average values for each day of measurement are shown, n = 3 for one measurement, ±SD). MA—Maize, LU—Lupine, WSC—White Sweet Clover, FB—Faba Bean.
Agronomy 13 02775 g006
Figure 7. Biogas yield—calculation on the basis of the yield of dry biomass (average of measured values, n = 3 ± SD). The statistical significant differences (p < 0.05) are illustrated with different capital letters. MA—Maize, LU—Lupine, FB—Faba bean, WSC—White sweet clover.
Agronomy 13 02775 g007
Figure 8. Chemical composition of biogas—content of methane (%) during the laboratory experiment (duration = 21 days, average values for each day of measurement, n = 3 for one measurement, ±SD). MA—Maize, LU—Lupine, WSC—White Sweet Clover, FB—Faba Bean.
Agronomy 13 02775 g008
Figure 9. PCA and factor analysis. Projection of cases (variants) into the factor plane (Factor 1/Factor 2); load factor, Factor 1/Factor 2. Extraction: Main components. MA—Maize, LU—Lupine, WSC—White Sweet Clover, FB—Faba Bean.
Agronomy 13 02775 g009
Table 1. Basic agro-chemical parameters of topsoil from the experimental field (represented as mean ± SD; for n = 9)—average contents of plant available nutrients).
SampleSoil Reaction (pH)Plant Available Nutrient Content (mg/kg)
PKCaMg
Topsoil5.995 ± 4.7246 ± 39.41271 ± 64.7135 ± 17.0
Plant available nutrients were extracted from the soil using Mehlich III extractant [26]. Contents of individual nutrients were established as follows: (a) K, Ca, and Mg were established in Mehlich III solution using atomic absorption spectrometry, (b) P was established colorimetrically.
Table 2. Plants used for the mixed cropping system in 2018.
Tested Plants
White sweet cloverMelilotus albus Med.
Broad beanVicia faba L.
White lupineLupinus albus L.
MaizeZea mays L.
Table 3. Types of prepared silages.
VariantMaize in SilageLegume Crop in SilageAverage Density of Silage in Dry Matter
% w/w% w/wkg/m3
Maize1000120.27
Maize + White sweet clover937251.73
Maize + Faba bean7723121.25
Maize + White lupine955119.15
White lupine010095.17
White sweet clover010098.12
Faba bean0100120.06
Table 4. Determination of silage quality parameters.
ParameterMethod
DM and VSCSN EN 15934 [32]; CSN EN 15935 [33]
N-substancesKjeldahl method (ISO 20483:2013) [35]; the content of protein was measured with the KjeltecTM 2300 analyser (FOSS Analytical, Hillerød, Denmark) by multiplying the content of nitrogen with 6.25. The Priego-Capote et al. [36] method was used to determine the fat content using the water-cooled extractor BEHR 6 (behr Labor-Technik GmbH, Düsseldorf, Germany).
CFCSN EN ISO 6865 [37]
ADFCSN EN ISO 13906 [34]
ADLCSN EN ISO 13906 [34]
NDFCSN EN ISO 16472 [38]
DM—dry matter, vs.—volatile solids, CF—crude fiber, ADF—acid detergent fiber, ADL—acid detergent lignin, NDF—neutral detergent fiber.
Table 5. Characteristic of inoculum used for the laboratory biomethanion batch test.
VariantValue
Source of inoculumBiogas station: Čejč, Czech Republic; input raw material—maize silage and slurry; mesophilic temperature conditions (38 °C)
Dry matter (%)3.96 ± 0.09
Volatile solids (%)67.85 ± 0.19
pH7.3
FOS (mg/L)751
TAC (mg/L)2050
NH4+ (mg/L)684
Table 6. Parameters of biomethanion batch (methane yield) test according to Kintl et al. [40].
VariantValue
Fermentor volumeTotal volume: 5 dm3; working volume: 3 dm3
Temperature (°C); heating method 40 °C ± 0.2 °C; water bath
MixingManually; daily
Retention period (day)21
Dose of silage (g)50–53
Ratio inoculum vs. substrate (I/S)4.5–4.9, based on vs. content
Methods of measuring biogas productionStandard VDI 4630
Method of measuring biogas compositionGas analyzer Dräger X-am 8000; infrared sensors for CH4 and CO2, mixture of gases (60% CH4/40% CO2) used as calibration gas
Number of repetitionsThree for each silage sample
Table 7. Fresh matter—yield parameters of one variant of monoculture and three variants of mixed cultures (maize, lupine, Faba bean, and white sweet clover).
VariantFresh Matter Yield
MaizeLegumeMaize + Legume Total
t/ha ± SDHSDt/ha ± SDHSDt/ha ± SDHSD%
MA-10061.34 ± 3.71A--61.34 ± 3.71A100
MA-95+LU-552.31 ± 10.6A5.81 ± 0.41A58.12 ± 10.81A95
MA-77+FB-2355.88 ± 7.46A6.00 ± 0.68A61.88 ± 7.51A101
MA-93+WSC-756.15 ± 7.45A3.76 ± 1.12A59.91 ± 7.15A98
The average of measured values (n = 3) is shown ± standard deviation (SD). MA—Maize, LU—Lupine, WSC—White Sweet Clover, FB—Faba Bean. Different letters indicate significant differences (p < 0.05) between individual variants in the specific parameter.
Table 8. Dry matter—yield parameters of one variant of monoculture and three variants of mixed cultures of maize, lupine, bean, and white sweet clover.
VariantDry Matter ContentDry Matter Yield
MaizeLegumeMaizeLegumeMaize + Legume Total
(%)(%)t/ha ± SDHSDt/ha ± SDHSDt/ha ± SDHSD%
MA-10026.9 16.50 ± 1.00A 16.50 ± 1.00A100
MA-95+LU-527.127.614.18 ± 2.87A1.60 ± 0.11A15.78 ± 2.93A96
MA-77+FB-2327.521.815.37 ± 2.05A1.31 ± 0.15B16.68 ± 2.06A101
MA-93+WSC-728.029.115.72 ± 2.08A1.09 ± 0.33B16.82 ± 2.00A102
The average of measured values (n = 3) is shown ± standard deviation (SD). MA—Maize, LU—Lupine, WSC—White Sweet Clover, FB—Faba Bean. Different letters indicate significant differences (p < 0.05) between individual variants in the specific parameter.
Table 9. DM, Ash, NDF, ADF, and CF contents in the individual silage types.
No.VariantDMAshNDFADFCF
% ± SDHSD%DM ± SDHSD%DM ± SDHSD%DM ± SDHSD%DM ± SDHSD
1MA-10021.23 ± 0.06E4.90 ± 0.04G58.11 ± 0.17B27.68 ± 0.25F23.48 ± 0.58C
2MA-95+LU-525.96 ± 0.21D6.28 ± 0.01D54.66 ± 0.05E38.85 ± 0.11C25.24 ± 0.04B
3MA-93+WSC-729.43 ± 0.09A5.93 ± 0.11E55.54 ± 0.29D30.87 ± 0.15E24.47 ± 0.90BC
4MA-77+FB-2328.85 ± 0.20B5.68 ± 0.01F50.07 ± 0.14G29.57 ± 0.62E24.14 ± 0.09BC
5LU-10021.54 ± 0.15E9.83 ± 0.13A61.57 ± 0.17A47.97 ± 0.65A29.57 ± 0.64A
6WSC-10028.44 ± 0.20BC6.82 ± 0.03C56.16 ± 0.07C41.43 ± 1.28B24.96 ± 0.05BC
7FB-10027.95 ± 0.29C9.50 ± 0.06B53.93 ± 0.16F35.34 ± 0.68D23.91 ± 0.67BC
The average of measured values (n = 3) is shown ± standard deviation (SD). MA—Maize, LU—Lupine, WSC—White Sweet Clover, FB—Faba Bean. Different letters indicate significant differences (p < 0.05) between individual variants in the specific parameter. DM—Dry matter, NDF—Neutral detergent fiber, ADF—Acido-detergent fiber, CF—Crude fiber.
Table 10. Contents of starch, CAR, CP, lignin, and lipids in the individual silage types.
No.VariantStarchCARCPLigninLipids
%DM ± SDHSD%DM ± SD %DM ± SDHSD%DM ± SDHSD%DM ± SDHSD
1MA-10019.83 ± 0.01A12.37 ± 2.77A15.6 ± 0.38B3.43 ± 0.03D2.24 ± 0.10D
2MA-95+LU-513.82 ± 0.02C6.88 ± 0.65BC10.71 ± 0.13D5.15 ± 0.08C2.44 ± 0.04C
3MA-93+WSC-74.39 ± 0.01E9.96 ± 0.13AB11.66 ± 0.79D3.58 ± 0.09D1.91 ± 0.02E
4MA-77+FB-2317.66 ± 0.20B12.68 ± 0.25A11.31 ± 0.12D3.56 ± 0.11D3.56 ± 0.02A
5LU-1003.11 ± 0.02F3.30 ± 0.69D13.74 ± 0.26C7.63 ± 0.13A1.13 ± 0.03F
6WSC-1000.39 ± 0.01G6.51 ± 0.65CD15.42 ± 0.12B7.09 ± 0.03B2.78 ± 0.03B
7FB-10010.92 ± 0.03D4.54 ± 0.78CD17.36 ± 0.25A7.22 ± 0.13B2.53 ± 0.01C
The average of measured values (n = 3) is shown ± standard deviation (SD). MA—Maize, LU—Lupine, WSC—White Sweet Clover, FB—Faba Bean. Different letters indicate significant differences (p < 0.05) between individual variants in the specific parameter. CAR—Carbohydrates, CP—Crude Protein.
Table 11. Differences in biogas yield after 21 days of the laboratory experiment.
No.VariantBiogas Yield
m3/kgVSHSD
1MA-1000.923 ± 0.027A
2MA-95+LU-50.815 ± 0.023B
3MA-93+WSC-70.840 ± 0.015B
4MA-77+FB-230.804 ± 0.017B
5LU-1000.595 ± 0.008C
6WSC-1000.497 ± 0.005D
7FB-1000.593 ± 0.010C
The average of measured values (n = 3) is shown ± standard deviation (SD). MA—Maize, LU—Lupine, WSC—White Sweet Clover, FB—Faba Bean. Different letters indicate significant differences (p < 0.05) between individual variants in biogas yield.
Table 12. Differences in chemical composition of biogas after 21 days of the laboratory experiment.
No.VariantMethane Content
%HSD
1MA-10063.5 ± 0.6C
2MA-95+LU-570.4 ± 1.1A
3MA-93+WSC-766.2 ± 0.2B
4MA-77+FB-2369.7 ± 0.5A
5LU-10064.0 ± 0.2C
6WSC-10066.5 ± 0.2B
7FB-10070.3 ± 0.9A
Mean of measured values (n = 3) is shown ± standard deviation (SD). MA—Maize, LU—Lupine, WSC—White Sweet Clover, FB—Faba Bean. Different letters indicate significant differences (p < 0.05) between individual variants in methane content in biogas.
Table 13. Results of PCA—Correlation matrix: summary of correlations between the measured variables.
VariablesDMAshNDFADFCFLigninCPStarchCARLipidsBiogas YieldMethane Content
DM1.00−0.14−0.76−0.25−0.45−0.11−0.21−0.230.120.59−0.170.65
Ash−0.141.000.370.720.620.880.42−0.49−0.87−0.47−0.740.06
NDF−0.760.371.000.560.650.410.29−0.43−0.45−0.89−0.20−0.79
ADF−0.250.720.561.000.830.860.08−0.68−0.84−0.51−0.74−0.12
CF−0.450.620.650.831.000.56−0.15−0.52−0.59−0.68−0.41−0.34
Lignin−0.110.880.410.860.561.000.50−0.63−0.91−0.34−0.920.03
CP−0.210.420.290.08−0.150.501.00−0.11−0.33−0.10−0.49−0.23
Starch−0.23−0.49−0.43−0.68−0.52−0.63−0.111.000.610.450.720.24
CAR0.12−0.87−0.45−0.84−0.59−0.91−0.330.611.000.510.76−0.06
Lipids0.59−0.47−0.89−0.51−0.68−0.34−0.100.450.511.000.100.62
Biogas yield−0.17−0.74−0.20−0.74−0.41−0.92−0.490.720.760.101.00−0.08
Methane content0.650.06−0.79−0.12−0.340.03−0.230.24−0.060.62−0.081.00
Statistical significant correlation (p < 0.05) is illustrated with red color.
Table 14. Results of factor analysis. Load Factor, Factor 1/Factor 2/Factor 3.
VariablesFactor (1)Factor (2)Factor (3)
DM0.360.790.22
Ash−0.840.30−0.11
NDF−0.73−0.66−0.08
ADF−0.910.130.27
CF−0.82−0.230.44
Lignin−0.890.39−0.17
CP−0.370.09−0.92
Starch0.72−0.22−0.25
CAR0.91−0.31−0.02
Lipids0.700.58−0.14
Biogas yield0.76−0.560.17
Methane content0.320.820.16
Statistical significant correlation (p < 0.05) is illustrated with red color.
Disclaimer/Publisher’s Note: The statements, opinions and data contained in all publications are solely those of the individual author(s) and contributor(s) and not of MDPI and/or the editor(s). MDPI and/or the editor(s) disclaim responsibility for any injury to people or property resulting from any ideas, methods, instructions or products referred to in the content.