1. Introduction
It is expected that the world population will increase about 30% and reach more than 9 billion of habitants by 2050. Consequently, the food demand will increase 70% and human consumption of animal products will double from 258 to 455 million tons [
1]. In order to find solutions for this problem, livestock farming systems need to increase production through intensive systems [
2]. However, intensive production systems, currently face enormous challenges due to environmental impacts and public opinion. In fact, these production systems, characterized by high animal density, are often seen as inappropriate to animal health and welfare. It is important to raise awareness in the animal production sector about the need to accurately monitor animal welfare conditions within the facilities used in the intensive systems.
One of the most important aspects in the definition of animal welfare is the housing environmental conditions. Environmental control systems in animal housing are very important tools to provide adequate conditions to attain good productivity and animal welfare [
3,
4]. However, environmental control of livestock facilities is typically based on rates/balance of heat and moisture production at predetermined ambient temperature levels. The traditional control methodology cannot reflect the real animal’s needs since it does not account for some important environmental, physiological and behaviour factors (such as air quality, animal body surface temperature or animal feed intake).
In this sense, one of the main challenges for intensive production systems is to monitor and control not only the environmental conditions (microclimate and emissions), but also the growth, behaviour, productivity and health (diseases) of the animals in large groups [
5,
6,
7].
Precision livestock farming (PLF), defined as the application of engineering processes in livestock management technologies [
8], offers many innovative technologies and tools through which the animal response to housing environmental conditions can be continuously observed, monitored and controlled.
PLF has used technological equipment (sensors, microphones and video cameras, thermographic cameras, automatic scales, automatic feed stations, etc.) since the beginning of the 21st century [
9]. The information provided through this equipment can be subject to monitoring, allowing to demonstrate animal’s feedback in relation to the environment, which can help farmers to control the productive process and management decisions [
6,
9]. The use of these technologies can also reduce production costs and make production systems more competitive and more animal and environment friendly [
5].
The main goal of the AWARTECH project was to develop a new tool (AWARTECH Smart Sensing platform) that would respond in real time to the environmental needs of animals through physiological, behaviour and productive indicators using smart-sensing technologies.
2. Materials and Methods
The project was designed considering two phases: (1) The first phase was executed in the environmental control room of the experimental farm of Évora University. The main goal was to test and to validate a set of equipment and parameters in order to develop a technological platform prototype. (2) In the second phase, the prototype developed was tested and evaluated in a commercial pig facility, where the animals were subjected to real environmental conditions. These data are not presented in this paper.
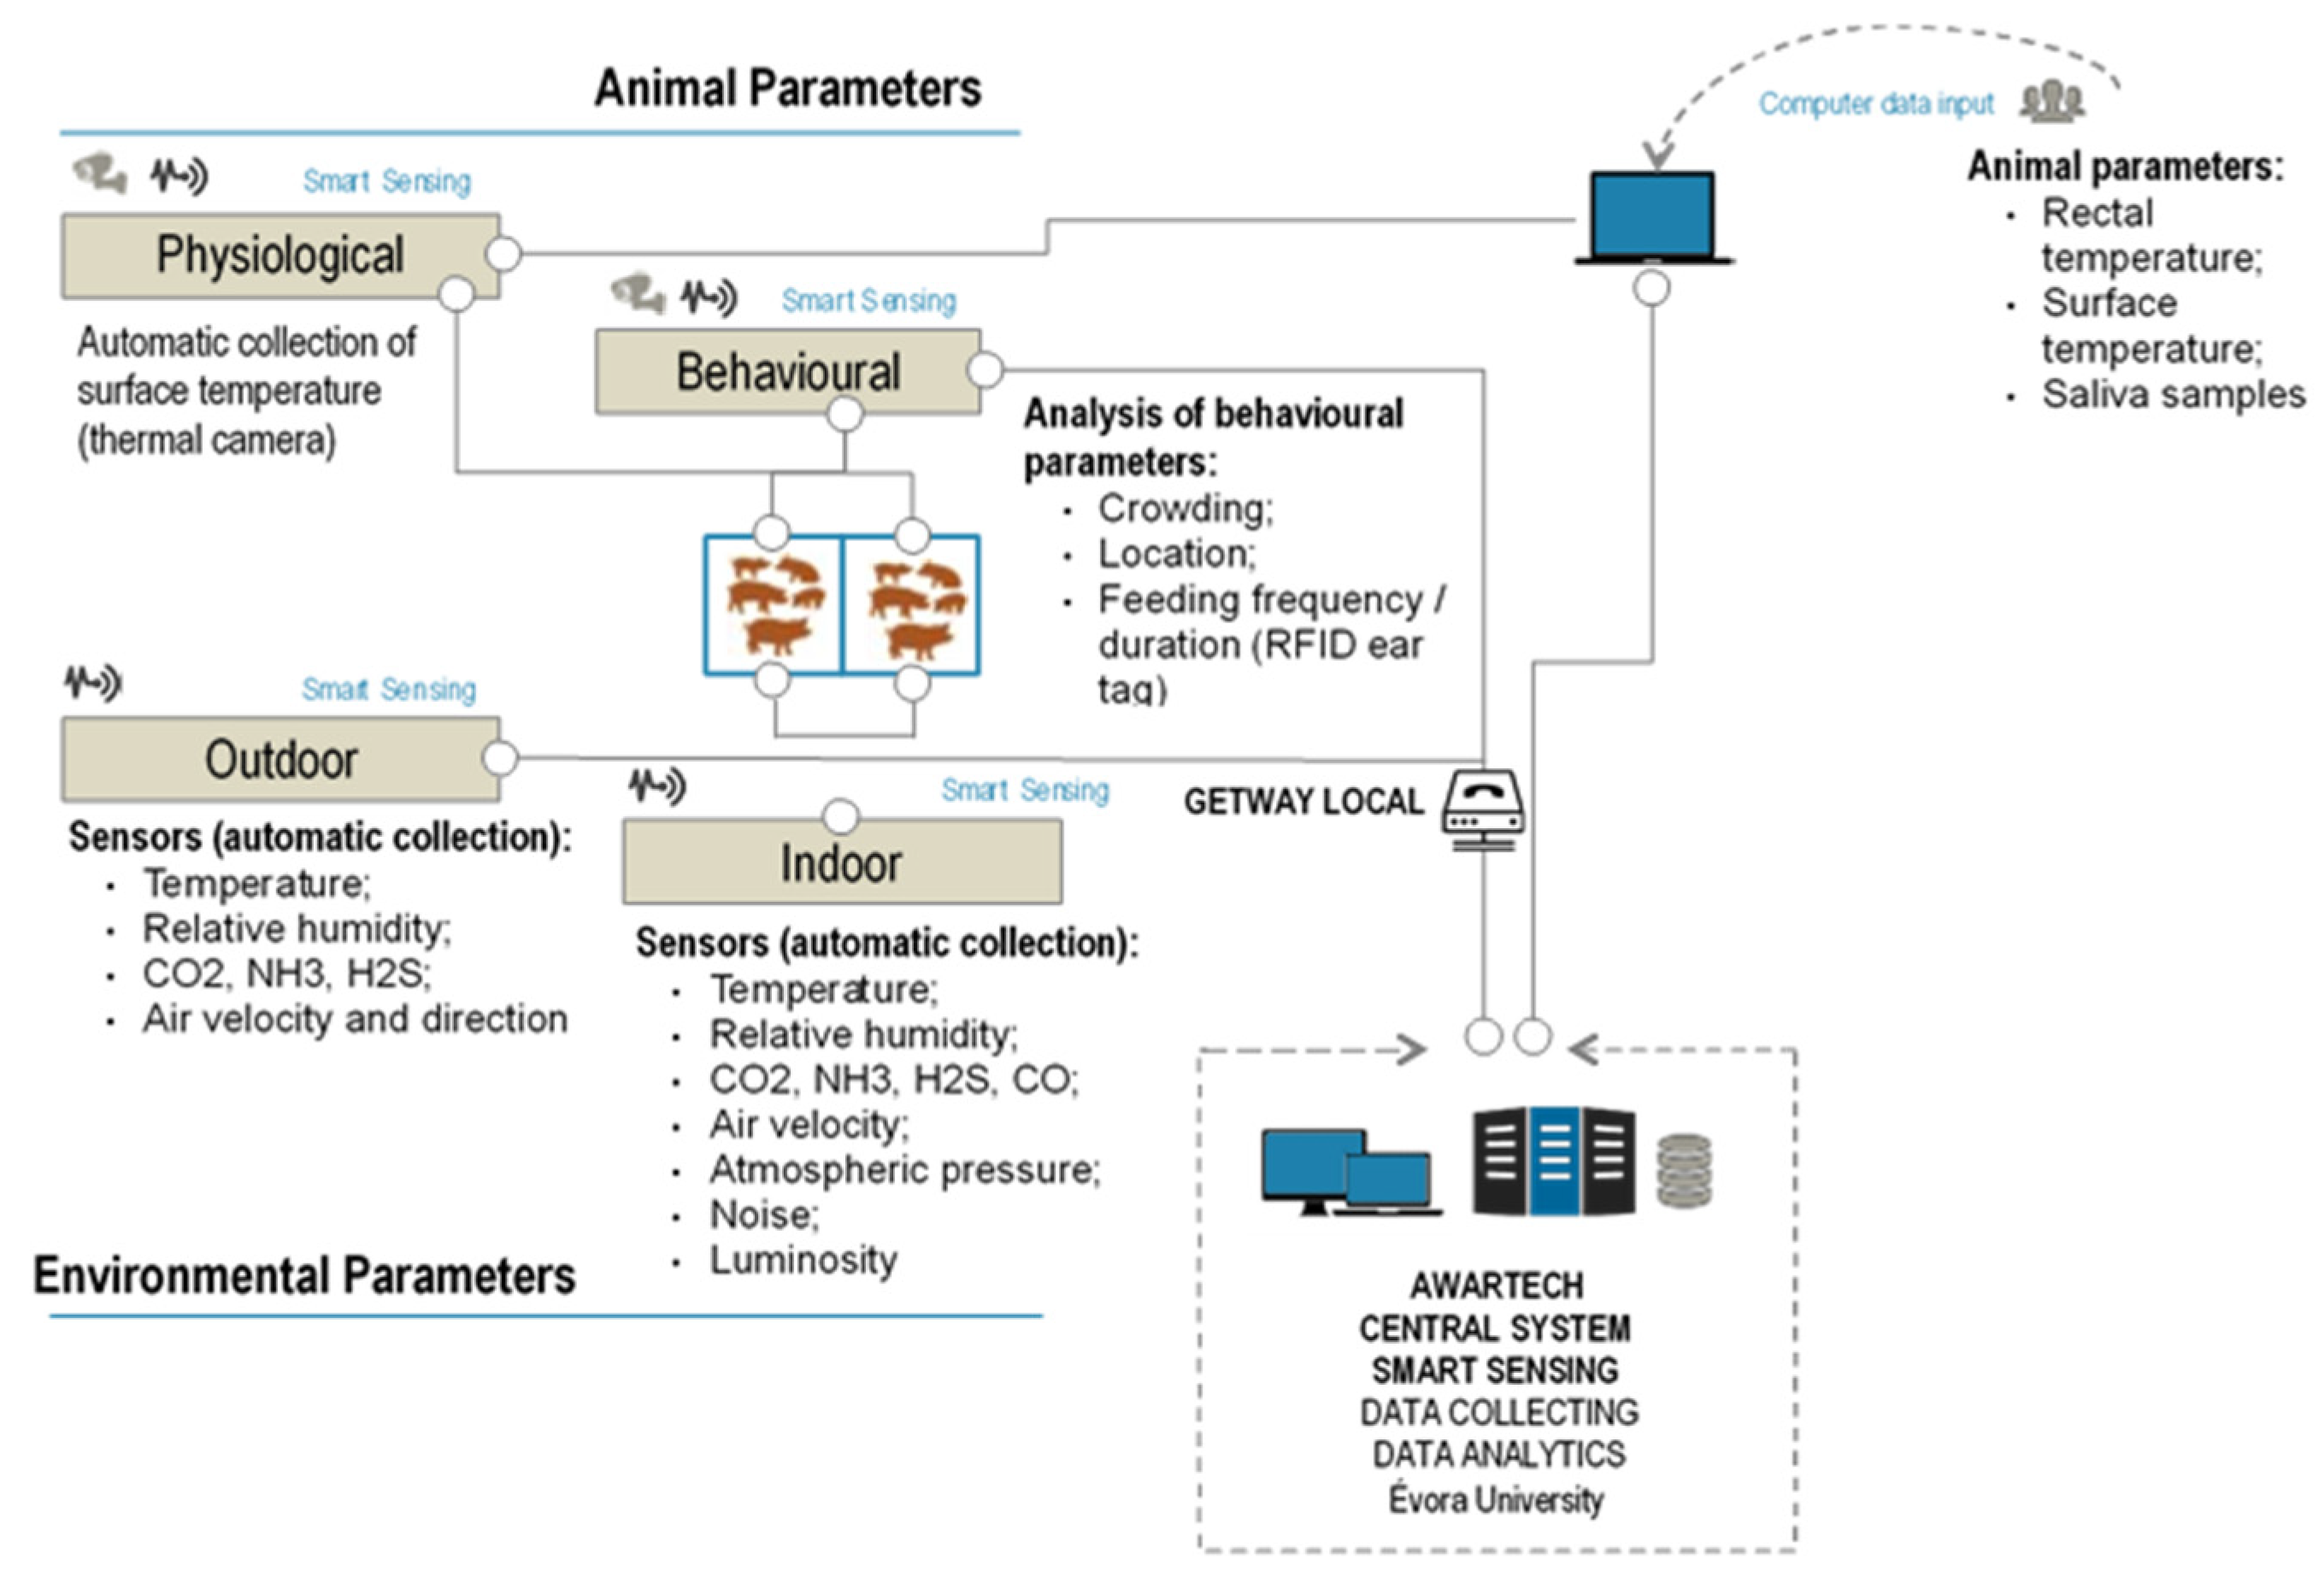
The development of this tool was based on a growing-finishing pigs’ facility. The architecture of the technological component developed in AWARTECH Project consisted in the use of different equipment for continually, automatically and real-time record environmental, productive, behaviour and physiological data (
Figure 1).
2.1. Structures and Equipment
To assist the development of the Awartech Smart sense platform, a pen with an area of approximately 12.0 m2 was installed in the environmental control room. The pen floor was partially slatted with anti-slip, with a manure pit. It was equipped with an automatic feed station and two nipple drinking bowls.
Environmental control was carried out through ventilation, heating and cooling systems. Ventilation was realized by two vertical extractors fans. The air came into the facility through a false ceiling to protect the animals and left through the extractors (negative pressure system). The heating system consisted of a conventional gas heater and the cooling of the facility was made by a nebulization system.
The environmental control room was equipped with different equipment and technologies that allowed to record environmental, behaviour and physiological data. These devices are described in
Table 1.
2.2. Experimental Design
In order to test animal reactions to housing environmental conditions three trials were carried out in the environmental control room at University of Évora: Winter (W)—cold stress (trial 1), Thermoneutrality (TN)—thermal neutrality (trial 2) and Summer (S)—hot stress (trial 3) (
Table 2).
In each trail, 8 female pigs of Piétrain × Topigs Norsvin (TN60) genotype were used with an initial body weight of 48 ± 3 kg. Each animal had 1.5 m
2 of area in the pen. The animals were identified with an RFID ear tags system and each trial started after 15 days of habituation period in TN conditions as shown in
Table 2. Each trial finished when the animals reached a commercial slaughter of 95 to 105 kg live weight.
2.3. Data Collection
2.3.1. Environmental Measurements
The environmental variables registered were air temperature (T) and relative humidity (RH), air velocity, gas concentration, noise and luminosity levels. This data was recorded continuously and in real time through an environmental control system (Webisense) connected to a data storage platform (Nidus).
2.3.2. Animal Performance
Concerning the animal performance, initial and final body weight (BW) and feed intake (FI) data were recorded using the electronic feed station. The RFID ear tag system allowed to monitor and control animals individually, in each feeder access; specifically the amount of food supplied and ingested (g), the number and duration of visits to the feed station (h:m:s), and the animal’s weight (g). Based on these data, the average daily gain (ADG) and feed conversion rate (FCR) were calculated.
The rectal temperature was collected manually using a digital thermometer. In order to have a non-invasive method to monitor the animal body surface temperature a thermal camera was used. The methodology for the physiological data collection followed the protocol described at Cruz et al. [
10].
The behaviour data was obtained through video cameras strategically placed in the environmental room. An algorithm was developed in order to detect abnormal behaviours such as crowding or animals’ dispersion. This algorithm receives the video images and process it frame by frame. The analyses process occurs in two phases: (1) Using a Delaunay triangulation method, the algorithm searches individual or group animal shapes and, after animal identification, records its position in the pen [
11]. (2) In function of animal’s position, the software calculates the crowding index (1 = crowding; 0 = dispersion).
3. Results and Discussion
3.1. Environmental Conditions and Animal Performance
The environmental control system helped to control climatic variations inside the room. Inside and outside environmental conditions recorded in the experimental trials are presented in the next table.
Table 3 shows that the average temperatures and relative humidity recorded inside the room were in accordance with project goals and represented real winter, thermoneutrality and summer conditions. However, there were some deviations in the maximum and minimum temperature values because the environmental control system had some limitations when the outside temperatures were very extreme. This can be explained by the facility thermal insulation level and also by the air exchange rate.
Other parameters recorded inside the room and with particular relevance in the animal welfare are presented in
Table 4.
As presented in
Table 4, the higher CO
2 concentration occurred in the summer condition. This can be explained by the high respiratory rate that naturally occurs under high temperatures and low humidity levels (
Table 3). Regarding the noise level, the values did not vary significantly and no stress situations were found (levels > 85 dB). The luminosity level recorded in the winter was substantially different in comparison with the other conditions. This is explained by the closure of outside blinds in order to increase the thermal insulation at windows level, which decreased the light incidence in the room.
Productive data recorded in the experimental trials are presented in
Table 5.
In general, environmental and productive data allow to understand the influence of the environment on pigs’ performance and shows that animals improved their results under thermal comfort conditions. Through the analysis of the data, it is possible to observe that the environmental conditions affected:
- (i)
Feed intake: under summer conditions (heat stress) the average daily rate is lower due to the effect that high ambient temperatures have on feed intake, particularly in pigs, due to the well-known heat dissipation difficulties. On the other hand, as expected, in the winter condition feed intake is higher. Under cold stress conditions, heat losses from animals to the environment increase and is compensate by several ways and one is the increase of feed intake allowing additional heat production [
12].
- (ii)
Average daily gain: in general, the animals grew faster in the thermoneutrality situation, since almost all the energy consumed is directed to satisfy the maintenance and growth needs.
- (iii)
Feed conversion rate: its value was higher in winter conditions because the amount of metabolizable energy available for growth has been reduced due to the increase in maintenance needs, which affects the feed conversion rate [
3]. Although the values obtained in the summer and thermoneutrality conditions were similar, the animals showed better feed efficiency in the summer situation. This can be explained by the fact that the animals in thermoneutrality were housed for a longer period (7 more days) and, consequently, were slaughtered with greater live weight (
Table 5). This factor influences the conversion rate, because from a certain stage of growth, the increase in live weight negatively affects feed efficiency.
The physiological data recorded in the experiment are presented in
Table 6.
This table shows that rectal temperature is similar for the three trials being slightly higher in summer conditions. Body surface temperatures have clear high values in animals housed in summer conditions. These values are in accordance with expectations, since under conditions of high temperatures, pigs have difficulty in dissipating their body heat, which causes an increase in internal and surface temperatures [
3]. This effect is mostly evident in surface temperature.
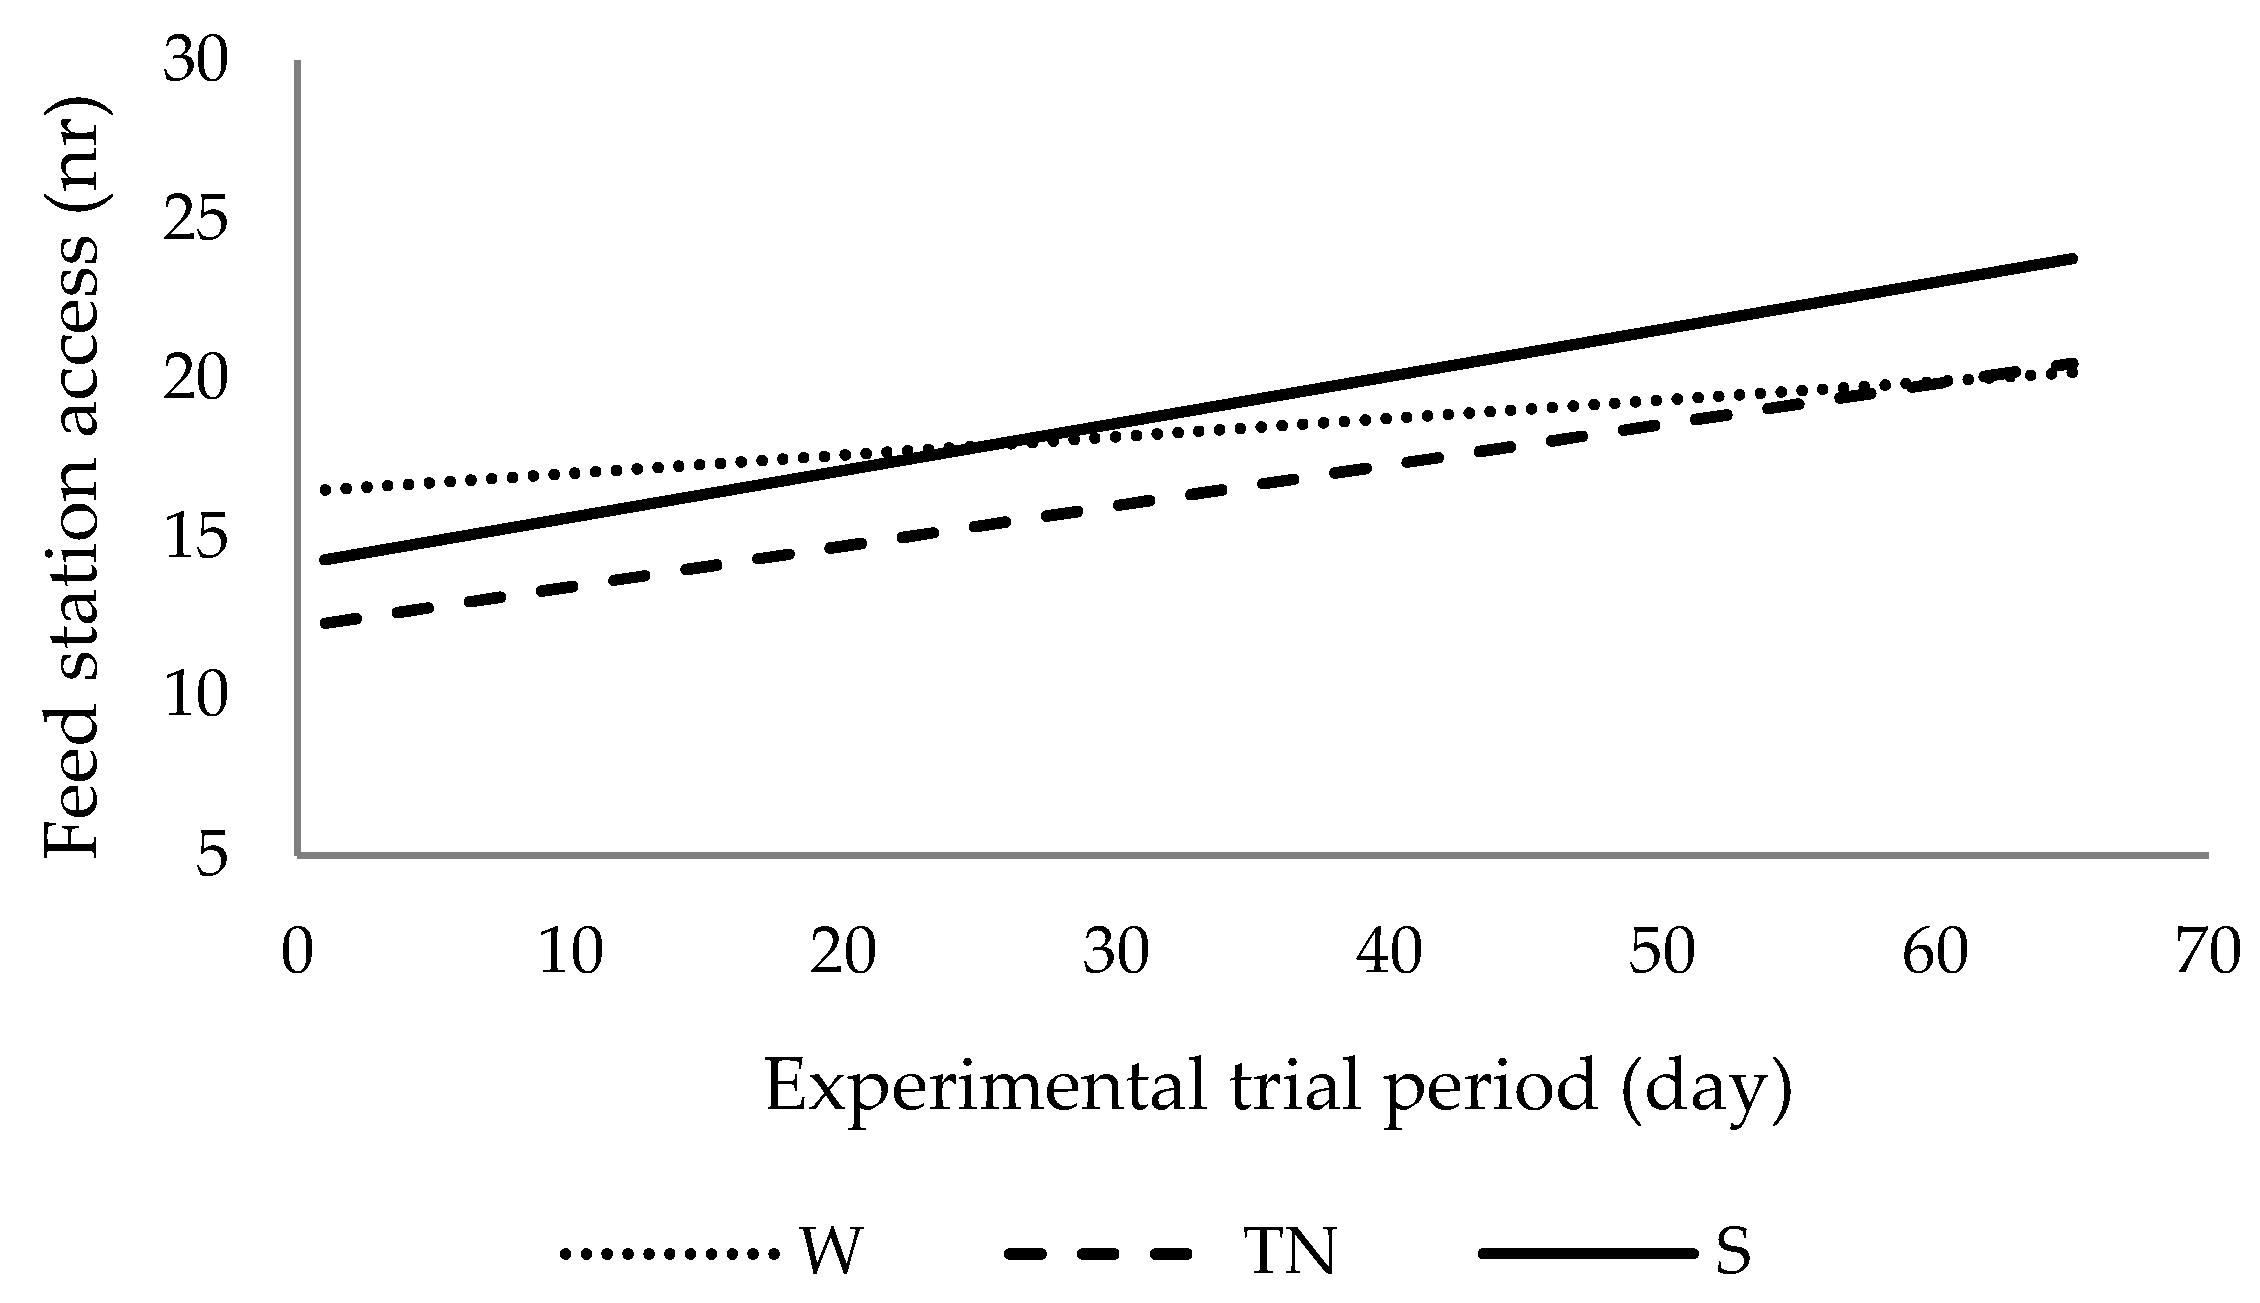
Figure 2 allows observing the animals’ demand for food, through the number of daily visits to the electronic feed station.
From this figure, it is possible to verify that, on average, the animals accessed the feeder more frequently in summer conditions. Relating this behaviour with the daily feed intake (
Table 5), it shows that although the animals have increased the number of visits in the summer condition, there was a lower mean food intake at each access compared to the feed intake verified in the other conditions.
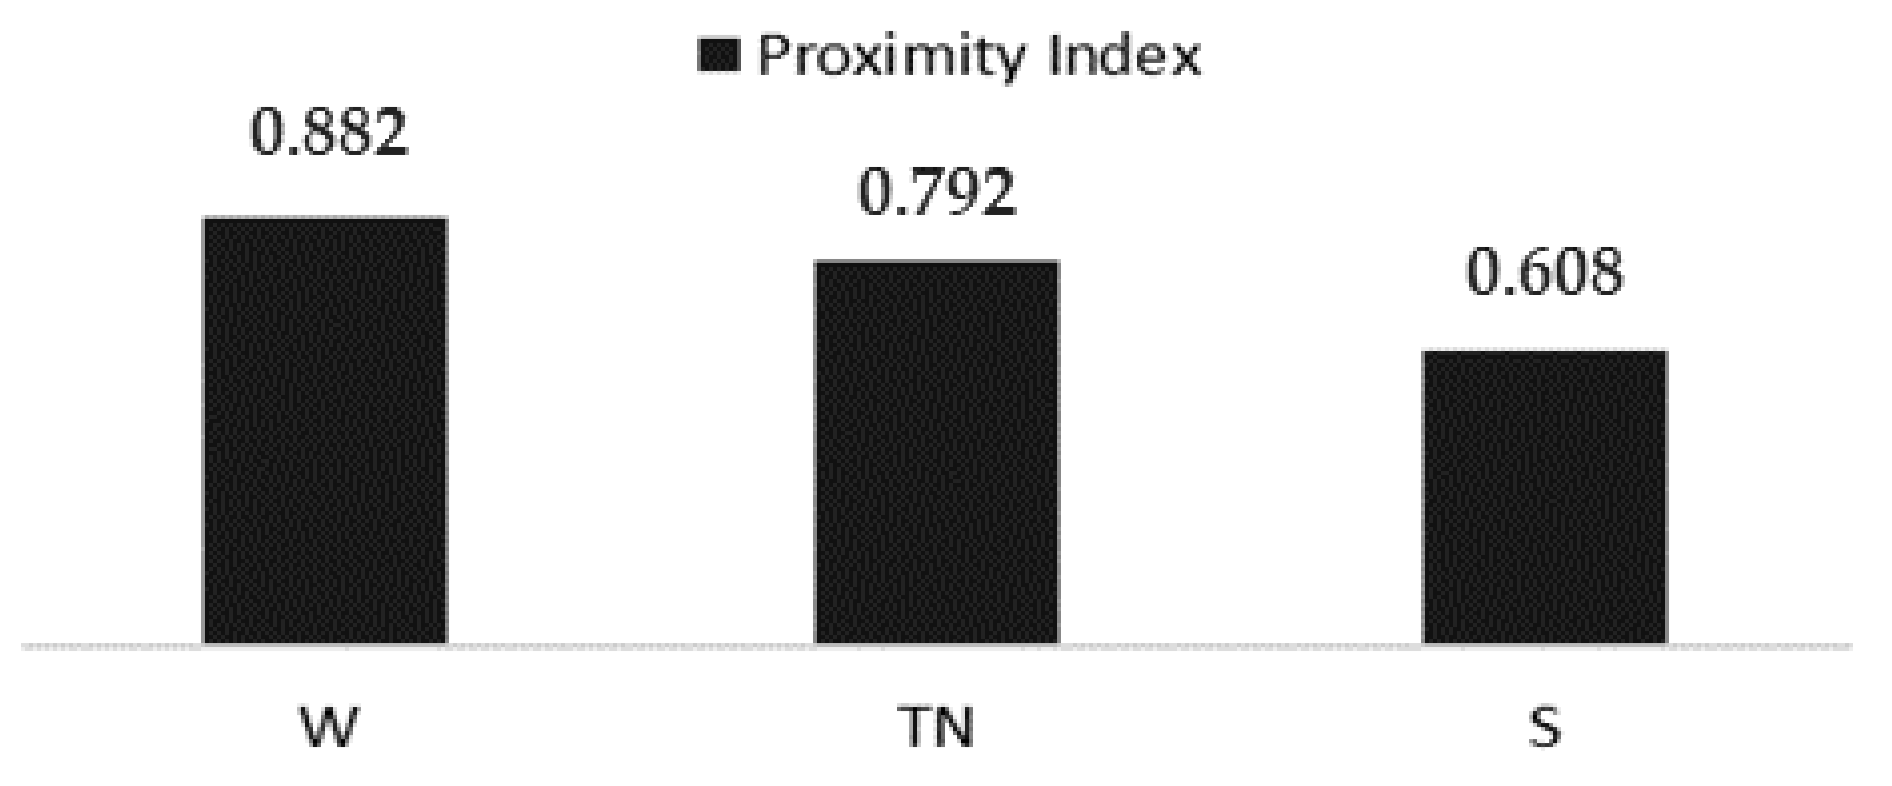
Behaviour data are presented in the next figure.
Based on
Figure 3, we can say that animals were closer in winter condition. This behaviour is very common in pigs that tend to huddle when subjected to low temperatures, in order to avoid body heat losses to the surrounding environment. The opposite is verified in the summer condition, since the animals disperse in order to increase the heat exchange with the surroundings and to maintain their body temperature.
3.2. Awartech Smart Sensing Platform
The Awartech Smart Sensing Platform is a PLF tool developed in the AWARTECH Project resulting from the integration in real-time, of data provided by the technological devices used in the experiments.
This platform is a WEB-based application used to view and control sensory systems and operates according to the GRID system. GRID is a data and IoT system that supports many protocols and is available to communicate with different systems/tools (thermal cameras, video cameras, environmental sensors, electronic feed stations, etc.). It allowed to register automatically/manually and continuously several variables related to animals and environment. The different parameters were recorded with variable periodicity and these data could be consulted in real time or in databases due to the ability to store all data over time. This allowed to control the environmental conditions (in real time and automatically) in order to promote the animal welfare, according to the animal’s feedback.
The platform’s automation processes were based on stream processing mechanisms. That is, the sensor data were available in real time when received on the platform. To develop these mechanisms, the Awartech Smart Sensing platform is based on algorithms to evaluate the environmental and animal data in real time and, according to predefined setpoints or rules, could perform one or more actions on the environmental control system (increase or decrease ventilation, switch on or off heating or cooling).
Automation mechanisms were one of the most difficult tasks to develop during the project due to the complexity of the animal–environment interactions. The major problem with this approach was the interconnectivity between the environmental and biological parameters. When any parameter changed, the environmental conditions also changed, as well as the animal’s response.
4. Conclusions
The AWARTECH Project contributes to the scientific and technological advance of the pig sector through the development of a PLF tool that allows to assist productive systems, contributing to the future sustainable pig production.
The animal performances obtained in this study confirm the extraordinary influence the housing environmental conditions have on animal production and welfare. These results contributed to the development and operation of the Awartech Smart Sensing Platform.
In general, the Awartech Smart Sensing platform operated according to expectations in the experimental trials and in the commercial pig facility. During the project development some expected problems occurred due to the complexity of technologies adopted. However, the tested technologies demonstrated great potential for use in intensive production systems.
Automation process based on animal and environmental real data is a pioneer approach that revealed to be, as expected, a difficult and complex process. However, the AWARTECH Project contributed to develop technological knowledge that opens doors for future works, in particular the development of a comfort or animal welfare index. This index that will integrate animal and environment information could be the base for balanced actuation rules.
Author Contributions
Conceptualization, V.C., J.R., D.C. and F.B.; Data curation, J.R. and D.C.; Formal analysis, V.C., J.R., D.C. and F.B.; Funding acquisition, V.C.; Investigation, V.C., J.R., D.C. and F.B.; Methodology, V.C., J.R., D.C. and F.B.; Project administration, V.C.; Supervision, V.C. and F.B.; Writing—original draft preparation, V.C., J.R., D.C. and F.B.; Writing—review and editing, V.C., J.R., D.C. and F.B. All authors have read and agreed to the published version of the manuscript.
Funding
Funded by European Regional Development Fund (ERDF) through the Portugal 2020 and Alentejo 2020 programs.
Institutional Review Board Statement
Not applicable.
Informed Consent Statement
Not applicable.
Data Availability Statement
Not applicable.
Acknowledgments
The authors acknowledge the partners Equiporave Ibérica, Lda and Hexastep, S.A.
Conflicts of Interest
The authors declare no conflict of interest.
References
- Rojas-Downing, M.M.; Nejadhashemi, A.P.; Harrigan, T.; Woznicki, S.A. Climate change and livestock: Impacts, adaptation, and mitigation. Clim. Risk Manag. 2017, 16, 145–163. [Google Scholar] [CrossRef]
- Berckmans, D. Precision livestock farming technologies for welfare management in intensive livestock systems. Rev. Sci. Tech. 2014, 33, 189–196. [Google Scholar] [CrossRef] [PubMed]
- Cruz, V.F. Influência da Estação do ano Sobre as Performances do Porco em Fase de Crescimento e Acabamento. Sua Relação com a Densidade de Alojamento e a Concentração Energética da Dieta. Ph.D. Thesis, University of Évora, Évora, Portugal, 1997. [Google Scholar]
- Babot, D.; Revuelta, M. Ganado Porcino: Diseño de Alojamientos e Instalaciones; Servet editorial: Zaragoza, Spain, 2009; pp. 38–69. [Google Scholar]
- Berckmans, D. General introduction to precision livestock farming. Anim. Front. 2017, 7, 6–11. [Google Scholar] [CrossRef]
- Fournel, S.; Rousseau, A.N.; Laberge, B. Rethinking environment control strategy of confined animal housing systems through precision livestock farming. Biosyst. Eng. 2017, 155, 96–123. [Google Scholar] [CrossRef]
- Vranken, E.; Berckmans, D. Precision livestock farming for pigs. Anim. Front. 2017, 7, 32–37. [Google Scholar] [CrossRef]
- Banhazi, T.M.; Lehr, H.; Black, J.L.; Crabtree, H.; Schofield, P.; Tscharke, M.; Berckmans, D. Precision Livestock Farming: An international review of scientific and commercial aspects. Int. J. Agric. Biol. Eng. 2012, 5, 1–9. [Google Scholar] [CrossRef]
- Van Erp-Van der Kooij, E. Precision Technology and Sensor Applications for Livestock Farming and Companion Animals, 1st ed.; Wageningen Academic Publishers: Amsterdam, The Netherlands, 2021; p. 280. [Google Scholar] [CrossRef]
- Cruz, V.F.; Rico, J.C.; Coelho, D.J.R. E-Manual Técnico do Projeto Awartech; Universidade de Évora: Évora, Portugal, 2021. [Google Scholar]
- Nasirahmadi, A.; Richter, U.; Hensel, O.; Edwards, S.; Sturm, B. Using machine vision for investigation of changes in pig group lying patterns. Comput. Electron. Agric. 2015, 119, 184–190. [Google Scholar] [CrossRef]
- Li, Q.; Patience, J.F. Factors involved in the regulation of feed and energy intake of pigs. Anim. Feed Sci. Technol. 2017, 233, 22–33. [Google Scholar] [CrossRef]
| Publisher’s Note: MDPI stays neutral with regard to jurisdictional claims in published maps and institutional affiliations. |
© 2022 by the authors. Licensee MDPI, Basel, Switzerland. This article is an open access article distributed under the terms and conditions of the Creative Commons Attribution (CC BY) license (https://creativecommons.org/licenses/by/4.0/).


