Article

Understanding the Role of Physiological and Agronomical Traits during Drought Recovery as a Determinant of Differential Drought Stress Tolerance in Barley

1
Tasmanian Institute of Agriculture, University of Tasmania, Hobart, TAS 7001, Australia
2
Department of Agronomy, Faculty of Agriculture, Sher-e-Bangla Agricultural University, Sher-e-Bangla Nagar, Dhaka 1207, Bangladesh
3
International Research Centre for Environmental Membrane Biology, Foshan University, Foshan 528011, China
4
School of Biological Science, University of Western Australia, Perth, WA 6009, Australia
*
Authors to whom correspondence should be addressed.
Agronomy 2022, 12(9), 2136; https://doi.org/10.3390/agronomy12092136
Submission received: 5 August 2022 / Revised: 4 September 2022 / Accepted: 5 September 2022 / Published: 8 September 2022
(This article belongs to the Collection Crop Breeding for Stress Tolerance)

Abstract

:
The fast and efficient recovery could be an important trait defining the efficacy of plant drought adaptation. In this work, we aimed to develop a set of simple and appropriate physiological proxies that could be used as reliable indicators to predict plant drought responses and validate the role of specific physiological traits such as root length, stomata density, and residual transpiration, in the drought tolerance and recovery in barley. Eighty barley (Hordeum vulgare L.) genotypes were subjected to progressive droughting until the soil moisture level reached 10%, followed by rewatering. Plants were visually scored at the end of drought period and two weeks after rewatering. SPAD values and chlorophyll fluorescence Fv/Fm ratio were also measured, alongside with stomatal density (SD) and residual transpiration (RT). The same genotypes were germinated in paper rolls treated with 15% (w/v) of polyethylene glycol (PEG) 8000 by quantification of changes in the root growth patterns. Responses to drought stress varied among the genotypes, and drought tolerance and recovery scores were significantly correlated with each other. Changes in SPAD value, Fv/Fm ratio and root length were significantly correlated with the drought tolerance and recovery indices. Both indices correlated strongly with the SD and RT of irrigated plants, although in an unexpected direction. We have also correlated the extent of plants’ drought tolerance to their ability to grow in saline soils (a condition often termed a “physiological drought”) and found a positive association between these two traits. The fact that drought tolerant genotype also possessed higher salinity tolerance implies some common mechanisms conferring both traits. Plants having less SD and more RT under irrigated conditions showed higher drought tolerance. It is concluded that lower SD and higher RT under optimal conditions may be used as proxies for drought tolerance in barley.

1. Introduction

Climate trends and the current global warming have increased the frequency of drought events in the world by about threefold in the last 50 years [1]. As a result, the amount of land area affected by drought may reach 50% by the end of the century, and the frequency of extreme agricultural droughts events is projected to increase by about sixfold, with major drought events occurring every 5 years [2]. It has been estimated that crop production was reduced by 10% in the last 50 years by drought events [3], costing agriculture around USD 60 billion in annual losses [4]. Globally, both rainfed and irrigated crops are facing a continuous cycle of water deficit and rewatering. Plants need to regrow as early as possible when relieved from the drought. The ability of a plant to resume growth and productivity by reintroducing water after severe drought stress is known as drought recovery. A complete recovery after drought requires plants to restart all of the physiological and metabolic systems/pathways downregulated by stress, and to repair drought-induced damage, so as to be able to resume plant growth. While plants’ ability to tolerate and/or avoid drought has been addressed in numerous studies, the importance of recovery from drought has attracted much less attention, despite the critical role of this trait in the yield formation [5,6].
Plants show a plethora of morphological, physiological, and biochemical responses to drought stress. Drought-induced water stress reduces plant growth and development by decreasing turgor pressure and, thus, reducing cell expansion rates. Drought stress has a major negative impact on photosynthesis, reducing the rate of CO2 assimilation due to stomatal closure and reduced chlorophyll content and leaf photochemistry [7,8]. Because of this, chlorophyll fluorescence—specifically, the maximum quantum efficiency of light harvesting in PSII in dark-adapted leaves (the so-called Fv/Fm ratio)—and chlorophyll SPAD reading are often used as effective, reliable, and reproducible diagnostic tools for high-throughput assessments of plant germplasm for drought tolerance [9,10,11]. However, most previous reports involving chlorophyll contents and Fv/Fm ratios predominantly measured drought tolerance, and largely ignored drought recovery.
Plants have evolved several complementary mechanisms in adapting to drought stress, such as changing their root architecture [12], modifying their osmotic potential, reducing their xylems’ vulnerability to cavitational damage [13], optimizing stomatal operation (at both the developmental and functional levels) [14,15], improving leaf photochemistry [16], changing leaf morphology, and cutinizing the leaf surface [17]. However, plant phenotyping under drought stress conditions is often a challenging task that requires a compromise between a need for the high throughput of the method and the functional importance of the measured traits. There is an urgent need for simple and appropriate physiological proxies that can be easily measured under control conditions and could be used as reliable indicators to predict plants’ drought responses.
The importance of above traits goes well beyond the conditions of reduced amounts of rainfall in arid or semi-arid areas. A significant amount of agricultural land is affected by soil salinity [4], and one of the constraints imposed on plants grown in salt-affected land is reduced water availability, otherwise known as a ‘physiological drought’ caused by osmotic stress. To deal with both stresses, plant often employ similar adaptive strategies such as increased de novo synthesis of compatible solutes for osmotic adjustment and turgor maintenance, efficient control of stomata operation and patterning, common anatomical and morphological adaptive traits (e.g., longer roots; succulence; high extent of leaf cutinization), and shared stress sensing and signaling pathways [4,14,18,19,20,21,22]. This implies a possibility of the causal link between two stresses. Hence, understanding a correlation between above drought-adaptive traits and the extent of plant salinity stress tolerance may be of a great value to breeders working in this space.
At the functional level, plants first response to drought is to reduce stomatal conductance (Gs) via stomatal closure. Gs can be also reduced by reducing stomatal density (SD), via developmental regulation. Therefore, Gs and SD are both important for improvement of water use efficiency (WUE) in response to drought stress. Manipulation of the stomatal density by expression of the epidermal patterning factor (EPF1 and EPF2 gene) and STOMATAL DENSITY AND DISTRIBUTION 1 (AtSDD1) has previously been demonstrated to improve water use efficiency (WUE) in Arabidopsis thaliana [23]. Recently, it has been reported that overexpressing HvEPF1 gene in barley [24] and SchSDD1-like in cultivated tomato plants [25] improved drought tolerance by reducing SD without affecting plant yield. Our previous study also suggested that the genotypes which had lower Gs under control (irrigated) conditions showed a better tolerance under severe drought stress conditions [26]. While the control of Gs is necessary for restricting water loss under drought stress conditions, a small but uncontrolled loss of water from the leaf surface may bypass the stomata and pass through the cuticle, through the process known as residual transpiration (RT). This non-stomatal (RT) transpiration through the leaf cuticle could contribute up to 50% of total water loss in drought stressed plants during day and 60% during night [27,28]. In the light of this, the current studies aimed to validate the role of SD and RT in the drought tolerance and recovery in barley.
Maintenance of root growth under drought stress is also considered to be an essential drought-adaptive trait for plants to increase their uptake of water and nutrients from the deeper soil layers [12]. Several studies have reported that drought tolerance not only depends on the root length per se, but is also associated with some adaptive changes in the root structure, such as a reduction in the roots’ cortical aerenchyma development, reduced root diameter, an increased number of lateral roots and root hairs, and increased length of lateral roots and root hairs [29,30]. As the monitoring of root traits in drought-stricken soil is a technically challenging task, hydroponic systems are often employed using PEG-induced osmotic stress as a proxy for drought. It has been shown that plants change their root morphology by swelling their root tips, developing longer root hairs and more lateral roots to increase the water absorption area upon PEG treatment [31]. Determining whether these root traits provide a predictive index of plants’ susceptibility to soil water deficit was another aim of this work.

2. Materials and Methods

2.1. Plant Materials and Growth Conditions

Seeds of 80 barley genotypes (Hordeum vulgare L.) collected from different regions across the globe (Table S1) were sown in 0.3 L (12 cm × 5 cm × 5 cm) pots using a standard potting mix (70% composted pine bark; 20% coarse sand; 10% sphagnum peat; Limil at 1.8 kg m−3, dolomite at 1.8 kg m−3) with added slow-release Osmocote Plus™ fertilizer (at 6 kg m−3), plus ferrous sulfate (at 500 g m−3). The experiments were conducted in May–September 2017 using glasshouse facilities at the Mount Pleasant Laboratory facilities in Launceston, Australia. The mean daily temperatures were 25 °C (in the day) and 15 °C (at night). Drought was imposed on 20-day-old seedlings (at the tillering stage), as this was shown to be when the plants were the most sensitive to water stress [32]. Plants were gradually brought to 10% soil water content by withholding irrigation for 15 days, and then rewatered to the control level and maintained for 15 days, as shown in Figure 1. The experiment was conducted as a complete randomized design (CRD), with four replications for each cultivar of each of the drought and control treatments. Control plants were grown under normal irrigated conditions, maintaining 80–90% soil water content by watering twice daily.

2.2. Scoring for Drought Stress Tolerance

The degree of drought tolerance was determined for each pot, 15 days after withholding irrigation, based on a leaf injury score using a 1–9 scale (9 = no visual symptoms; 1 = dead plants) (Table 1). The average values of four replications were used for the quantitative estimation of drought tolerance, termed the drought tolerance index. These drought tolerance indices were used to evaluate the effectiveness of different morphological and physiological parameters for screening drought tolerance.

2.3. Scoring for Drought Recovery Index

The extent of the drought recovery ability of barley plants was determined based on the ability of the plants to survive after rewatering the pots back to their full water-holding capacity after progressive drought stress. Fifteen days after rewatering, a drought recovery score was given using a 1–9 scale (9 = full recovery; 1 = dead plants) (Table 2). The average values of four replications were also used as quantitative estimation of drought tolerance, termed the drought recovery index.

2.4. Scoring for Salinity Stress Tolerance

The same eighty barley genotypes were grown in big (420 L; 1.5 m × 0.7 m × 0.4 m) PVC tanks filled with the fertilized standard potting mix (as above). Eighty barley genotypes were sown in each tank (6 plants per genotype) and grown under same glasshouse conditions as described above. Seedlings at the 3-leaf stage (Zadoks growth stage, Z13) were treated with 300 mM NaCl in 80 mM day−1 increments, to avoid a sudden osmotic shock. Salinity treatment lasted for 4 weeks. Plants were watered with the saline solution twice per day, applying sufficient amount of water to ensure run-off and preventing salinity buildup in the soil. As a result, the concentration of NaCl in the potting mix was stable and matched that of the irrigation solution (300 mM NaCl). After 4 weeks of salinity treatment (Zadoks growth stage, Z22), the degree of leaf injury was recorded and scored on 0 to 9 scale (0 = no visual symptoms; 9 = dead plants) (Table 3). These scores are termed as ‘salinity damage index’ in this work.

2.5. Traits Tested for Association with Drought Tolerance

2.5.1. Stomatal Density

The number of stomata per leaf unit area was calculated by obtaining leaf imprints from the leaves of the intermediate position at 5 weeks after seed sowing. A thin layer of a white nail polish was applied to the abaxial surface of the leaf. The nail polish imprints were peeled off with fine forceps after drying, placed onto microscope slides, and covered with a coverslip. The imprints were observed under a compound microscope at 20× magnification (Zeiss Axiostar Plus, Jena, Germany). The number of stomata was counted from each field of view, and stomatal density was calculated as the number of stomata per mm2. The sample size for each genotype was 18 (3 fields of view × 2 imprints × 3 biological replications).

2.5.2. Seedling Tests in Polyethylene Glycol (PEG) Media and Control Conditions

Eighty barley genotypes were screened for root length under 15% (w/v) PEG 8000 treatment and control conditions. Fifteen seeds were germinated between two layers of paper towel in plastic pots at 25 °C under dark conditions in a growth chamber for 6 days. For the control treatment, the seeds in the paper towel were wetted with distilled water. The 15% (w/v) PEG 8000 solution was used to mimic drought stress. Six days after germination, the root length of the germinated plants was measured using a ruler. Ten seedlings for each of the genotypes/treatment with three biological replicates were analyzed.

2.5.3. Chlorophyll Fluorescence

The maximal photochemical efficiency of PSII was estimated by measuring the chlorophyll fluorescence Fv/Fm ratio on the upper surface of the second uppermost leaves from control and drought-stressed plants from dark-adapted samples, using an Optiscan OS-30P fluorometer (Opti-Science, Hudson, NH, USA), at 5 weeks after seed sowing.

2.5.4. SPAD Values

Chlorophyll content was measured as a SPAD value using the Minolta SPAD-502 (Konica Minolta Sensing, Tokyo, Japan). Measurements were conducted from the middle of the lamina of the second uppermost fully expanded leaves from both irrigated plants and plants at the peak of drought stress conditions between 10.00 and 12.00 h at 5 weeks after seed sowing.

2.5.5. Residual Transpiration

The residual transpiration was measured and calculated as described in our previous publications [33]. In brief, three fully expanded barley leaves at an intermediate position from each genotype under control growth conditions were selected for sampling 5 weeks after seed sowing. Leaves were excised during the morning and immediately sealed with vacuum grease on the cut end. The collected leaves were transported to the laboratory and placed in a dark room at 20 ± 1 °C and 50% relative humidity for stomatal closure. Fresh weights (W0) were measured using an electronic balance (Mettler Toledo TLE204, Columbus, OH, USA) immediately after the excision of leaves. The leaves were then weighed at 2, 4, and 6 h intervals (W2, W4, and W6, respectively). Then, they were placed in a drying oven at 60 °C for 24 h, and their dry weights (Wd) were measured again. The residual transpiration was calculated on a dry weight basis by using Equation (1):
Residual transpiration = ((W0 − W2) + (W2 − W4) + (W4 − W6))/(3 × Wd (T2 − T1))
where W0 = leaf fresh weight (FW) immediately after excision; W2 = leaf FW 2 h after excision; W4 = leaf FW 4 h after excision; W6 = leaf FW 6 h after excision; Wd = dry weight of the leaf; T2 − T1 = time interval between two subsequent measurements (2 h).
The measured residual transpiration was then recalculated on the basis of projected leaf area and expressed in mg of H2O cm−2 h−1.

2.5.6. Statistical Analysis

Data were analyzed using IBM SPSS Statistics 21 (IBM corp., Armonk, NY, USA). All results are given as means ± SE. The significance of the correlations between different parameters was determined by bivariate correlations based on Pearson’s correlation (two-tailed).

3. Results

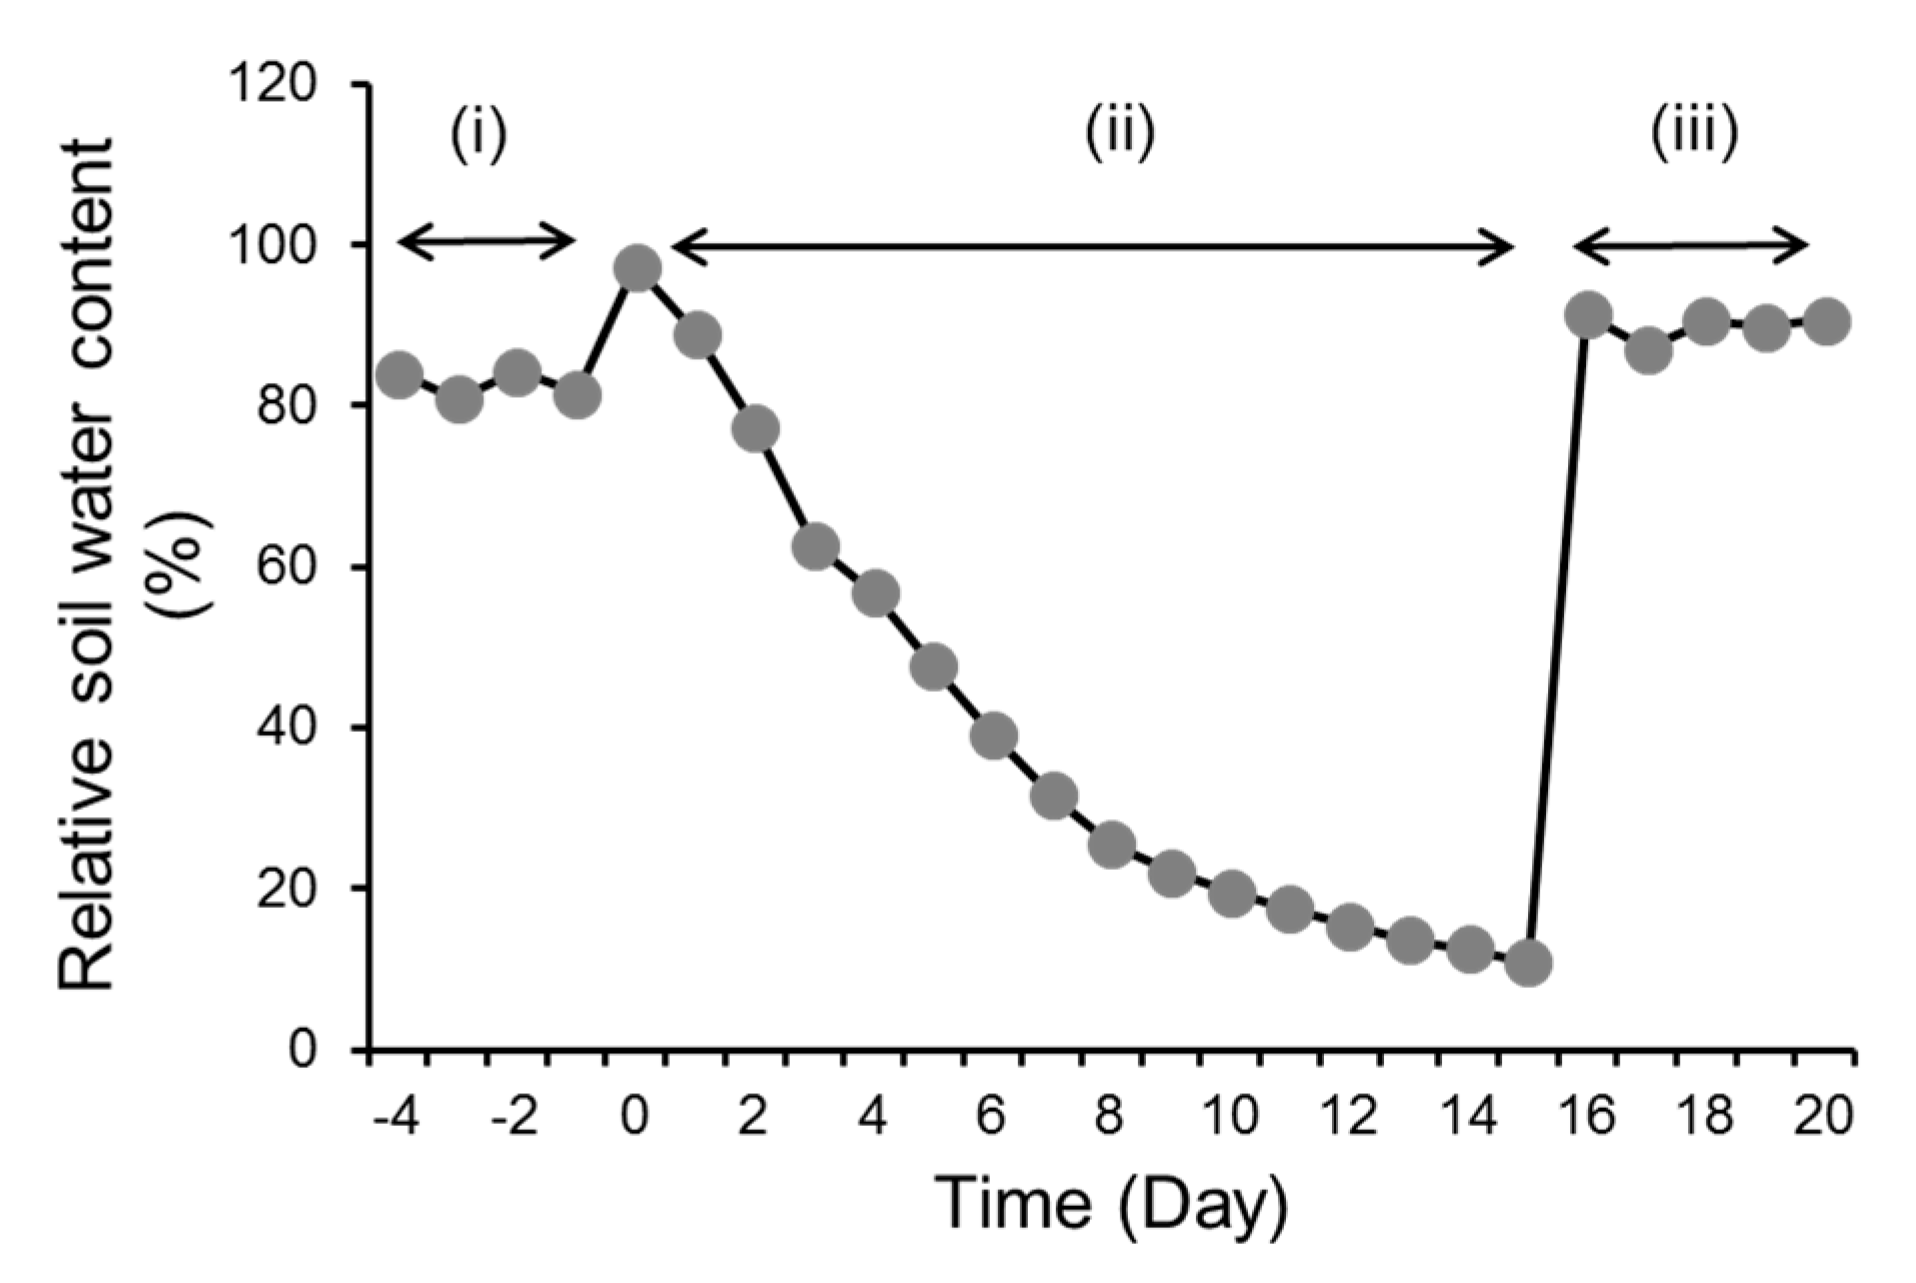
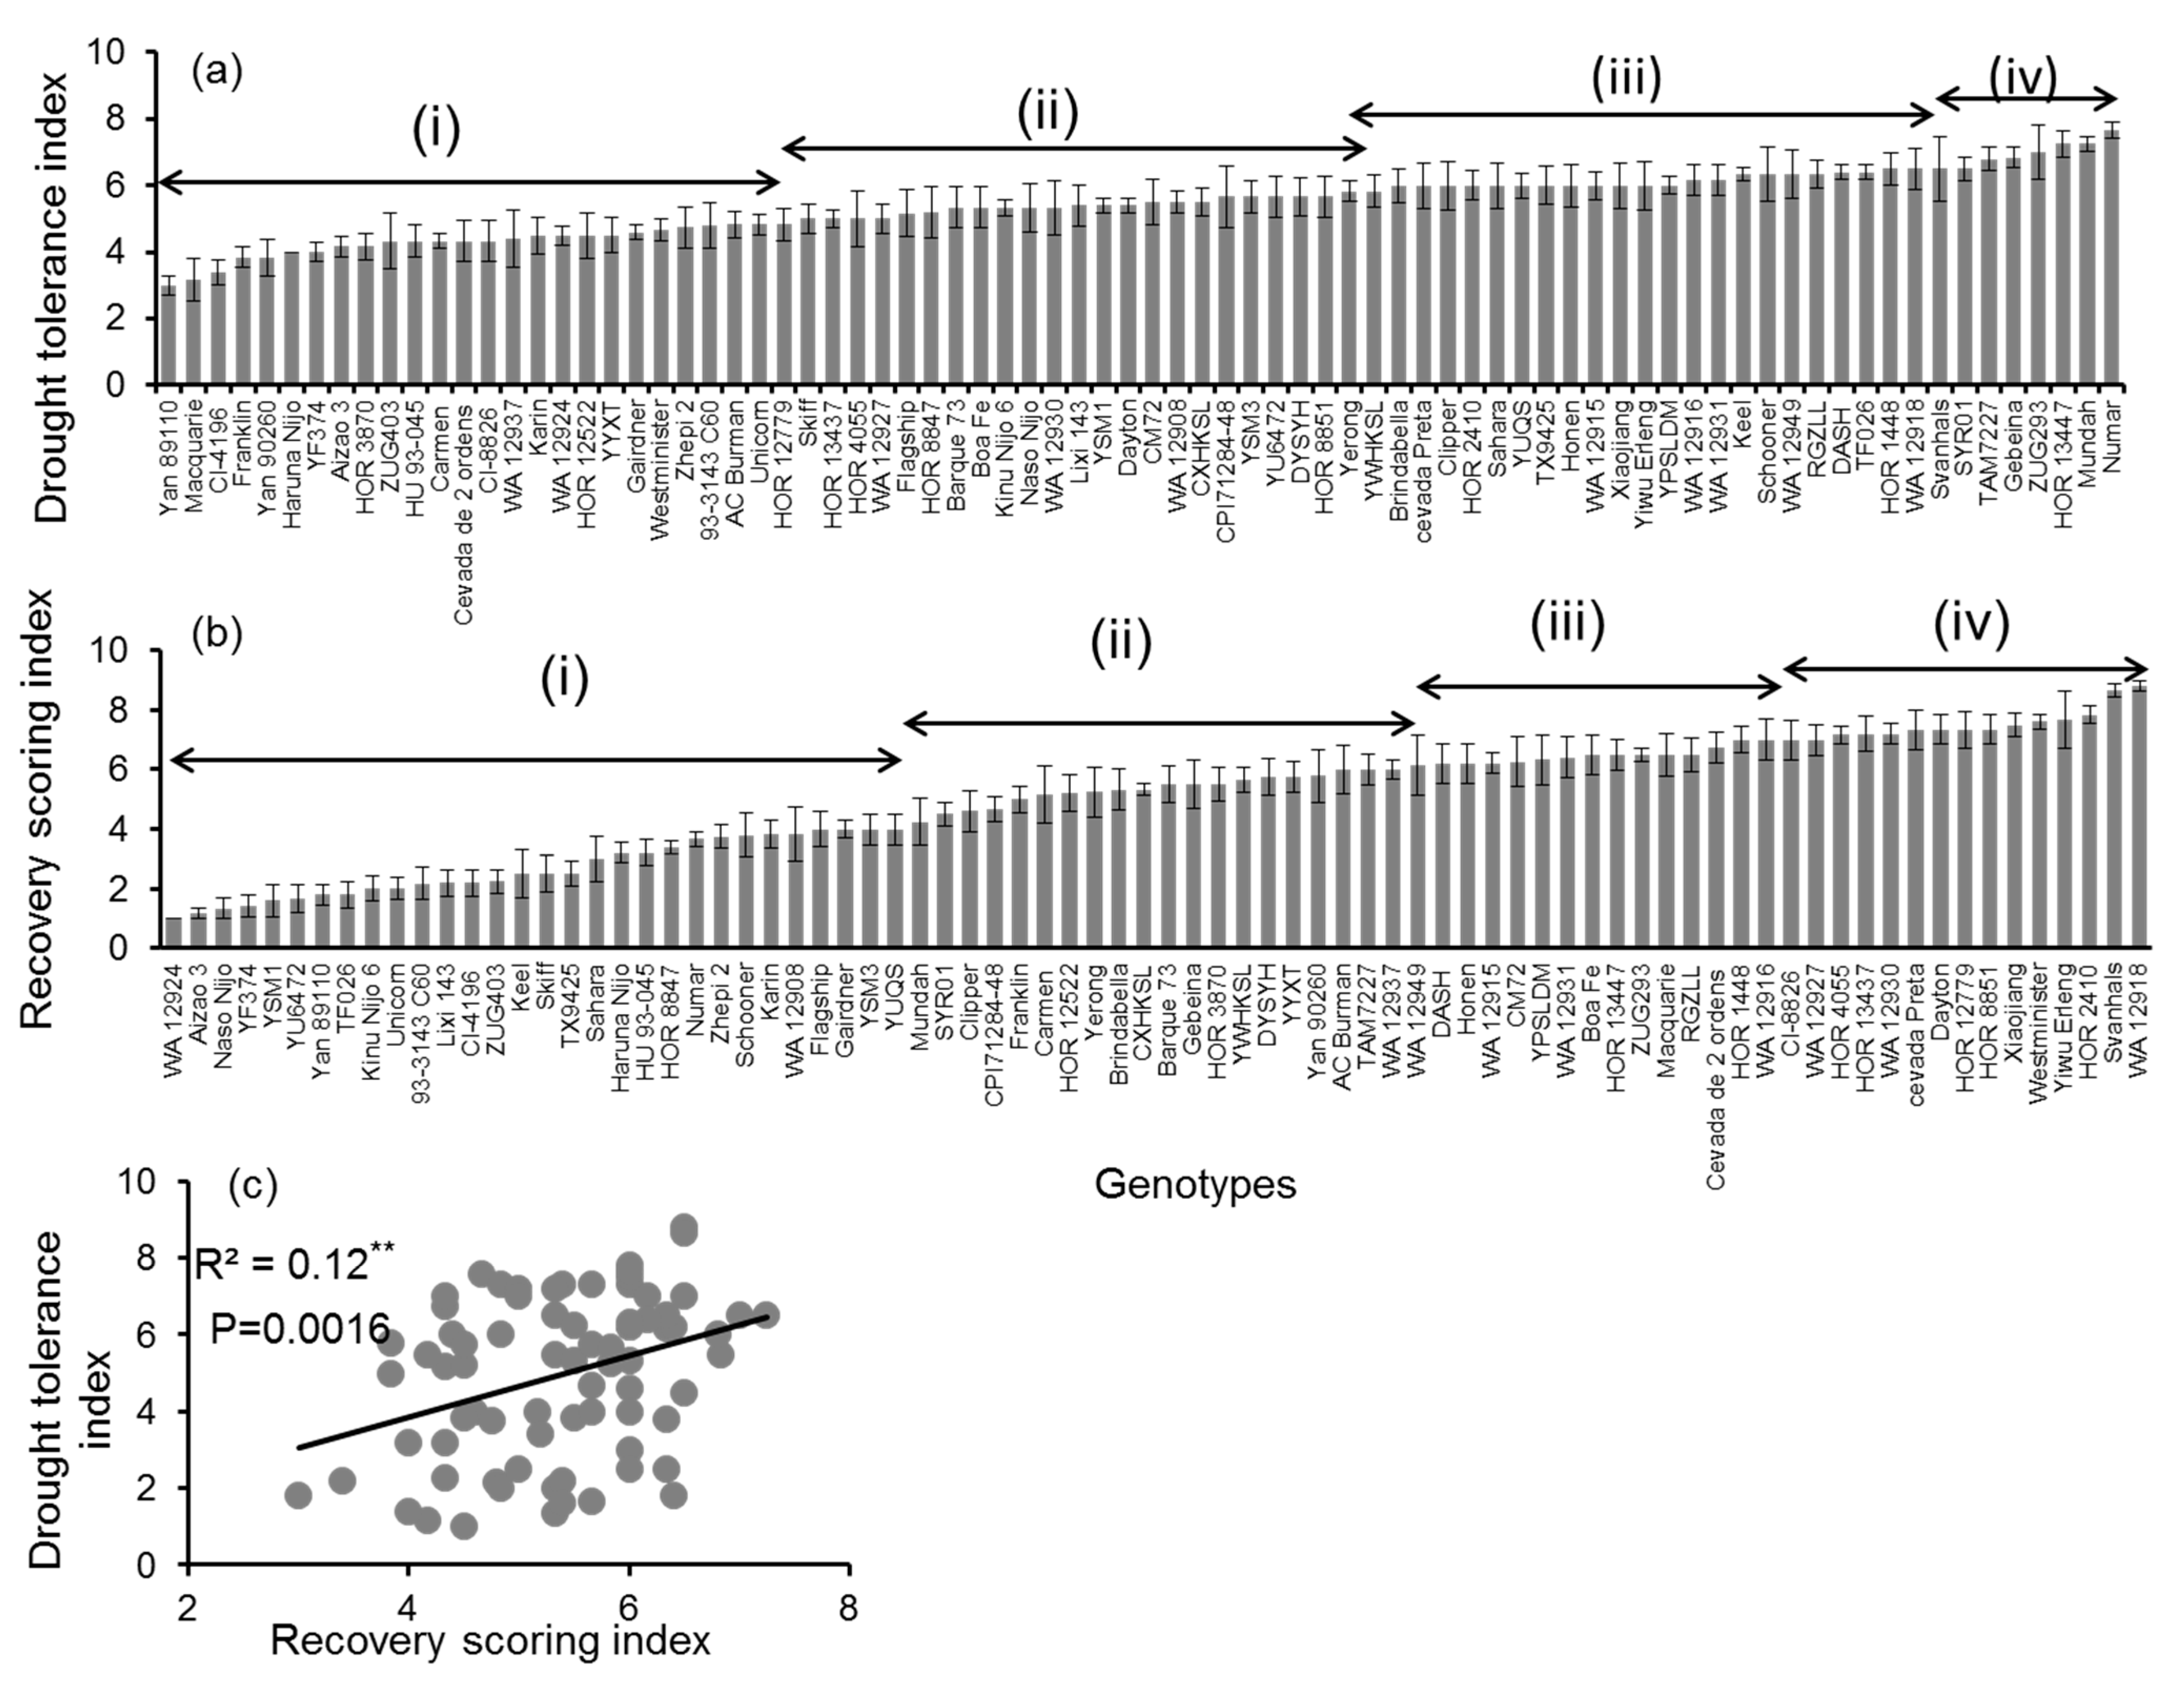
3.1. Genotypic Variation in Progressive Drought Stress and Recovery

When plants were deprived of irrigation for 15 days and then rewatered, a significant genotypic variation in the overall drought tolerance and recovery indices was observed (Table 1 and Table 2). The overall drought tolerance index ranged between 3 for cultivar Yan 89110 and 7.6 for cultivar Numar (Figure 2a). Based on the drought tolerance index, all of the genotypes were clustered into four groups: drought-sensitive (tolerance index = 0–4), moderately sensitive (4–6), moderately tolerant (6–6.5), and tolerant (6.5–8) (Figure 2a). A similar analysis was performed for plants undergoing recovery from stress. The overall drought recovery index ranged from 1 for cv WA 12924 to 9 for cv WA 12918 (Figure 2b), and all genotypes were also clustered into four groups based on the value of the drought recovery index: drought-sensitive (recovery index = 0–4), moderately sensitive (4–6), moderately tolerant (6–7), and tolerant (7–9) (Figure 2b). A small but statistically significant positive correlation (R2 = 0.12; p < 0.01) was found between the drought tolerance index and the drought recovery index (Figure 2c), suggesting a possible causal relationship.

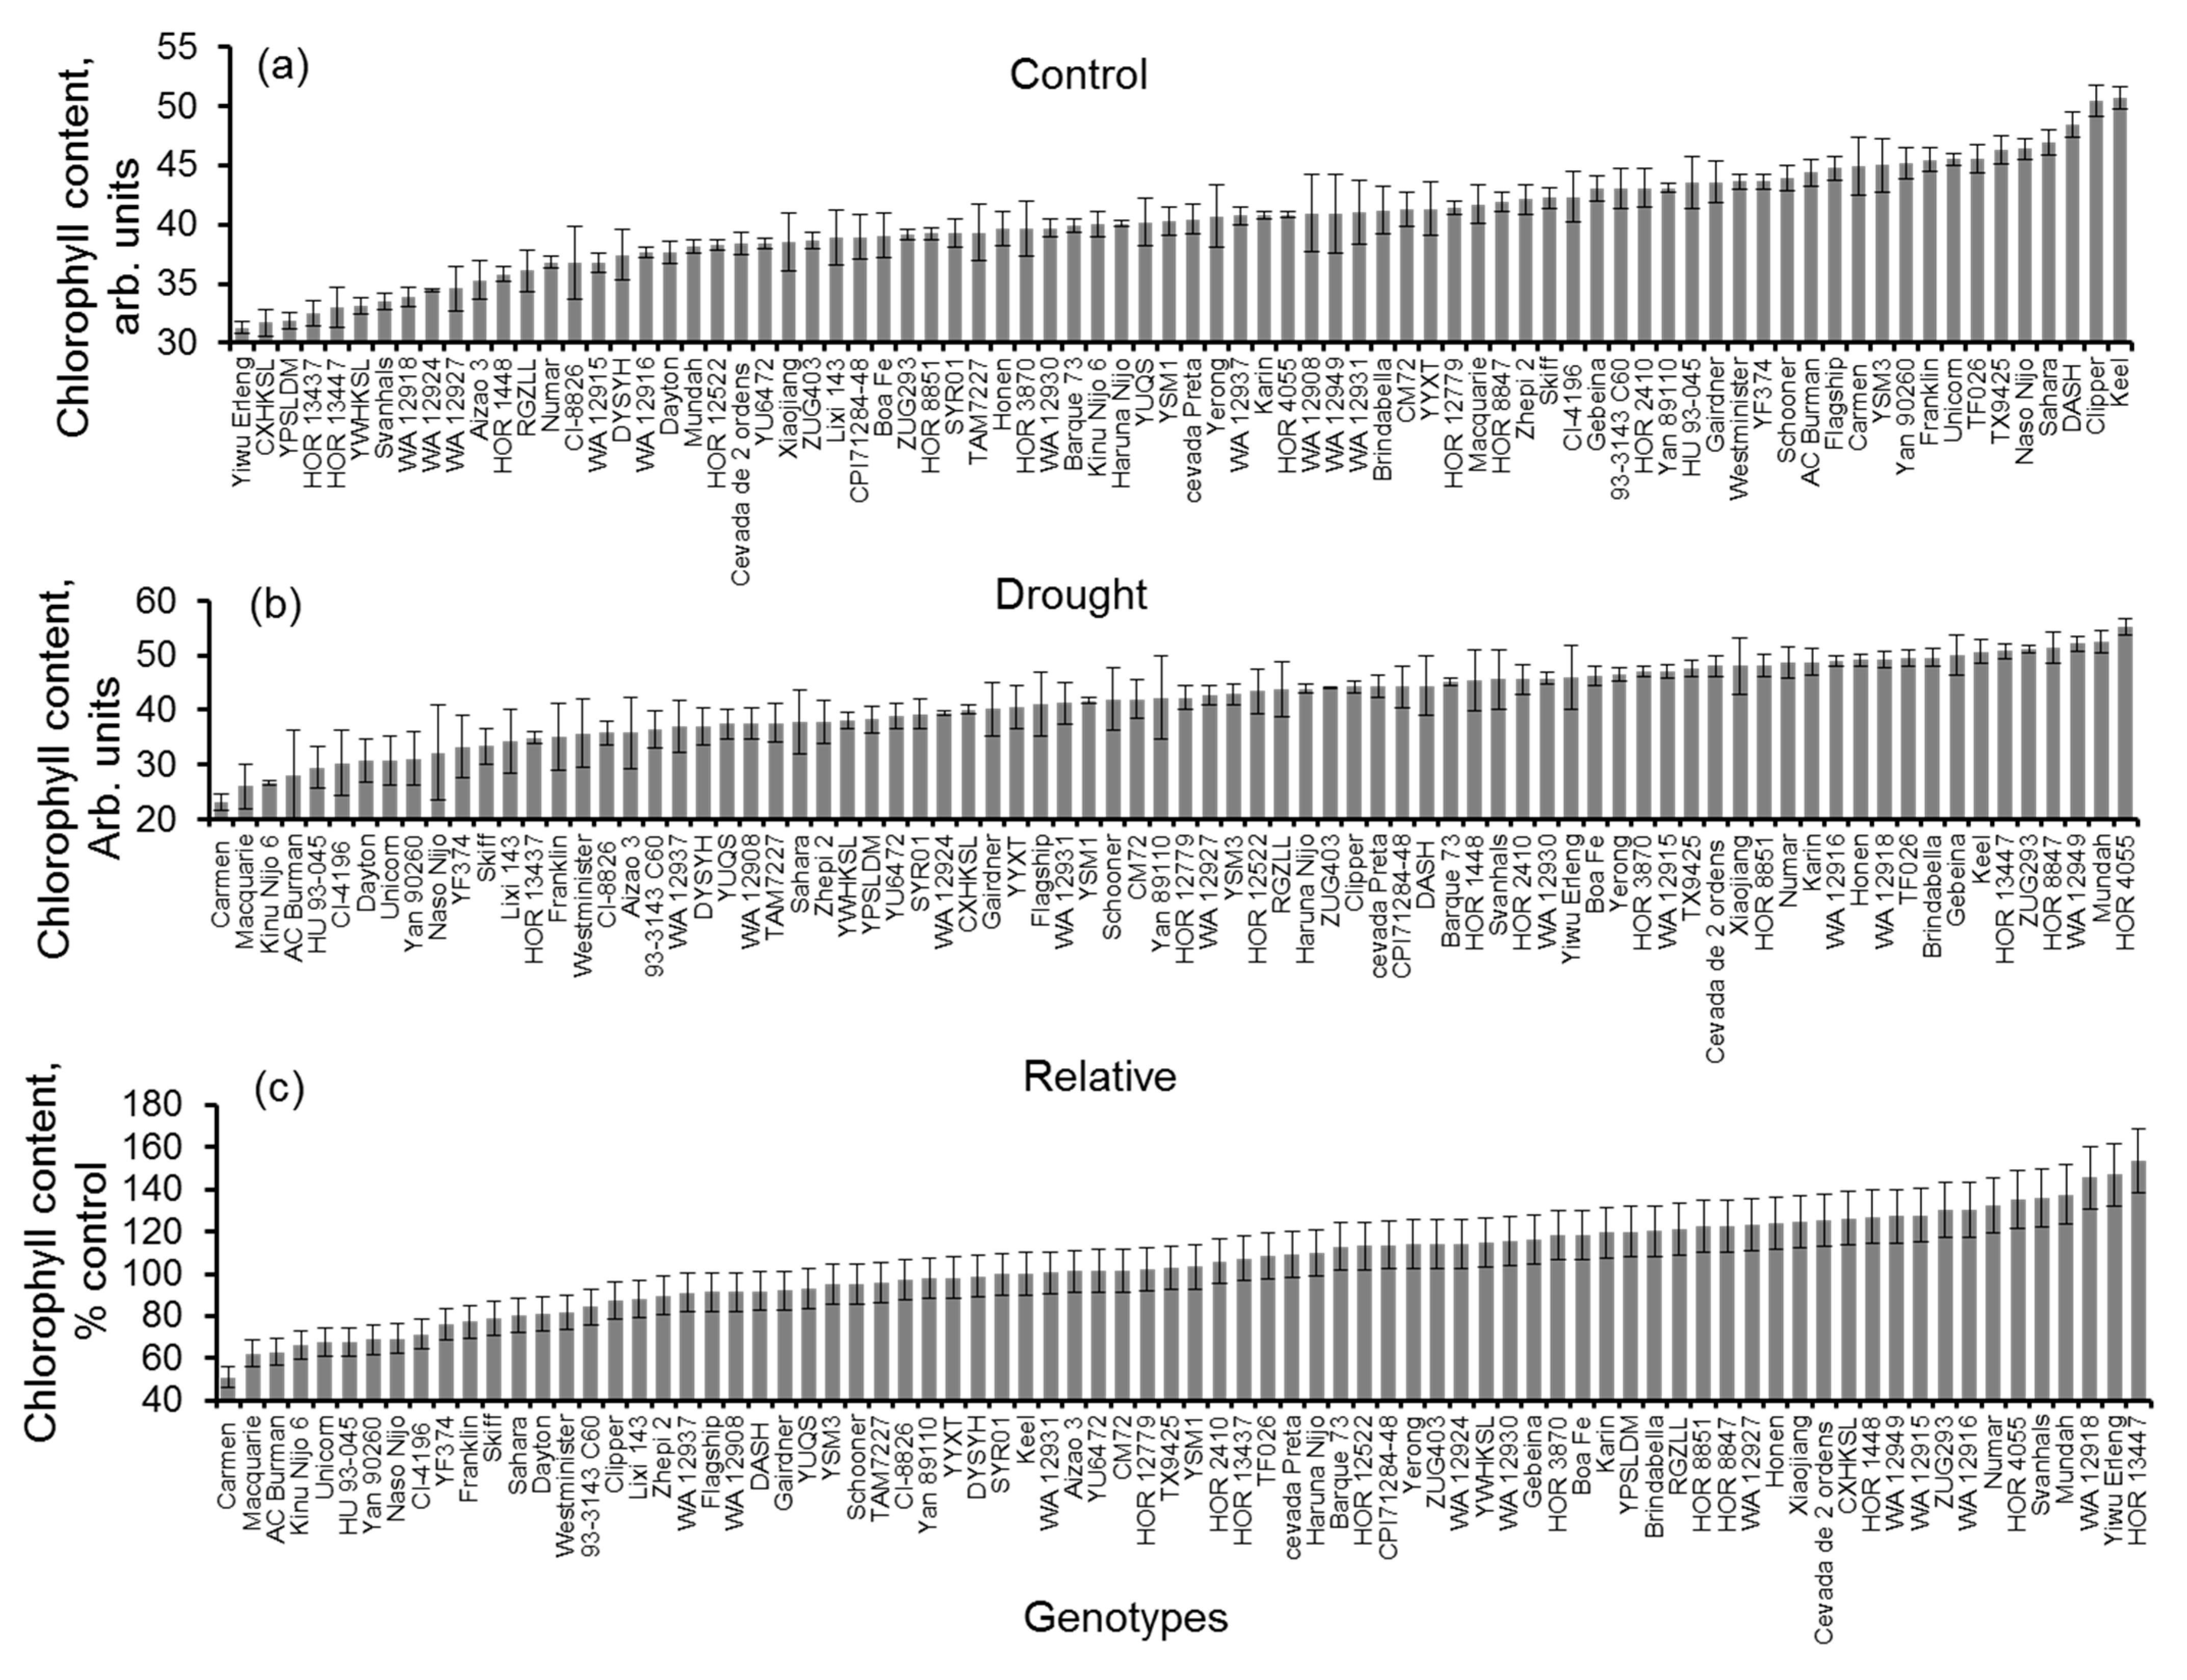
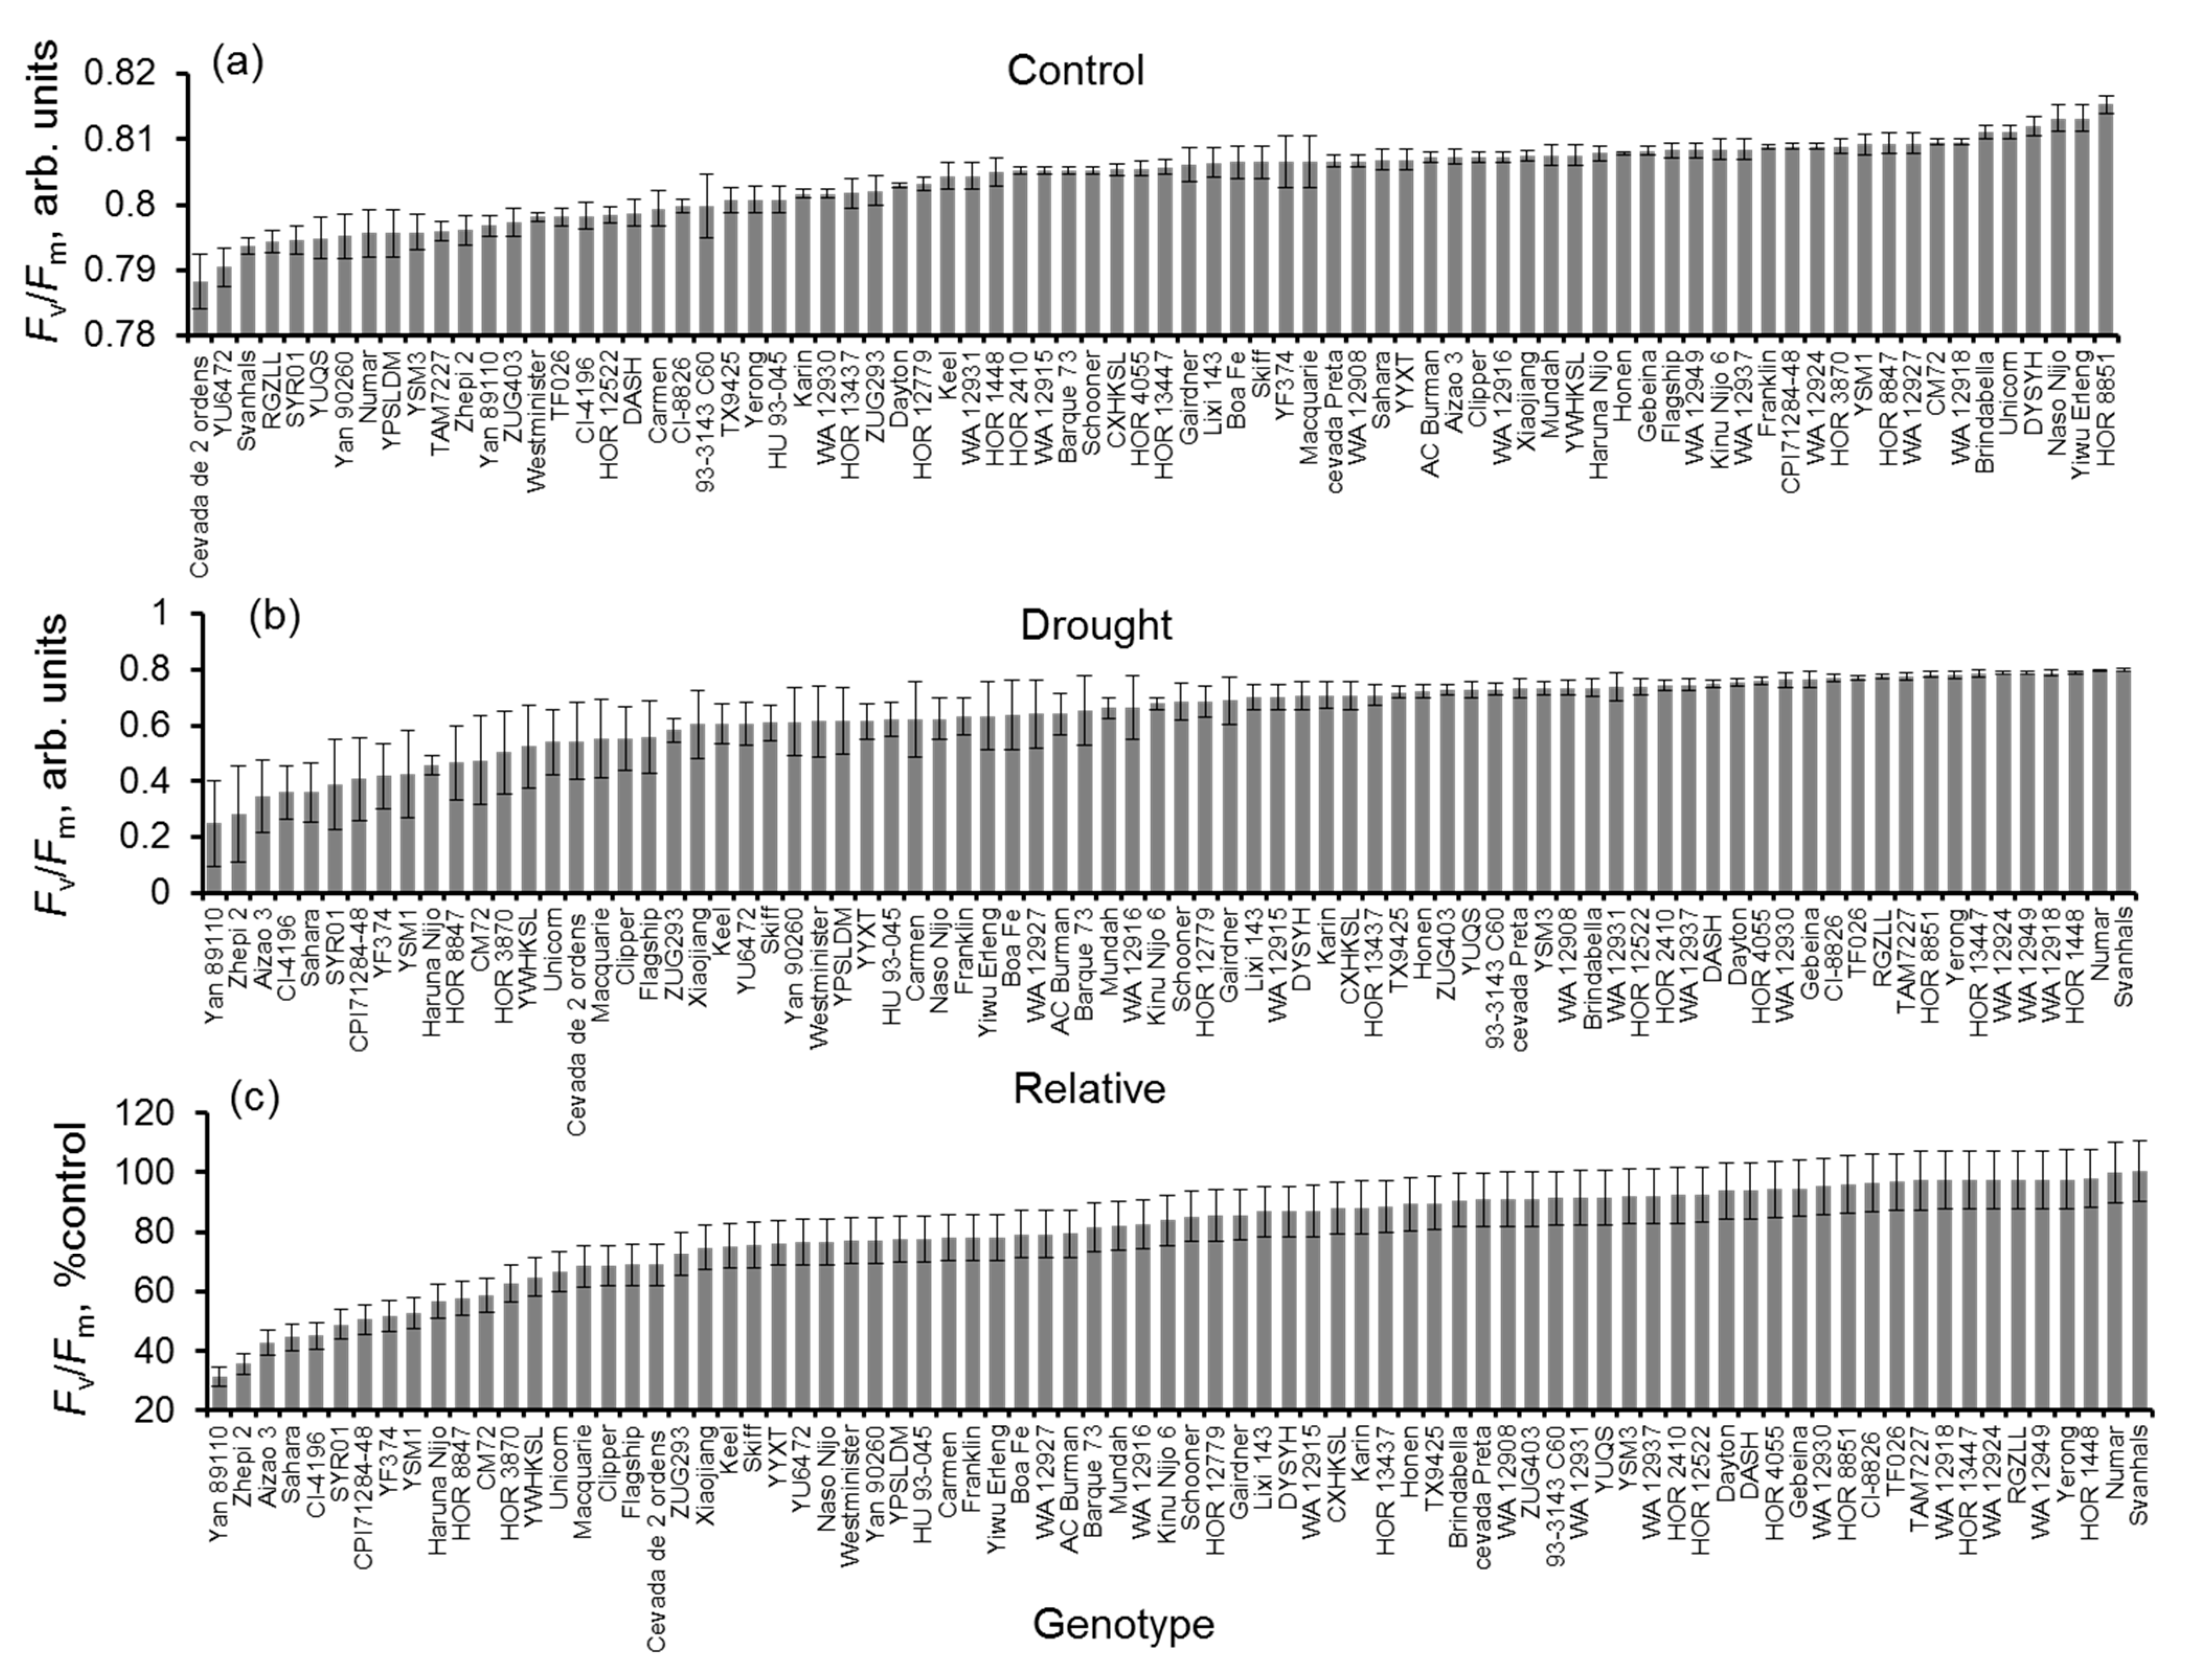
3.2. Impact of Drought Stress on Chlorophyll Content and Chlorophyll Fluorescence

Chlorophyll content (SPAD value) ranged between 31 ± 0.5 (arbitrary units) for the cultivar YiwuErleng and 50 ± 0.9 for the cultivar Keel in control plants (Figure 3a). SPAD values increased in almost half of the genotypes under drought stress conditions (most likely as a consequence of the reduction in the leaf area), ranging between 23 ± 1.5 for cv Carmen and 55 ± 1.6 for cv HOR4055 (Figure 3b). The relative changes (% of control) varied between genotypes and ranged between 51% for cv Carmen and 154% for cv HOR13447 (Figure 3c).
The chlorophyll fluorescence Fv/Fm ratio ranged between 0.79 and 0.82 among the genotypes under control (irrigated) conditions (Figure 4a) and was reduced in all genotypes under drought stress conditions. About threefold variation was found in the Fv/Fm values among the genotypes under drought stress conditions, with Fv/Fm values ranging 0.25 ± 0.2 for cv Yan89110 and 0.80 ± 0.01 for cv Svanhals (Figure 4b). The relative values of Fv/Fm of drought-stressed plants (% of control) showed a great extent of genotypic variation, ranging between 31% for cv Yan89110 and 100% for cv Svanhals (Figure 4c).

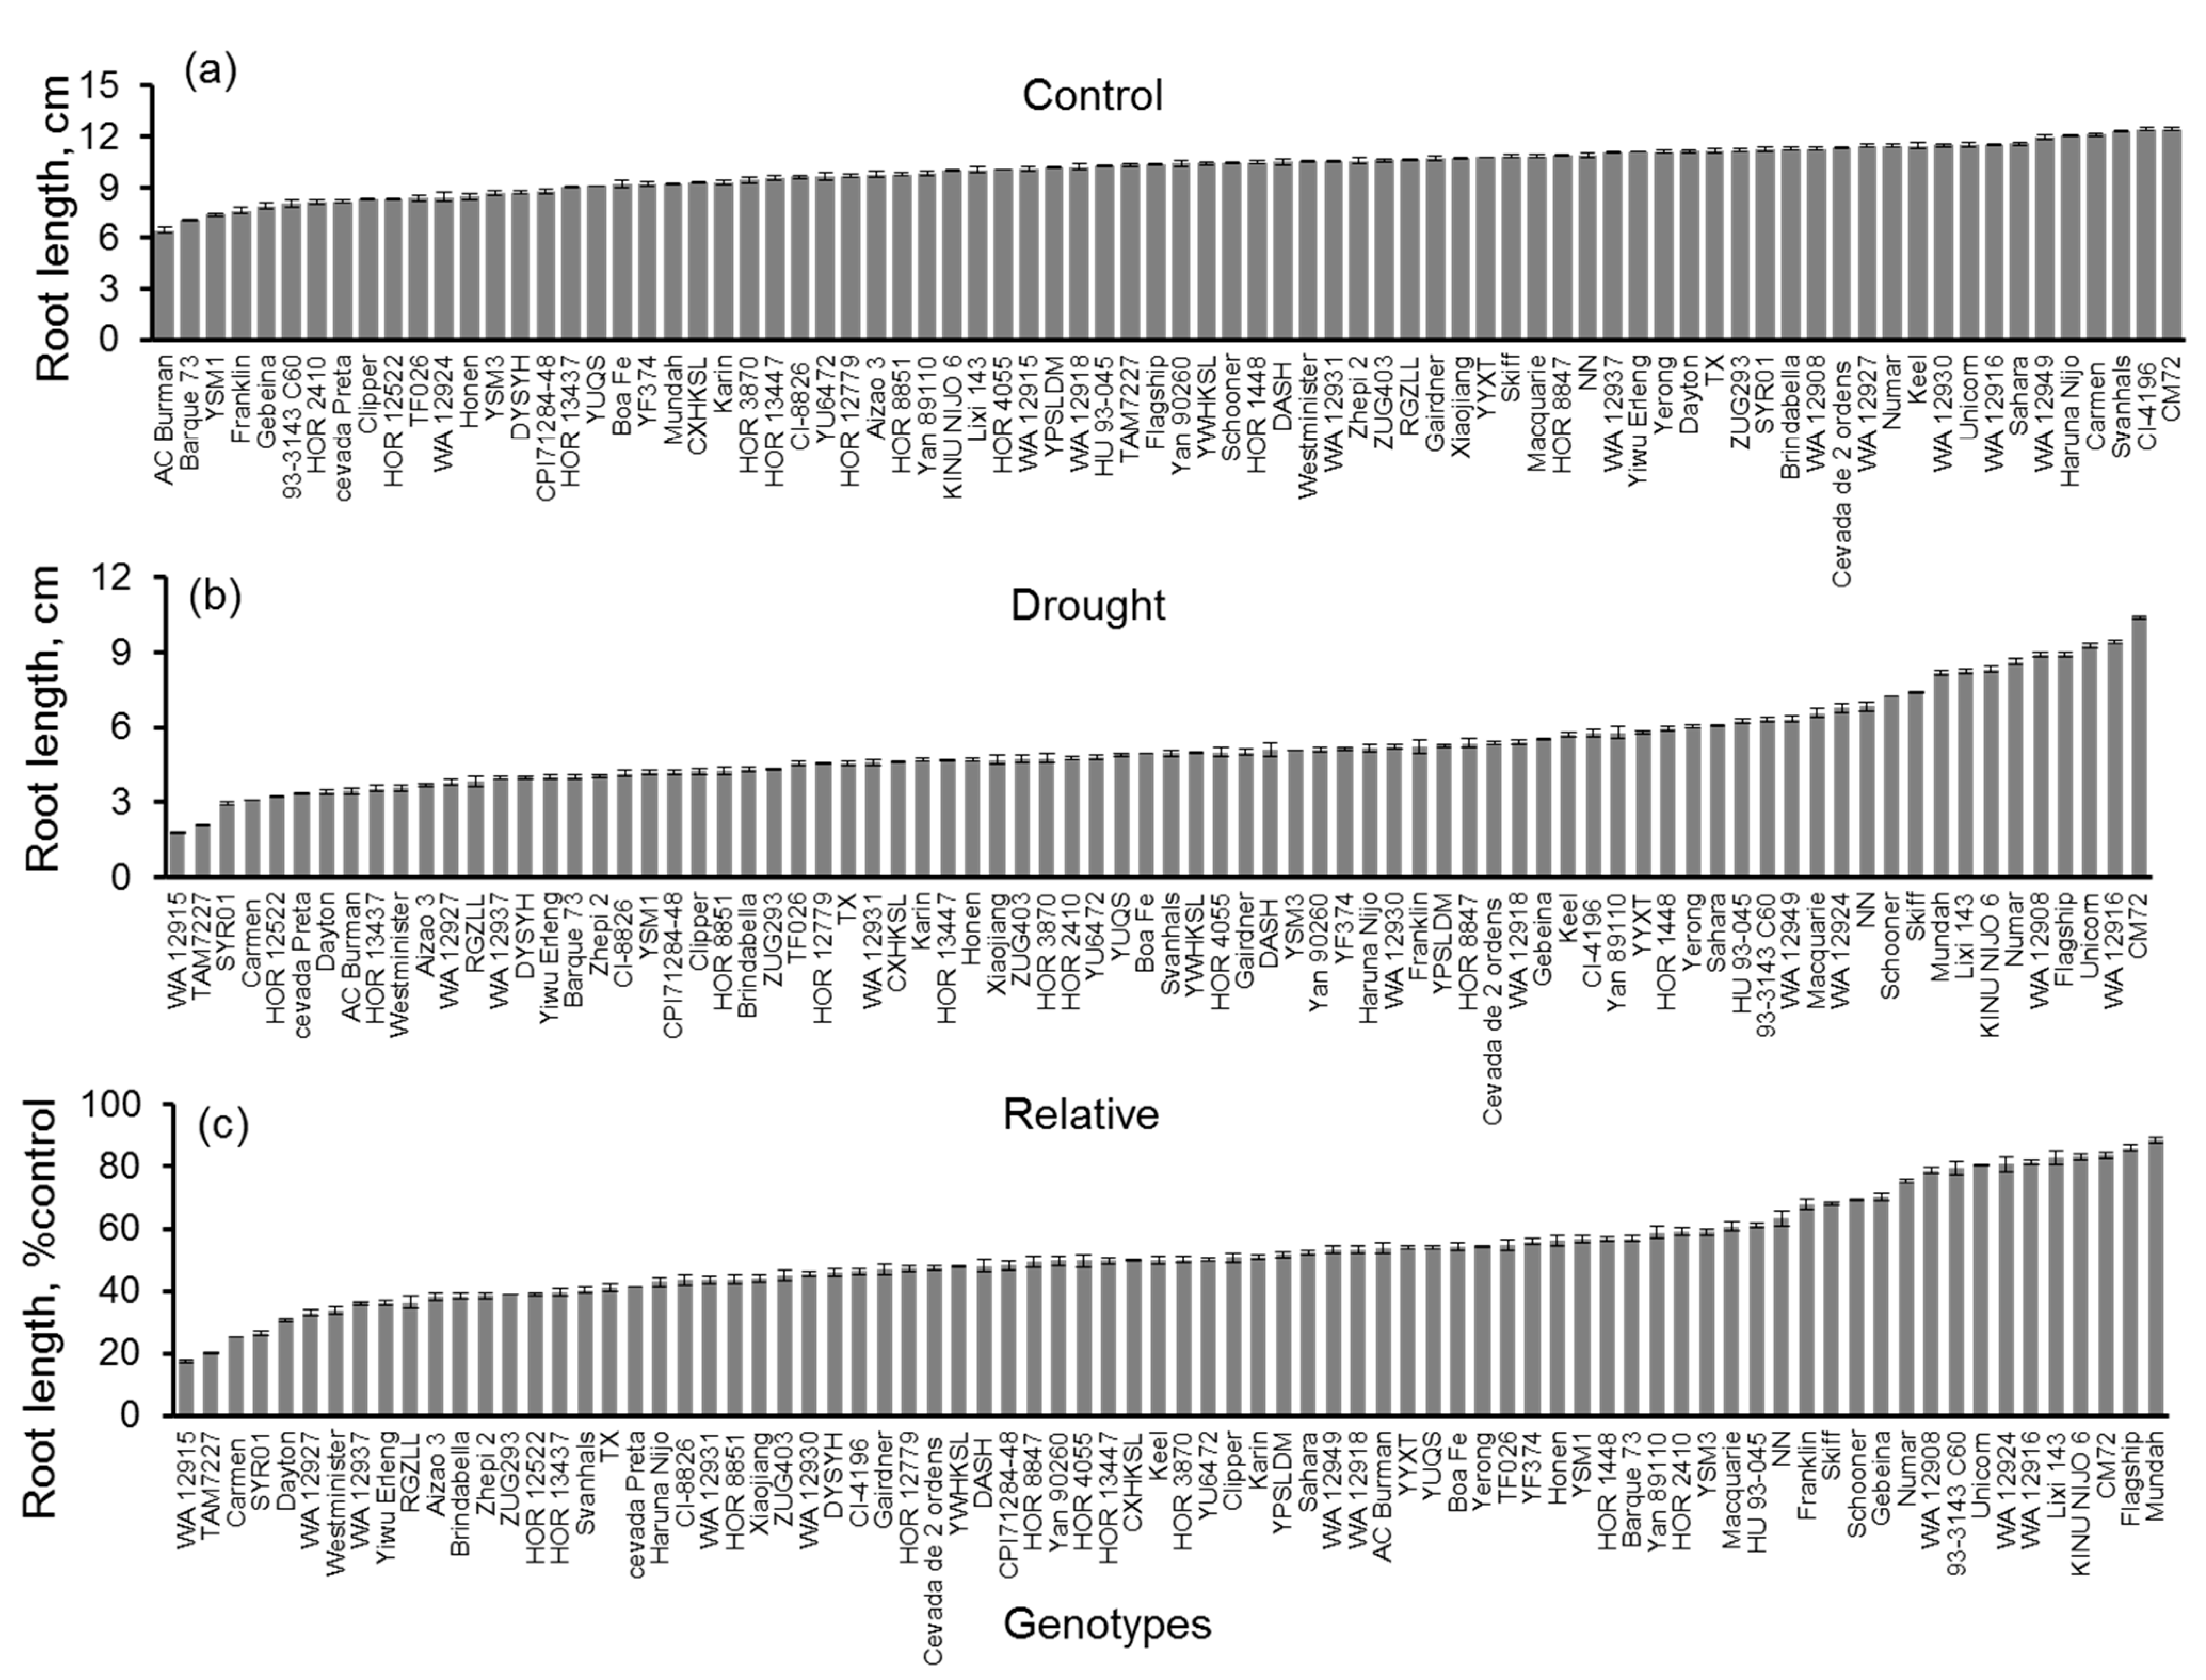
3.3. Seedling Tests in Control and PEG Solution

About twofold variation was found in the root length of the seedlings grown under control conditions, with root lengths ranging between 6 ± 0.2 cm for cv AC Burman and 12 ± 0.1 cm for cv CM72 (Figure 5a). Root length was reduced in all genotypes upon 15% (w/v) PEG 8000 treatment. About fivefold genotypic variability was observed in the root length under drought stress imposed by 15% (w/v) PEG 8000, ranging between 2 cm for genotype cv WA12915 and 10 ± 0.1 cm for cv CM72 (Figure 5b). Changes in the root length under drought stress (% of control) showed significant variation between the genotypes, ranging from 17% for the genotype WA12915 (highest reduction) to 89% for the genotype Mundah (lowest reduction) (Figure 5c).

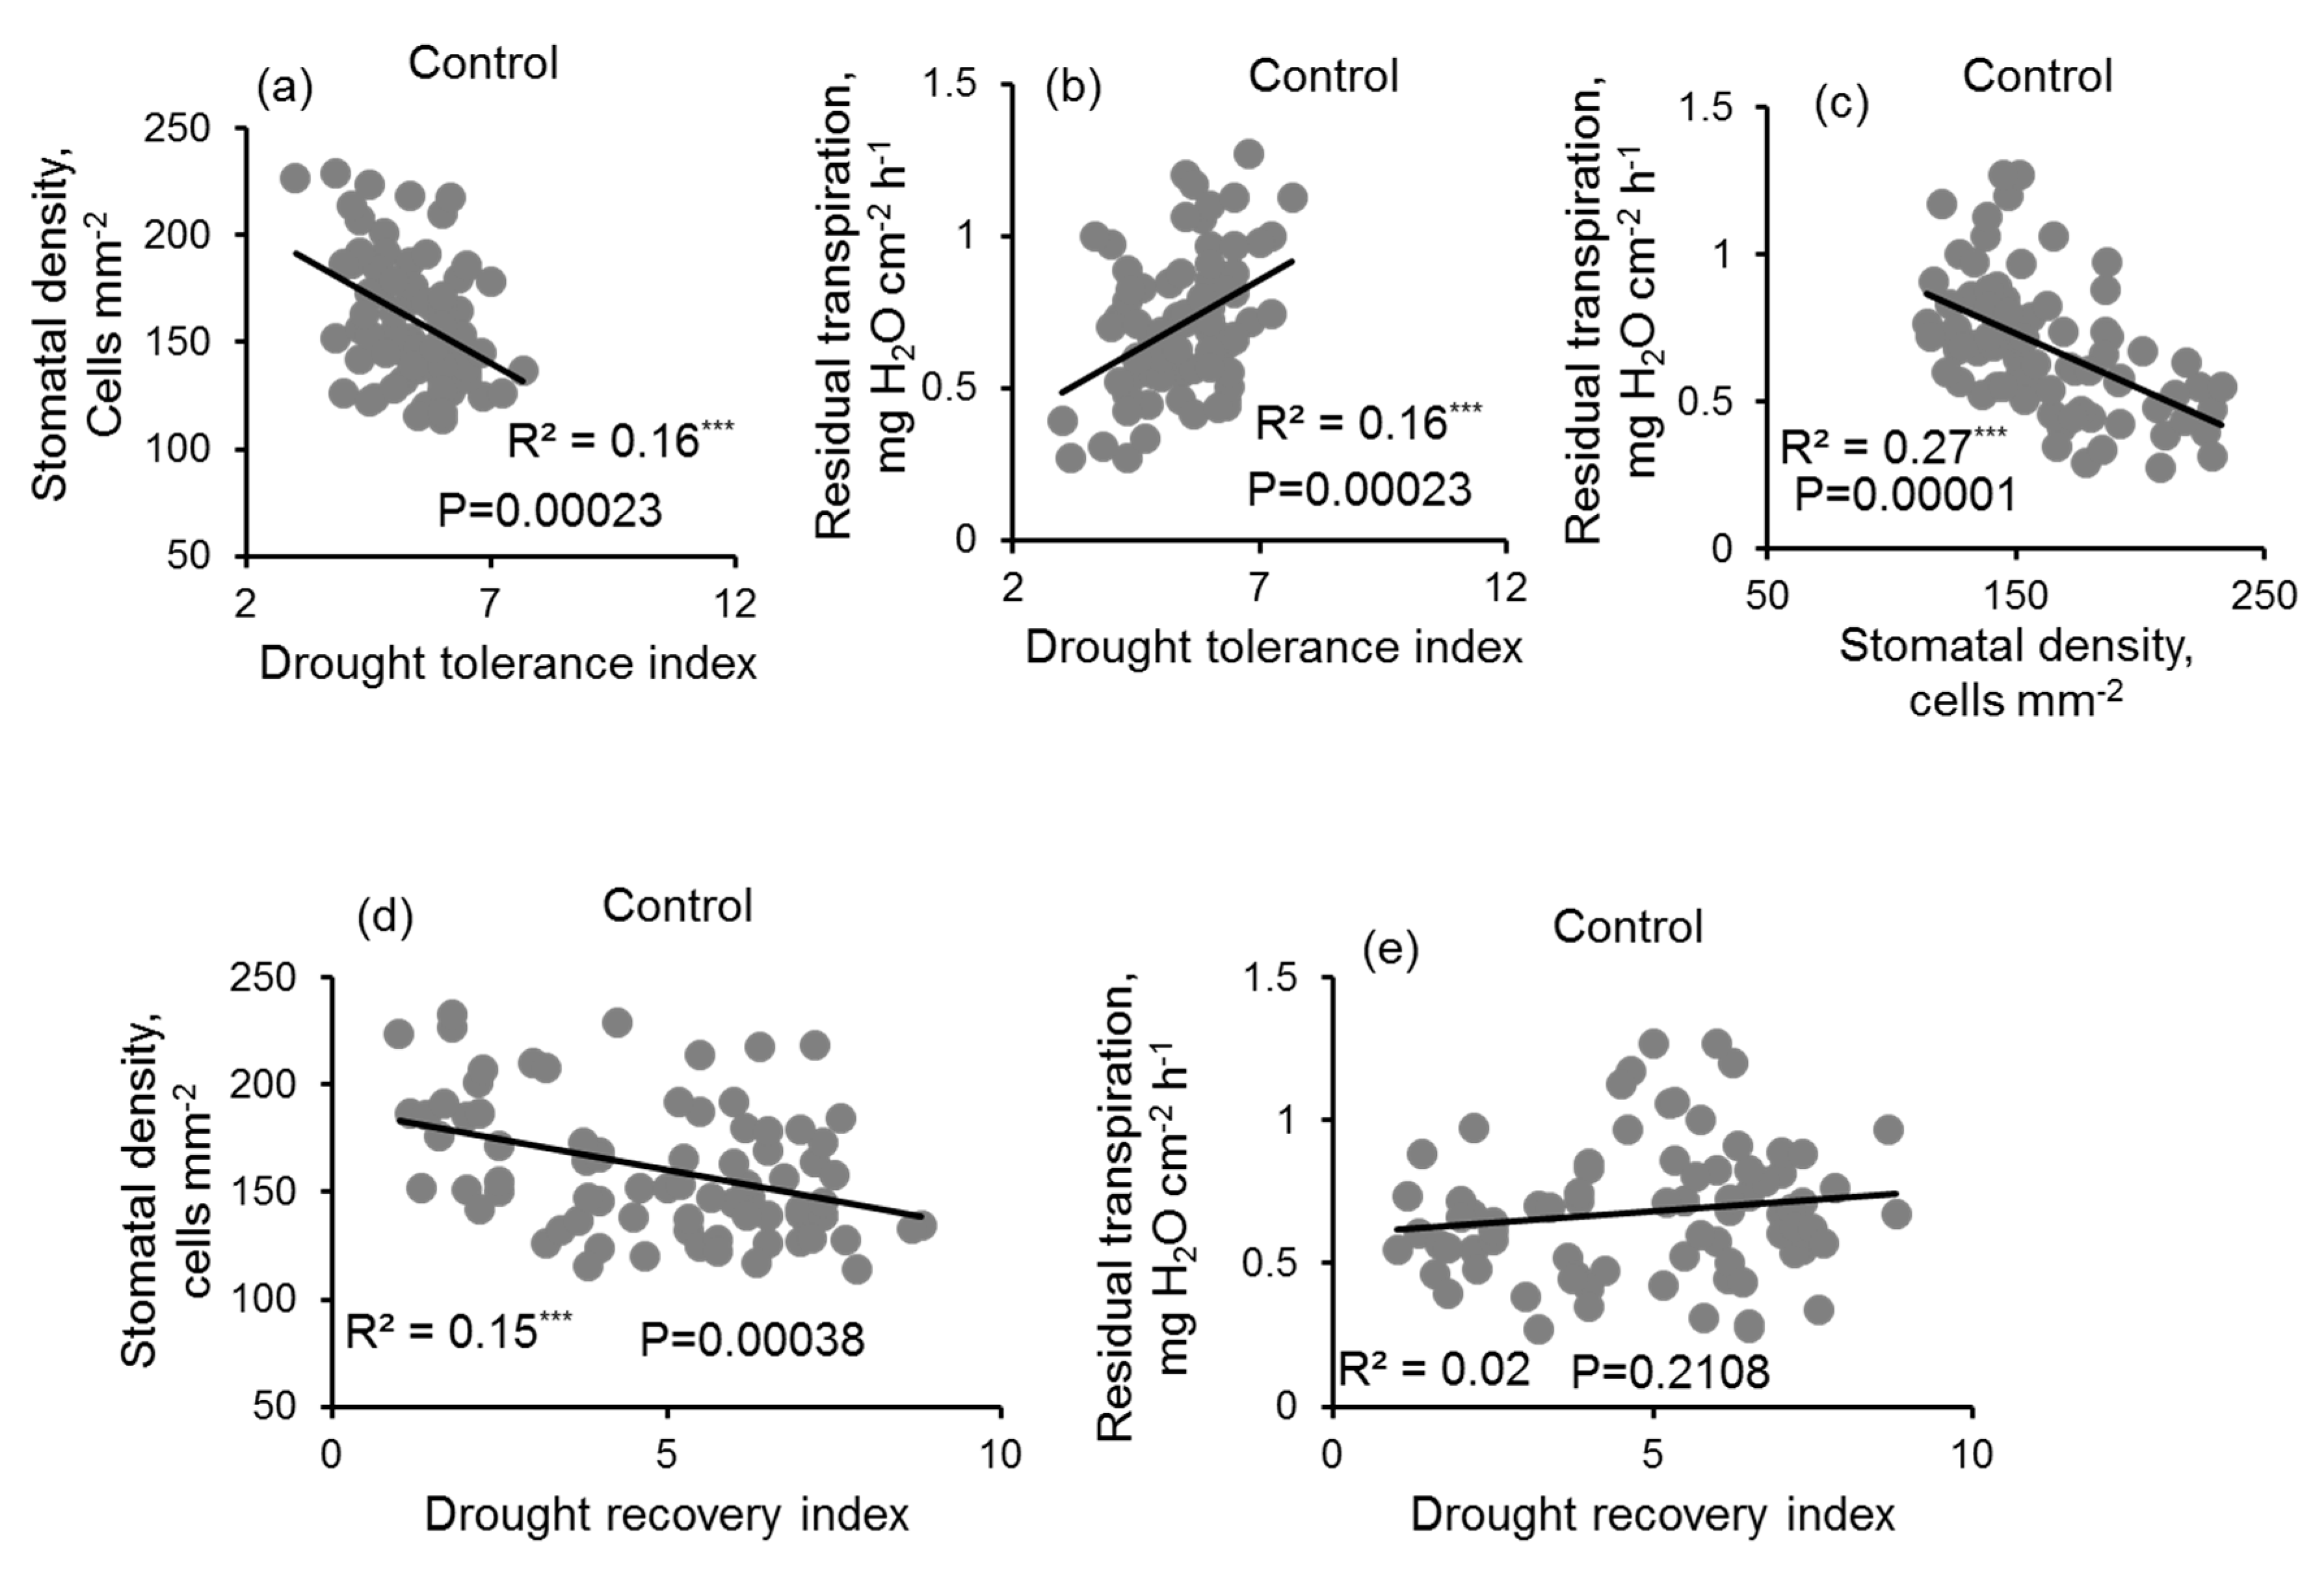
3.4. Correlation Analysis

No significant correlation (R2 = 0.03; p > 0.05) was found between SPAD chlorophyll values under control conditions and the drought tolerance index (Table 3 and Figure S1a). A significant positive correlation (R2 = 0.29; p < 0.001) was observed between the SPAD values of drought-stressed plants and the drought tolerance index (Table 3 and Figure S1b). The relative changes (% of control) in the SPAD values of drought-stressed plants were positively correlated (R2 = 0.28; p < 0.001) with the drought tolerance index (Table 3 and Figure S1c). The Fv/Fm values of irrigated plants were not significantly correlated (R2 = 0.01; p > 0.05) with the drought tolerance index (Table 3 and Figure S1d), whereas the Fv/Fm values under drought stress conditions showed a significant positive correlation (R2 = 0.19; p < 0.001) with the drought tolerance index (Table 3 and Figure S1e). The relative changes in the Fv/Fm values of drought-stressed plants (% of control) were significantly correlated (R2 = 0.19; p < 0.001) with the drought tolerance index (Table 3 and Figure S1f).
A significant negative correlation (R2 = 0.14; p < 0.001) was found between SPAD chlorophyll values under control conditions and the drought recovery index (Table 4 and Figure S2a). A significant positive correlation (R2 = 0.16; p < 0.001) was observed between chlorophyll SPAD values in drought-affected plants and the drought recovery index (Table 4 and Figure S2b). The relative changes (% of control) in the SPAD values of drought-stressed plants showed a significant positive correlation (R2 = 0.18; p < 0.001) with the drought recovery scoring index (Table 4 and Figure S2c). No significant correlation was found between the Fv/Fm values of irrigated plants (R2 = 0.00; p > 0.05) and the drought recovery index (Table 4 and Figure S2d), while the Fv/Fm values under drought stress conditions showed a significant positive correlation (R2 = 0.17; p < 0.001) with the drought recovery index (Table 4 and Figure S2e). A significant positive correlation (R2 = 0.16; p < 0.001) was observed between the relative changes in Fv/Fm values under drought stress conditions (% of control) and the drought recovery index (Table 4 and Figure S2f).
No significant genotypic association (p > 0.05) was observed between the root length under either the control conditions or the 15% (w/v) PEG 8000 treatment and the drought tolerance index (Table 4 and Figure S3a–c). The root growth of barley seedlings grown under controlled conditions did not show any significant correlation (p > 0.05) with the drought recovery index (Table 4 and Figure S3d). However, a significant negative correlation (R2 = 0.17; p < 0.001) was found between the root growth of seedlings grown under the 15% (w/v) PEG 8000 treatment and the relative changes in PEG-induced drought stress (R2 = 0.14; p < 0.001) and the drought recovery index (Table 4 and Figure S3e,f).
The stomatal density of control plants showed a strong negative correlation (R2 = 0.16; p < 0.001) with the drought tolerance index (Figure 6a). At the same time, a significant positive correlation (R2 = 0.16; p < 0.001) was found between RT under control conditions and the drought tolerance index (Figure 6b). Interestingly, the RT was significantly (R2 = 0.27) correlated with the SD of control plants (Figure 6c). The stomatal density of control plants showed a strong negative correlation (R2 = 0.15; p < 0.001) with the drought recovery index (Figure 6d). No significant correlation (R2 = 0.02; p > 0.05) was found between RT under control conditions and the drought recovery index (Figure 6e).

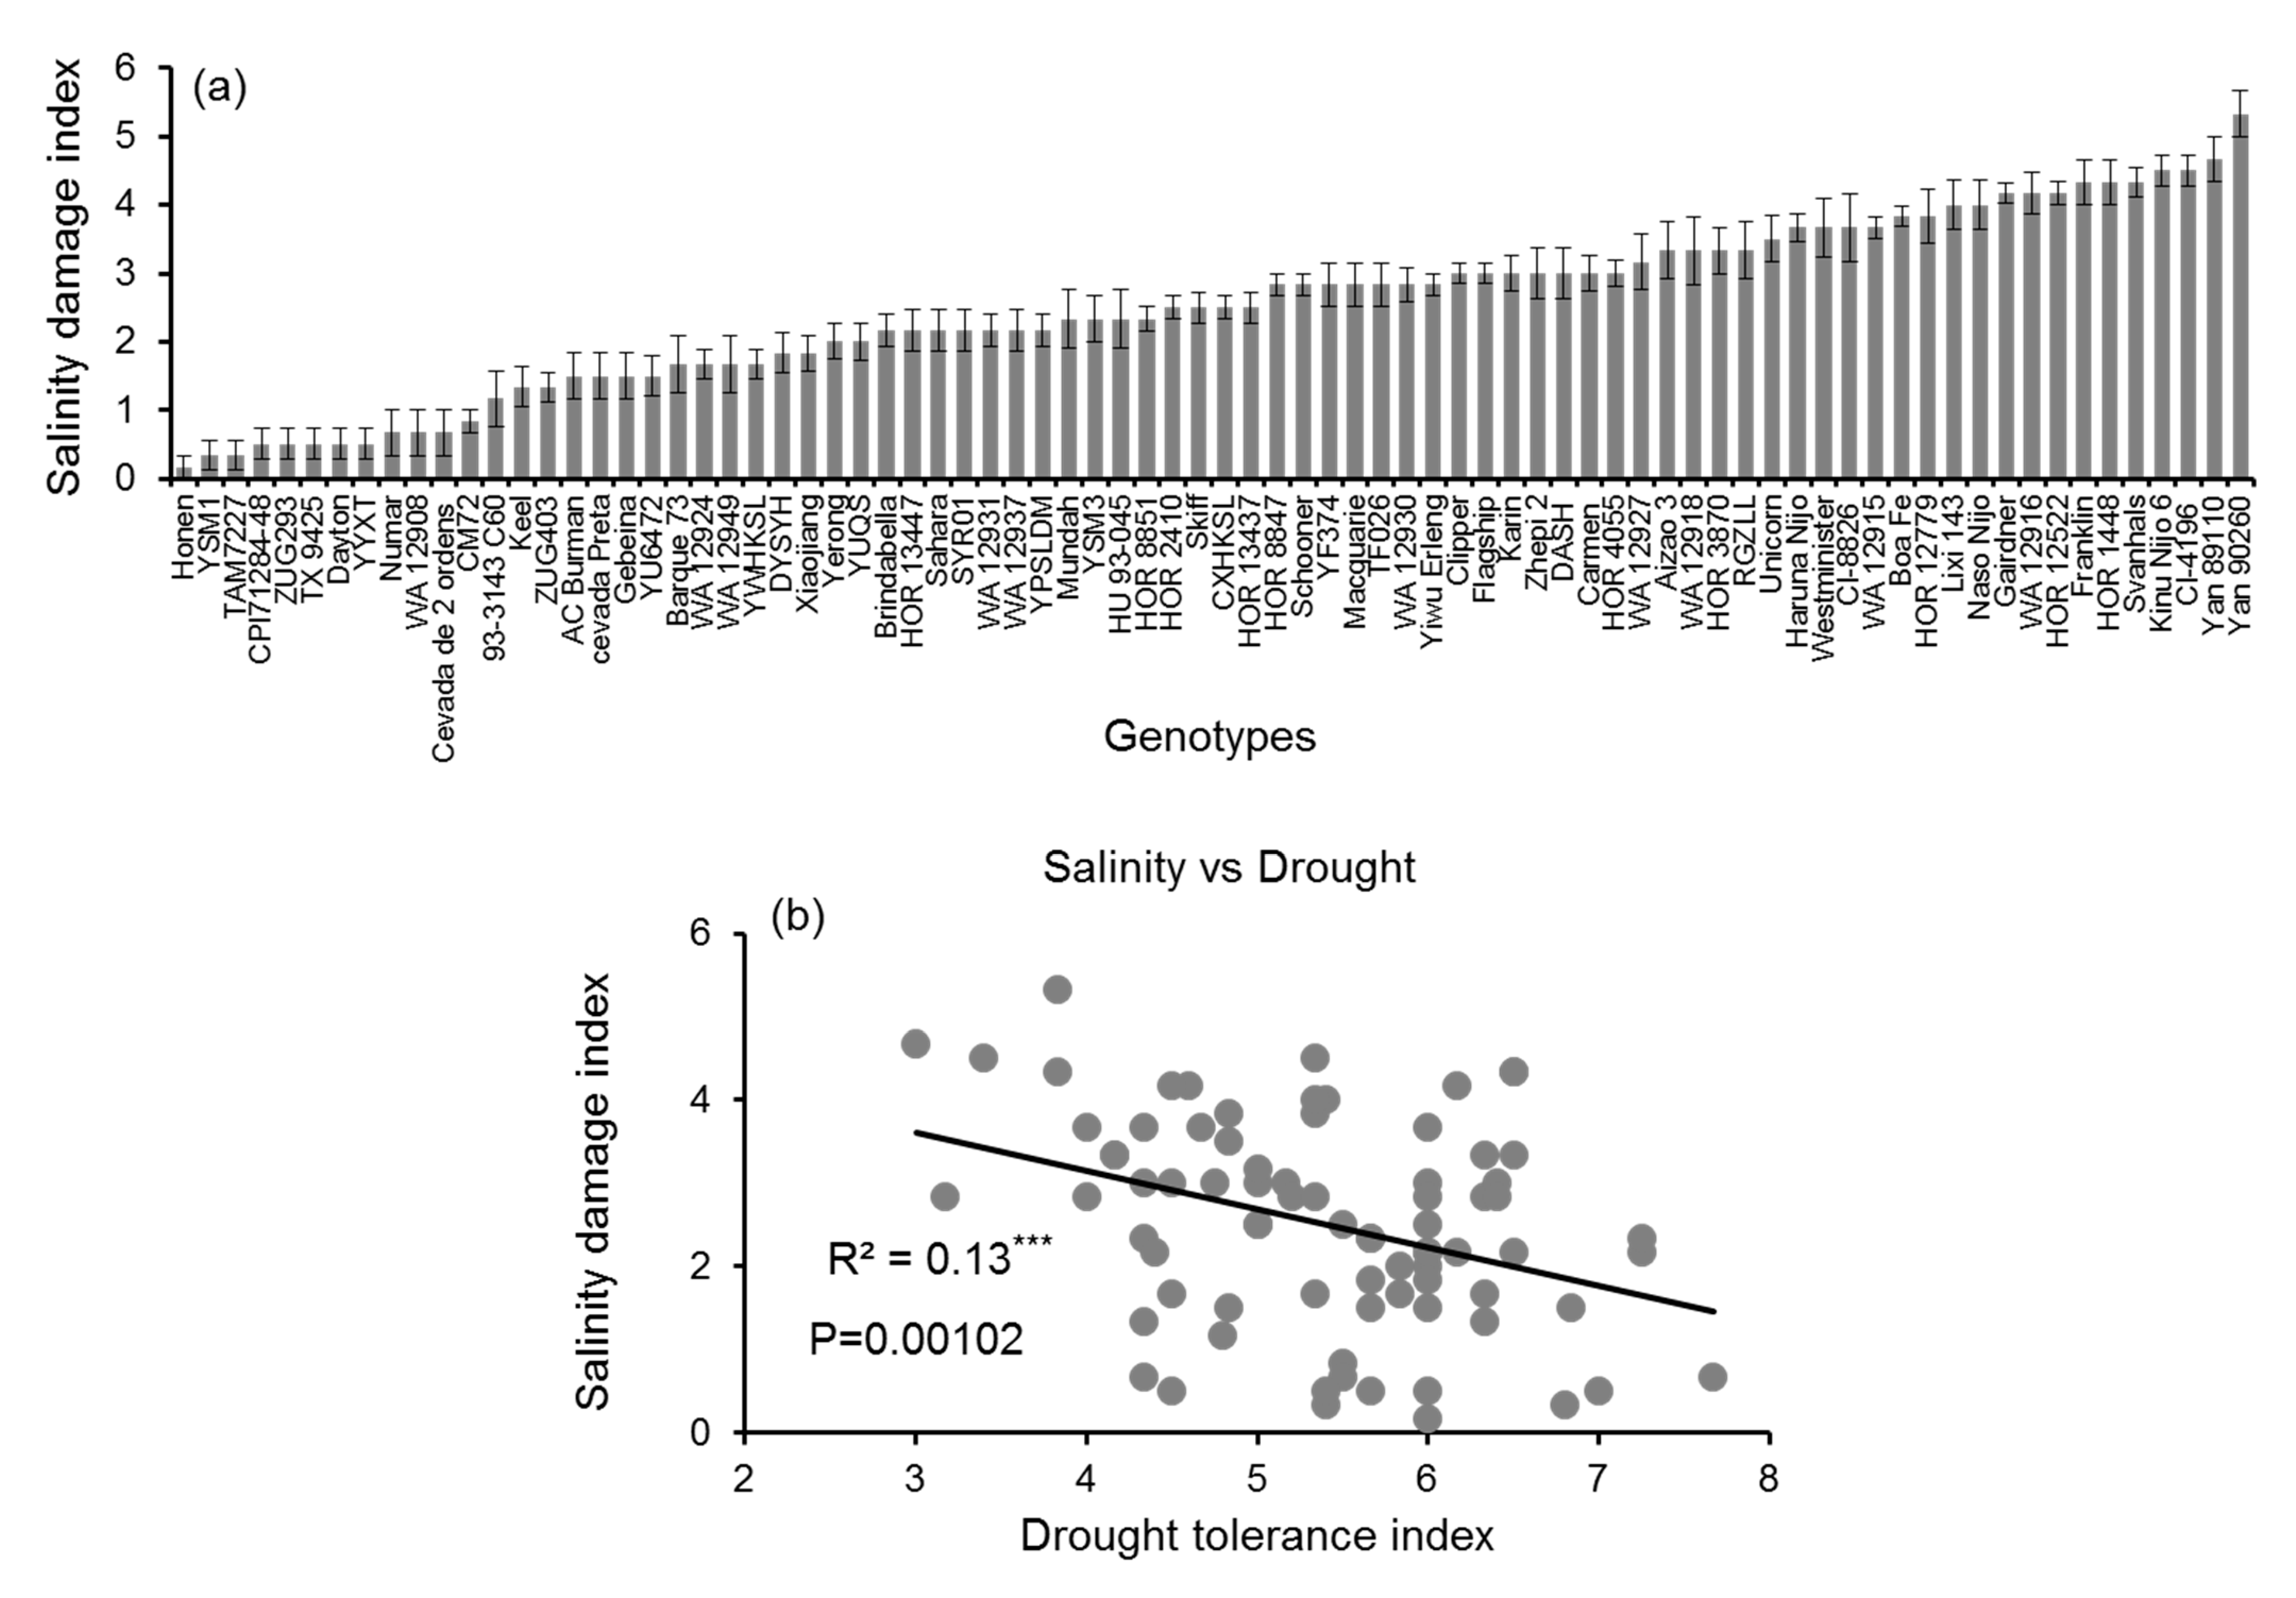
3.5. Drought Stress vs. Salinity Stress

The drought tolerance index was significantly correlated (R2 = 0.13; p < 0.001) with the salinity damage index (where lower numbers denote tolerant genotypes) assessed using the same 80 barley genotypes grown with 300 mM NaCl for 4 weeks under the same glasshouse conditions (Figure 7b).

4. Discussion

4.1. Drought Tolerance and Recovery Indices Were Correlated with One Another

Both irrigated and non-irrigated crops in arid and temperate climates are regularly subjected to regular periods of drought and recovery. A great extent of genotypic variability was found among the barley genotypes in terms of their ability to both tolerate drought and recover from drought stress (Figure 2a,b). The correlation analysis (Figure 2c) revealed that the drought tolerance and drought recovery are strongly related, and potentially share some common mechanisms.

4.2. SPAD Values and Fv/Fm Ratios Showed a Strong Correlation with the Drought Tolerance Index and Drought Recovery Index

Chlorophyll content is frequently used for rapid and cost-effective measurements for the determination of drought tolerance. Drought stress somewhat negatively affects chlorophyll content as a result of photo-oxidation caused by reactive oxygen species (ROS) accumulation. However, in our study, SPAD chlorophyll content increased in half of the genotypes and decreased in the other 50% of plants under drought stress conditions. The significant positive correlations between SPAD chlorophyll content and the overall drought tolerance index (Table 4 and Figure S1b,c) and the drought recovery index (Table 4 and Figure S2b,c) suggest that tolerant barley genotypes are capable of maintaining higher chlorophyll content under drought stress conditions; this trait may contribute to a quick recovery from drought after reintroducing water by resuming photosynthesis [34]. The chlorophyll density per unit leaf area of drought-tolerant genotypes may be increased due to reduction in the leaf area and increased leaf thickness. Maintaining higher chlorophyll content under drought stress conditions due to higher chlorophyll density per unit leaf area could be an adaptive strategy of plants to increase their drought tolerance [6,32]. The chlorophyll fluorescence Fv/Fm ratio is one of the sensitive indicators of the severity of drought stress [35]. In this study, the Fv/Fm values were reduced in all genotypes under drought stress conditions, but tolerant genotypes maintained higher Fv/Fm. A significant positive correlation between the Fv/Fm values of drought-stressed plants and the drought tolerance index indicates that PSII was inhibited more in the sensitive genotypes than in the tolerant genotypes (Table 4 and Figure S1e,f). Similarly, the drought recovery index had a significant positive correlation with both the Fv/Fm ratio under drought stress and the relative changes in drought stress (% of control), indicating that the tolerant genotypes had the ability to repair PSII after being exposed to severe drought stress (Table 4 and Figure S2e,f). The theoretical maximum Fv/Fm value of newly grown leaves is 0.83 [36], suggesting that after rewatering the tolerant genotypes were able to repair PSII and recovered Fv/Fm ratios close to this optimum. Taken together, the results suggest that the ability to maintain the stability of photosynthetic pigment and the photosynthesis system after exposure to severe drought and rebuild the photosystem after rewatering increases plants’ adaptability to drought.

4.3. PEG-Induced Drought Stress and Root Length

Root growth is strongly inhibited when plants are subjected to drought stress. Here, we showed that the root lengths of all barley genotypes were reduced under PEG-induced osmotic stress compared to the control plants (Figure 5b). However, no significant correlation was found between the drought tolerance index and the root length in either the control or PEG treatments (Table 4 and Figure S3a–c). This result is consistent with our previous pilot study including fewer (just six) contrasting genotypes [32]. These results indicated that the longer roots of barley seedlings during germination under PEG-induced drought stress did not help to increase drought tolerance at later stages. This could be explained by the fact that drought tolerance may be a growth-stage-specific crop trait that can change over the course of the crop’s life cycle. It has been found that barley genotypes that exhibit tolerance in the seedling stage have lower productivity at adult stages under drought conditions [37]. However, in this experiment, plant performance was assessed in small pots, where loner roots were not expected to bring any benefit in terms of access to water. The latter trait would only become apparent where rooting depth was not constrained (in the field). Interestingly, the root length of barley seedlings grown under PEG-induced drought stress and the relative (% of control) changes were significantly correlated with the drought recovery index (Table 4 and Figure S3e,f). This result indicates that plants may need denser and finer root systems to absorb larger quantities of water, rather than having thinner, longer roots during the post-drought recovery stage, because a higher number of roots may make contact with more water vapor present in the soil [38,39].

4.4. Drought Stress Tolerance Index Was Negatively Correlated with Stomatal Density but Positively Correlated with the Residual Transpiration of Irrigated Plants

Stomata are the main getaway of gas diffusion and water loss in plants and play a central role in CO2 uptake for photosynthesis and transpiration, ultimately contributing to plants’ productivity and water-use efficiency [40]. As a rule of thumb, SD is positively associated with Gs, and Gs is positively associated with photosynthesis [41]. However, in our study, a significant negative correlation was found between SD and the drought tolerance index, indicating that tolerant genotypes had lower SD under irrigated conditions. These results are consistent with previous results showing that salt-stress-tolerant barley genotypes (i.e., adapted to a “physiological drought’) have naturally lower SD than sensitive genotypes [42,43]. Plants with higher SD and higher Gs have the maximum CO2 assimilation rate, which increases the capacity of photosynthesis and plant biomass under optimal growth conditions, but they generally show lower WUE under stress conditions. Due to the lower SD and Gs, tolerant barley genotypes may have lower productivity under optimal growth conditions but possess better survival capacity under drought stress conditions than the standard sensitive genotypes. This may be due to improved WUE under stressed conditions [23]. Recently, it has been suggested that manipulation of SD in barley by overexpression of EPF significantly reduces SD and shows increased drought tolerance and WUE, without impacting the grain yield [24].
Interestingly, a significant positive association between RT and the drought tolerance index (Figure 6b) showed that drought-tolerant genotypes transpire more water through the cuticle under well-irrigated conditions. This might be due to the fact that the tolerant barley genotypes close their stomata more gradually than the sensitive barley genotypes. This finding is consistent with our previous result showing that salt-tolerant barley varieties have higher RT than the sensitive genotypes under normal growth conditions [33]. In addition, higher RT in drought-resistant genotypes of oat, wheat, and cotton leaves was also found under irrigated conditions [44,45]. At the same time, it was found that the RT of salinity-tolerant barley genotypes reduced further than that of the sensitive genotypes under environmental stress conditions, potentially increasing their WUE and survival capability in response to stress conditions. Further analysis of the correlation between SD and RT implies that reduced SD increases water loss via the cuticle (Figure 6c). This could be explained by the fact that plants may balance their total transpirational water loss by shifting stomatal water loss to RT under non-stress environmental conditions.
It is usually assumed that RT is determined by the amount of epicuticular wax deposited on the leaf surface [46]. It was previously shown that drought stress increases the deposition of cuticular wax on the leaf surface by up to threefold in various plant species [47,48], thereby enabling plants to conserve more water by reducing RT while the stomata are closed or partially closed during drought episodes. Furthermore, it has been reported that cuticular wax protects plants during drought stress by reducing non-stomatal transpiration, and that the deposition of the total amount of cuticular wax is regulated by “waxy genes” such as CERs, WIN1/SHN1, and WAX2, which have been practically approved for enhancing drought tolerance and the adaptation of different crops to drought-stricken environments [49,50,51]. This view, however, was recently challenged by [52] who have shown that in poplar plants, more than 10-fold increase in wax amounts in the leaf cuticle did not lead to decreased rates of residual (cuticular) transpiration. More work is needed to reveal the causal link between wax deposition, RT, and drought tolerance.

4.5. Correlation between Drought and Salinity Stress Tolerance

While the physiological, anatomical, and biochemical responses of plants to drought and salinity may differ, depending on the severity and duration of the stress, there is a certain degree of similarity between them, as the availability of water to plants is reduced due to osmotic effects in saline soils. Here, salinity tolerance assessed based on the extent of leaf injury upon 300 mM NaCl treatment (Figure 7a) showed a significant correlation with drought tolerance (Figure 7b), suggesting some common mechanisms. Salinity stress imposes osmotic stress on roots, decreasing the ability of plants to take water from the soil, thus creating a “physiological drought” and reducing plants’ growth rate, along with a set of physiological, anatomical, and metabolic changes similar to those caused by drought stress. The latter include stomatal closure, decreased gas diffusion rates, inhibition of photosynthesis, and damage to cellular structures. In this context, regulation of leaf gas exchange, synthesis of compatible osmolytes for osmotic adjustment, and increased production of enzymatic and non-enzymatic antioxidants are considered to be common denominators in responses to both drought and salinity stresses [53].

5. Conclusions

The present results suggest that fast and efficient recovery of plants from drought is an essential component of the plants’ overall drought tolerance. Maintaining higher chlorophyll contents and Fv/Fm ratios under drought stress conditions contributes to better drought tolerance and subsequent drought recovery. Lower SD with higher RT of irrigated genotypes may play an important role in increasing WUE under drought stress conditions. These traits may be targeted by plant breeders. At the same time, longer roots do not appear to confer drought tolerance in barley. In addition, our results suggest that common mechanisms (most likely related to osmotic adjustment and WUE) are involved in drought tolerance and salinity tolerance in this species.

Supplementary Materials

The following supporting information can be downloaded at: https://www.mdpi.com/article/10.3390/agronomy12092136/s1, Figure S1: Correlations (Pearson’s R2 value) of chlorophyll content and Fv/Fm with the drought tolerance index: (a) correlation between chlorophyll content under irrigated conditions and the drought tolerance index; (b) correlation between chlorophyll content under drought stress conditions and the drought tolerance index; (c) correlation between chlorophyll content (% control) under drought stress conditions and the drought tolerance index; (d) correlation between Fv/Fm ratio under irrigated conditions and the drought tolerance index; (e) correlation between Fv/Fm ratio under drought stress conditions and the drought tolerance index; (f) correlation between Fv/Fm ratio (% control) under drought stress conditions and the drought tolerance index; *** p < 0.001 indicates significant differences by two-tailed test. Figure S2: Correlations (Pearson’s R2 value) of chlorophyll content and Fv/Fm with the drought recovery index: (a) correlation between chlorophyll content under irrigated conditions and the drought recovery index; (b) correlation between chlorophyll content under drought stress conditions and the drought recovery index; (c) correlation between chlorophyll content (% control) under drought stress conditions and the drought recovery index; (d) correlation between Fv/Fm ratio under irrigated conditions and the drought recovery index; (e) correlation between Fv/Fm ratio under drought stress conditions and the drought recovery index; (f) correlation between Fv/Fm ratio (% control) under drought stress conditions and the drought recovery index; *** p < 0.001 indicates significant differences by two-tailed test. Figure S3: Correlations (Pearson’s R2 value) between the root length and both the drought tolerance index and drought recovery index: (a) correlation between root length under control conditions and the drought tolerance index; (b) correlation between root length under PEG-induced drought stress conditions and the drought tolerance index; (c) correlation between root lengths (% control) under PEG-induced drought stress conditions and the drought tolerance index; (d) correlation between root length under irrigated conditions and the drought recovery index; (e) correlation between root length under PEG-induced drought stress conditions and the drought recovery index; (f) correlation between root length (% control) under PEG-induced drought stress conditions and the drought recovery index; *** p < 0.001 indicates significant differences by two-tailed test. Table S1: Origins of the different barley genotypes.

Author Contributions

Conceptualization, S.S. and M.Z.; methodology, S.S. and M.H.; validation, S.S., M.Z. and M.H.; formal analysis, M.H.; investigation, L.S. and T.J.B.; resources, L.S. and M.Z.; data curation, S.S.; writing—original draft preparation, M.H.; writing—review and editing, S.S., M.Z., L.S. and T.J.B.; supervision, L.S., M.Z. and S.S.; project administration, S.S., L.S. and M.Z.; funding acquisition, S.S. and M.Z. All authors have read and agreed to the published version of the manuscript.

Funding

This research was funded by Grains Research and Development Corporation (GRDC), grant number UT00027.

Institutional Review Board Statement

Not applicable.

Informed Consent Statement

Not applicable.

Data Availability Statement

Not applicable.

Acknowledgments

We thank Peter Johnson of the University of Tasmania, for his assistance with setting up the experiment and logistical support. We also thank Yun Fan and Tahseen Zeb for their help with sample preparation, and Ibrahim Ahmed and Shormin Chowdhury for their proofreading of the article.

Conflicts of Interest

The authors declare no conflict of interest.

References

  1. Liu, M.; Liu, P.; Guo, Y.; Wang, Y.; Geng, X.; Nie, Z.; Yu, Y. Change-point analysis of precipitation and drought extremes in china over the past 50 years. Atmosphere 2020, 11, 11. [Google Scholar] [CrossRef]
  2. Yu, C.; Huang, X.; Chen, H.; Huang, G.; Ni, S.; Wright, J.S.; Hall, J.; Ciais, P.; Zhang, J.; Xiao, Y.; et al. Assessing the impacts of extreme agricultural droughts in China under climate and socioeconomic changes. Earths Future 2018, 6, 689–703. [Google Scholar] [CrossRef]
  3. Lesk, C.; Rowhani, P.; Ramankutty, N. Influence of extreme weather disasters on global crop production. Nature 2016, 529, 84–87. [Google Scholar] [CrossRef] [PubMed]
  4. Razzaq, A.; Wani, S.H.; Saleem, F.; Yu, M.; Zhou, M.; Shabala, S. Rewilding crops for climate resilience: Economic analysis and de novo domestication strategies. J. Exp. Bot. 2021, 72, 6123–6139. [Google Scholar] [CrossRef]
  5. Fang, Y.; Xiong, L. General mechanisms of drought response and their application in drought resistance improvement in plants. Cell. Mol. Life Sci. 2015, 72, 673–689. [Google Scholar] [CrossRef]
  6. Chen, D.; Wang, S.; Cao, B.; Cao, D.; Leng, G.; Li, H.; Yin, L.; Shan, L.; Deng, X. Genotypic variation in growth and physiological response to drought stress and re-watering reveals the critical role of recovery in drought adaptation in maize seedlings. Front. Plant Sci. 2016, 6, 1241. [Google Scholar] [CrossRef]
  7. Sallam, A.; Alqudah, A.M.; Dawood, M.F.; Baenziger, P.S.; Börner, A. Drought stress tolerance in wheat and barley: Advances in physiology, breeding and genetics research. Int. J. Mol. Sci. 2019, 20, 3137. [Google Scholar] [CrossRef]
  8. Jaleel, C.A.; Manivannan, P.; Wahid, A.; Farooq, M.; Al-Juburi, H.J.; Somasundaram, R.; Panneerselvam, R. Drought stress in plants: A review on morphological characteristics and pigments composition. Int. J. Agric. Biol. 2009, 11, 100–105. [Google Scholar]
  9. Arunyanark, A.; Jogloy, S.; Akkasaeng, C.; Vorasoot, N.; Kesmala, T.; Nageswara Rao, R.C.; Wright, G.C.; Patanothai, A. Chlorophyll stability is an indicator of drought tolerance in peanut. J. Agron. Crop Sci. 2008, 194, 113–125. [Google Scholar] [CrossRef]
  10. Filek, M.; Łabanowska, M.; Kościelniak, J.; Biesaga-Kościelniak, J.; Kurdziel, M.; Szarejko, I.; Hartikainen, H. Characterization of barley leaf tolerance to drought stress by chlorophyll fluorescence and electron paramagnetic resonance studies. J. Agron. Crop Sci. 2015, 201, 228–240. [Google Scholar] [CrossRef]
  11. Baker, N.R.; Rosenqvist, E. Applications of chlorophyll fluorescence can improve crop production strategies: An examination of future possibilities. J. Exp. Bot. 2004, 55, 1607–1621. [Google Scholar] [CrossRef] [PubMed] [Green Version]
  12. Comas, L.H.; Becker, S.R.; Von Mark, V.C.; Byrne, P.F.; Dierig, D.A. Root traits contributing to plant productivity under drought. Front. Plant Sci. 2013, 4, 442. [Google Scholar] [CrossRef] [PubMed]
  13. Cardoso, A.A.; Brodribb, T.J.; Lucani, C.J.; DaMatta, F.M.; McAdam, S.A. Coordinated plasticity maintains hydraulic safety in sunflower leaves. Plant Cell Environ. 2018, 41, 2567–2576. [Google Scholar] [CrossRef] [PubMed]
  14. Blatt, M.R.; Brodribb, T.J.; Torii, K.U. Small Pores with a Big Impact. Am. Soc. Plant Biol. 2017, 174, 467–469. [Google Scholar] [CrossRef]
  15. Chen, Z.H.; Chen, G.; Dai, F.; Wang, Y.; Hills, A.; Ruan, Y.L.; Zhang, G.; Franks, P.J.; Nevo, E.; Blatt, M.R. Molecular evolution of grass stomata. Trends Plant Sci. 2017, 22, 124–139. [Google Scholar] [CrossRef]
  16. Zhang, C.; Preece, C.; Filella, I.; Farré-Armengol, G.; Peñuelas, J. Assessment of the Response of Photosynthetic Activity of Mediterranean Evergreen Oaks to Enhanced Drought Stress and Recovery by Using PRI and R690/R630. Forests 2017, 8, 386. [Google Scholar] [CrossRef]
  17. Zandalinas, S.I.; Mittler, R.; Balfagón, D.; Arbona, V.; Gómez-Cadenas, A. Plant adaptations to the combination of drought and high temperatures. Physiol. Plant. 2017, 162, 2–12. [Google Scholar] [CrossRef]
  18. Waadt, R.; Seller, C.A.; Hsu, P.K.; Takahashi, Y.; Munemasa, S.; Schroeder, J.I. Plant hormone regulation of abiotic stress responses. Nat. Rev. Mol. Cell Biol. 2022, 23, 516. [Google Scholar] [CrossRef]
  19. Huang, X.; Tanveer, M.; Min, Y.; Shabala, S. Melatonin as a regulator of plant ionic homeostasis: Implications for abiotic stress tolerance. J. Exp. Bot. 2022, erac224. [Google Scholar] [CrossRef]
  20. Liu, L.; Wang, X.Y.; Chang, C. Toward a smart skin: Harnessing cuticle biosynthesis for crop adaptation to drought, salinity, temperature, and ultraviolet stress. Front. Plant Sci. 2022, 13, 961829. [Google Scholar] [CrossRef]
  21. Ketehouli, T.; Quoc, V.H.N.; Dong, J.Y.; Do, H.; Li, X.W.; Wang, F.W. Overview of the roles of calcium sensors in plants’ response to osmotic stress signalling. Funct. Plant Biol. 2022, 49, 589–599. [Google Scholar] [CrossRef] [PubMed]
  22. Boulc’h, P.N.; Caullireau, E.; Faucher, E.; Gouerou, M.; Guerin, A.; Miray, R.; Couee, I. Abiotic stress signalling in extremophile land plants. J. Exp. Bot. 2020, 71, 5771–5785. [Google Scholar] [CrossRef] [PubMed]
  23. Franks, P.J.; Doheny-Adams, T.W.; Britton-Harper, Z.J.; Gray, J.E. Increasing water-use efficiency directly through genetic manipulation of stomatal density. New Phytol. 2015, 207, 188–195. [Google Scholar] [CrossRef] [PubMed]
  24. Hughes, J.; Hepworth, C.; Dutton, C.; Dunn, J.A.; Hunt, L.; Stephens, J.; Waugh, R.; Cameron, D.D.; Gray, J.E. Reducing stomatal density in barley improves drought tolerance without impacting on yield. Plant Physiol. 2017, 174, 776–787. [Google Scholar] [CrossRef] [PubMed]
  25. Morales-Navarro, S.; Pérez-Díaz, R.; Ortega, A.; De Marcos, A.; Mena, M.; Fenoll, C.; González-Villanueva1, E.; Ruiz-Lara, S. Overexpression of a SDD1-like gene from wild tomato decreases stomatal density and enhances dehydration avoidance in Arabidopsis and cultivated tomato. Front. Plant Sci. 2018, 9, 940. [Google Scholar] [CrossRef] [PubMed]
  26. Hasanuzzaman, M.; Shabala, L.; Brodribb, T.J.; Zhou, M.; Shabala, S. Understanding physiological and morphological traits contributing to drought tolerance in barley. J. Agron. Crop Sci. 2019, 205, 129–140. [Google Scholar] [CrossRef]
  27. Caird, M.A.; Richards, J.H.; Donovan, L.A. Nighttime stomatal conductance and transpiration in C3 and C4 plants. Plant Physiol. 2007, 143, 4–10. [Google Scholar] [CrossRef]
  28. Even, M.; Sabo, M.; Meng, D.; Kreszies, T.; Schreiber, L.; Fricke, W. Night-time transpiration in barley (Hordeum vulgare) facilitates respiratory carbon dioxide release and is regulated during salt stress. Ann. Bot. 2018, 122, 569–582. [Google Scholar] [CrossRef]
  29. Lynch, J.P. Steep, cheap and deep: An ideotype to optimize water and N acquisition by maize root systems. Ann. Bot. 2013, 112, 347–357. [Google Scholar] [CrossRef]
  30. Lynch, J.P.; Chimungu, J.G.; Brown, K.M. Root anatomical phenes associated with water acquisition from drying soil: Targets for crop improvement. J. Exp. Bot. 2014, 65, 6155–6166. [Google Scholar] [CrossRef]
  31. Ji, H.; Liu, L.; Li, K.; Xie, Q.; Wang, Z.; Zhao, X.; Li, X. PEG-mediated osmotic stress induces premature differentiation of the root apical meristem and outgrowth of lateral roots in wheat. J. Exp. Bot. 2014, 65, 4863–4872. [Google Scholar] [CrossRef] [PubMed] [Green Version]
  32. Hasanuzzaman, M.; Shabala, L.; Brodribb, T.J.; Zhou, M.; Shabala, S. Assessing the suitability of various screening methods as a proxy for drought tolerance in barley. Funct. Plant Biol. 2016, 44, 253–266. [Google Scholar] [CrossRef] [PubMed]
  33. Hasanuzzaman, M.; Davies, N.W.; Shabala, L.; Zhou, M.; Brodribb, T.J.; Shabala, S. Residual transpiration as a component of salinity stress tolerance mechanism: A case study for barley. BMC Plant Biol. 2017, 17, 107. [Google Scholar] [CrossRef]
  34. Abid, M.; Ali, S.; Qi, L.K.; Zahoor, R.; Tian, Z.; Jiang, D.; Dai, T. Physiological and biochemical changes during drought and recovery periods at tillering and jointing stages in wheat (Triticum aestivum L.). Sci. Rep. 2018, 8, 4615. [Google Scholar] [CrossRef]
  35. Sharma, D.K.; Andersen, S.B.; Ottosen, C.O.; Rosenqvist, E. Wheat cultivars selected for high Fv/Fm under heat stress maintain high photosynthesis, total chlorophyll, stomatal conductance, transpiration and dry matter. Physiol. Plant. 2015, 153, 284–298. [Google Scholar] [CrossRef]
  36. Maxwell, K.; Johnson, G.N. Chlorophyll fluorescence-a practical guide. J. Exp. Bot. 2000, 51, 659–668. [Google Scholar] [CrossRef] [PubMed]
  37. Szira, F.; Bálint, A.; Börner, A.; Galiba, G. Evaluation of drought-Related traits and screening methods at different developmental stages in spring barley. J. Agron. Crop Sci. 2008, 194, 334–342. [Google Scholar] [CrossRef]
  38. Ilyas, M.; Nisar, M.; Khan, N.; Hazrat, A.; Khan, A.H.; Hayat, K.; Fahad, S.; Khan, A.; Ullah, A. Drought tolerance strategies in plants: A mechanistic approach. J. Plant Growth Regul. 2021, 40, 926–944. [Google Scholar] [CrossRef]
  39. Wasaya, A.; Zhang, X.; Fang, Q.; Yan, Z. Root phenotyping for drought tolerance: A review. Agronomy 2018, 8, 241. [Google Scholar] [CrossRef]
  40. Hetherington, A.M.; Woodward, F.I. The role of stomata in sensing and driving environmental change. Nature 2003, 424, 901–908. [Google Scholar] [CrossRef]
  41. Franks, P.J.; Beerling, D.J. Maximum leaf conductance driven by CO2 effects on stomatal size and density over geologic time. Proc. Natl. Acad. Sci. USA 2009, 106, 10343–10347. [Google Scholar] [CrossRef] [PubMed] [Green Version]
  42. Hasanuzzaman, M.; Shabala, L.; Zhou, M.; Brodribb, T.J.; Corkrey, R.; Shabala, S. Factors determining stomatal and non-stomatal (residual) transpiration and their contribution towards salinity tolerance in contrasting barley genotypes. Environ. Exp. Bot. 2018, 153, 10–20. [Google Scholar] [CrossRef]
  43. Zhu, M.; Zhou, M.; Shabala, L.; Shabala, S. Linking osmotic adjustment and stomatal characteristics with salinity stress tolerance in contrasting barley accessions. Funct. Plant Biol. 2015, 42, 252–263. [Google Scholar] [CrossRef]
  44. González, A.; Ayerbe, L. Effect of terminal water stress on leaf epicuticular wax load, residual transpiration and grain yield in barley. Euphytica 2010, 172, 341–349. [Google Scholar] [CrossRef]
  45. Clarke, J.; Richards, R.; Condon, A. Effect of drought stress on residual transpiration and its relationship with water use of wheat. Can. J. Plant Sci. 1991, 71, 695–702. [Google Scholar] [CrossRef]
  46. Riederer, M.; Schreiber, L. Protecting against water loss: Analysis of the barrier properties of plant cuticles. J. Exp. Bot. 2001, 52, 2023–2032. [Google Scholar] [CrossRef]
  47. Bi, H.; Kovalchuk, N.; Langridge, P.; Tricker, P.J.; Lopato, S.; Borisjuk, N. The impact of drought on wheat leaf cuticle properties. BMC Plant Biol. 2017, 17, 85. [Google Scholar] [CrossRef] [PubMed]
  48. Xue, D.; Zhang, X.; Lu, X.; Chen, G.; Chen, Z.H. Molecular and Evolutionary Mechanisms of Cuticular Wax for Plant Drought Tolerance. Front. Plant Sci. 2017, 8, 621. [Google Scholar] [CrossRef]
  49. Seo, P.J.; Lee, S.B.; Suh, M.C.; Park, M.J.; Go, Y.S.; Park, C.M. The MYB96 transcription factor regulates cuticular wax biosynthesis under drought conditions in Arabidopsis. Plant Cell 2011, 23, 1138–1152. [Google Scholar] [CrossRef]
  50. Seo, P.J.; Park, C.M. Cuticular wax biosynthesis as a way of inducing drought resistance. Plant Signal Behav. 2011, 6, 1043–1045. [Google Scholar] [CrossRef]
  51. Yu, H.; Zhang, Y.; Xie, Y.; Wang, Y.; Duan, L.; Zhang, M.; Li, Z. Ethephon improved drought tolerance in maize seedlings by modulating cuticular wax biosynthesis and membrane stability. J. Plant Physiol. 2017, 214, 123–133. [Google Scholar] [CrossRef] [PubMed]
  52. Grünhofer, P.; Herzig, L.; Sent, S.; Zeisler-Diehl, V.V.; Schreiber, L. Increased cuticular wax deposition does not change residual foliar transpiration. Plant Cell Environ. 2022, 45, 1157–1171. [Google Scholar] [CrossRef] [PubMed]
  53. Ahmed, A.R.; Gabr, A.M.; AL-Sayed, H.M.; Smetanska, I. Effect of drought and salinity stress on total phenolic, flavonoids and flavonols contents and antioxidant activity in in vitro sprout cultures of garden cress (Lepidium sativum). Res. J. Appl. Sci. 2012, 8, 3934–3942. [Google Scholar]
Figure 1. Kinetics of the changes in the soil moisture content during drought stress and rewatering. Data are the mean ± SE (n = 4). Lowercase letters shown in brackets refer to different periods of stress response: (i)—well-watered plants; (ii)—a progressive drought until the soil moisture level reached 10%; (iii)—the rewatering stage.
Agronomy 12 02136 g001
Figure 2. Genotypes’ ranking according to drought tolerance (a) and recovery (b) indices, and the correlation between these two traits (c): (a) Eighty barley genotypes ranked according to their drought tolerance index, as estimated by leaf injury under drought stress conditions. Data are means ± SE (n = 4); 0 indicates dead plants, while 9 indicates no water stress symptoms. Lowercase letters shown in brackets in (a) are the drought tolerance index categories: (i) drought-sensitive; (ii) moderately sensitive; (iii) moderately tolerant; (iv) tolerant. (b) Eighty barley genotypes ranked according to their drought recovery index, as estimated by their ability to regrow 15 days after rewatering. Data are means ± SE (n = 4); 0 indicates dead plants, while 9 indicates full recovery. Lowercase letters shown in brackets in (b) are the drought recovery index categories: (i) drought-sensitive; (ii) moderately sensitive; (iii) moderately tolerant; (iv) tolerant. (c) Correlation (Pearson’s R2 value) between the drought tolerance index and the drought recovery index. Data are significantly different at ** p < 0.01 by two-tailed test.
Agronomy 12 02136 g002
Figure 3. Chlorophyll content (SPAD value) in 80 barley genotypes under (a) control conditions and (b) drought stress (15 days after withholding irrigation) conditions, and (c) relative changes in drought-affected plants (expressed as a percentage of control). Data are means ± SE (n = 12).
Agronomy 12 02136 g003
Figure 4. Chlorophyll fluorescence Fv/Fm ratios in 80 barley genotypes under (a) control conditions and (b) drought stress (15 days after withholding irrigation) conditions, and (c) relative changes in drought-affected plants (% of control). Data are means ± SE (n = 12).
Agronomy 12 02136 g004
Figure 5. Root length of 80 barley genotypes grown under (a) control conditions and (b) osmotic stress (15% (w/v) PEG 8000) conditions, and (c) relative root length in osmotically stressed roots (% control). Data are means ± SE, n = 30 (3 replications × 10 seedlings each).
Agronomy 12 02136 g005
Figure 6. Correlations (Pearson’s R2 value) between physiological characteristics and the drought tolerance index and drought recovery index: (a) correlation between stomatal density under control conditions and the drought tolerance index; (b) correlation between residual transpiration under control conditions and the drought tolerance index; (c) correlation between residual transpiration under control conditions and the stomatal density under control conditions. (d) correlation between stomata density under control conditions and drought recovery index; (e) correlation between residual transpiration under control conditions and drought recovery index. Data are significant at *** p < 0.001 by two-tailed test.
Agronomy 12 02136 g006
Figure 7. Correlation (Pearson’s R2 value) between the salinity damage index and drought tolerance index: (a) Eighty barley genotypes ranked according to the salinity damage index. Plants were exposed to 300 mM NaCl salinity treatment for 4 weeks. A score of 0 indicates no visual symptoms of damage, while a score of 9 indicates dead plants. (b) Correlation between salinity damage index and drought tolerance index; data are significant at *** p < 0.001 by two-tailed test.
Agronomy 12 02136 g007
Table 1. Description of the drought tolerance index scoring.
ScaleDescriptionsTolerance Index Categories
1Whole plant is deadHighly sensitive
2Plant is mostly deadSensitive
3More than 75% of all leaves driedSensitive
4More than 50% of all leaves driedSensitive
5More than 25% of all leaves driedModerately sensitive
6About 1/2 of the leaf length is dryModerately tolerant
7About ¼ of the leaf length is dryTolerant
8Slight drying at the tips of lower leavesTolerant
9No drought stress symptomsHighly tolerant
Table 2. Description of the drought recovery index scoring.
ScaleDescriptionsTolerance Index Categories
1Whole plant is deadHighly sensitive
2No regrowth (plants are almost dead)Sensitive
3All leaves dried but half of the stem still greenSensitive
4All leaves almost dried but whole stem still greenSensitive
5Regrowth started from auxiliary buds (stem still green, new shoot started from auxiliary bud)Moderately sensitive
6Regrowth stated from apical meristem (growing new leaves from the shoot)Moderately tolerant
7Regrowth started from both auxiliary bud and apical meristemTolerant
8New leaf started from apical meristem, new shoot started from auxiliary bud, and new tillering started from the lower nodeTolerant
9No drought stress symptoms (fully recovery)Highly tolerant
Table 3. Description of the salinity damage index scoring.
ScaleDescriptionsTolerance Index Categories
0No visual symptoms; healthy looking plants   Highly Tolerant
1Some initial signs of chlorosis   Tolerant
2One necrotic leaf   Tolerant
3One to two necrotic leaves   Tolerant
4Two necrotic leaves of all leaves dried   Moderately tolerant
5Two to three necrotic leaves   Moderately sensitive
6Three necrotic leaves; the whole plant is losing its green color   Sensitive
7All of the plants are looking very unhealthy, with most starting to die   Sensitive
8Most leaves have died; plant is dry   Sensitive
9Completely dead plants   Highly sensitive
Table 4. Correlations (Pearson’s R2 value) of chlorophyll content, Fv/Fm ratio, root length, and their relative changes (% control) under irrigated and drought conditions with drought tolerance index and drought recovery index. Data are significantly different at *** p < 0.001 by two-tailed test.
ParametersIndexR2 Value
ControlDroughtRelative
Chlorophyll contentDrought tolerance index0.030.29 ***0.28 ***
Fv/Fm ratio0.000.19 ***0.19 ***
Root length0.000.000.00
Chlorophyll contentDrought recovery index0.14 ***0.16 ***0.18 ***
Fv/Fm ratio0.000.17 ***0.16 ***
Root length0.010.17 ***0.14 ***
Publisher’s Note: MDPI stays neutral with regard to jurisdictional claims in published maps and institutional affiliations.

