Article

Seed Characteristics Affect Low-Temperature Stress Tolerance Performance of Rapeseed (Brassica napus L.) during Seed Germination and Seedling Emergence Stages

MOA Key Laboratory of Crop Ecophysiology and Farming System in the Middle Reaches of the Yangtze River, College of Plant Science and Technology, Huazhong Agricultural University, Wuhan 430070, China
*
Author to whom correspondence should be addressed.
Agronomy 2022, 12(8), 1969; https://doi.org/10.3390/agronomy12081969
Submission received: 29 June 2022 / Revised: 9 August 2022 / Accepted: 17 August 2022 / Published: 20 August 2022

Abstract

:
Screening and breeding elite varieties with rapid germination and uniform seedling emergence under low temperature is an effective strategy to deal with the cold climate occurring under late sowing conditions in the Yangtze River basin. This study focused on the performance of seven functional traits, including percentage of germination, percentage of emergence, mean germination time, mean emergence time, total seedling length, total dry weight, and seedling vigor index of 436 natural rapeseed populations under normal-temperature (25/20 °C) and low-temperature (15/10 °C) conditions. Furthermore, ten genotypes were screened to verify their low-temperature tolerance based on cultivar traits in a pot experiment. The results show that the germination- and emergence-related functional traits of rapeseed genotypes exhibit rich genotypic diversity in response to low-temperature stress; the variation among these traits ranged from 1–25% under normal-temperature and 10–49% under low-temperature conditions. Variation in seed characteristics also affected the capacity for low-temperature tolerance in the process of seed germination and seedling emergence, and could explain 22% of the total variance for low-temperature stress tolerance indices. There existed high correlations between the stress tolerance index of total dry weight (STI_TDW) and thousand-seed weight, and between the stress tolerance index of emergence percentage (STI_PE) and oil content. The contents of erucic acid, glucosinolate, and eicosenoic acid were positively correlated with the stress tolerance index of mean germination time (STI_MGT) and mean emergence time (STI_MET). The D-CRITIC (distance-based intercriteria correlation) weight method was selected in this experiment to calculate each variety’s comprehensive low-temperature stress tolerance index by integrating the standard deviation and distance correlation coefficient of each index. The genotypes with large comprehensive low-temperature stress tolerance index also had higher low-temperature stress tolerance index of biomass and yield in the pot experiment, indicating that the comprehensive low-temperature stress tolerance index has high reliability and applicability. This study could provide a theoretical basis for the utilization of low-temperature-tolerant germplasm resources, as well as a reference for the cold resistance and yield stability under late- and direct-sowing conditions of rapeseed in the Yangtze River basin and other similar environments around the world.

1. Introduction

Rapeseed is an important oil crop in China, and rapeseed oil production accounts for about 50% of domestic edible vegetable oil [1]. Actively developing the rapeseed industry has important strategic significance in ensuring the safety of edible oil supply in China. The Yangtze River basin is China’s main production area of winter rapeseed. Generally, it is sown in autumn and harvested around late spring, accounting for more than 90% of the national rapeseed production [2]. However, under the framework of matching the rice–rapeseed multicropping system with simplified- and direct-seeding cultivation, the sowing date of autumn-sown rapeseed has been postponed, even to early November [3]. The Yangtze River basin is located in a typical subtropical monsoon climate area. The low temperature under late sowing conditions with frequent periodic strong cooling hinders the germination and seedling process of rapeseed, which is not conducive to the formation of the rapeseed population and yield. Low temperature can also induce the germinant seeds of rapeseed to undergo secondary dormancy, whereby germination cannot be initiated even if the temperature rises [4]. Increasing the seeding rate or replenishing seedlings after sowing can make up for the uneven emergence caused by low-temperature stress, but it also increases the planting cost.
Under a wide range of environmental conditions, the potential ability of seeds to rapidly germinate and grow into healthy seedlings determines crop growth and yield formation [5]. Seed germination includes three stages: imbibition, increasing metabolic activity, and radicle breaking through the seed coat. With the repair of cell membranes and organelles, and activation of physiological and biochemical metabolic enzymes, seeds recover from a dry dormant state to an active growth state [6,7]. Seed germination requires respiratory metabolism to provide a material and energy source. Low temperature will slow the repair of the mitochondrial membrane and reduce the activity of enzymes participating in respiration, resulting in prolonged germination and a low seedling emergence rate. The antioxidative enzyme activity inside the seeds gradually increases from the beginning of imbibition and ensures the formation of healthy seedlings by repairing the cell structure and removing the reactive oxygen species generated by the seed during the seed storage and germination processes [8]. At a low temperature of around 10 °C, the activities of superoxide dismutase (SOD), peroxidase (POD), and catalase (CAT) in wheat seeds were found to be maintained at very low levels, and the corresponding seed germination rate was relatively slow [9]. Xian’s research results also showed that the low-temperature-tolerant rapeseed varieties had higher antioxidant enzyme activities at the seedling stage than low-temperature-sensitive varieties [10].
The stage transition from seed germination to seedling morphogenesis involves a process that switches from heterotrophic to autotrophic, which depends on the degradation, transport, and reuse of seed storage materials [11]. The seed storage material of rapeseed germplasm resources shows rich genetic diversity, mainly including protein content, fatty acid composition, and glucosinolate content [12,13]. Wang et al. measured and analyzed the erucic acid and glucosinolate contents of 363 rapeseed germplasm resources from all over the country. Their results showed that the variation range of glucosinolates was 1.0–152.7 μmol·g−1, and the variation range of erucic acid content was 0–60%; hence, there was wide variation among genotypes [14]. Wei et al. measured the oil content of 306 natural rapeseed populations, and their results showed that the oil content varied widely, ranging from 24.50% to 49.91% [15]. Hou et al. measured the quality of 36 rapeseed genotypes from different regions of Tibet, and showed that the protein content ranged from 14.04% to 26.91% [16]. Currently, many QTLs that control quality traits have been located, providing directions for the genetic improvement of rapeseed seed quality [17]. However, the effects of variation in seed composition and size on seed germination and seedling characteristics under low-temperature conditions still require further study.
Selecting and cultivating high-quality seeds with rapid germination and vigorous seedlings at low temperatures is an economical and effective way to solve the problem of late sowing of rapeseed in production. The functional characteristics of rapeseed at the seed germination and seedling emergence stages mainly include germination rate, emergence rate, mean germination time, mean emergence time, and seedling vigor index. Therefore, the low-temperature tolerance of rapeseed seeds at the seed germination and seedling establishment stages is a comprehensive composite trait, jointly determined by various indicators [18,19,20]. The membership function is an effective method to evaluate the comprehensive performance ability of crops under adverse conditions. Huang et al. used the membership function method to identify the low-temperature tolerance of 66 samples of Brassica napus at the germination stage, and screened out five low-temperature-resistant genotypes and four low-temperature-sensitive genotypes [21]. Zhao et al. studied the effects of different concentrations of heavy metals, Cu2+, Zn2+, and Pb2+, on the seed germination traits of Albizia julibrissin using the membership function method, and found that Zn2+ had a more significant effect on its germination [22]. Using the same method, Zhang et al. screened eight salt-tolerant and salt-sensitive genotypes from 114 rice germplasm resources [23]. The above methods all use the arithmetic average to calculate each genotype’s comprehensive membership function value, and no reasonable statistical way is given for the weight setting of each index. The present experiment is based on the germination and seedling trait data of 436 natural rapeseed populations at normal and low temperatures. The purpose of the study was (1) to use the D-CRITIC method to calculate the weight of each index and the comprehensive membership function value of low-temperature resistance, which is to provide evidence for the utilization of germplasm resources; (2) to reveal the degree of interpretation of seed characteristics (seed component and size) on low-temperature tolerance of seed germination and seedling traits by means of redundancy analysis; (3) to verify whether the genotypes with greater low-temperature tolerance comprehensive scores still exhibit better performance in terms of biomass and grain yield under natural environment. The results obtained in this study also have implications for other regions around the world with similar geological and climatic conditions.

2. Materials and Methods

2.1. Experiment 1: Germination and Seedling Test of Rapeseed Germplasm Resources under Normal- and Low-Temperature Conditions

The seed collection of 436 genotypes and germination trial conducted under normal- (25/20 °C) and low-temperature (15/10 °C) conditions were described in our previous study [24]. The photosynthetic photon flux density in the growth chamber was set to 150 μmol photons m−2 s−1 with a 12-h daylength. Radicle protrusion through the seed coat by ~1 mm was used as a criterion for a geminated seed; seedling emergence was defined as the complete flattening of two cotyledons and the hypocotyl becoming upright. The investigated raw data from the germination trail were used to calculate the germination rate (PG), seedling emergence rate (PE), mean germination time (MGT), mean seedling time (MET), total seedling length (TL), total dry weight (TDW), and seedling vigor index (SVI) according to our previous description [18]. Seed quality was measured with the FOSS 5000 near-infrared spectrometer (NIRSTM DS2500, Switzerland). Each seed sample of each genotype was scanned with six replications, and the scanning band ranged from 1100–2500 nm. The contents of erucic acid, glucosinolate, protein, oil, linolenic acid, linoleic acid, stearic acid, oleic acid, and palmitic acid of each rapeseed genotype were obtained by quantitative analysis of the spectrogram.
The stress tolerance index (STI) was used to identify the performance of genotypes under both non-stress and stress environments. In the present study, the low-temperature STI for PG, PE, TL, TDW, and SVI was calculated using the formula: STI = ( Ys × Yp ) / ( Ymp × Yms ) . For MGT and MET, the low-temperature STI was calculated as STI = ( Ymp × Yms ) / ( Ys × Yp ) , wherein Ys and Yp are the corresponding values of the index under low-temperature stress and normal-temperature conditions, respectively; Yms and Ymp are the average index values of all genotypes under low-temperature stress and normal-temperature conditions, respectively [25]. The STI value of each index for each genotype was normalized by the maximum and minimum values to obtain U i k , and its range was mapped to the 0–1 interval to eliminate the influence of dimension, i and k represent the i-th variety and k-th index, respectively, among which the test data comprise a total of n = 436 genotypes and m = 7 indices. Then, we used the D-CRITIC method (distance-based intercriteria correlation) to calculate the weight ( W k ) of each index [26], and finally, calculate the low-temperature resistance comprehensive membership function value D i of each genotype through the weight. The calculation formulae and processes are as follows (Equations (1)–(4)):
s k = i = 1 n ( U i k U k ¯ ) 2 n 1
I k = s k k = 1 n ( 1 d C o r ( U k , U k ) )
W k = I k k = 1 n I k
D i = k = 1 n U i k W k
where s k , I k , and W k represent the standard deviation, contained information, and weight of the k-th index, respectively. U k ¯ is the average value of the indicator U k , and d C o r ( U k , U k ) is the distance correlation coefficient between the indicators U k and U k .

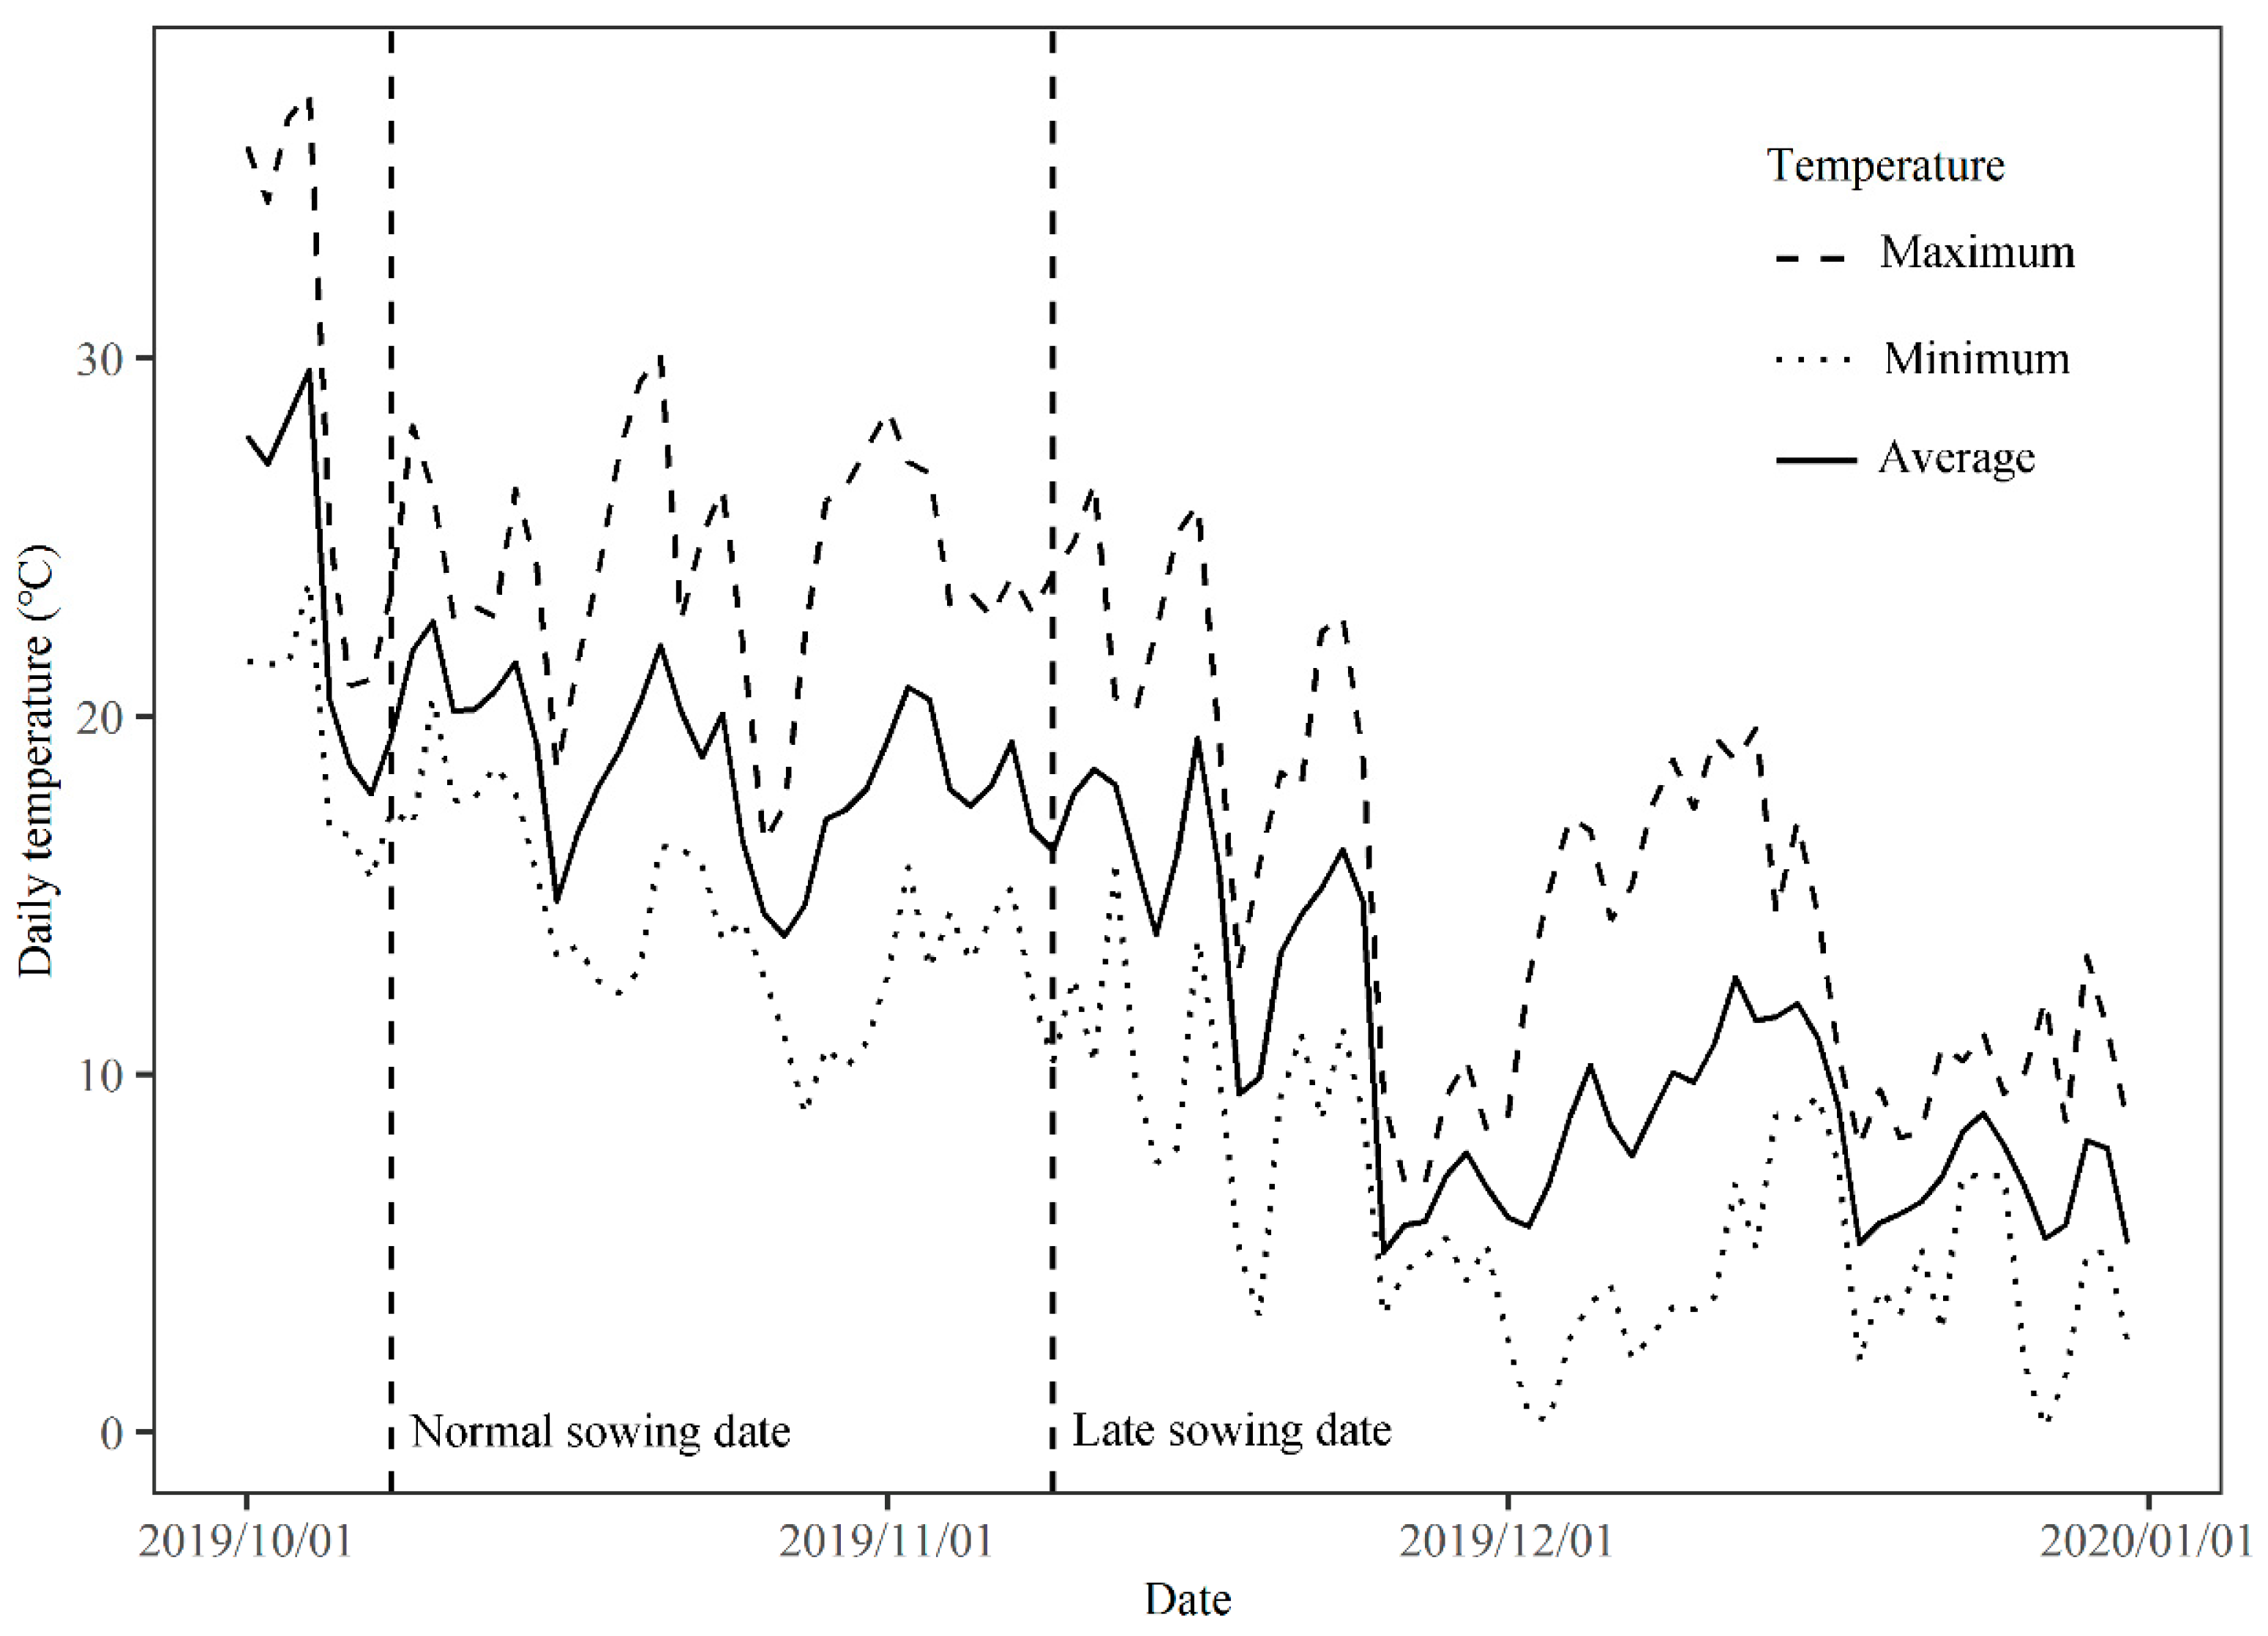
2.2. Experiment 2: Pot Experiment to Evaluate the Performance of Low-Temperature-Resistant and Low-Temperature-Sensitive Genotypes under Normal and Late Sowing Conditions

The pot experiment was carried out in the campus experimental base of Huazhong Agricultural University (114°22′ E, 30°29′ N). The ten genotypes with different comprehensive low-temperature stress tolerance indices were selected, and the normal and late sowing dates were set at 8 October and 9 November 2019, respectively. Twenty-five intact seeds of each variety were sown in each pot with five replications, and two uniform seedlings were retained in each pot after seedling emergence. The diameter and height of the plastic pots were 25 cm and 30 cm, respectively. The pots were filled with 14 kg of the substrate (soil:sand = 1:1) and 2.8 g of compound fertilizers (N 15%, P2O5 15%, K2O 15%). Among them, 50% of the compound fertilizer was applied as the base, and the remaining 50% was applied as topdressing at the budding stage. Seedling emergence was counted every day after sowing. Watering and pest management were carried out following experimental specifications throughout the growth period to avoid water- and pest stress. At the maturity stage, each pot of plants was harvested separately, air-dried under natural conditions, and weighed to determine the dry weight and grain yield of each plant. The daily maximum temperature, minimum temperature, and average temperature data of the experimental site were provided by the Huazhong Agricultural University weather station, as shown in Figure 1. Under normal sowing conditions, the average temperature from sowing to seedling emergence was 20.9 °C, and the average temperature under late sowing conditions was 16.9 °C.

2.3. Data Analysis

This study used Excel 2016 for data storage, R programming language for statistical analysis, and the ggplot2 package for data plotting. The significance of the functional trait differences between normal- and low-temperature conditions was determined using the Wilcoxon signed-rank test, which is a non-parametric statistical hypothesis test. For redundancy analysis, a constrained sorting model was used to analyze the correlation between multiple independent and dependent variables. The coordinate sorting axis of the dependent variable is a linear combination of the independent variables, and each sorting vector is the object located in the Euclidean projection of the spatial distance distribution. In this experiment, the seed characteristics were used as the explanatory variable matrix, and the germination- and seedling-related low-temperature tolerance index traits were used as the response variable matrix. Through the DCA detrend analysis, it was found that the first value of the Axis Length row was less than 3.0, which met the data standard of the redundancy analysis (Axis Length > 4.0, suitable for canonical correspondence analysis based on the unimodal model; Axis Length < 3.0, suitable for redundancy analysis based on the linear model; Axis Length between 3.0 and 4.0, both analysis methods are applicable). Therefore, the redundancy analysis method was used to calculate the explanatory degree of seed characteristics for germination traits under constraints, and the correlation between indicators. This study used the vegan package of R programming language to complete the redundancy analysis.

3. Results

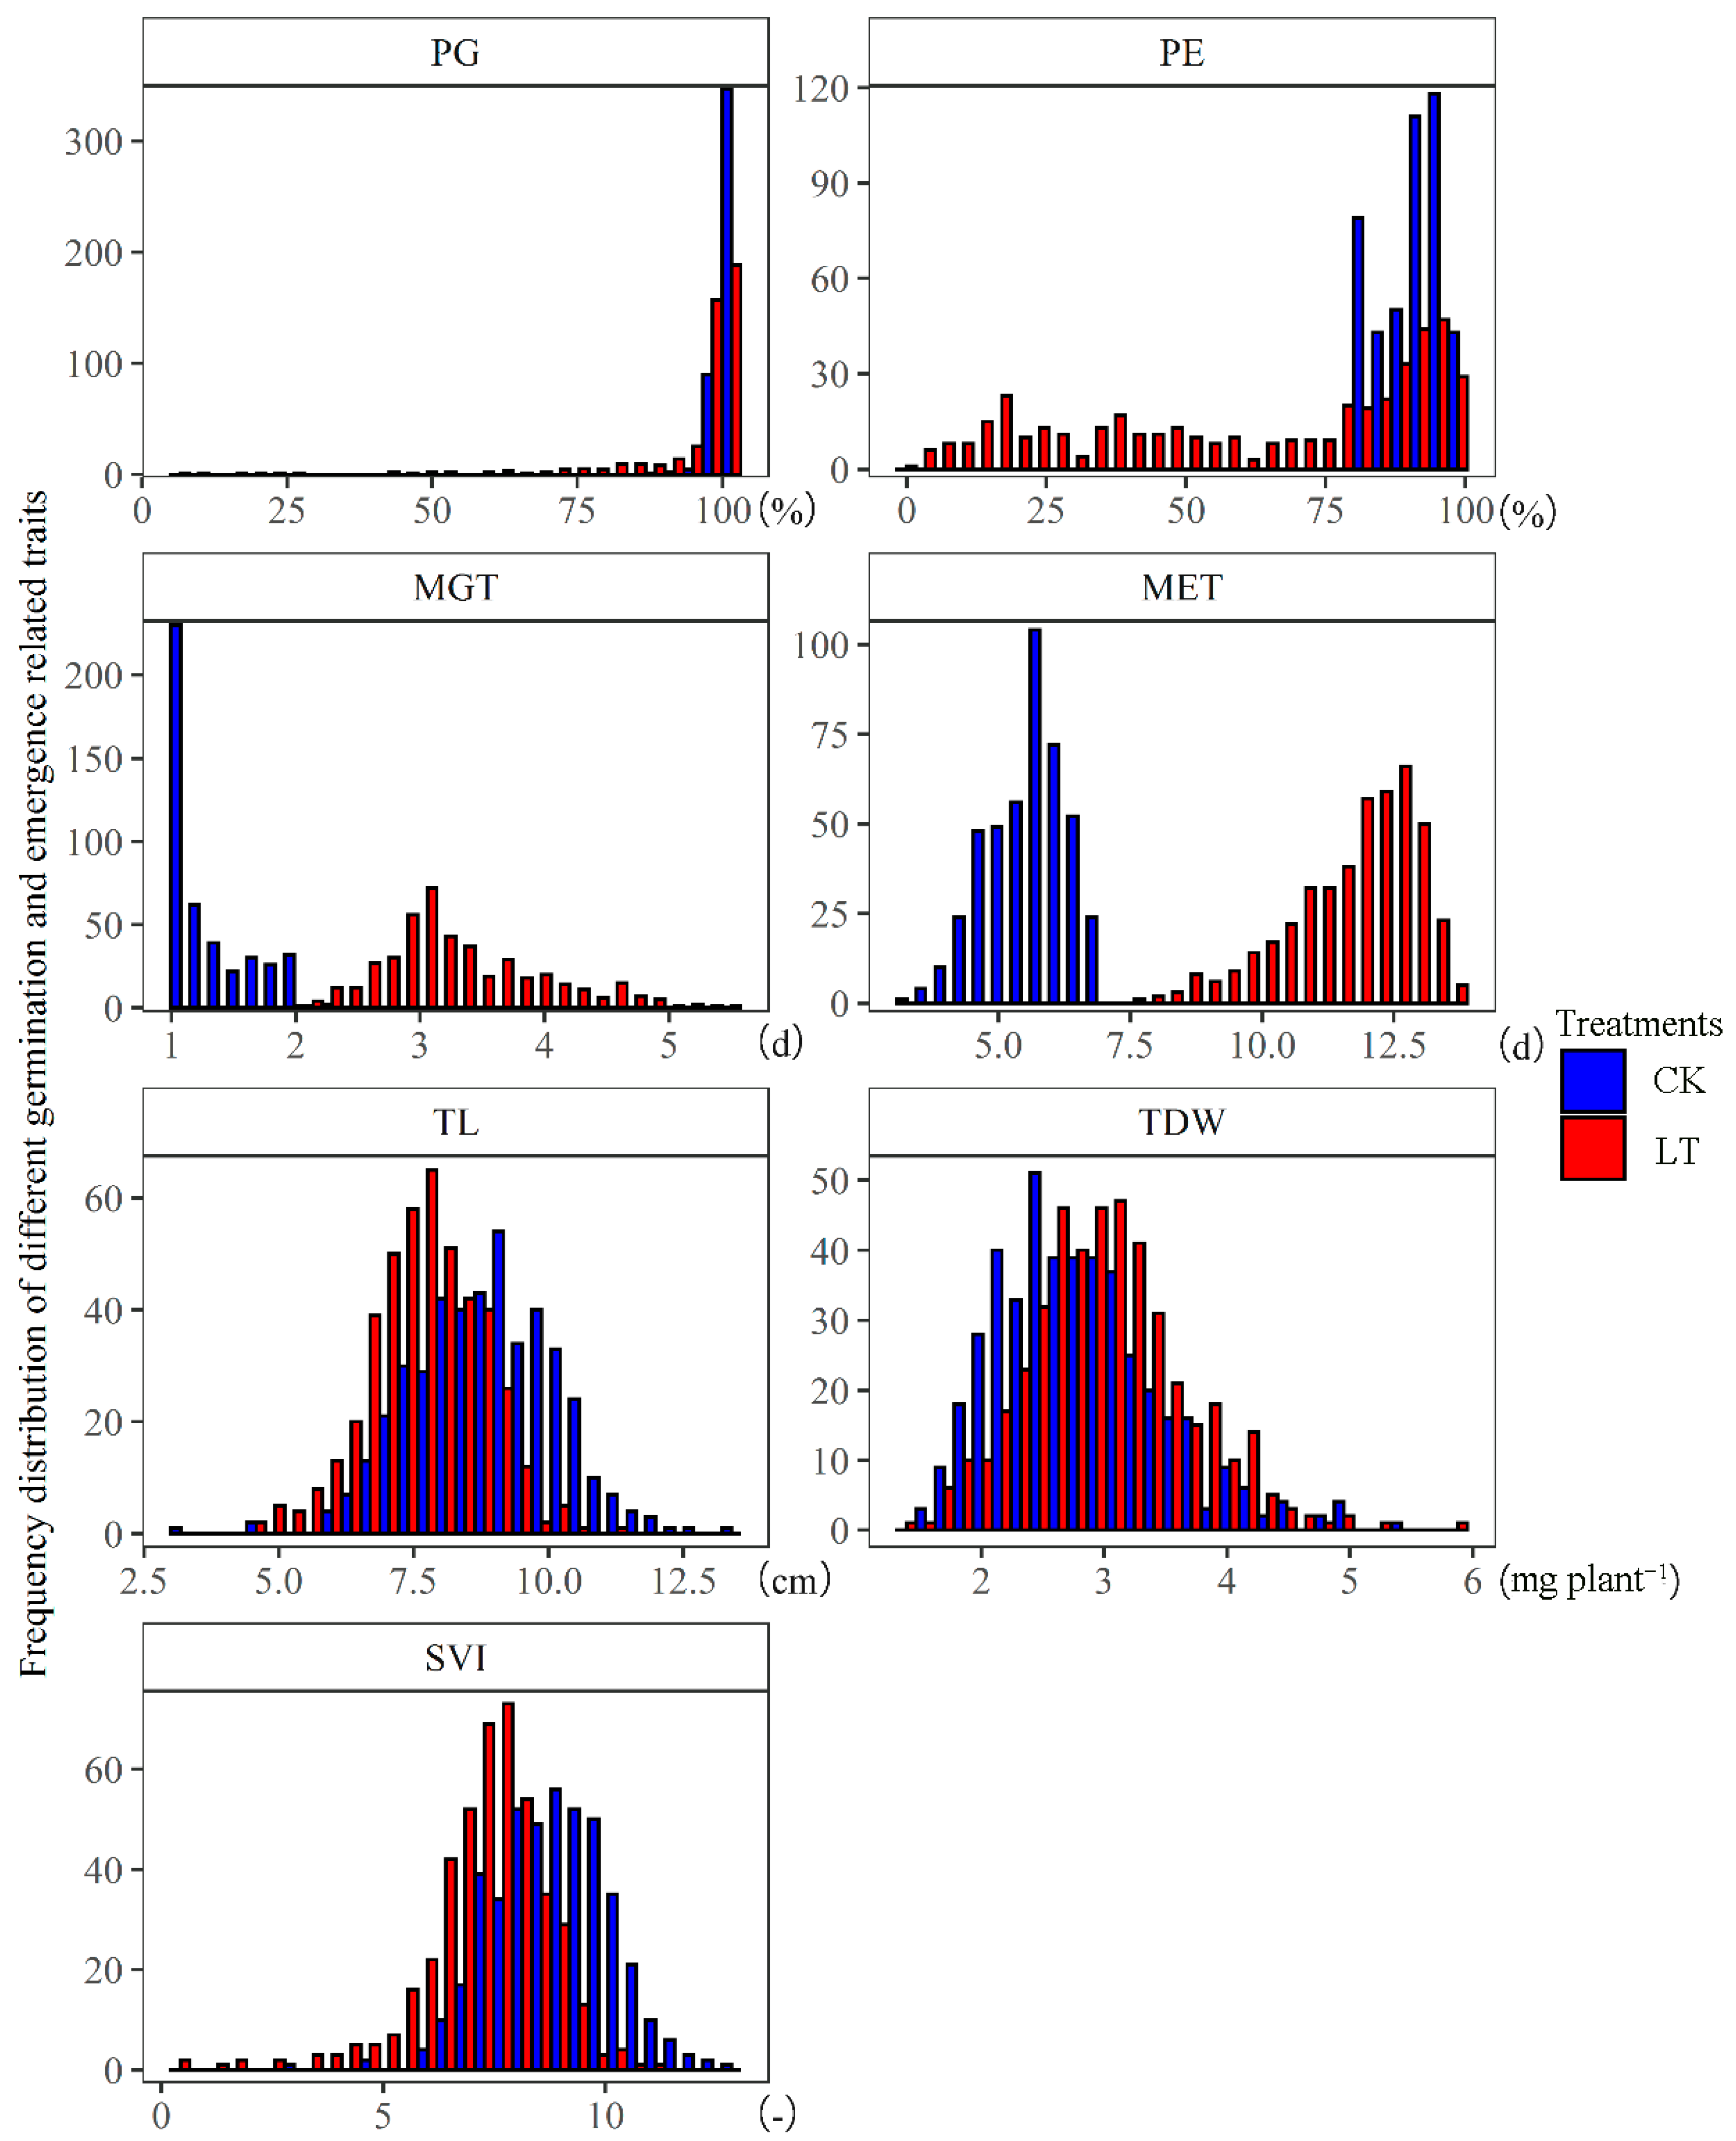
3.1. The Effect of Low Temperature on the Functional Traits of Rapeseed during Germination and Seedling Emergence Stages

The Wilcoxon test showed that all the functional traits during the seed germination and seedling emergence stages had significant differences under normal- and low-temperature conditions, with p < 0.01 (Table 1). Under normal- and low-temperature conditions, the distributions of related functional traits at the germination and seedling emergence stages of 436 rapeseed genotypes are shown in Figure 2. The distribution of germination rate under normal- and low-temperature conditions was heavy-tailed with high negative skewness and kurtosis. The distribution of mean germination time and mean emergence time under both normal- and low-temperature conditions showed high positive skewness and light negative skewness, respectively. The distribution ranges of germination rate and seedling emergence rate under normal-temperature conditions were 89–100% and 80–99%, respectively, and the corresponding coefficients of variation were 1% and 6%; their distribution range at low temperature was 5–100% and 1–99%, the corresponding coefficients of variation were 14% and 49%, respectively, revealing that low temperature reduced the germination rate and emergence rate, and also increased the phenotypic variation in traits among genotypes. The genotypes’ mean germination times and mean emergence times were 1.0–2.3 d and 3.4–6.9 d under normal-temperature conditions and 2.0–5.4 d and 7.6–13.9 d under low-temperature conditions, respectively. Low temperature significantly prolonged the duration of germination and emergence. The total seedling length, total dry weight, and seedling vigor index showed normal distribution characteristics under normal- and low-temperature conditions. The average dry weight of each genotype at normal temperature was 2.79 mg/plant, and the total dry weight at low temperature was 3.03 mg/plant. Compared with normal temperature, the total seedling length and seedling vigor index of each genotype showed a downward trend. The average total seedling length at normal temperature was 8.84 cm, which decreased by 1.14 cm under low-temperature conditions; the average seedling vigor index under normal temperature was 8.82, and decreased by 1.53 under low-temperature conditions (Table 1).

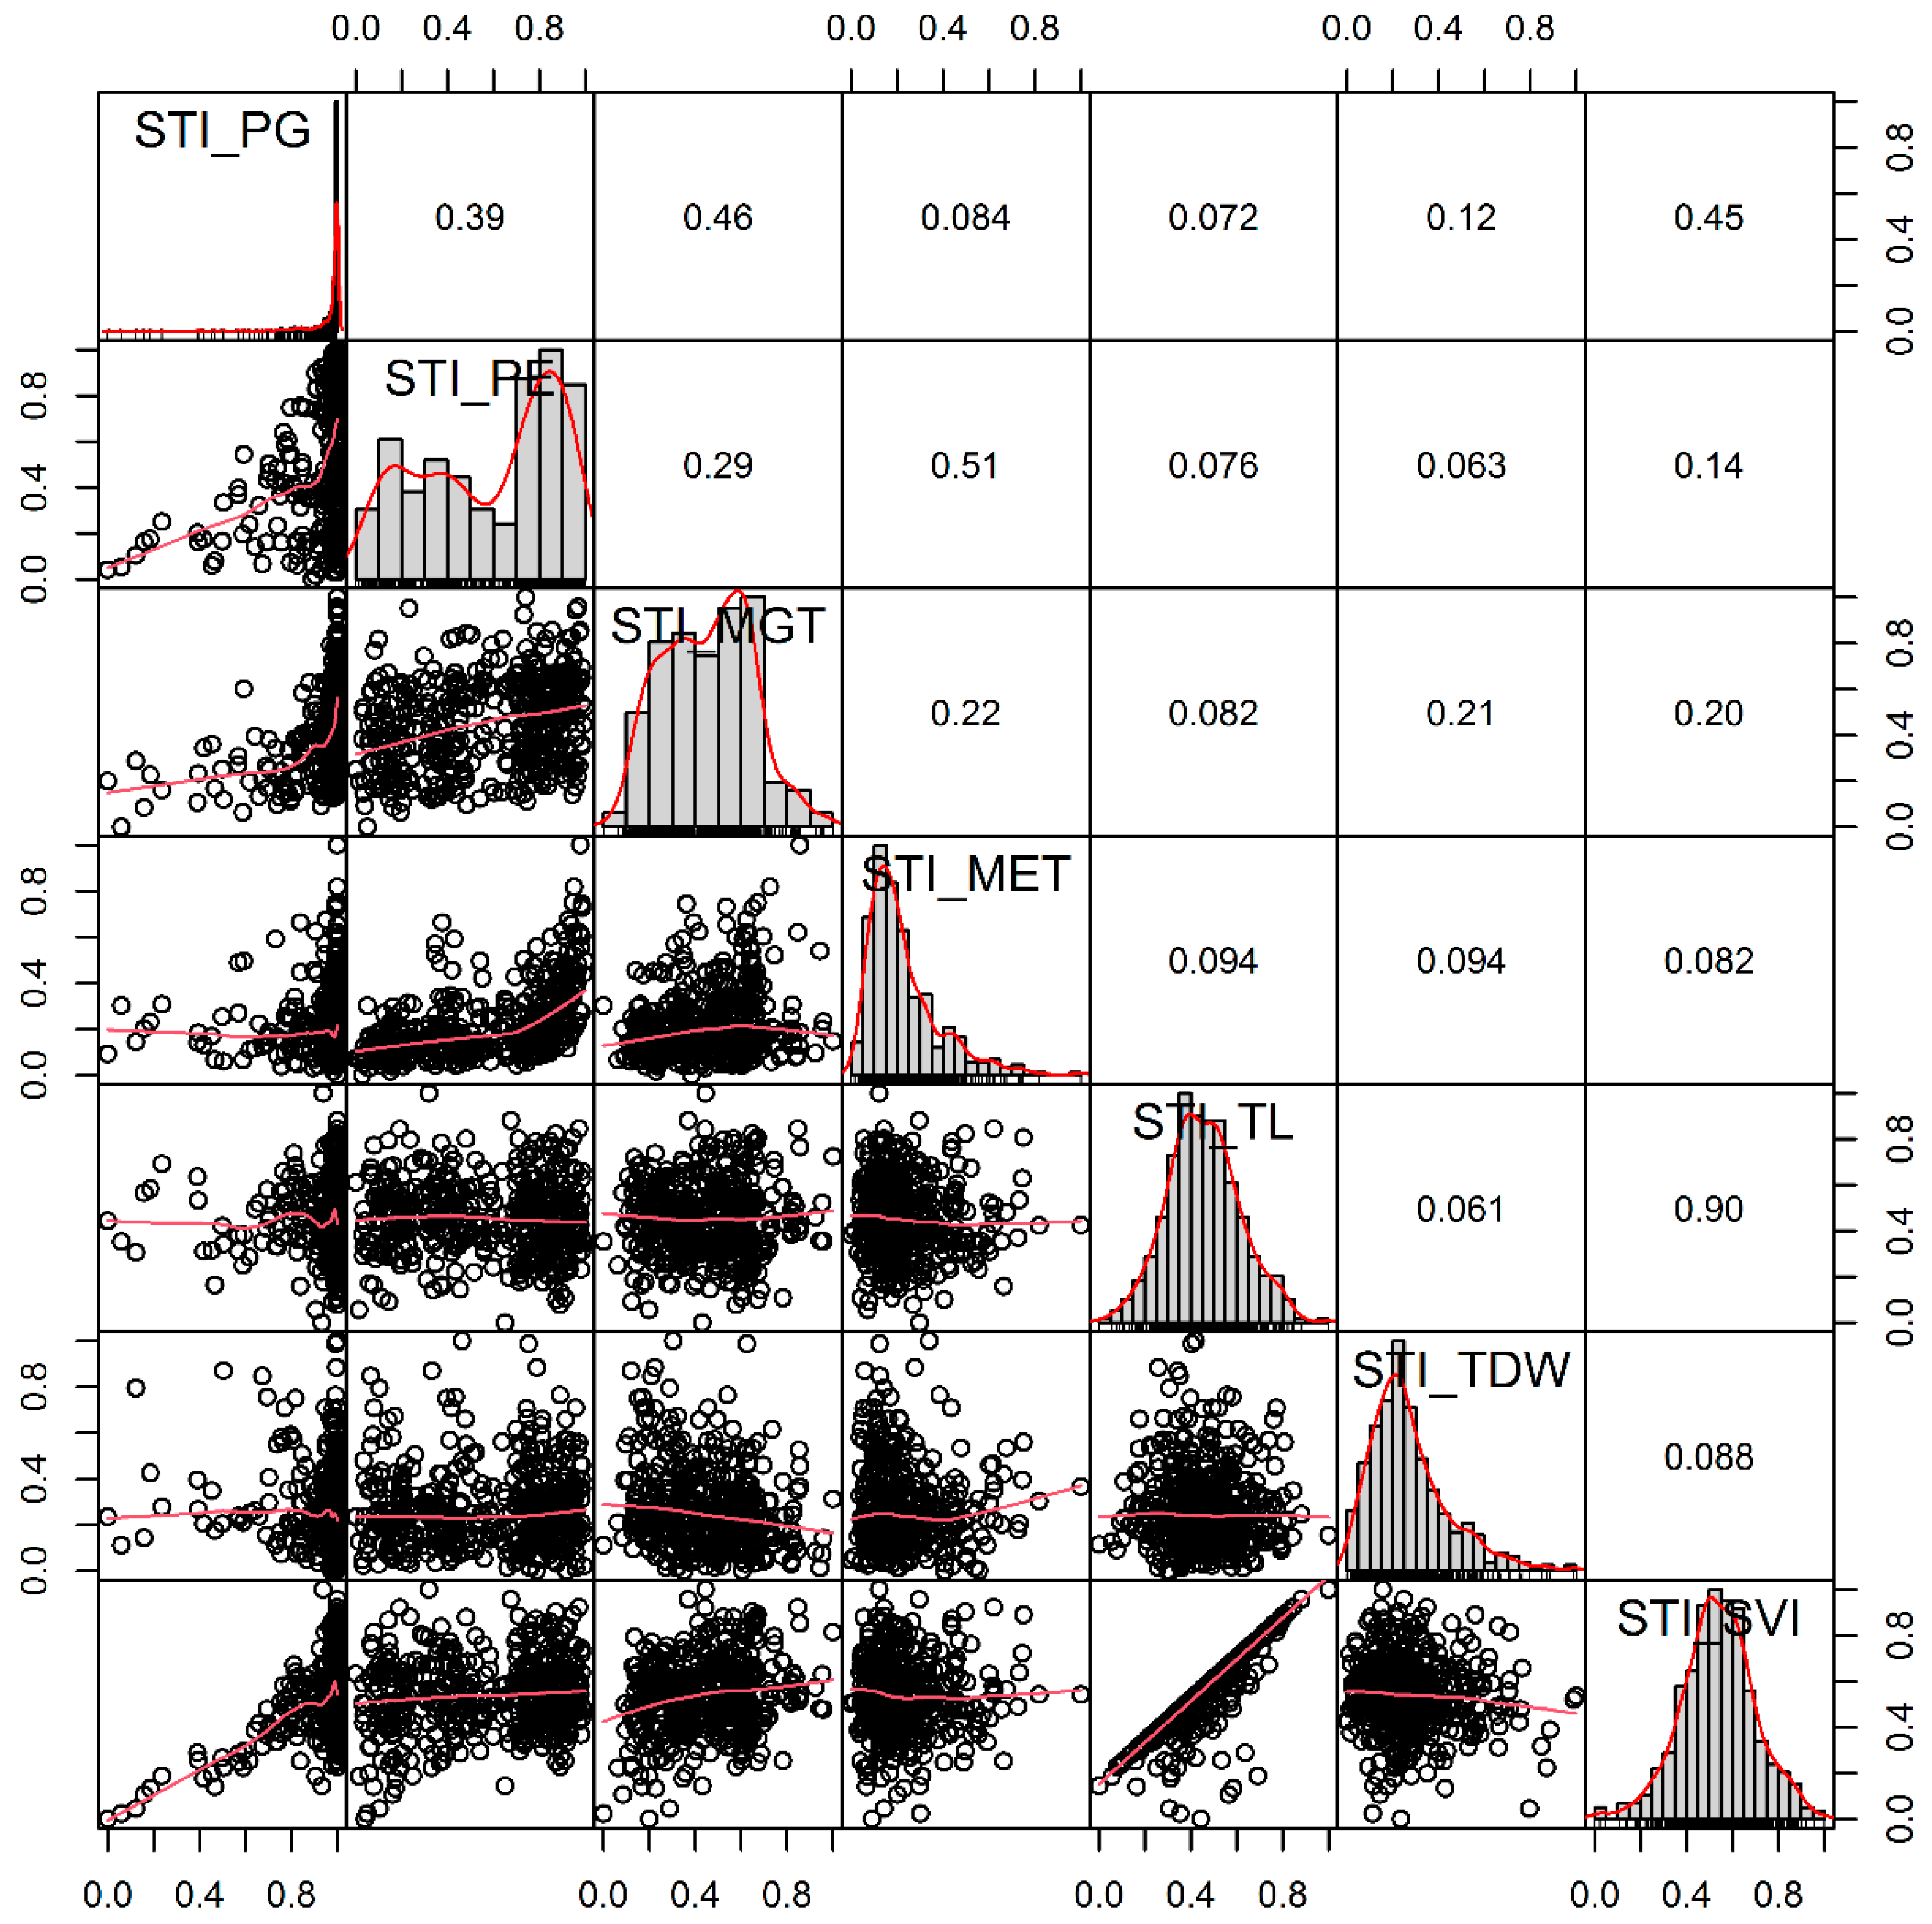
3.2. Distance Correlation and Weight of Low-Temperature Stress Index Related to Seed Germination- and Seedling Emergence-Related Traits

In this experiment, the low-temperature stress index STI was used to measure the comprehensive performance of each genotype under normal- and low-temperature conditions. The STI distribution of each indicator is shown in Figure 3. The low-temperature stress indices of the percentage of germination (STI_PG) among the genotypes showed a skewed distribution, and the STI_PG of most varieties was greater than 0.8. The low-temperature stress index of total seedling length (STI_TL) and seedling vigor index (STI_SVI) conformed to the trend of normal distribution, and the low-temperature stress index of mean emergence time (STI_MET) and total dry weight (STI_TDW) showed a positively skewed distribution. From the matrix of distance correlation coefficients between indicators (Figure 3), it can be seen that the distance correlation coefficient between STI_TL and STI_SVI was the largest, reaching 0.9. Secondly, the correlation coefficient of STI_MET and STI_PE reached 0.51, and the correlation coefficient of STI_MGT and STI_PG reached 0.46. The information content and weight of each indicator were calculated according to the distance correlation coefficient between the indicators and the standard deviation of the indicators (Table 2). The weight distribution of the seven indicators of low-temperature stress tolerance index ranges from 10.4% to 22.9%, of which STI_PE had the largest weight and STI_PG had the smallest weight.

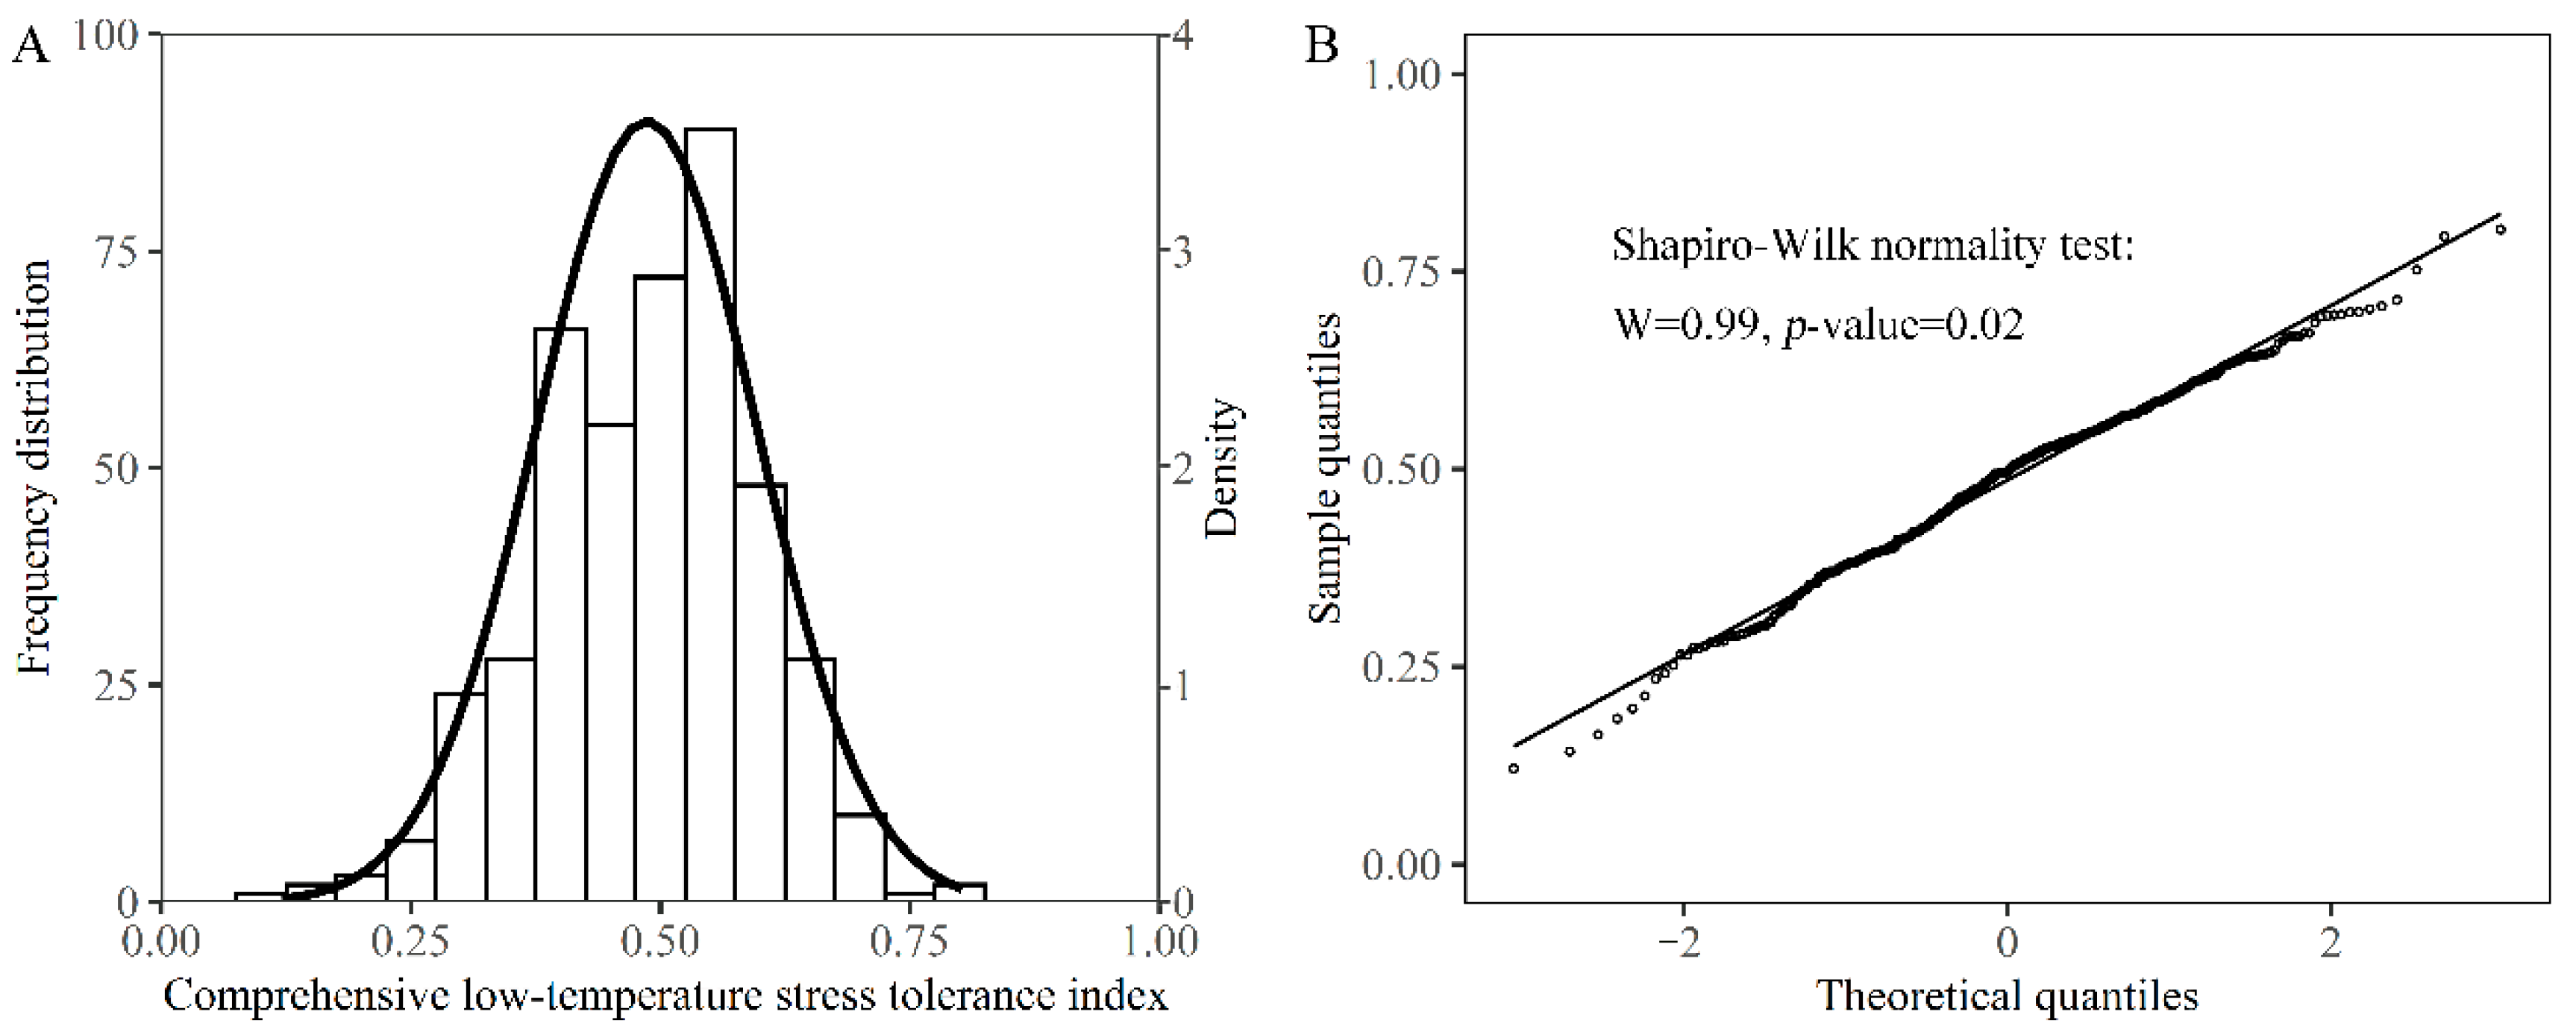
3.3. A Comprehensive Evaluation of Low-Temperature Stress Tolerance of Different Rapeseed Genotypes during Seed Germination and Seedling Emergence Stages

Combined with the low-temperature stress tolerance index of each germination and emergence traits obtained by the D-CRITIC method, the seven STI traits among 436 genotypes were comprehensively evaluated by the membership function method. The results show that the comprehensive low-temperature stress index among the genotypes varied from 0.12 to 0.80, with a concentrated distribution around 0.5 (Figure 4A). From the Q–Q plot (Figure 4B), it can be seen that the comprehensive low-temperature stress index is in line with the normal distribution at the p < 0.01 level. According to the comprehensive low-temperature stress index, five low-temperature-sensitive genotypes were screened, namely “11-9-703”, “97096”, “Zhongshuang No.4”, “90750”, and “wx1025”, and the comprehensive low-temperature stress indices were 0.12, 0.14, 0.16, 0.18, and 0.20, respectively; five low-temperature resistant genotypes, namely “Huahang 901”, “Caoyou No.2”, “Qianyou No.4”, “SWU63”, and “Fengding 240”, and the comprehensive low-temperature stress indices were 0.71, 0.71, 0.75, 0.79, and 0.80 (Table 3).

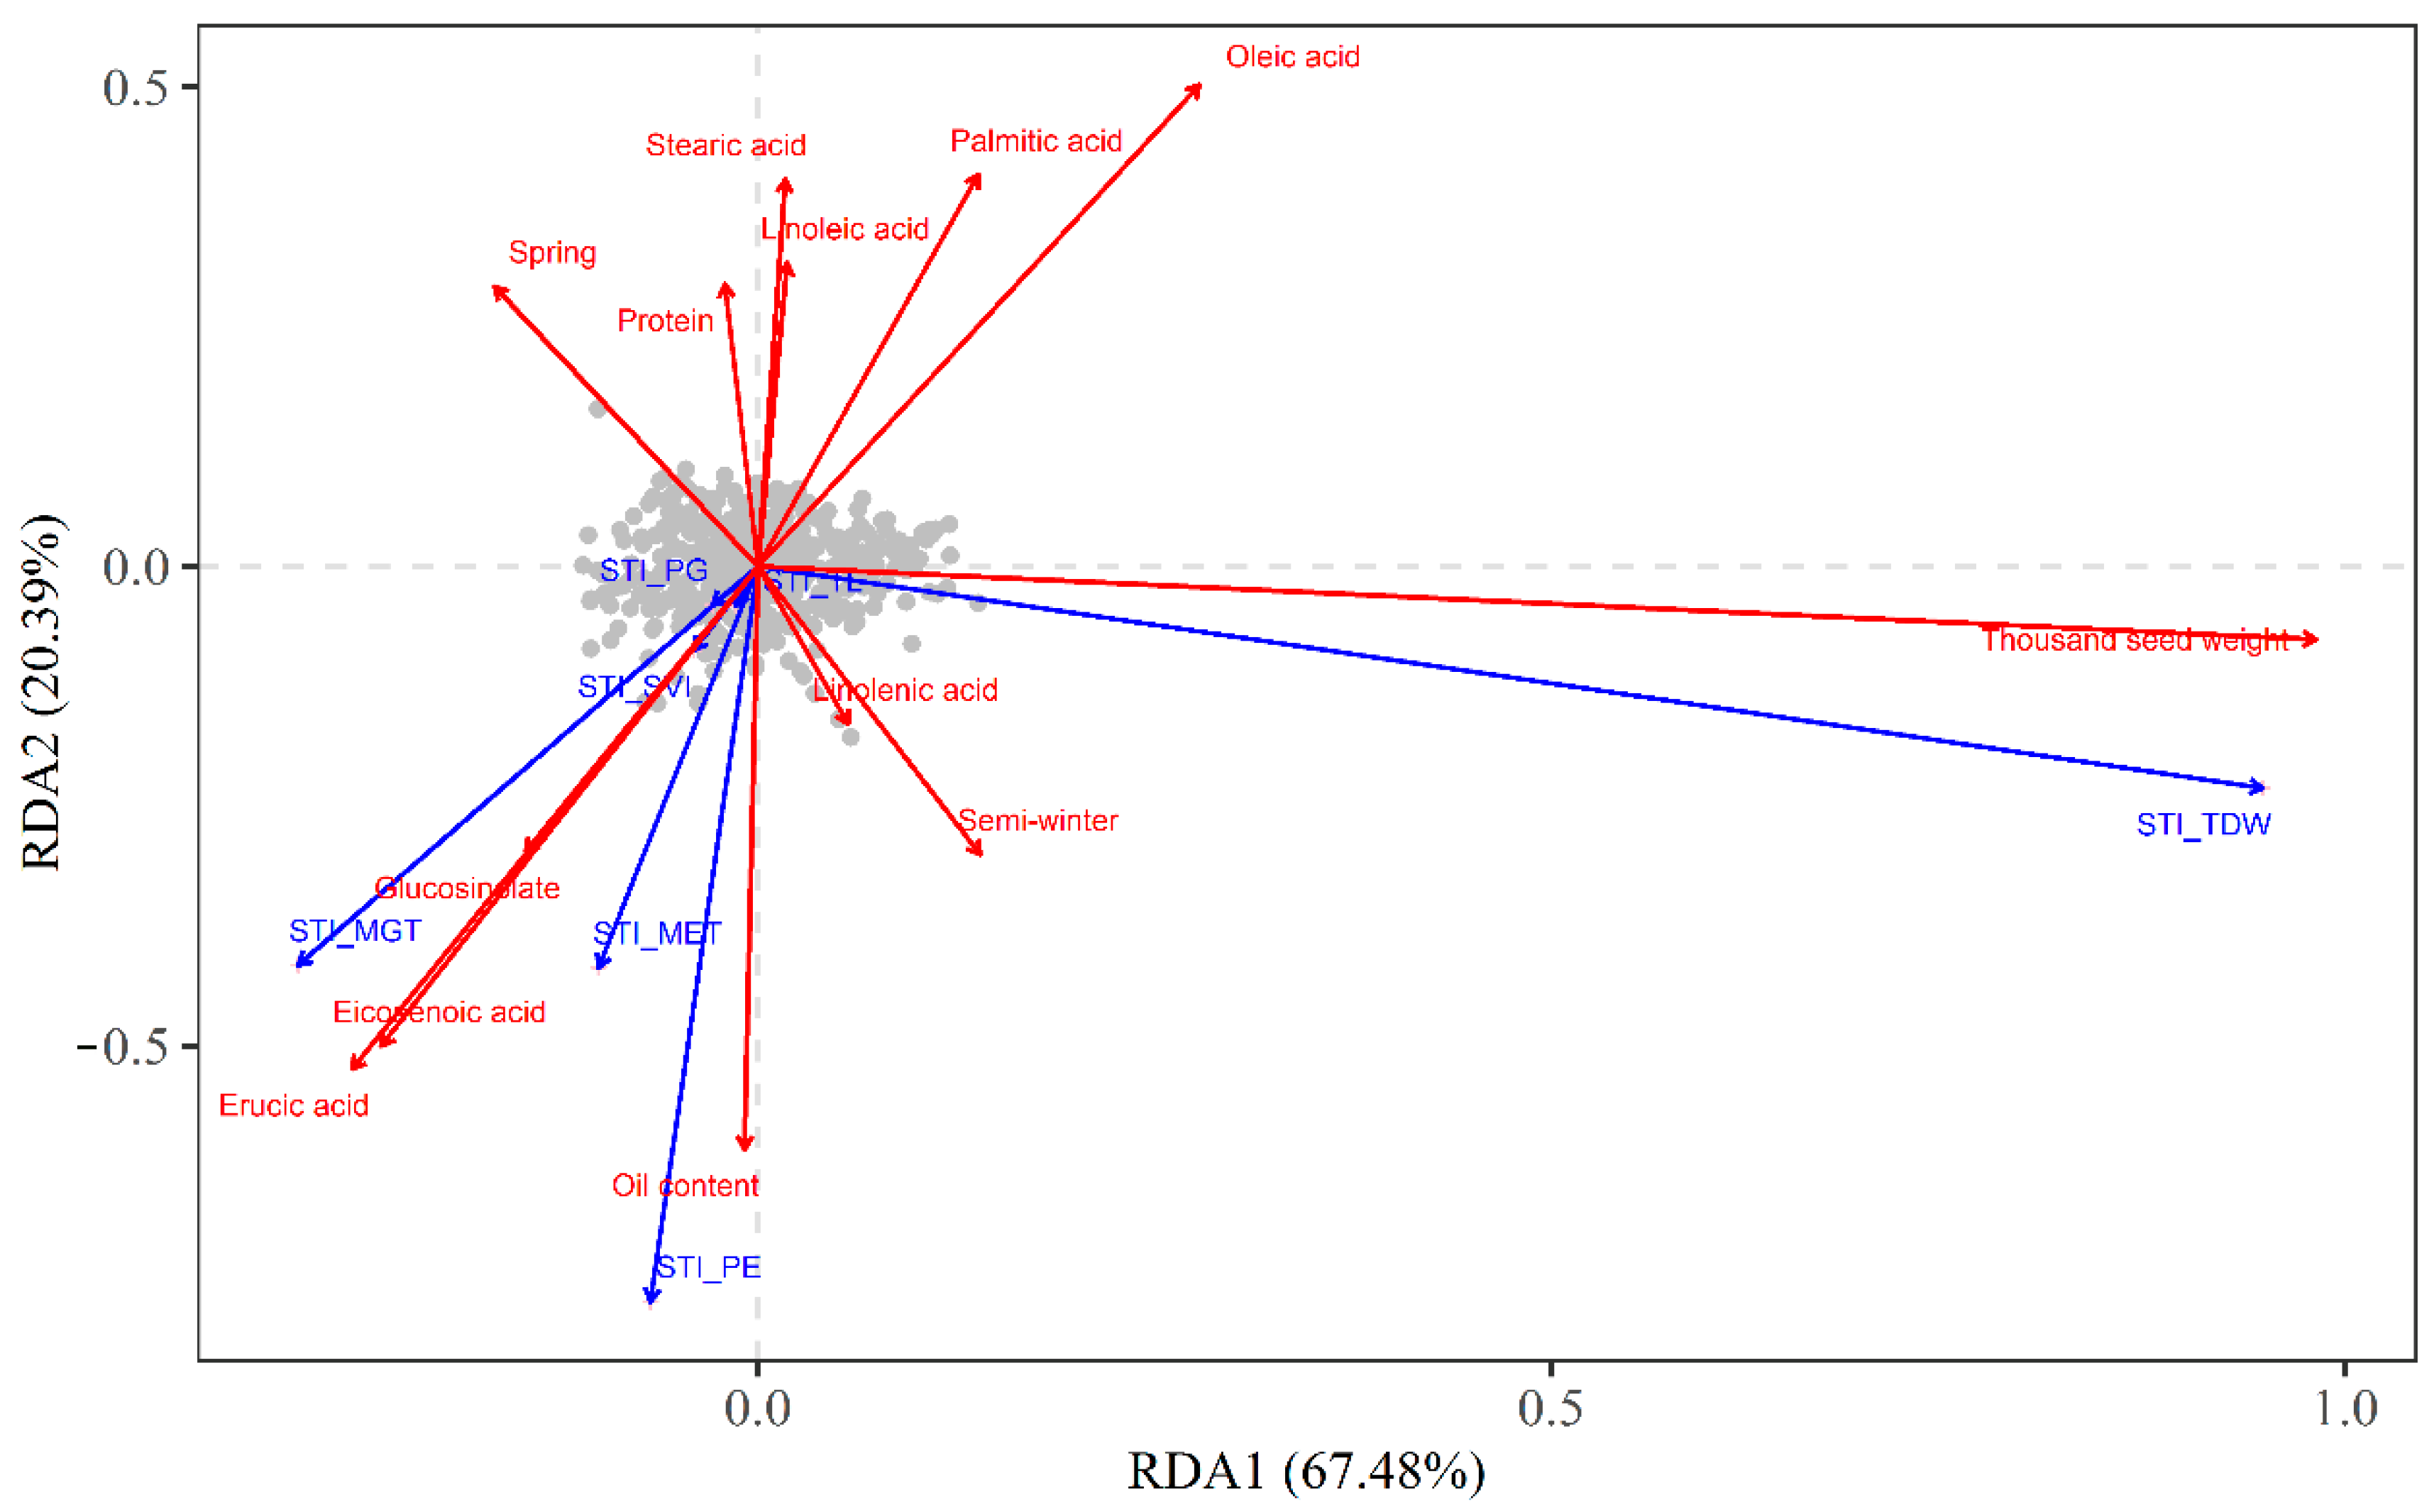
3.4. Effects of Rapeseed Characteristics on Low-Temperature Stress Tolerance during the Seed Germination and Seedling Emergence Stages

Taking seed characteristics as explanatory variables and the seed germination and seedling emergence low-temperature stress tolerance index traits as response variables, the results of the redundancy analysis showed that the total variance of seed germination and seedling emergence low-temperature stress tolerance index traits was 0.79. The explanation of seed characteristics to the variance of low-temperature stress tolerance index traits during seed germination and seedling emergence stages was 0.17, with an explanatory degree of 22% (p < 0.01). In the explained variance of seed germination and seedling characteristics, the explanatory degree of constraint axis RDA1 reached 67.48%, and the explanatory degree of constraint axis RDA2 reached 20.39%; therefore, we choose to project all variables and genotype information onto the first two constraint axes (Figure 5). In Figure 5, the red vector represents seed traits; the blue vector represents the low-temperature stress tolerance indices related to the seed germination and seedling emergence. The cosine value of the angle between the vectors represents the correlation between the two variables. The smaller the angle between the two vectors indicates a more significant correlation; the larger the projection value of the interpretation vector on the constraint axis RDA1 or RDA2, the greater the contribution of this axis formation. It can be seen from Figure 5 that the thousand-seed weight had the greatest contribution to RDA1, and the correlation between thousand-seed weight and STI_TDW was relatively large; The oil content had the greatest contribution to RDA2, and it had a higher correlation with STI_PE, followed by STI_MET. The STI_SVI, STI_PG, and STI_TL had short vector lengths, indicating a lower explanatory value for seed characteristics. The result also show that STI_MGT, STI_MET, and STI_PE were positively correlated with the contents of erucic acid, glucosinolate, and eicosenoic acid; and were negatively correlated with palmitic acid, oleic acid, stearic acid, linoleic acid, and protein content.

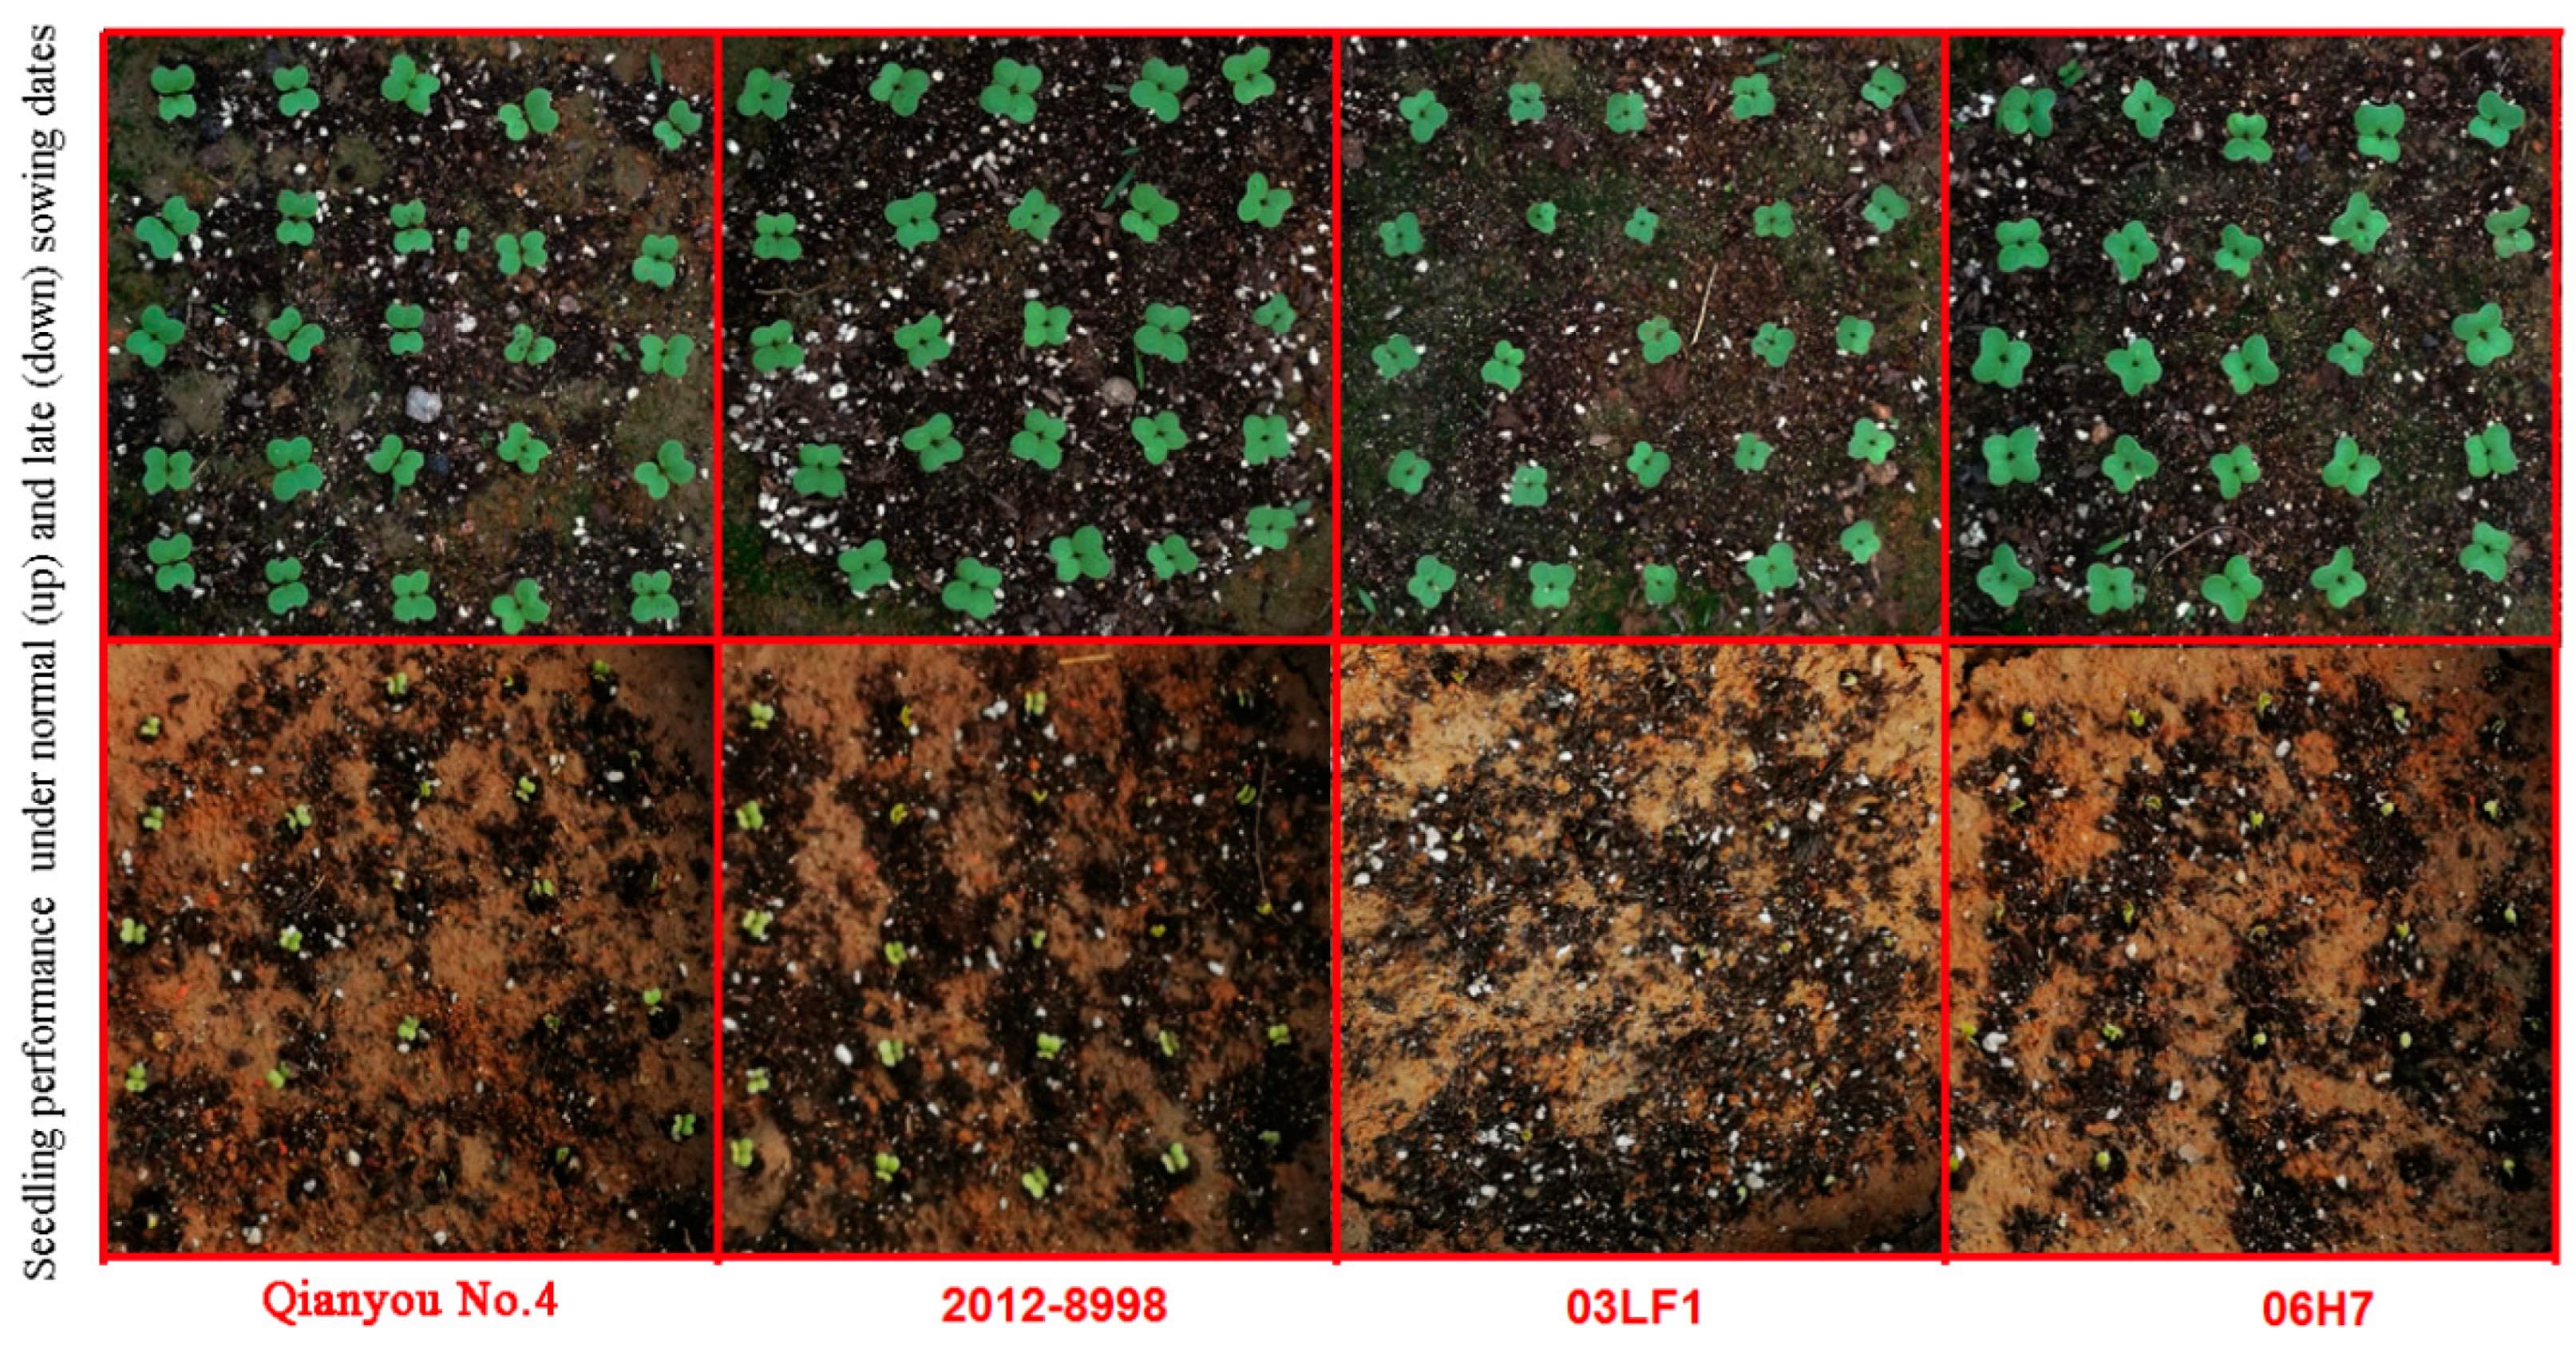
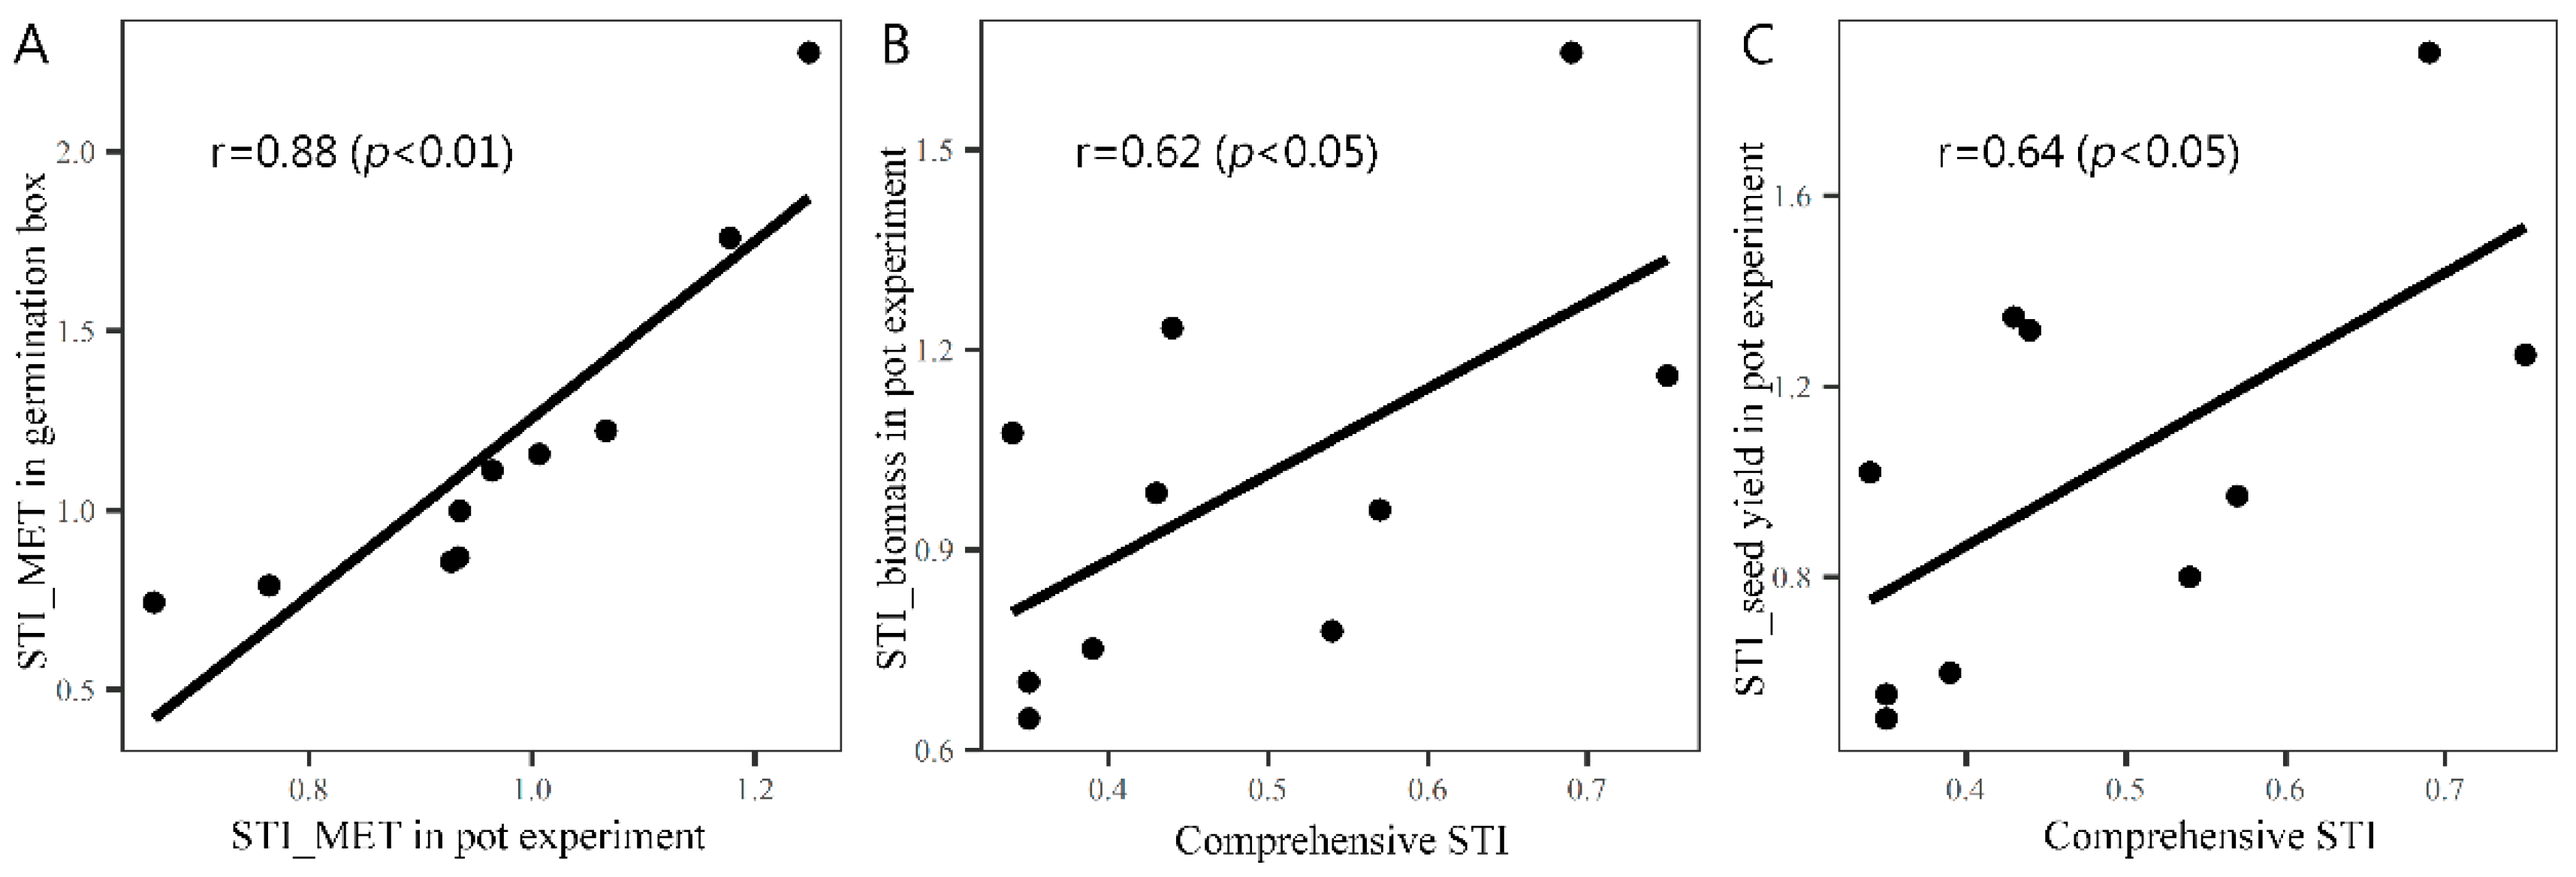
3.5. The Performance of Genotypes with Different Comprehensive Low-Temperature Stress Indices under the Conditions of Early and Late Sowing in Pots

Ten genotypes with different comprehensive low-temperature stress indices were screened to study the effect of low temperature on their emergence characteristics, biomass, and yield under pot conditions. On the 4th day after pot sowing, there was no significant difference in the emergence rate of each genotype under normal-temperature conditions. However, under low-temperature conditions, the genotypes “Qianyou No.4” and “2012-8998” with high comprehensive low-temperature stress indices (comprehensive STI) had significantly better emergence performances than the genotypes “03LF1” and “06H7” with low comprehensive STIs (Figure 6). The STI_MET was significantly positively correlated under pot and germination box conditions, and the correlation reached 0.88 (Figure 7A), indicating that the low-temperature resistance of seedlings screened on the germination box in the incubator can be extended to outdoor soil conditions. The comprehensive STI in the germination box was also significantly correlated with the low-temperature stress tolerance index of biomass and seed yield under pot conditions, which were 0.62 and 0.64, respectively (Figure 7B,C), suggesting that the genotypes with large comprehensive STIs had advantages in biomass accumulation and yield formation under low-temperature conditions.

4. Discussion

4.1. Evaluation of Low-Temperature Tolerance of Seed Germination- and Seedling Emergence-Related Indicators of Rapeseed

The seed germination and seedling emergence stages of rapeseed are the most sensitive to low-temperature stress, which directly determines rapeseed population density and grain yield [27]. Rapid seed germination can increase the probability of plant survival and adaptability to the environment [28]. This study focused on the performances of seven functional traits, including seed germination rate, seedling emergence rate, mean germination time, mean emergence time, total seedling length, total dry weight, and seedling vigor index during the germination and seedling emergence process of 436 rapeseed genotypes under normal- and low-temperature treatments. The data provided support for the diversity of low-temperature tolerance of rapeseed germplasm resources. The results are consistent with previous studies [21,29]. Low-temperature stress will prolong the time for rapeseed to complete germination and seedling emergence, reducing the final germination and seedling rate. The differences in functional traits related to germination and seedling emergence under low-temperature conditions reflect the genetic diversity in response to low-temperature stress.
Stress resistance (treatment value/control value) and the stress tolerance index are two commonly used algorithms that reflect the comprehensive performance of genotypes under stress and non-stress conditions [30]. Stress resistance can reflect the stability of a trait under stress and non-stress conditions; while the stress tolerance index reflects the comprehensive potential of a certain trait of multiple genotypes under stress and non-stress conditions. Studies have shown that stress resistance may be negatively correlated with the yield of varieties under adversity [31], while the stress tolerance index is positively correlated with the yield of varieties under adverse environmental conditions, which is more practical [32,33]. Therefore, in this experiment, the membership function method was used to comprehensively evaluate the low-temperature stress index of seven traits among 436 genotypes. In the comprehensive evaluation of multiple indicators, the methods for determining the weight of each indicator mainly include the expert scoring method, survey statistics method, correlation coefficient method, principal component analysis, and complexity analysis [34,35]. The D-CRITIC weight method used in this experiment is an objective weight statistical method, which has the advantage of integrating each index’s standard deviation and correlation coefficient [26]. The larger the standard deviation of the indicator, the greater the fluctuation and the higher the weight; the larger the distance correlation coefficient, the larger the overlapped information and the lower the weight. The genotype’s comprehensive low-temperature stress index conformed to a normal distribution at the significance level of 0.01, which provides a statistical basis for screening extremely sensitive and extremely low-temperature-resistant genotypes at the germination and seedling emergence stages.

4.2. The Seed Characteristics Affected the Low-Temperature Tolerance of Rapeseed Seed Germination and Seedling Indicators

Previous studies have shown that the imbibition rate of low-temperature-tolerant varieties at the germination stage is faster than that of low-temperature-sensitive varieties, which may be closely related to the upregulated expression of the abundant proteins LEA and aquaporin in late embryonic development during germination [36]. Enzyme activities involved in metabolic regulation, such as reactive oxygen species scavenging, substance degradation, and energy metabolism, also determine the seed germination ability and stress resistance [37,38,39]. The results of this experiment based on redundancy analysis show that the explained variance of seed characteristics for the low-temperature stress index traits under germination and seedlings emergence stages was about 22%, indicating that the storage substances of seeds affected the low-temperature tolerance of these stages. In crops such as cotton and cucumber, it has been found that an increase in seed oil content was accompanied by an increase in low-temperature tolerance [40,41]. Rapeseed began to activate lipase to decompose the oil stored in the cotyledons after 24 h of imbibition, providing the substance and energy basis for seedling morphogenesis, and the size and composition of the oil body will affect the lipase activity [42]. The present study showed that the oil content had a higher correlation with cold stress tolerance regarding to mean germination time and mean emergence time. Gu’s research showed that seeds’ total protein content of rapeseed reached the highest level after 6 h of germination, and its content gradually decreased after 24 h [43]. The protein content showed a negative correlation with oil content in seed, and had no promoting effect on cold resistance during seed germination and seedling emergence stages.
The effect of seed size on germination characteristics varies among different crops [44,45]. The results of this study show that the thousand-seed weight of rapeseed was negatively correlated with the low-temperature stress index of the mean germination and emergence time. It is generally believed that small seeds imbibe faster than large seeds, thus the germination rate is faster than that of large seeds [46]. More weighted seeds provided more storage material for seedling morphogenesis, so thousand-seed weight was significantly correlated with the low-temperature stress index of seedling dry weight. Wheat seeds with large grains have a greater yield advantage than seeds with small grains under late sowing conditions, but there is no difference under normal-temperature conditions [47], indicating that selecting seeds with large grains under late sowing conditions is beneficial to yield formation under low-temperature stress.
The results of this experiment show that the contents of erucic acid and glucosinolate were positively correlated with low-temperature stress index of the mean germination time, mean emergence time, and mean emergence rate. Glucosinolates are unique secondary metabolites of cruciferous plants. Most of the glucosinolates are synthesized in the vegetative tissues of plants and then transported to seeds, which can improve the stress resistance of seeds [48]. Zhang et al. analyzed the effect of different germination time on the fatty acid composition of radish seeds by Soxhlet extraction combined with gas chromatography. Their results showed that after the seeds were imbibed for 20 h, compared with other fatty acid content changes, the content of erucic acid in the seeds decreased most significantly [49], indicating that erucic acid was involved in the seed germination process earlier on. The content of glucosinolates in rapeseed meal is relatively high, and it has no toxic effect. However, after being eaten by livestock and poultry, it is degraded by the catalytic action of myrosinase in the feed and gastrointestinal bacterial enzymes to generate hazardous substances, such as isothiocyanate and thiocyanate, etc. [50]. Excessive accumulation of erucic acid can easily lead to thickening of the blood vessel wall and myocardial fat deposition, which is not conducive to human health. Therefore, high erucic acid concentrations will reduce the edible quality of rapeseed oil [51]. With the increasing demand for healthy food, rapeseed varieties with low glucosinolate and erucic acid contents have been rapidly promoted, reducing the content of erucic acid and glucosinolates in seeds, but also unconsciously reducing the low-temperature tolerance of seeds for germination. Therefore, we speculate that priming with erucic acid and glucosinolate may improve the low-temperature tolerance of rapeseed at the seedling stage.

4.3. Genotypes with a High Comprehensive Low-Temperature Stress Index Have a Strong Ability to Adapt to Late Sowing Low-Temperature Conditions

Due to the comprehensive effect of external complex environmental conditions, the results of indoor artificial simulation have certain similarities and differences when extended to natural soil conditions. Therefore, it is necessary to test the reliability of laboratory indicators under natural conditions. Li et al. showed a significant positive correlation between the soybean indoor germination index and the field emergence index. Soybean varieties that showed cold resistance during indoor germination also showed strong cold resistance in field emergence [52]. The study by Chang et al. on eight peanut varieties showed that the germination-related indices such as germination rate in the low-temperature greenhouse test were consistent with the results of the field test under cold spring conditions [53]. The results of this experiment show that under the indoor artificial climate conditions, the genotypes with high comprehensive low-temperature stress tolerance index at the germination and emergence stages had higher low-temperature stress tolerance index of biomass and yield under the condition of late sowing. Meanwhile, the correlation of the mean emergence time between the germination box and pot experiment was relatively high, indicating the effectiveness of indoor screening. The low-temperature tolerance of rapeseed plays a crucial role in the successful emergence of rapeseed under late sowing conditions. The results of this experiment show that the comprehensive low-temperature stress index at the germination and seedling emergence stages had high reliability and strong applicability under natural conditions. The previous research of our group showed that the generalized heritability of the low-temperature stress index of each agronomic trait at the germination stage was greater than 0.88 [24]. This higher heritability may be the key factor for the stability of the low-temperature tolerance of the variety in the field.

5. Conclusions

The low temperature under late sowing conditions has seriously affected rapeseed production. Therefore, evaluating the low-temperature tolerance of functional traits during seed germination and seedling emergence stages is crucial for the application of germplasm resources and genetic improvement of rapeseed. This experiment revealed the phenotypic diversity of different genotypes in response to low-temperature stress at the seed germination and seedling emergence stages. The weight of each low-temperature tolerance index was calculated by the D-CRITIC method, and the comprehensive STI value was calculated by a membership function, which provided the basis for the low-temperature tolerance of rapeseed germplasm resources during these stages. The difference in rapeseed seed characteristics also affected the low-temperature tolerance at the germination and emergence stages, and the variance explained for the low-temperature stress index traits at these stages was about 22%. The genotypes with high comprehensive low-temperature stress tolerance index at the seed germination and seedling stages screened in the environment-controlled incubator also performed well under the late sowing condition of outdoor potted plants, indicating that the comprehensive low-temperature stress tolerance index based on this experiment has high reliability and strong applicability under natural conditions.

Author Contributions

Conceptualization, Z.X.; Data curation, Z.S. and C.Z. Formal analysis, T.L.; Funding acquisition, Z.X.; Investigation, T.L., C.Z., Q.L., X.L. and Z.Q.; Methodology, C.Z.; Project administration, Z.X.; Supervision, Z.X.; Writing–original draft, T.L.; Writing–review and editing, Z.X. All authors have read and agreed to the published version of the manuscript.

Funding

This research was funded by the National Key Research and Development Program of China, grant number 2020YFD1000901.

Data Availability Statement

Not applicable.

Conflicts of Interest

The authors declare no conflict of interest.

References

  1. Liu, C.; Feng, Z.C.; Xiao, T.H.; Ma, X.M.; Zhou, G.S.; Huang, F.H.; Li, J.N.; Wang, H.Z. Development, potential and adaptation of Chinese rapeseed industry. Chin. J. Oil Crop Sci. 2019, 41, 485–489. [Google Scholar]
  2. Bonjean, A.P.; Dequidt, C.; Sang, T. Rapeseed in China. OCL 2016, 23, D605. [Google Scholar] [CrossRef] [Green Version]
  3. Xian, M.Z.; Yang, P.; Hu, L.Y.; Xu, Z.H. Comprehensive evaluation of low temperature tolerance in rapeseed during germination and emergence periods. Crops 2015, 5, 116–122. [Google Scholar]
  4. Gorzin, M.; Ghaderi-Far, F.; Sadeghipour, H.R.; Zeinali, E. Induced thermo-dormancy in rapeseed (Brassica napus L.) cultivars by sub- and supra-optimal temperatures. J. Plant Growth Regul. 2020, 40, 2164–2177. [Google Scholar] [CrossRef]
  5. Marcos Filho, J. Seed vigor testing: An overview of the past, present and future perspective. Sci. Agric. 2015, 72, 363–374. [Google Scholar] [CrossRef] [Green Version]
  6. Nonogaki, H.; Bassel, G.W.; Bewley, J.D. Germination-Still a mystery. Plant Sci. 2010, 179, 574–581. [Google Scholar] [CrossRef]
  7. Li, Y.; Wang, Y.; Xue, H.; Pritchard, H.W.; Wang, X. Changes in the mitochondrial protein profile due to ROS eruption during ageing of elm (Ulmus pumila L.) seeds. Plant Physiol. Biochem. 2017, 114, 72–87. [Google Scholar] [CrossRef]
  8. Xu, H.H.; Li, N.; Liu, S.J.; Wang, W.Q.; Wang, W.P.; Zhang, H.; Cheng, H.Y.; Song, S.Q. Research progress in seed germination and its control. Acta Agron. Sin. 2014, 40, 1141–1156. [Google Scholar] [CrossRef]
  9. Wang, Z.Y.; Wang, Z.X.; Yang, W.S.; Yang, C.C.; Wang, J.; Yang, S.L.; Sun, Q.Q. Influences of temperature and PEG treatment on enzymatic characteristics during wheat seed germination. Shandong Agric. Sci. 2013, 45, 42–45. [Google Scholar]
  10. Xian, M.; Luo, T.; Khan, M.N.; Hu, L.; Xu, Z. Identifying differentially expressed genes associated with tolerance against low temperature stress in Brassica napus through transcriptome analysis. Int. J. Agric. Biol. 2017, 19, 273–281. [Google Scholar] [CrossRef]
  11. Nykiforuk, C.L.; Johnson-Flanagan, A.M. Storage reserve mobilization during low temperature germination and early seedling growth in Brassica napus. Plant Physiol. Biochem. 1999, 37, 939–947. [Google Scholar] [CrossRef]
  12. Omidi, H.; Tahmasebi, Z.; Badi HA, N.; Torabi, H.; Miransari, M. Fatty acid composition of canola (Brassica napus L.), as affected by agronomical, genotypic and environmental parameters. Comptes Rendus Biol. 2010, 333, 248–254. [Google Scholar] [CrossRef]
  13. Pritchard, F.; Eagles, H.; Norton, R.; Salisbury, P.; Nicolas, M. Environmental effects on seed composition of Victorian canola. Aust. J. Exp. Agric. 2000, 40, 679–685. [Google Scholar] [CrossRef]
  14. Wang, T.Y.; Yu, K.J.; Wan, W.; Ye, B.T.; Khattak, A.N.; Yang, R.Q.; Tian, E.T. Variation and correlation analyisis of erucic acid and glucoside content in germplasm groups of Brassica napus. Seed 2020, 39, 59–62. [Google Scholar]
  15. Wei, D.Y.; Cui, Y.X.; Mei, J.Q.; Tang, Q.L.; Li, J.N.; Qian, W. Genome-wide association study on seed oil content in rapeseed and construction of integration system for oil content loci. Acta Agron. Sin. 2018, 44, 1311–1319. [Google Scholar] [CrossRef]
  16. Hou, W.H.; Wang, J.L.; Dan, B.; Hu, D. Correlation of oilbody, protein body, oil content and protein content of Brassica rapa L. in Tibet. Chin. J. Oil Crop Sci. 2017, 39, 634–639. [Google Scholar]
  17. Gajardo, H.A.; Wittkop, B.; Soto-Cerda, B.; Higgins, E.E.; Parkin, I.A.; Snowdon, R.J.; Federico, M.L.; Iniguez-Luy, F.L. Association mapping of seed quality traits in Brassica napus L. using GWAS and candidate QTL approaches. Mol. Breed. 2015, 35, 143. [Google Scholar] [CrossRef]
  18. Zhang, C.; Luo, T.; Liu, J.; Xian, M.; Yuan, J.; Hu, L.; Xu, Z. Evaluation of the low-temperature tolerance of rapeseed genotypes at the germination and seedling emergence stages. Crop Sci. 2019, 59, 1709–1717. [Google Scholar] [CrossRef]
  19. Zhu, J.; Wang, W.; Jiang, M.; Yang, L.; Zhou, X. QTL mapping for low temperature germination in rapeseed. Sci. Rep. 2021, 11, 23382. [Google Scholar] [CrossRef]
  20. Elias, S.; Copeland, L. Evaluation of seed vigor tests for canola. Seed Technol. 1997, 19, 78–87. [Google Scholar]
  21. Huang, H.; Yan, L.; Lyu, Y.; Ding, X.Y.; Cai, J.S.; Cheng, Y.; Zhang, X.K.; Zou, X.L. Screening and evaluation of low temperature tolerance of rapeseed (Brassica napus L.) at germination stage. Chin. J. Oil Crop Sci. 2019, 41, 723–734. [Google Scholar]
  22. Zhao, Y.; Liu, X.; Zheng, L.; Chen, L.; Qin, Y. Effect of heavy metal stress on seed germination of Albizia julibrissin. Agric. Biotechnol. 2021, 10, 48–51. [Google Scholar]
  23. Zhang, R.; Hussain, S.; Wang, Y.; Liu, Y.; Li, Q.; Chen, Y.; Wei, H.; Gao, P.; Dai, Q. Comprehensive evaluation of salt tolerance in rice (Oryza sativa L.) germplasm at the germination stage. Agronomy 2021, 11, 1569. [Google Scholar] [CrossRef]
  24. Luo, T.; Zhang, Y.; Zhang, C.; Nelson, M.N.; Yuan, J.; Guo, L.; Xu, Z. Genome-wide association mapping unravels the genetic control of seed vigor under low-temperature conditions in rapeseed (Brassica napus L.). Plants 2021, 10, 426. [Google Scholar] [CrossRef]
  25. Khoshgoftarmanesh, A.H.; Sadrarhami, A.; Sharifi, H.R.; Afiuni, D.; Schulin, R. Selecting zinc-efficient wheat genotypes with high grain yield using a stress tolerance index. Agron. J. 2009, 101, 1409. [Google Scholar] [CrossRef]
  26. Krishnan, A.R.; Kasim, M.M.; Hamid, R.; Ghazali, M.F. A modified CRITIC method to estimate the objective weights of decision criteria. Symmetry 2021, 13, 973. [Google Scholar] [CrossRef]
  27. Diepenbrock, W. Yield analysis of winter oilseed rape (Brassica napus L): A review. Field Crop Res. 2000, 67, 35–49. [Google Scholar] [CrossRef]
  28. Yi, F.; Wa Ng, Z.; Baskin, C.; Baskin, J.M.; Ye, R.; Sun, H.; Zhang, Y.; Ye, X.; Liu, G.; Yang, X. Seed germination responses to seasonal temperature and drought stress are species-specific but not related to seed size in a desert steppe: Implications for effect of climate change on community structure. Ecol. Evol. 2019, 9, 2149–2159. [Google Scholar] [CrossRef] [Green Version]
  29. Yang, P.; Xian, M.Z.; Hu, L.Y.; Xu, Z.H. Effects of low-temeprature on seed germination and seedling development of rapeseed. J. Huazhong Agric. Univ. 2015, 34, 7–13. [Google Scholar]
  30. Bahrami, F.; Arzani, A.; Karimi, V. Evaluation of yield-based drought tolerance indices for screening safflower genotypes. Agron. J. 2014, 106, 1219. [Google Scholar] [CrossRef] [Green Version]
  31. Farshadfar, E.; Mohammadi, R.; Farshadfar, M.; Dabiri, S. Relationships and repeatability of drought tolerance indices in wheat-rye disomic addition lines. Aust. J. Crop Sci. 2013, 7, 130–138. [Google Scholar]
  32. Dehghani, G.H.; Shhi, F.M.; Alizadeh, B. A study of drought tolerance indices in canola (Brassica napus L.) genotypes. J. Sci. Technol. Agric. Nat. Res. 2009, 13, 77–90. [Google Scholar]
  33. Kharrazi, M.A.S.; Rad, M.R.N. Evaluation of sorghum genotypes under drought stress conditions using some stress tolerance indices. Afr. J. Biotechnol. 2011, 10, 13086–13089. [Google Scholar]
  34. He, Y.; Guo, H.; Jin, M.; Ren, P. A linguistic entropy weight method and its application in linguistic multi-attribute group decision making. Nonlinear Dyn. 2016, 84, 399–404. [Google Scholar] [CrossRef]
  35. Li, H.-X.; Li, L.-X.; Wang, J.-Y.; Mo, Z.-W.; Li, Y.-D. Fuzzy decision making based on variable weights. Math. Comput. Model. 2004, 39, 163–179. [Google Scholar] [CrossRef]
  36. Luo, T.; Xian, M.; Zhang, C.; Zhang, C.; Hu, L.; Xu, Z. Associating transcriptional regulation for rapid germination of rapeseed (Brassica napus L.) under low temperature stress through weighted gene co-expression network analysis. Sci. Rep. 2019, 9, 55. [Google Scholar] [CrossRef]
  37. Gomes, M.; Garcia, Q. Reactive oxygen species and seed germination. Biologia 2013, 68, 351–357. [Google Scholar] [CrossRef]
  38. Nykiforuk, C.L.; Johnson-Flanagan, A.M. Germination and early seedling development under low temperature in canola. Crop Sci. 1994, 34, 1047–1054. [Google Scholar] [CrossRef]
  39. Wu, X.; Liu, H.; Wang, W.; Chen, S.; Hu, X.; Li, C. Proteomic analysis of seed viability in maize. Acta Physiol. Plant 2011, 33, 181–191. [Google Scholar] [CrossRef]
  40. Yan, S.J.; Liu, J.; Si, L.T.; Ma, Z.G.; Yang, J.M. Study on the relationship oil content in cucumber seed and chilling tolerance. Acta Agric. Boreali Simica 2007, 22, 33–35. [Google Scholar]
  41. Su, Y.; Liang, W.; Liu, Z.; Wang, Y.; Zhao, Y.; Ijaz, B.; Hua, J. Overexpression of GhDof1 improved salt and cold tolerance and seed oil content in Gossypium hirsutum. J. Plant Physiol. 2017, 218, 222–234. [Google Scholar] [CrossRef] [PubMed]
  42. Hoppe, A.; Theimer, R.R. Degradation of oil bodies isolated from cotyledons during germination of rapeseed seedlings. J. Plant Physiol. 1997, 151, 471–478. [Google Scholar] [CrossRef]
  43. Gu, J.; Chao, H.; Gan, L.; Guo, L.; Zhang, K.; Li, Y.; Wang, H.; Raboanatahiry, N.; Li, M. Proteomic dissection of seed germination and seedling establishment in Brassica napus. Front. Plant Sci. 2016, 7, 1482. [Google Scholar] [CrossRef] [PubMed] [Green Version]
  44. Malcolm, P.J.; Holford, P.; Mcglasson, W.B.; Newman, S. Temperature and seed weight affect the germination of peach rootstock seeds and the growth of rootstock seedlings. Sci. Hortic. 2003, 98, 247–256. [Google Scholar] [CrossRef]
  45. Willenborg, C.J.; Wildeman, J.C.; Miller, A.K.; Rossnagel, B.G.; Shirtliffe, S.J. Oat germination characteristics differ among genotypes, seed sizes, and osmotic potentials. Crop Sci. 2005, 45, 2023–2029. [Google Scholar] [CrossRef]
  46. Kidson, R.; Westoby, M. Seed mass and seedling dimensions in relation to seedling establishment. Oecologia 2000, 125, 11–17. [Google Scholar] [CrossRef]
  47. Ambika, S.; Manonmani, V.; Somasundaram, G. Review on effect of seed size on seedling vigour and seed yield. Res. J. Seed Sci. 2014, 7, 31–38. [Google Scholar] [CrossRef] [Green Version]
  48. He, Y.; Yang, Z.; Tang, M.; Yang, Q.Y.; Zhang, Y.; Liu, S. Enhancing canola breeding by editing a glucosinolate transporter gene lacking natural variation. Plant Physiol. 2022, 188, 1848–1851. [Google Scholar] [CrossRef]
  49. Zhang, H.; Zhao, G.L. Study on changes of fatty acids composition from radish seed germination. Cereals Oils 2020, 33, 73–75. [Google Scholar]
  50. Zhao, X.A.; Wu, M.F. Anti-nutritional effect and mechanism of glucosinolates. Chin. Lives Breed. 2011, 10, 34–37. [Google Scholar]
  51. Laryea, M.; Jiang, Y.; Xu, G.; Lombeck, I. Fatty acid composition of blood lipids in Chinese children consuming high erucic acid rapeseed oil. Ann. Nutr. Metab. 1992, 36, 273–278. [Google Scholar] [CrossRef]
  52. Li, Y.J.; Chang, R.Z.; Zhao, Y.T.; Sun, J.Y. Laboratory screening on tolerance to cold in soybean and application in field. Soyb. Sci. 1992, 11, 49–57. [Google Scholar]
  53. Chang, B.W.; Zhong, P.; Liu, J.; Tang, Z.H.; Gao, Y.B.; Yu, H.J.; Guo, W. Effect of low-temperature stress and gibberellin on seed germination and seedling physiological responses in peanut. Acta Agron. Sin. 2019, 45, 118–130. [Google Scholar] [CrossRef]
Figure 1. Dynamic changes of the average, maximum, and minimum temperatures under normal and late sowing conditions.
Agronomy 12 01969 g001
Figure 2. Frequency distribution of functional traits related to seed germination and seedling emergence under normal- (CK) and low-temperature (LT) conditions for 436 rapeseed lines. PG, percentage of germination; PE, percentage of emergence; MGT, mean germination time; MET, mean emergence time; TL, total seedling length; TDW, total dry weight; SVI, seedling vigor index.
Agronomy 12 01969 g002
Figure 3. The distributions and distance correlation coefficients of the seed germination- and seedling emergence-related low-temperature tolerance indices. STI_PG, low-temperature stress tolerance index of germination percentage; STI_PE, low-temperature stress tolerance index of emergence percentage; STI_MGT, low-temperature stress tolerance index of mean germination time; STI_MET, low-temperature stress tolerance index of mean emergence time; STI_TDW, low-temperature stress tolerance index of total dry weight; STI_TL, low-temperature stress tolerance index of total seedling length; STI_SVI, low-temperature stress tolerance index of seedling vigor index.
Agronomy 12 01969 g003
Figure 4. Comprehensive low-temperature stress tolerance index frequency distribution (A) and Shapiro–Wilk normality test outcome (B).
Agronomy 12 01969 g004
Figure 5. Schematic representations of a triplot-based redundancy analysis. Red arrows indicate explanatory variables, namely seed traits; blue arrows indicate the response variable, namely the low-temperature stress tolerance index related to seed germination and seedling emergence. The grey points represent genotype varieties.
Agronomy 12 01969 g005
Figure 6. Seedling emergence performance of rapeseed genotypes with high or low comprehensive low-temperature tolerance index under normal-temperature (normal sowing date) and low-temperature (late sowing date) conditions after 4 days of sowing in the pot experiment.
Agronomy 12 01969 g006
Figure 7. The agronomic performance under germination box trail and pot experiment of varieties with different low-temperature tolerance comprehensive scores. (A) Comparison of low-temperature STIs of seedling emergence between germination box and pot conditions; (B) relationship between comprehensive STIs in germination box and biomass-related low-temperature STIs in the pot experiment; (C) relationship between comprehensive STIs in germination box and seed yield-related low-temperature STIs in the pot experiment.
Agronomy 12 01969 g007
Table 1. Statistic variables of seed germination- and seedling emergence-related indices under normal- and low-temperature conditions. PG, percentage of germination (%); PE, percentage of emergence (%); MGT, mean germination time (d); MET, mean emergence time (d); TDW, total dry weight (mg/plant); TL, total seedling length (cm/plant); SVI, seedling vigor index; CV, coefficient of variation. The significance of the differences between normal- and low-temperature conditions was determined by the Wilcoxon signed-rank test.
Statistic
Variable
PGPEMGTMETTLTDWSVI
CKLTCKLTCKLTCKLTCKLTCKLTCKLT
Mean99.794.790.462.31.293.345.5911.758.847.702.793.038.827.29
Min89.05.080.01.01.002.013.437.693.164.521.601.443.160.43
Max100.0100.099.399.62.305.436.9313.9013.3811.115.425.9312.8511.11
CV1%14%6%49%25%21%13%10%15%14%24%22%15%19%
Skewness−7.84−4.03−0.52−0.441.081.43−0.46−0.87−0.13−0.140.820.53−0.15−1.23
Kurtosis73.8118.42−0.93−1.31−0.115.55−0.380.310.620.280.820.790.540.77
Wilcoxon testp < 0.01p < 0.01p < 0.01p < 0.01p < 0.01p < 0.01p < 0.01
Table 2. Weight of seed germination- and seedling emergence-related low-temperature tolerance indices based on D-CRITIC method. STI_MGT, low-temperature stress tolerance index of mean germination time; STI_PG, low-temperature stress tolerance index of germination percentage; STI_MET, low-temperature stress tolerance index of mean emergence time; STI_PE, low-temperature stress tolerance index of emergence percentage; STI_TDW, low-temperature stress tolerance index of total dry weight; STI_TL, low-temperature stress tolerance index of total seedling length; STI_SVI, low-temperature stress tolerance index of seedling vigor index.
Statistic IndexSTI_PGSTI_PESTI_MGTSTI_METSTI_TLSTI_TDWSTI_SVI
Standard deviation0.140.300.190.150.170.160.16
Information content0.621.360.870.740.920.670.75
Weight10.4%22.9%14.7%12.5%15.6%11.3%12.6%
Table 3. Screening results of low-temperature-tolerant and -sensitive genotypes based on comprehensive STIs from membership function. STI_PG, low-temperature stress tolerance index of germination percentage; STI_PE, low-temperature stress tolerance index of emergence percentage; STI_MGT, low-temperature stress tolerance index of mean germination time; STI_MET, low-temperature stress tolerance index of mean emergence time; STI_TDW, low-temperature stress tolerance index of total dry weight; STI_TL, low-temperature stress tolerance index of total seedling length; STI_SVI, low-temperature stress tolerance index of seedling vigor index.
VarietySTI_PGSTI_PESTI_MGTSTI_METSTI_TLSTI_TDWSTI_SVIComprehensive STI
11-9-7030.060.050.000.300.350.110.020.12
970960.000.040.200.090.440.240.000.14
Zhongshuang No.40.470.080.170.070.160.180.140.16
907500.910.020.200.070.060.130.190.18
wx10250.160.160.090.200.570.140.110.20
Huahang 9010.990.920.500.210.760.660.840.71
Caoyou No.21.000.860.860.190.770.460.850.71
Qianyou No.41.000.980.861.000.420.370.540.75
SWU631.000.970.850.620.840.350.920.79
Fengding 2401.000.950.670.750.810.560.890.80
Publisher’s Note: MDPI stays neutral with regard to jurisdictional claims in published maps and institutional affiliations.

