Article

An Integration of Transcriptomic Data and Modular Gene Co-Expression Network Analysis Uncovers Drought Stress-Related Hub Genes in Transgenic Rice Overexpressing OsAbp57

by
Muhammad-Redha Abdullah-Zawawi
1,
Lay-Wen Tan
2,
Zuraida Ab Rahman
3,
Ismanizan Ismail
2,4 and
Zamri Zainal
2,4,*
1
UKM Medical Molecular Biology Institute (UMBI), Universiti Kebangsaan Malaysia, Kuala Lumpur 56000, Malaysia
2
Institute of Systems Biology (INBIOSIS), Universiti Kebangsaan Malaysia, Bangi 43600, Malaysia
3
Malaysian Agricultural Research and Development Institute (MARDI), Serdang 43400, Malaysia
4
Faculty of Science and Technology, Universiti Kebangsaan Malaysia, Bangi 43600, Malaysia
*
Author to whom correspondence should be addressed.
Agronomy 2022, 12(8), 1959; https://doi.org/10.3390/agronomy12081959
Submission received: 12 July 2022 / Revised: 15 August 2022 / Accepted: 17 August 2022 / Published: 19 August 2022
(This article belongs to the Special Issue Omics Approaches for Crop Improvement)

Abstract

:
Auxin receptor plays a significant role in the plant auxin signalling pathway in response to abiotic stress. Recently, we found that transgenic rice overexpressing ABP57 had higher drought tolerance than the wild-type cultivar, MR219, due to the fact of its enhanced leaf photosynthetic rate and yields under drought stress. We performed a microarray study on this line to investigate the underlying mechanisms contributing to the observed phenotype. After microarray data filtering, 3596 genes were subjected to modular gene co-expression network (mGCN) development using CEMiTool, an R package. We identified highly related genes in 12 modules that could act to specific responses towards drought or any of the abiotic stress types. Gene set enrichment and overrepresentation analyses for modules extracted two highly upregulated modules that are involved in drought-related biological processes such as transmembrane transport of metal ions and response to oxidative stress. Finally, 123 hub genes were identified in all modules after integrating co-expression information with physical interaction data. In addition, the interplay of significant pathways between the metabolism of chlorophyll and flavonoid and the signalling pathways of MAPK, IAA, and SA inferred the concurrent involvement of stress tolerance response. Collectively, our findings seek new future directions for breeding strategies in rice tolerant improvements.

1. Introduction

Rice (Oryza sativa L.) is one of the primary staple food sources that contributes to over 20% of the daily calorie intake of more than 3.5 billion people. Hence, considerable effort has been made to ensure a sufficient rice yield supply to meet the rising population’s demand. However, a recent study suggested that rice’s global average yield improvement is still far behind the required rate to achieve the projected global demands by 2050 [1]. The slower pace of yield improvement is partly due to the diminishing returns to further intensification of irrigated rice systems [2]. In addition, the growing competition for water resources from other crops and industrialisation have also limited the expansion of irrigated rice areas.
In contrast to irrigated rice systems, which have almost achieved the full genetic potential of the high-yielding rice cultivars, the yield of rainfed rice remains low and inconsistent. This indicates an enormous upside potential for the yield of rice grown under a rainfed ecosystem. Numerous studies have pointed out that frequent occurrences of drought and the lack of drought-tolerant high-yielding rice cultivars are two of the major factors contributing to the suboptimal rice production in rainfed ecosystems [3,4]. Therefore, the development of drought-tolerant high-yielding rice is of paramount importance to ramping up the production of rainfed rice.
Auxin is a phytohormone that functions as a major coordinator in virtually all of the biological processes in plant growth and development. These biological processes include a plant’s tropic response towards gravity and light, organ patterning, cell differentiation, seed dormancy, and vascular development [5]. Recent mounting evidence shows that auxin may also play a role in plant response to drought stress. Much of the evidence comes from the realisation that the gene expression of many auxins-related genes was significantly altered under drought conditions. In rice, an expression analysis on 31 rice indole-3-acetic acid (OsIAA) genes showed that more than 15 were upregulated under drought stress [6]. In addition, a genome-level microarray analysis in rice also demonstrated that more than 204 auxin-responsive genes exhibited altered expression under desiccation conditions [7]. Given the response of auxin-related genes towards drought stress, numerous studies have been conducted to overexpress these genes in various plant species to enhance their drought tolerance. In potatoes, the overexpression of YUCCA6, a flavin monooxygenase of tryptophan-dependent auxin biosynthetic pathways, has resulted in elevated endogenous auxin levels and enhanced drought resistance [8]. In addition, the overexpression of auxin-related genes, such as OsPIN3t, TLD1/GH3.13, and OsIAA6, have also been found to confer higher tolerance of rice towards drought conditions [9,10,11]. Taken together, auxin-related genes show great potential to be utilised in the attempt to develop rice cultivar with drought tolerance.
Auxin-binding protein (ABP) is a family of low-abundance proteins that bind reversibly to auxin with high specificity and affinity. Owing to their auxin-binding properties, ABP has long been suggested to function as an auxin receptor, mediating diverse cellular responses in response to different endogenous auxin levels. ABP57 is a 57 kDa ABP that was first isolated from the soluble protein fraction of the shoot of rice (Oryza sativa L.) seedlings by Kim et al. (1998) [12]. An in vitro experiment has proven that ABP57 functions by activating plasma membrane H+-ATPase through direct interaction in response to the concentration of auxin [13]. In contrast to the classical ABP1, ABP57 appears insensitive to naphthaleneacetic acid (NAA) despite having a very high binding affinity with IAA [14]. Numerous overexpression studies have shown that a higher expression level of OsAbp57 can lead to increased seed size, faster seed germination, and seedling growth [15]. Recently, we found that transgenic rice overexpressing ABP57 had higher drought tolerance than wild-type cultivar, MR219, due to the fact of an enhanced leaf photosynthetic rate and yields under drought stress [16]. We performed a microarray study on this line to investigate the underlying mechanisms contributing to the observed phenotype.
Co-expression is a well-known biological network technique in predicting the gene function using a myriad of transcriptomics data from RNA sequencing or microarrays technology by connecting the genes based on their similar expression profiles [17,18]. Through the guilt-by-association principle, genes with similar mRNA expression profiles across the tissue, treatment, or developmental stage are predicted to share a similar function and are regulated via similar transcription factors [17,19]. The co-expression relationship can be represented as a network graph that connects nodes (i.e., co-expressed genes) by edges, indicating correlation-based evidence between genes. A group of nodes that are highly interactive with one another is known as a module. Within a module, genes with high connectivity are defined as hub genes. Modules are usually enriched to discover a set of co-expressed genes that are overrepresented in a similar biological process (i.e., gene function such as plant defence or signal transduction), molecular function (i.e., gene activity such as protein kinase or catalytic activity), and cellular component (i.e., gene location such as the cell wall or chloroplast). This information would be essential for understanding the function of a gene and on how genes are produced and operate during response to drought in rice.
In the present study, an assessment of the morpho-physiological traits exhibited by transgenic rice overexpressing OsAbp57 grown under two watering regimes was performed to identify the possible traits that may contribute to the drought tolerance of transgenic rice. In addition, a microarray analysis was also conducted to identify differentially expressed genes in the transgenic plant compared to its parental line, MR219, under normal conditions. Here, we performed a modular gene co-expression network (mGCN) analysis of this in-house microarray dataset to examine the co-expressed gene modules, evaluate the module activity between samples of MR219 and transgenic rice overexpressing OsAbp57 (Abp57-OE), and enrich a set of co-expressed gene modules to associate them with a particular function, activity, and cellular location. In this study, we represented the phenotypic class of MR219 and transgenic rice as wild-type (WT) and overexpressing OsAbp57 (Abp57-OE), respectively. To grasp an understanding of the transcriptional activity of overexpressed OsAbp57 under drought conditions, we integrated protein–protein interaction (PPI) information into the constructed modules to identify the most connected genes (i.e., hubs) within the network that may play a function as a critical regulator in response to drought stress. Finally, we conducted an expression analysis on a few selected genes to investigate their role in rice drought tolerance.

2. Materials and Methods

2.1. Sample Preparation and RNA Extraction

The T3 seeds of Abp57-overexpressing rice (OE) were obtained from our previous Agrobacterium-mediated transformation study [20] and were cultivated on MS media for ten days along with MR219 (WT) seed as a control. Each WT and Abp57-OE group consisted of three biological replicates. Total RNA was isolated from seedling tissues of Abp57-OE and WT using TRIzol reagent (Life Technology, Waltham, MA, USA), followed by DNase treatment via Ambion TURBOTM to eliminate DNA contamination. The quality of the extracted RNA was measured using NanoDrop ND-1000 spectrophotometer (Thermo Fisher Scientific, Waltham, MA, USA) in which samples with a concentration of 1.8 to 2.1 (A260/A280) were considered. We determined the integrity of the extracted RNA using a Bioanalyzer (Agilent Technologies, Santa Clara, CA, USA). All samples with an RNA Integrity Number (RIN) of 8.0 to 10.0 were subjected to microarray analysis.

2.2. Gene Expression Profiling, Differentially Expressed Genes (DEGs), and Enrichment Analyses

Gene expression profiling was conducted on the three replicates of seedling tissues of WT and Abp57-OE using Affymetrix Rice (Chinese Build) Gene 1.0 ST Array that consists of 41,770 transcripts (Affymetrix Inc., Santa Clara, CA, USA). The CEL file was imported into Affymetrix Expression ConsoleTM Software to check for quality control of raw data and data normalisation following the manufacturer’s protocol. The robust multiarray analysis (RMA) method was applied to ensure that the relative log expression signal (RLE) was comparable between samples. The microarray experiment was then previously deposited into the NCBI by Tan et al. (2017) [21] and is accessible through the NCBI GEO DataSets (DOI: https://www.ncbi.nlm.nih.gov/geo/query/acc.cgi?acc=GSE99055, accessed on 1 June 2017) [22].
The CHP files resulting from normalisation for DEGs analysis were then imported into the Transcriptome Analysis Console (TAC) software version 3.1 (Applied Biosystems, Foster City, CA, USA), following the manufacturer’s specifications. Using TAC, a statistical method of one-way analysis of variance (ANOVA) was utilised to obtain the DEGs of WT and Abp57-OE with default parameters: a fold change > |2| and an ANOVA p-value < 0.05. One-way ANOVA was calculated based on F = Mean sum of square between group (MSB)/Mean sum of square within group (MSW), where F follows an F distribution with degrees of freedom between group (df) = K – 1 and within group (DFw) = N – K. K represents the number of groups, and N is the total number of observations across all groups.
For the MSB formula, MSB = ∑(Xi ∑ Xt)2/K ∑ 1; where Xi is the mean of group i, and Xt = mean of all observations (all observations from all groups are combined to form a single group, and the mean is subsequently calculated). For the MSW formula, SSW = ∑(Xij − Xj)2/N − K; where Xij is an observation within group j, and Xj = mean of group j. Thus, overall, F = MSW/MSB = (∑(Xi − Xt)2/K − 1)/(∑(Xij − Xj)2/N − K).
For functional annotation of DEGs, we searched against several databases, including the National Center for Biotechnology Information version 236 (NCBI; https://www.ncbi.nlm.nih.gov, accessed on 15 March 2020) [23], UniProt version 2020_04 (https://www.uniprot.org, accessed on 15 March 2020) [24], Rice Genome Annotation Project version 7.0 (RGAP; http://rice.plantbiology.msu.edu/, accessed on 15 March 2020) [25], The Rice Annotation Project Database version 1.0 (RAP-DB; https://rapdb.dna.affrc.go.jp, accessed on 15 March 2020) [26], and the Beijing Genomics Institute Rise Information System version 1.0 (BGI-RIS; http://rise.genomics.org.cn/, accessed on 15 March 2020) [27]. The Gene Ontology (GO) terms were analysed with the Singular Enrichment Analysis (SEA) program available on AgriGO version 2.0 (http://bioinfo.cau.edu.cn/agriGO/, accessed on 15 March 2020) [28] with the Affymetrix Genome Array (GPL2025) as background. Genes with 2-fold expression levels and p-values < 0.05 were used for SEA analysis.

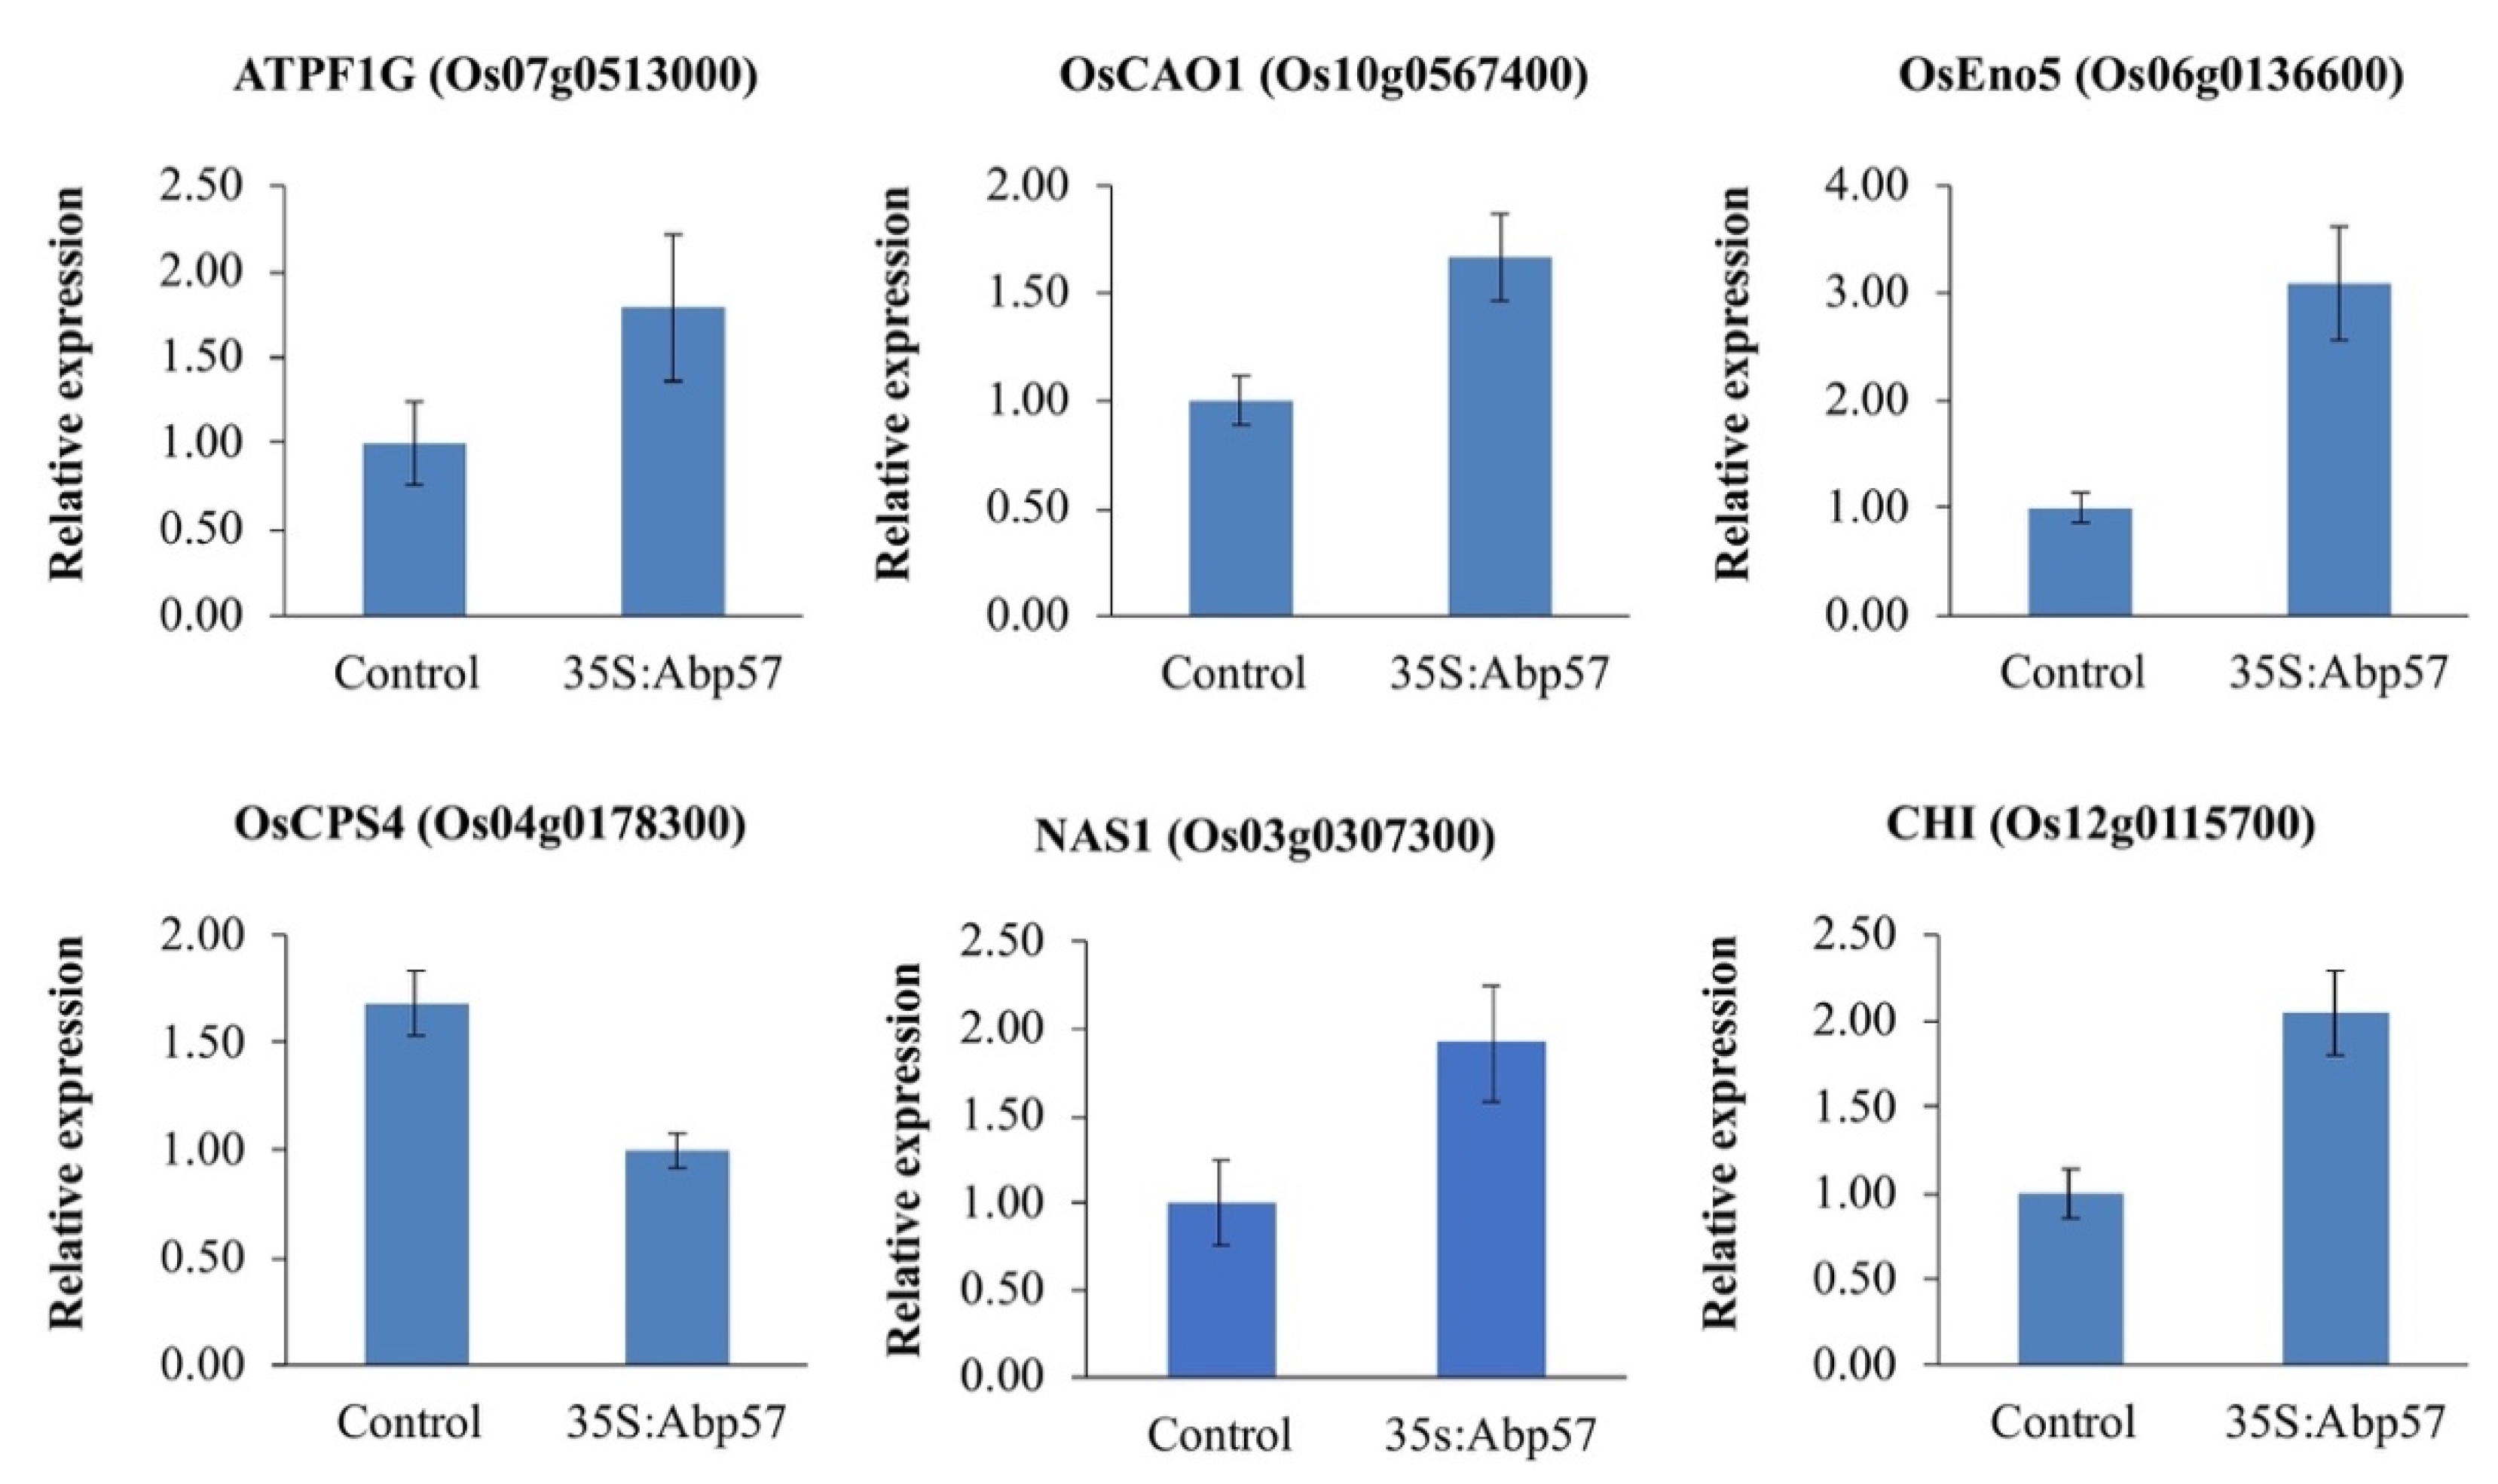
2.3. Expression Analyses of Randomly Selected Expressed Genes by qRT-PCR

Six genes were randomly selected for further investigation to validate the reliability of the microarray data as follows: ATPF1G (Os07g0513000), OsCAO1 (Os10g0567400), OsEno5 (Os06g0136600), OsCPS4 (Os04g0178300), NAS1 (Os03g0307300), and CHI (Os12g0115700). Total RNA was extracted from one-week-old seedlings of MR219 using TRIzol reagent (Life Technology, Waltham, MA, USA) and then subjected to DNase treatment using Ambion TURBOTM DNase (Thermo Fischer Scientific, Waltham, MA, USA). The total RNA was reverse-transcribed into first-strand cDNA with a Maxima First Strand cDNA synthesis kit (Thermo Fisher Scientific, Waltham, MA, USA). An equal amount of cDNA was used as the template for PCR amplification using SYBR Green Master Mix (Thermo Fisher Scientific, Waltham, MA, USA). Genes of interest were amplified using the specific primers listed in Supplementary Materials Table S1. The relative expression level of an individual gene was determined using the ΔΔ Ct calculation [29]. The housekeeping genes U6 and UBQ5 were used as an internal control. One-way ANOVA was then performed to assess DEGs with a p-value < 0.05. The expression level of DEGs was later compared with gene profiling data to determine the validity of the microarray data.

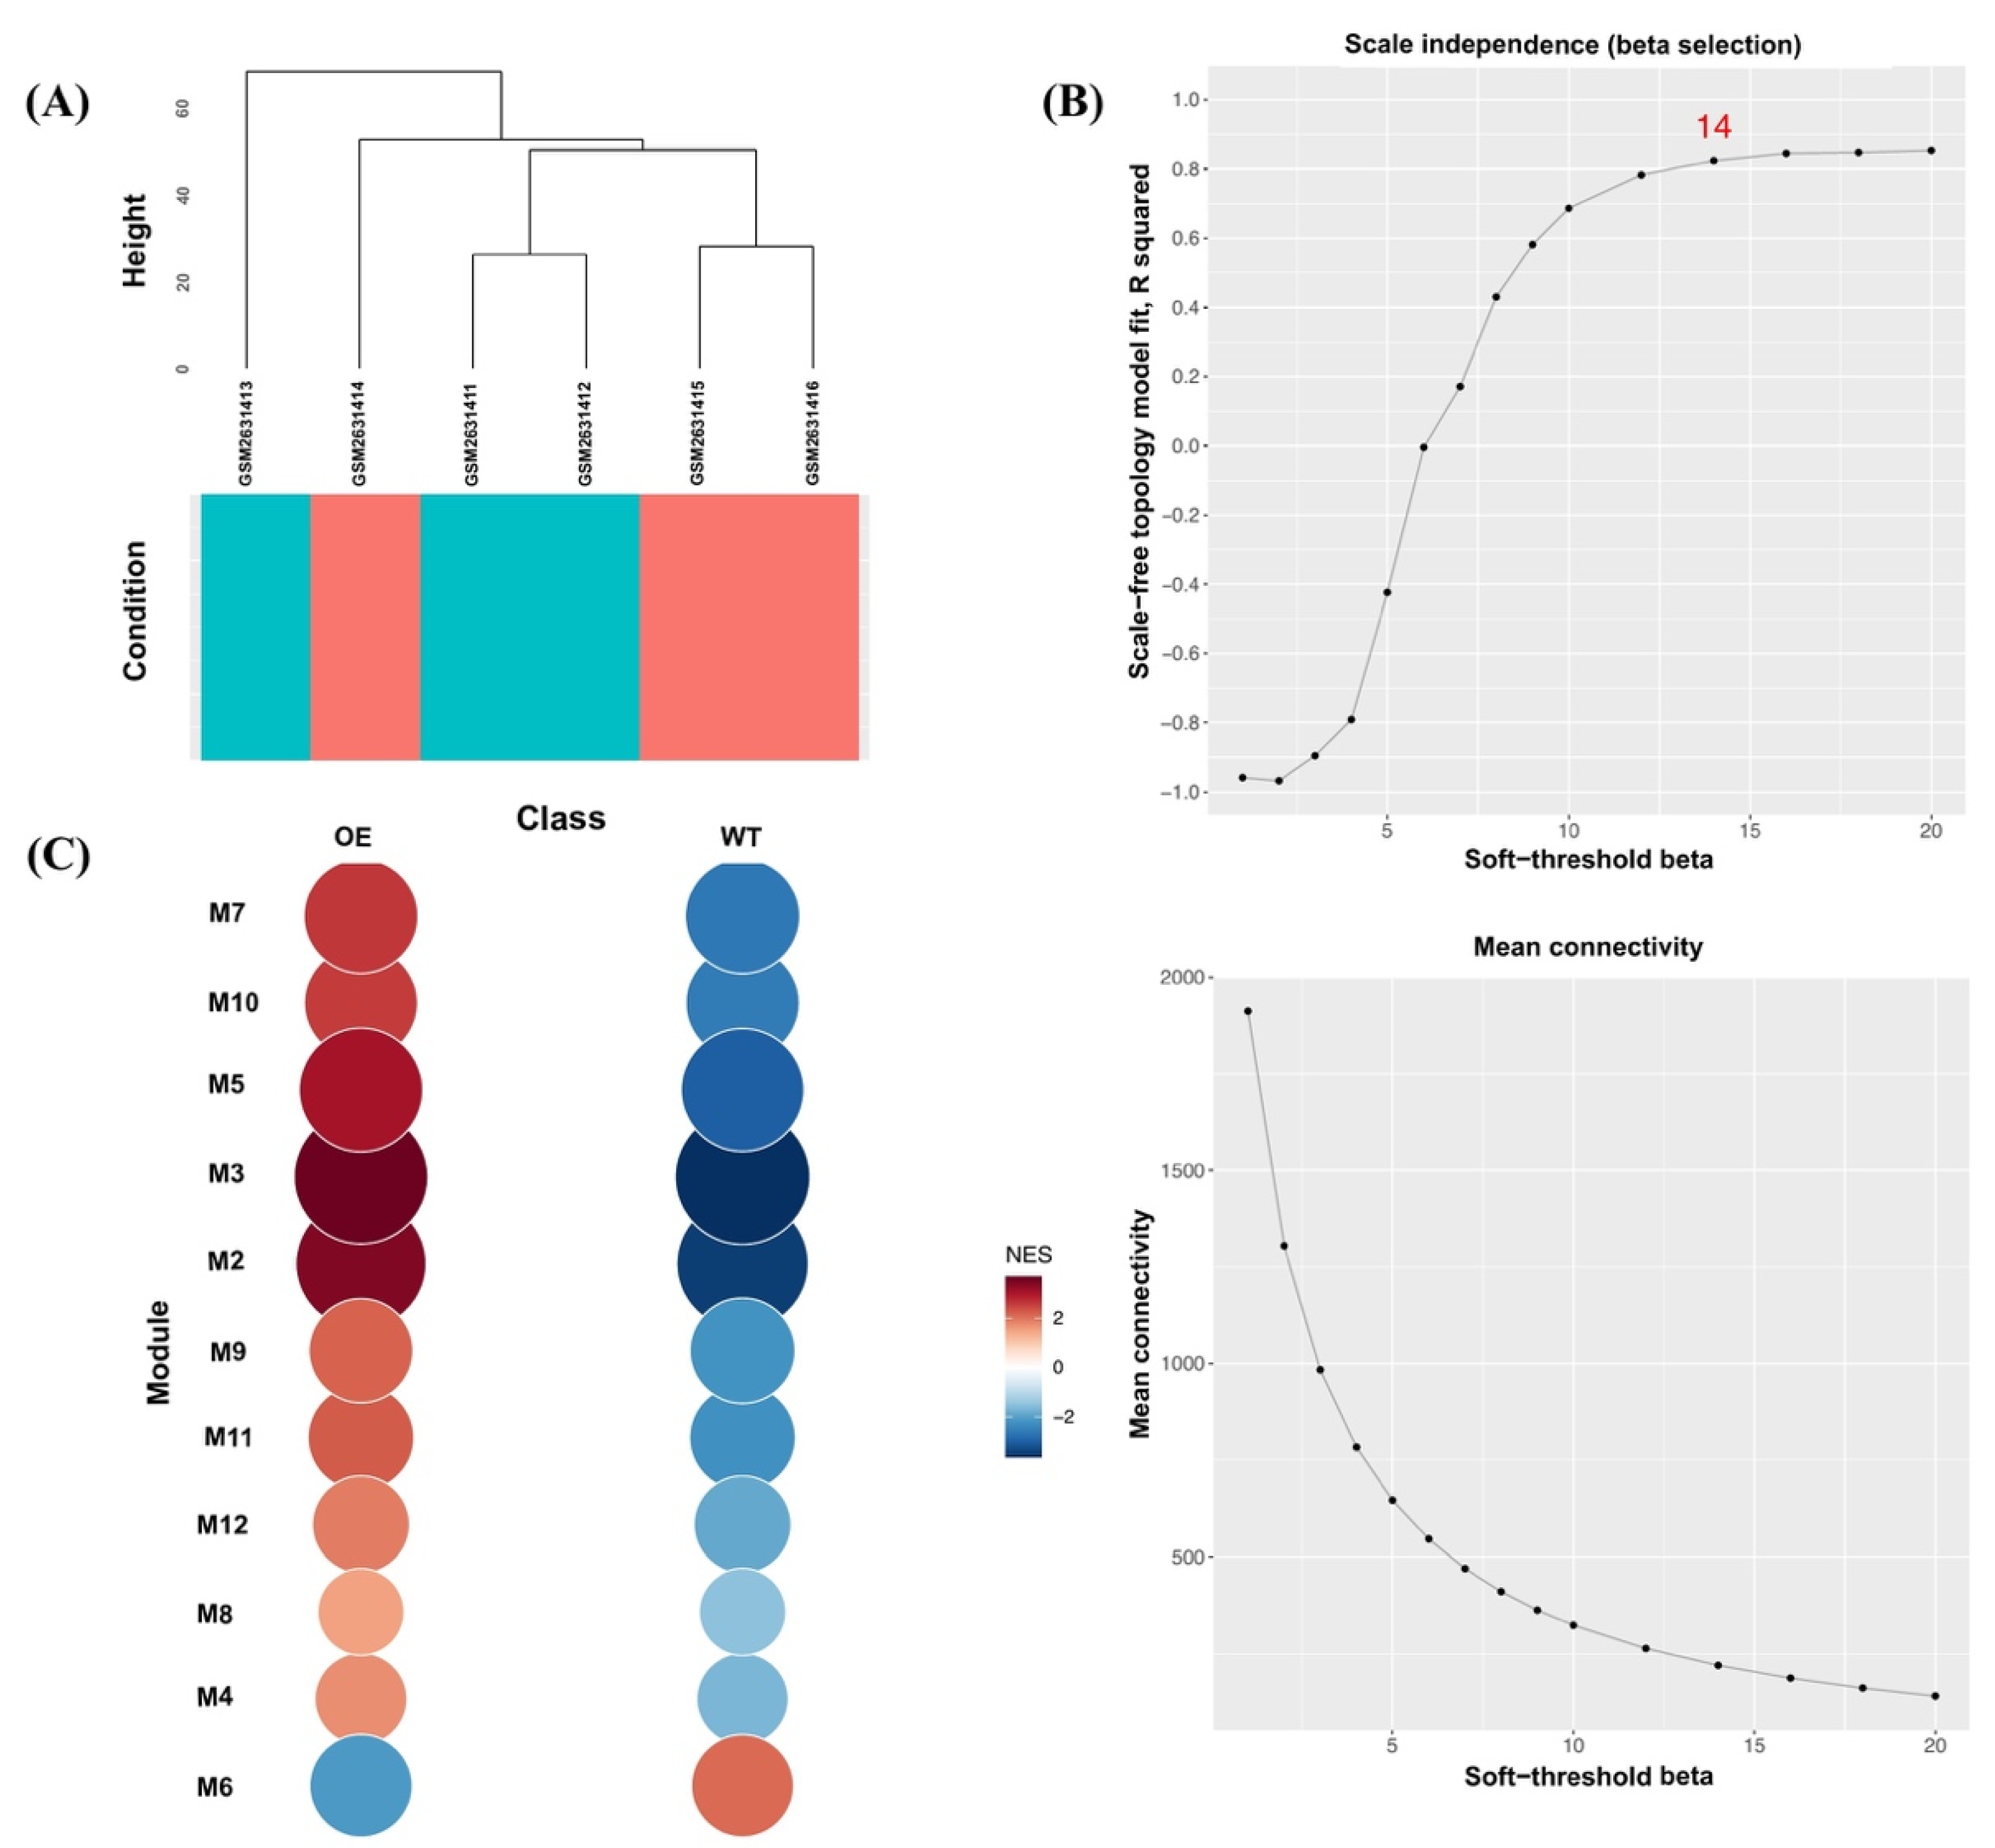
2.4. Construction of Gene Co-Expression Network Modules

To further support the reliability of our Abp57-OE microarray data in drought, the co-expression module analysis was carried out using the CEMiTool R package version 1.20 [30]. The published microarray dataset, under the accession number GSE99055, was employed as a discovery set [21]. In this study, the correlation method of Pearson was selected to transform the gene expression matrix (m × n) into an adjacency matrix, where m denotes as genes and n represents the samples. A soft-threshold power (β) selection algorithm was executed based on a scale-free topology criterion to construct an adjacency matrix, later associated with the relationship between co-expression modules. The adjacency matrices were transformed using the best threshold determined based on the “scale-freeness” of the constructed network generated by the default function of CEMiTool. Unsigned network analysis was conducted to infer whether modules represented general processes of drought stress or any stress-related responses in transgenic rice overexpressing OsAbp57. The dissimilarity threshold of 0.8 was employed as a cut-off for hierarchical clustering by the agglomerative method, where genes with common expression levels were grouped into clusters. The following criteria were used to build the network module: coefficient of determination for linear regression fit, R2 (R2 > 0.8); the number of gene modules (min_ngen) > 20; threshold similarity of eigengene (diss_thresh > 0.8); the number of high-connectivity genes in each module, hub genes (n = 5).

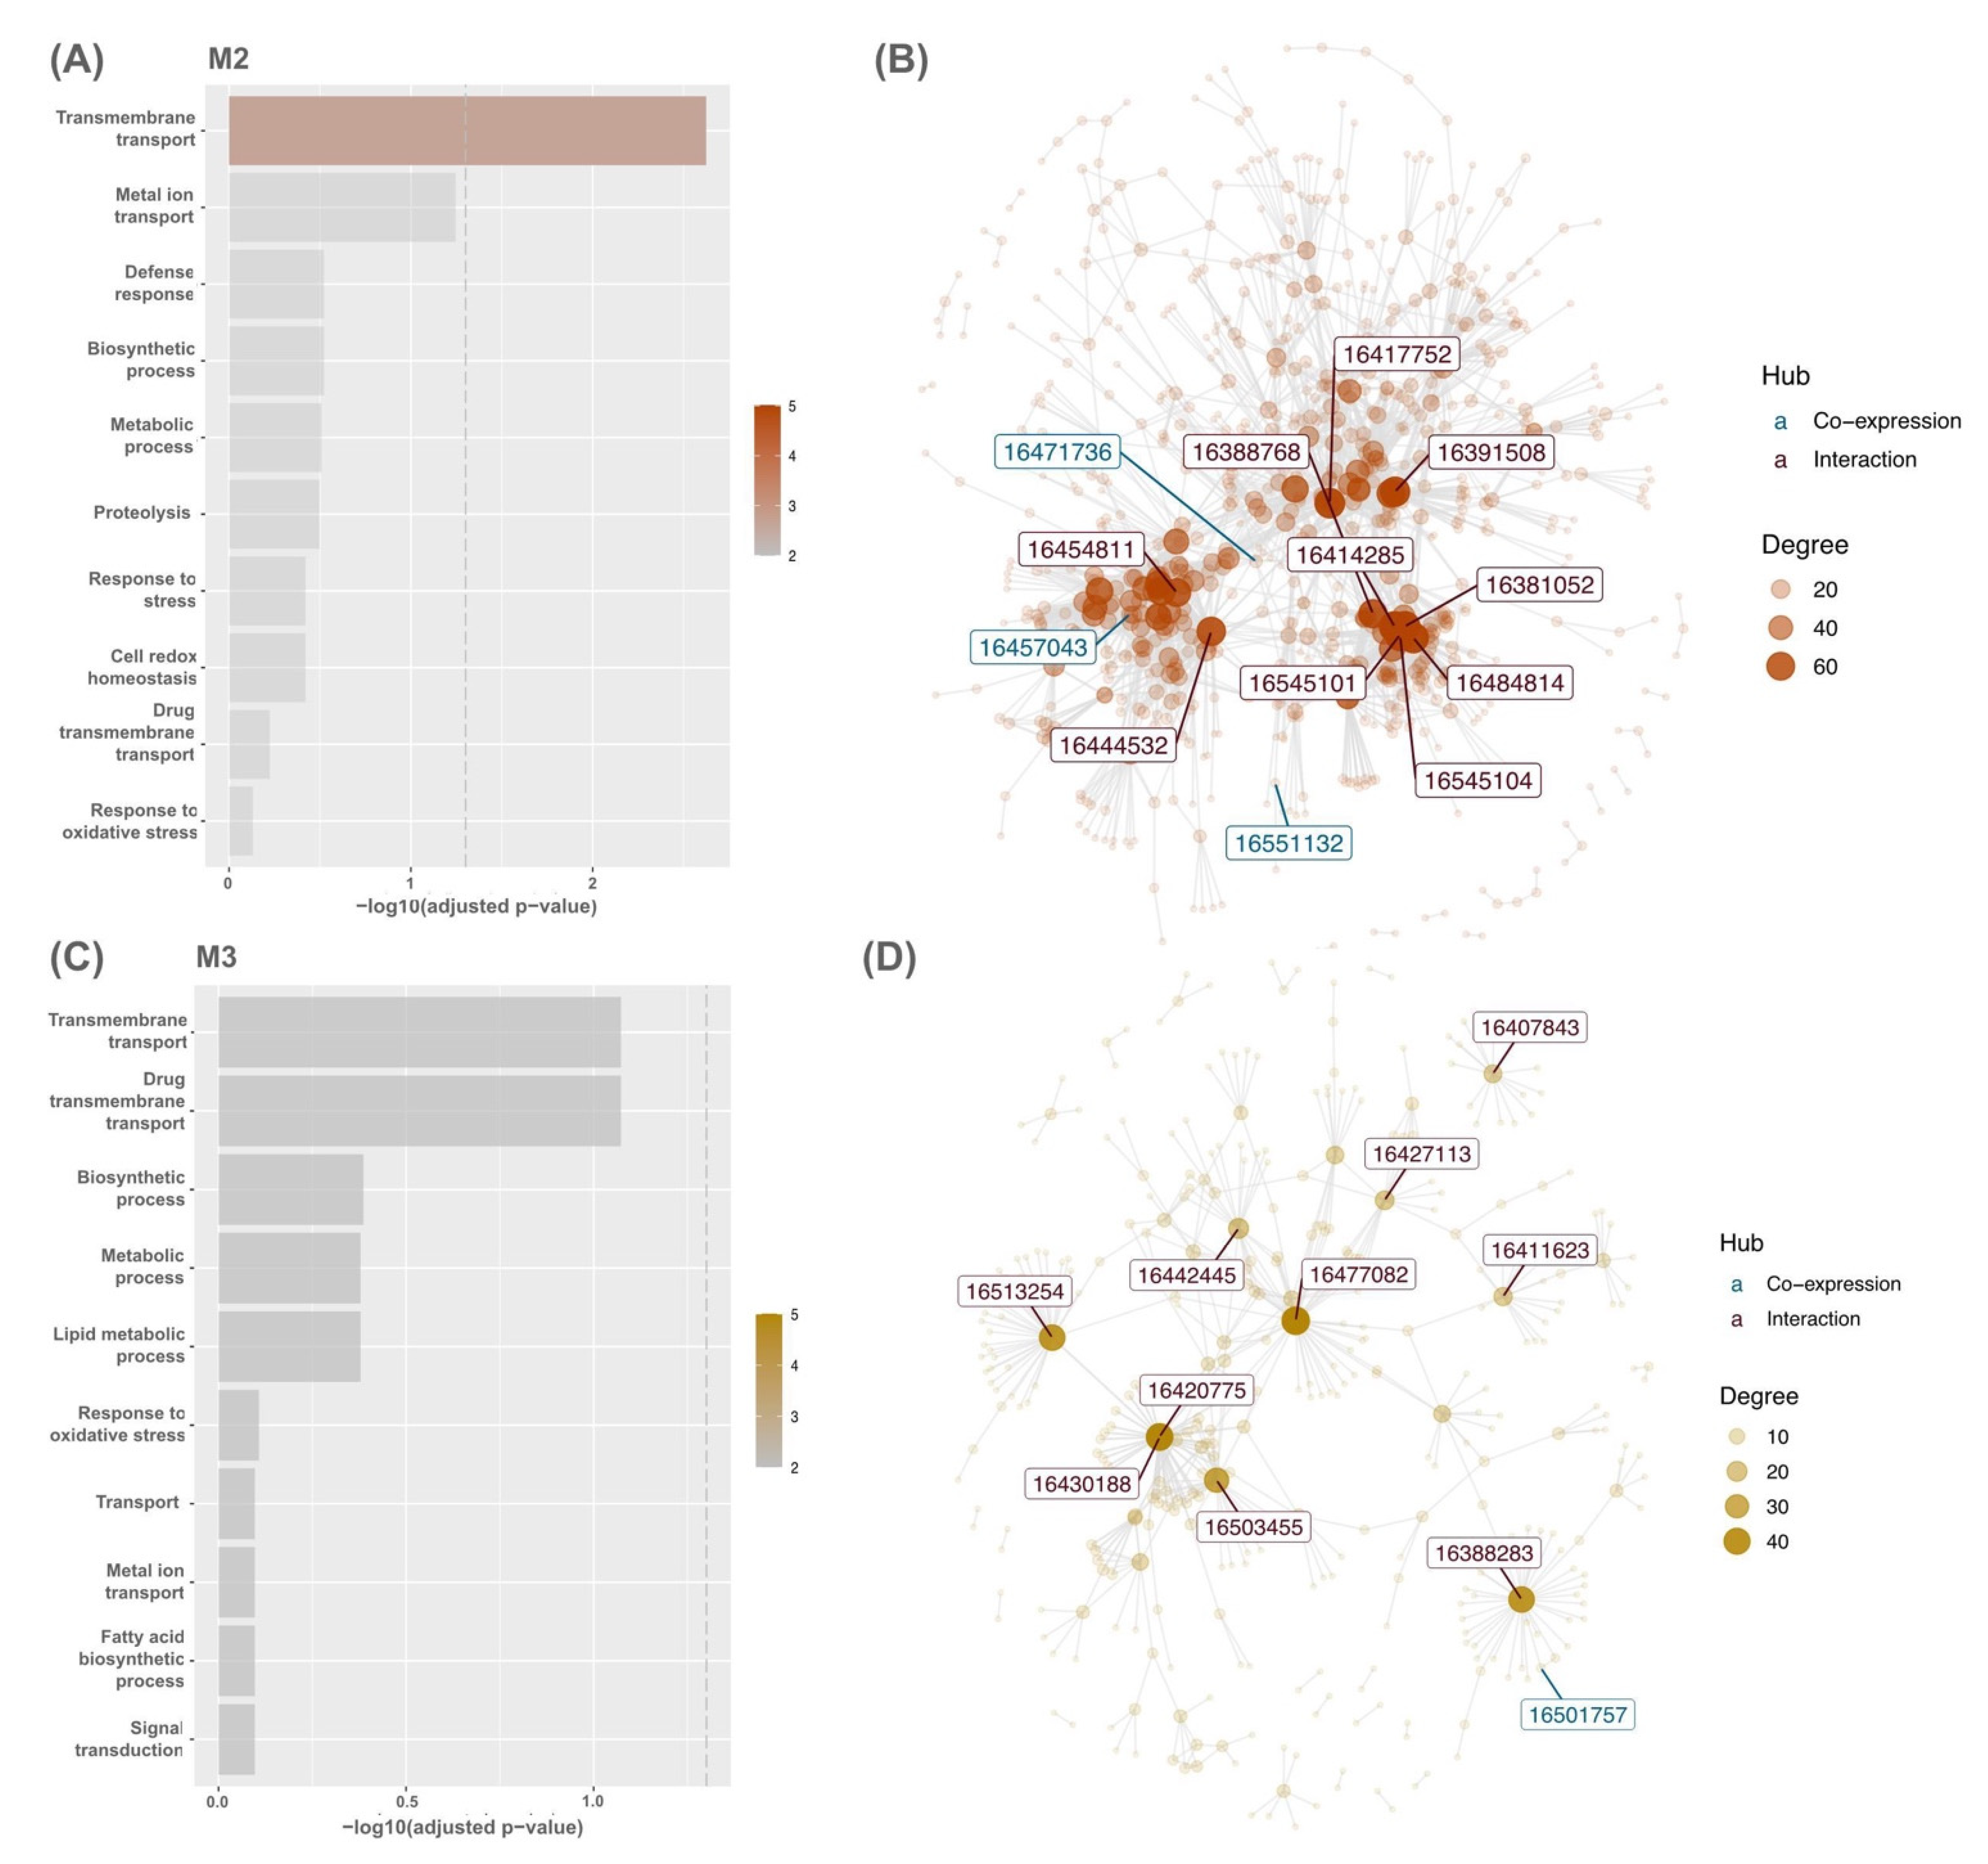
2.5. Gene Set Enrichment and Overrepresentation Analysis of Modules

The gene set analysis was performed for each module using the mean rank method implemented in the Fast Gene Set Enrichment Analysis (FSGEA) R package to identify modules of interest from constructed gene co-expression network [31]. The activity of the modules was evaluated by determining which modules were upregulated or downregulated in the samples of the wild-type MR219 and the OsAbp57 overexpressing lines. The size of the gene set was generated by default in a range between 15 and 1000. To enrich the associated function for each module, the hypergeometric distribution test (overrepresentation analysis) was performed using the clusterProfiler R package [32]. The Gene Ontology (GO) annotation of gene modules was retrieved and downloaded from Phytozome version 12.0 (https://phytozome.jgi.doe.gov/, accessed on 10 April 2021) [33]. The significance cut-off of p-value < 0.05 was used to assign overrepresented biological process (BP), molecular function (MF), and cellular component (CC) of genes within modules.

2.6. Identification and Validation of Hub Genes

The hub genes were determined by identifying genes with higher connectivity within the modules. The hub genes were ranked based on the top 10 genes within the network modules. For instance, if the module size was 200, then 20 genes with the largest number of connectivity could be considered hub genes [34]. Integration between co-expression information and protein–protein interactions (PPIs) may help discover important hubs in the module. The rice PPI dataset from the STRING database version 11.5 was retrieved by the Cytoscape plug-in, StringApp version 1.7.0 [35,36], using the list of gene modules as search queries with the default confidence cut-off of 0.4 and above. A single protein with no interaction was discarded, and only interactions with evidence of known interaction (i.e., curated databases and experimentally determined) were kept for further analysis. Module graphs for gene-encoded protein networks from the rice PPI dataset on STRING were constructed by merging PPI information to visualise gene interaction in co-expression modules and identify potential hubs.

2.7. KEGG Pathway Mapping Analysis

Each module was used to conduct pathway mapping analysis using the Kyoto Encyclopedia of Genes and Genomes (KEGG) Mapper tool version 4.3 (https://www.genome.jp/kegg/mapper.html, accessed on 1 June 2021) [37]. The KEGG Orthology identifier (KO ID) for genes was retrieved from the Phytozome v12 database using the BioMart tool [33,38]. All genes in each module were then categorised into the following KEGG pathways: (i) metabolism, (ii) genetic, (iii) environmental information processing, (iv) cellular processes, and (v) organismal systems. The interactions between hub genes were then manually connected as red arrows on the pathway maps.

3. Results

3.1. Global Gene Expression Profiling of the Abp57-OE Line

To gain insight into the transcriptional changes triggered by the OsAbp57 overexpression, a global gene expression analysis on WT and transgenic line (Abp57-OE) grown under normal conditions was performed through DNA microarrays. The microarray data analysis revealed that a total of 131 genes (90 upregulated and 41 downregulated) were differentially expressed (fold change > 2, p-value < 0.05) in transgenic lines as compared to MR219. The reliability of the microarray data was then assessed by quantitative real-time PCR on six randomly selected DEGs, and the differences were validated (Figure 1). The expression level of DEGs was largely consistent with the microarray result, implying that the data were highly reliable.
Gene Ontology (GO) enrichment analysis revealed that response to stimulus, homeostasis process, transport, oxidation-reduction, lipid metabolic process, and biosynthetic process were among the significantly altered biological processes in transgenic rice. Meanwhile, for molecular function, DEGs were enriched considerably in metal ion binding, ATP binding, ion transmembrane transporter activity, antiporter activity, peroxidase activity, electron carrier activity, and catalytic activity. For cell components, we identified that the DEGs were significantly regulated in the membrane, chloroplast, and vacuole. The result of the GO enrichment analysis is summarised in Table 1.

3.2. Modular Gene Co-Expression Analyses of the OsAbp57-OE Line

To further support the reliability of our Abp57-OE microarray data in drought stress, we performed the mGCN analysis. In total, 41,770 genes across six samples were used to construct an mGCN to determine key modules of drought-tolerant transgenic rice, OsAbp57-OE. In Figure 2A, the dendrogram demonstrates the clustering of six samples, whereby the samples were clustered based on wild-type samples (turquoise) and OsAbp57-OE samples (red). Using the default parameters, the soft-threshold value (β) of 14 was selected by a scale-free topology fit (R2) of 0.824, indicating the best threshold for a scale-free network model (Figure 2B). A total of 13 co-expressed modules containing 3596 genes (i.e., M1 to M12, including one noncorrelated module, M13) were identified using the dissimilarity threshold of 0.8 as a hierarchical clustering cut-off. Module M1 holds the highest number of co-expressed genes (2004), followed by other modules in the following order, and the smallest number of genes (41) was discovered in M11 and M12. Of these, only 11 co-expressed modules (M2 to M12) with a p-value less than 0.05 were subjected to significant module activity. All module enrichment plots discovered in co-expression analysis were shown to be upregulated in the class of OsAbp57-OE samples (OE) compared with the wild-type samples (WT), except for module M6 of Abp57-OE, which featured a general downregulation when compared with the WT sample (Figure 2C). The upregulation in Abp57-OE class and downregulation in WT class has suggested the sensitivity of transgenic rice, OsAbp57, towards drought stress.
In OE, modules M2 (OE; NES = 3.39; WT; NES = −3.46) and M3 (OE; NES = 3.58; WT; NES = −3.63) featured strong upregulation and downregulation in module activity (Figure 2C). The enrichment analysis of each module demonstrated that co-expressed genes in modules M2 and M3 were involved in GO terms transmembrane transport including metal ion transport and response to oxidative stress (Figure 3A,B). Module M2 was enriched in defence response (adjusted p = 0.30099; 11/1117 genes), cell redox homeostasis (adjusted p = 0.37956; 10/1117 genes), and proteolysis (adjusted p = 0.3183; 51/1117 genes). However, genes in module M3 were involved in the fatty acid biosynthetic process (adjusted p = 0.88612; 18/1117 genes) and signal transduction (adjusted p = 0.88612; 13/1117 genes). Overall, other modules were also strongly enriched in response to oxidative stress, such as modules M4, M5, M7, M8, M10, and M11 (Supplementary Materials Table S2).

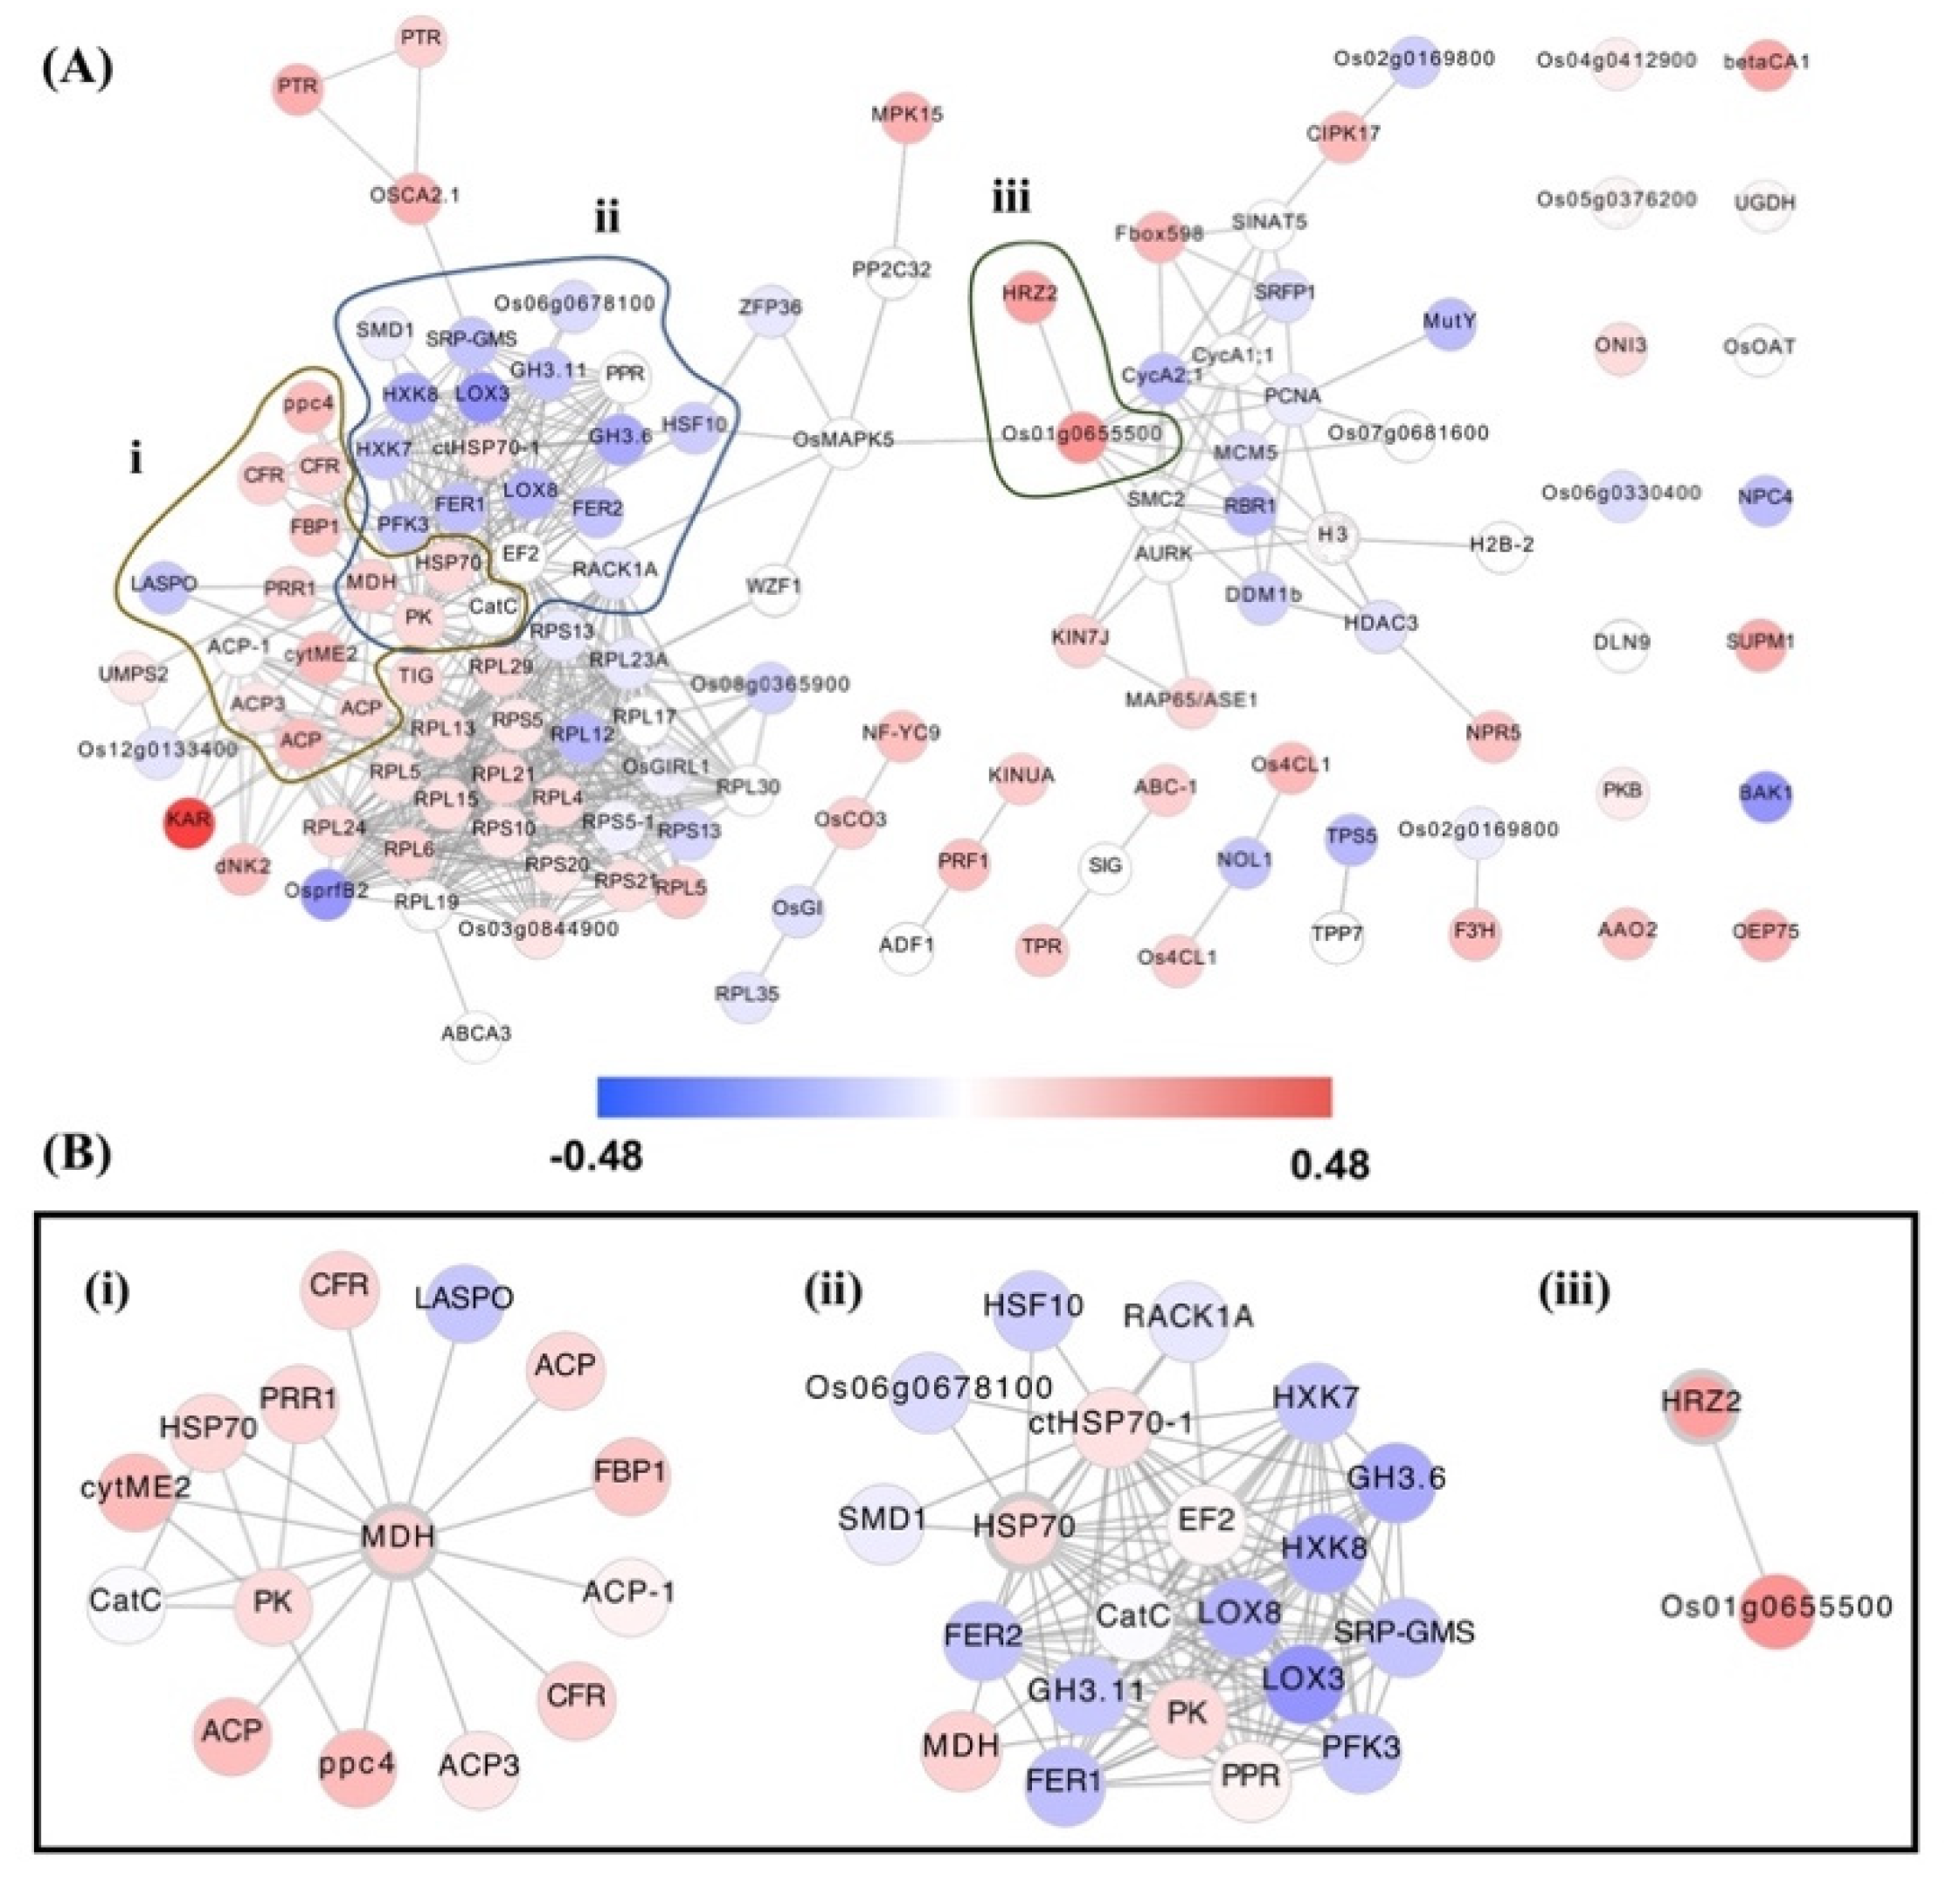
3.3. Hub Genes’ Identification in OsAbp57-OE Associated with Drought Stress

A hub gene is a high-degree gene in the module and is presumed to be a vital candidate that controls other genes in the network. The top 10 most connected genes in each module were determined using the abovementioned methods. We identified 123 hub genes in 12 modules (i.e., M1 to M12). Detailed information on the hub genes of each module is listed in Supplementary Materials File S1. The hub gene analysis discovered 15 origin hubs, which were initially found in the CEMiTool module, including UGDH and ONI3 in module M1; KINUA, TPR, and ABC-1 in M2; HRZ2 in M3; SUPM1 and BAK1 in M5; AAO2 and 4CL1 in M7; PEPC-2 and NPR5 in M10; PPR and OAT in M11; OsMutY in M12. Moreover, we found that origin hubs associated with drought stress mechanisms were upregulated in the network, particularly HRZ2 in response to Fe3+ starvation and JA-mediated signalling pathway, AAO2 in response to water distress, and OAT in various responses to abiotic stress tolerance such as to water distress, osmotic and salt stress, hormonal stimuli of ABA, JA, BR, and IAA.
Figure 3B,D demonstrate the gene network for interesting modules M2 and M3, respectively. We discovered several upregulated genes in enriched OsAbp57-OE modules M2 and M3 such as HSP70, KINUA, TPR, ABC-1, PK, Os01g0655500, PRR1, MDH, HRZ2, TIG, PTR, PRF1, and KAR (Table 2). Interestingly, the Gene Ontology annotation shows that some hub genes are significantly involved in stress-related biological processes, for instance, in response to the metal ion, Cd2+ (i.e., HSP70), Fe3+ starvation and JA-mediated signalling pathway (i.e., HRZ2), and reactive oxygen species (ROS) (i.e., MDH), including PRR1, are reported to play a role in the phosphorelay signal transduction system and the regulation of circadian rhythm, PK in glycolysis, KAR in elongation of fatty acid, and TIG and PTR in transport function of protein and oligopeptide, respectively. However, although several defence-related biological processes have been reported through the GO annotation, the potential mechanisms underlying the regulation of drought tolerance genes by OsAbp57 are not well understood. A further experiment must be conducted to determine how these hub genes may navigate the function of defence during drought conditions in rice.
To validate the hub gene, Figure 4 demonstrates the interaction network for all hub gene modules: M1 to M12. The network consisted of 125 nodes and 584 edges of which 14 were identified as single nodes. Figure 4B showed β-ketoacyl reductase (KAR), a fatty acid biosynthetic gene, which was highly upregulated in OsAbp57-OE. We found that stress-related hub genes, including HSP70, HRZ2, and MDH, significantly interacted with other upregulated hub genes (Figure 4B). For instance, HSP70 with EF2; PK, PPR, and MDH, HRZ2 with Os01g0655500; and MDH with CFR, ACP, ACP-1, ACP3, ppc4, PK, cytME2, HSP70, and PPR1. Several downregulated genes were also identified to interact with HSP70 and MDH, suggesting its potential negative regulation of drought responses in OsAbp57-OE.

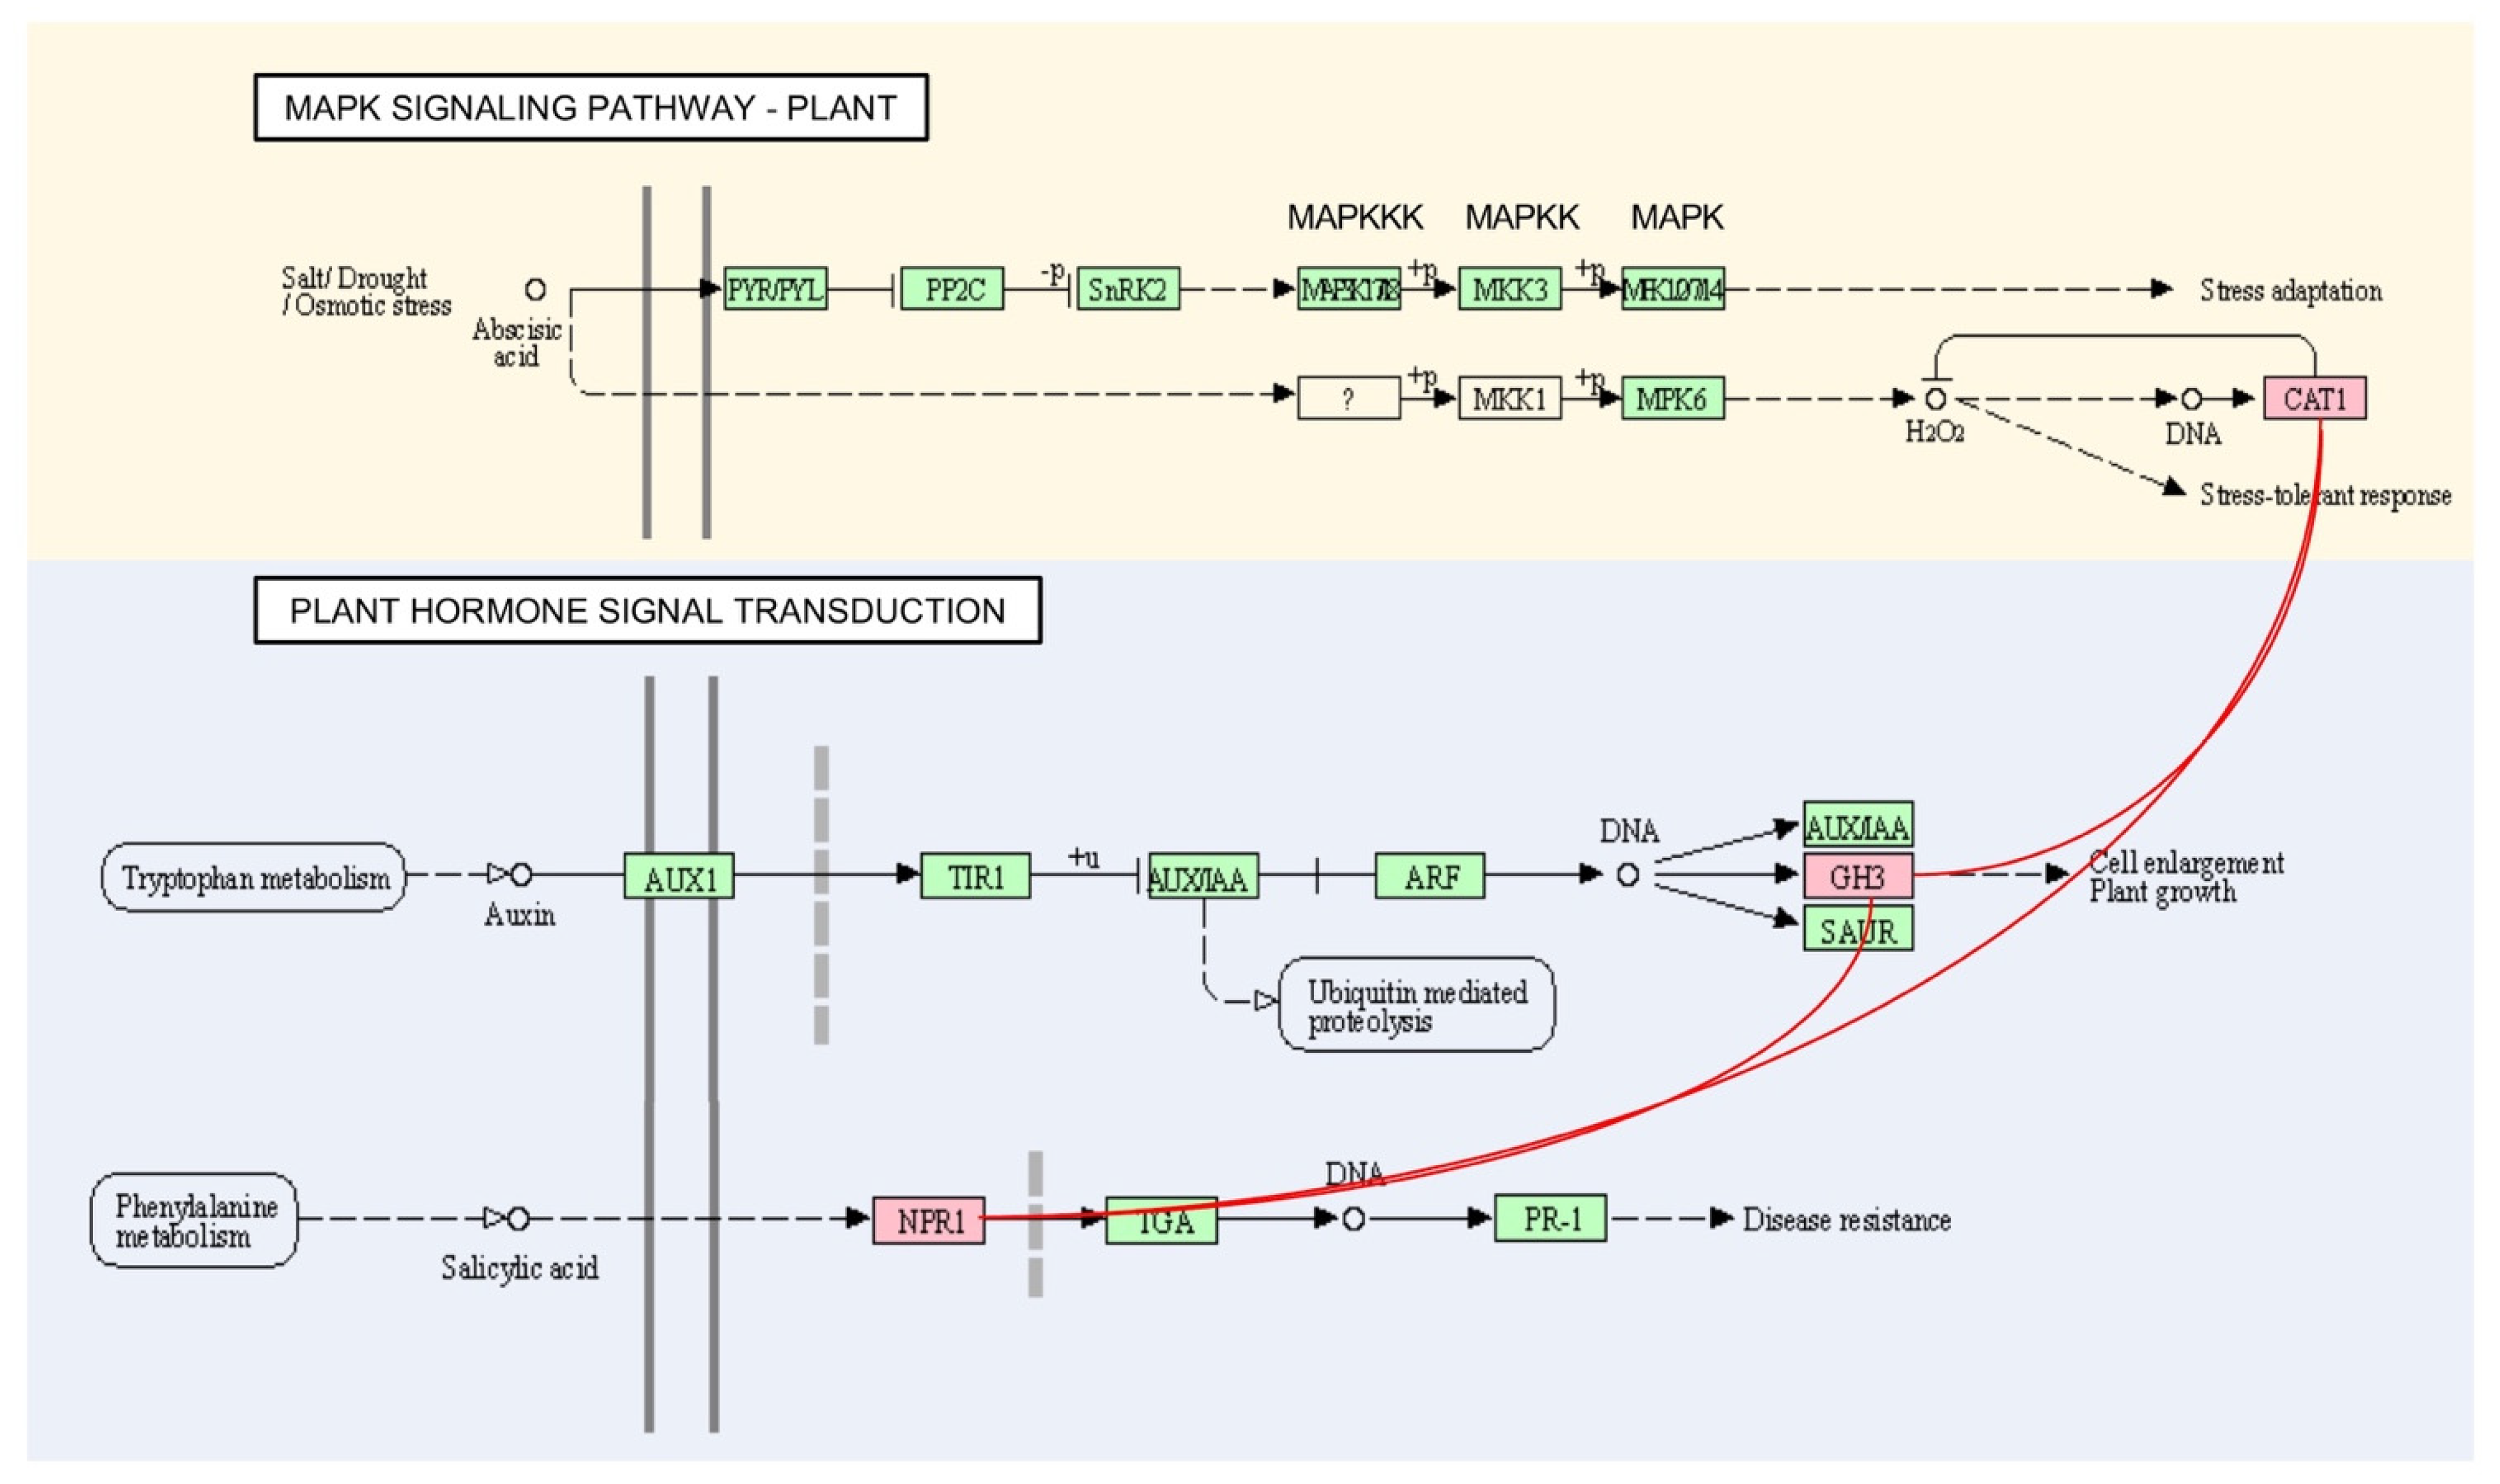
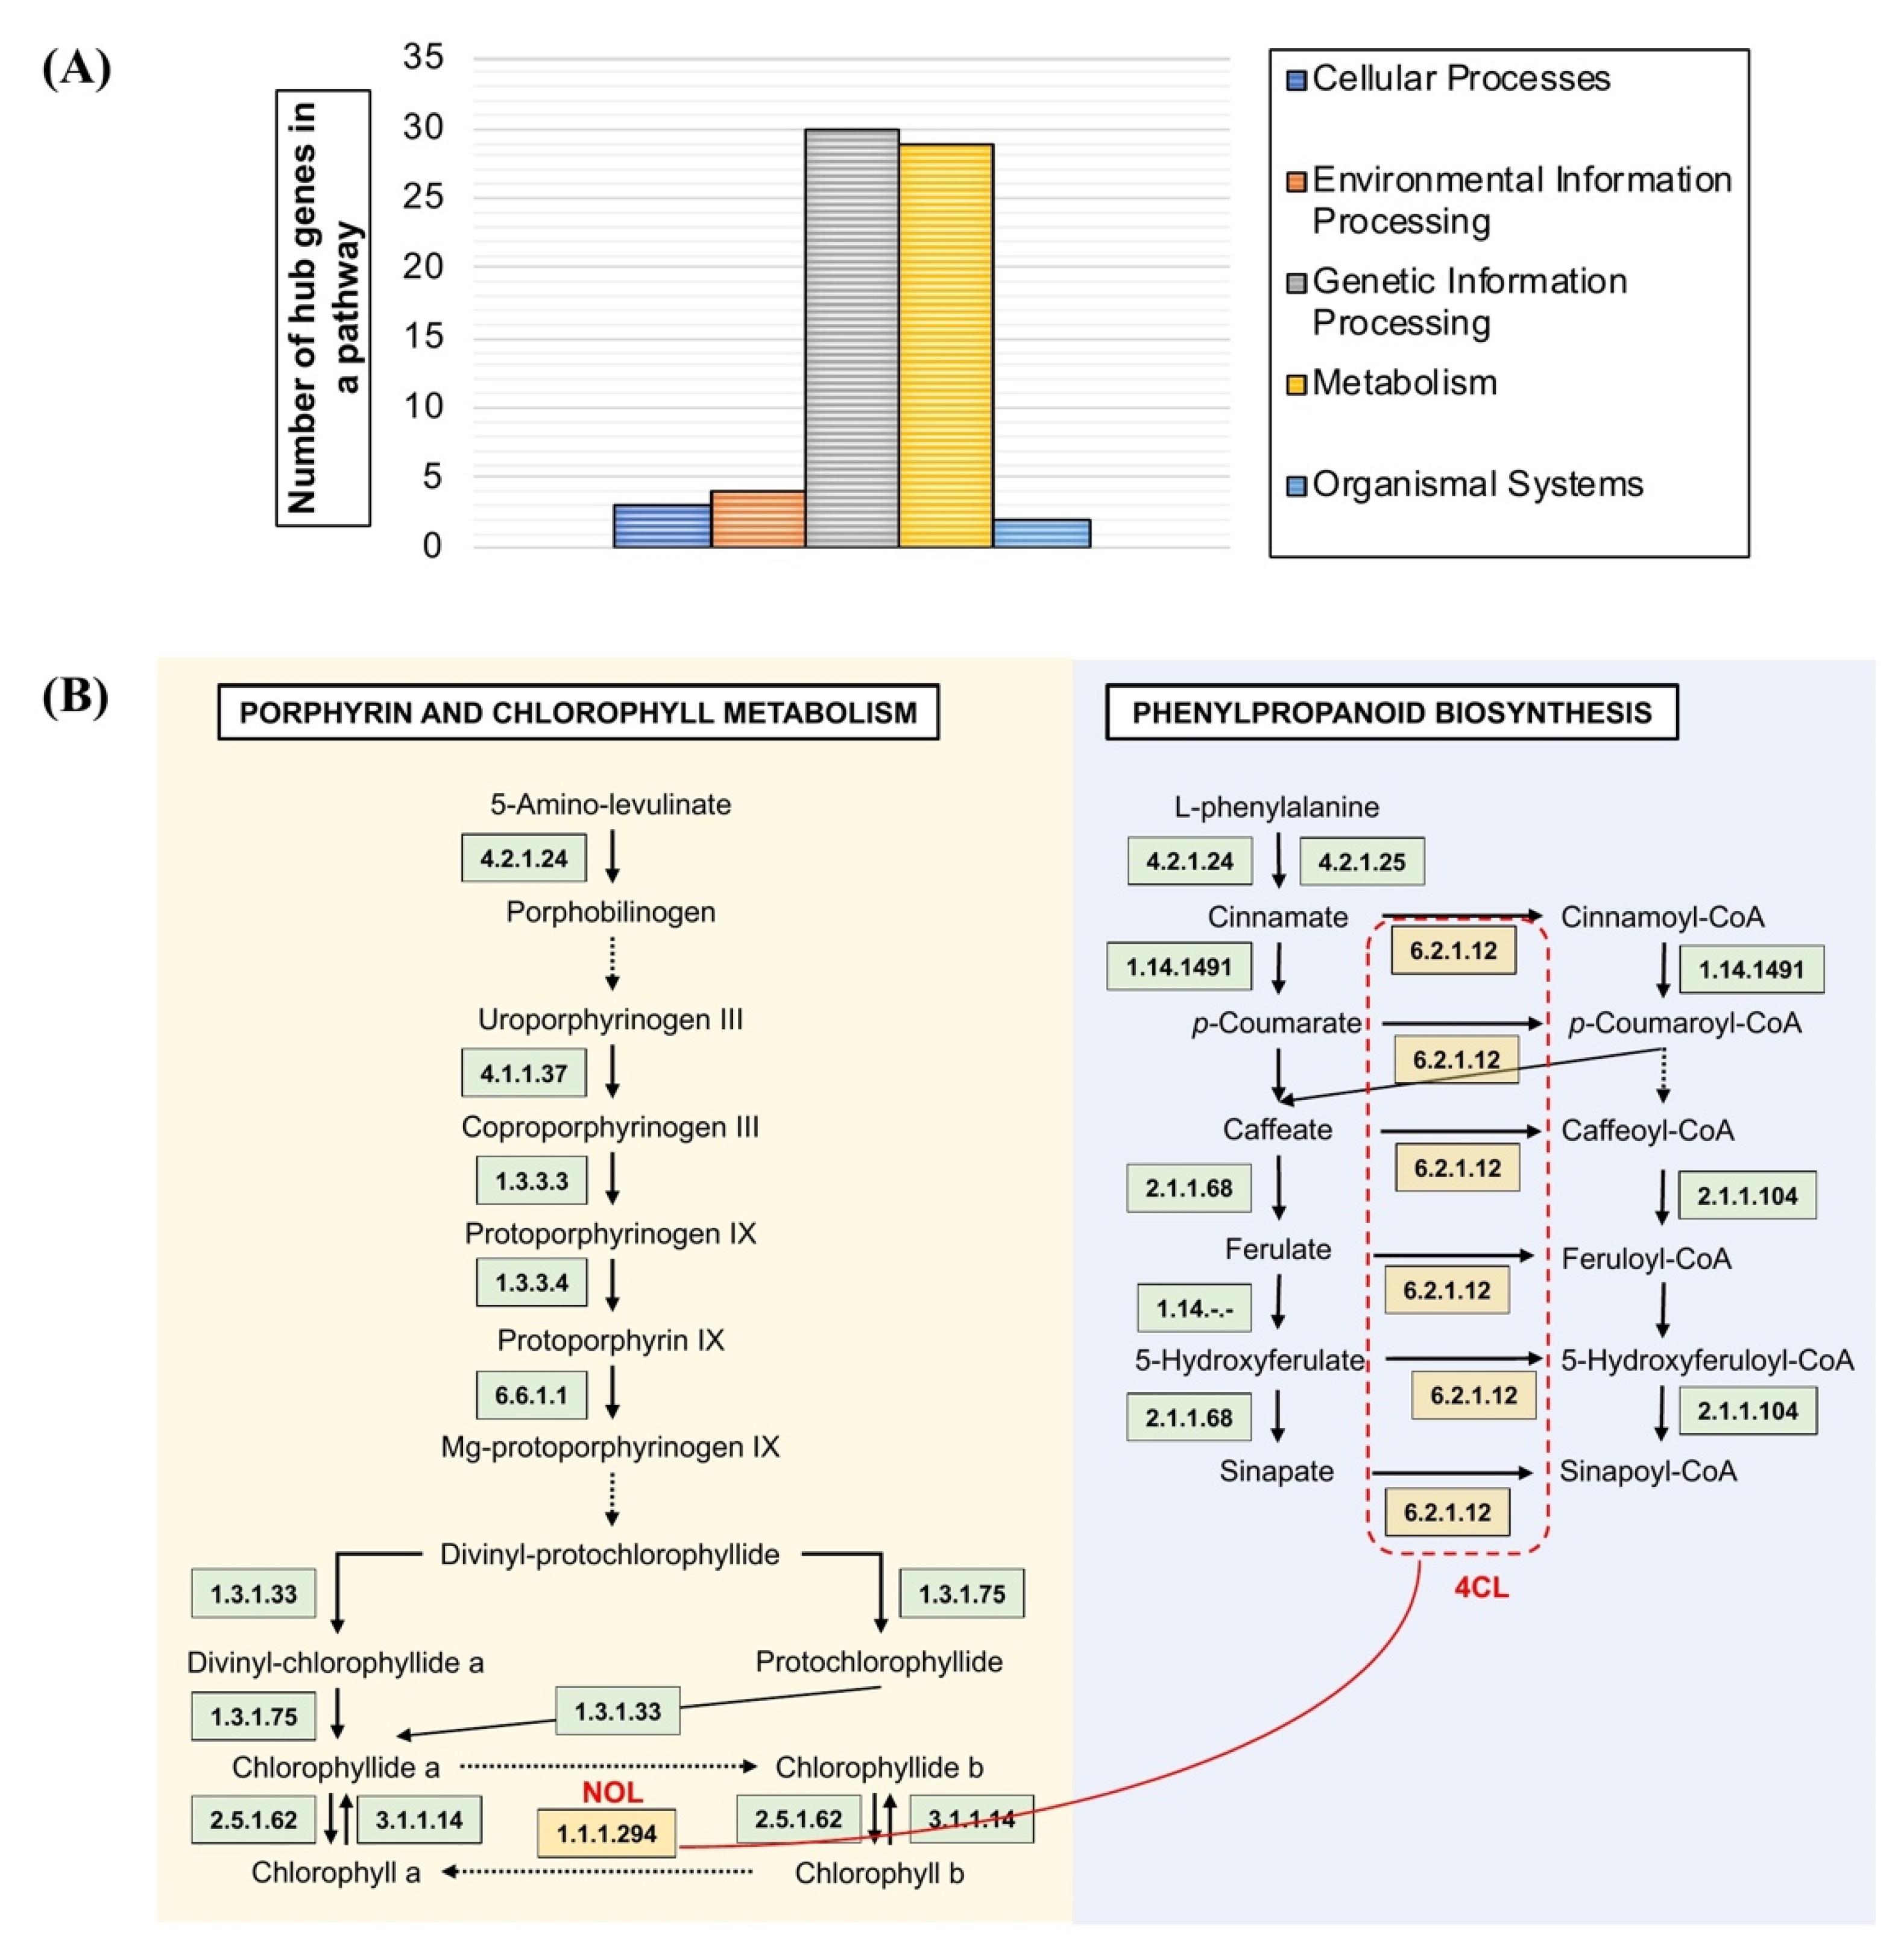
3.4. Pathway Mapping Analysis of OsAbp57-OE

The number of genes from network modules M1 to M12 was assigned according to their presence in the KEGG pathway maps. The pathway maps are categorised into metabolism, organismal systems, cellular processes, and environmental and genetic information processing. The modules M1 to M11 demonstrated active involvement in metabolism (Supplementary File S2). Genes with a putative function in cellular processes were absent in modules M5 to M7, M9, M10, and M12, including the absence of environmental information processing in M4, M5, M7 to M9, and M12, organismal systems in M7 to M12, and genetic and environmental processing in M3, M4, M8, and M10. The hub genes showed high participation in the genetic information process (30 genes) and metabolism (29 genes) including participation in the environmental information process (4 genes), cellular processes (3 genes), and organismal systems (2 genes) (Figure 5A). In addition, integration with protein–protein interaction data validated the correlation of hubs between the pathway maps. The hubs under the phenylpropanoid biosynthesis were correlated to the porphyrin and chlorophyll metabolism map in module M7 (Figure 5B).
No correlation of hubs within other modules was identified between the pathway maps. Pathway analysis of several hubs under plant hormone signal transduction showed interaction with the MAPK signalling pathway map. Two hubs of GH3 in M3 and M6, GH3.6 and GH3.11 under plant hormone signal transduction for plant growth, showed interplay to disease resistance NPR5 and stress-tolerant response CatC under the MAPK signalling pathway map (Figure 6).

4. Discussion

In the present study, we demonstrated that the overexpression of an auxin-binding protein, OsAbp57, can enhance the drought tolerance of a popular Malaysian rice cultivar, MR219. A comparative analysis of drought tolerance among two OsAbp57 overexpressing lines and MR219 revealed a much delayed drought-induced leaf senescence in OsAbp57 overexpressing lines compared to MR219. Numerous previous studies have reported that delayed drought-induced leaf senescence is one of the important traits that can enhance the tolerance of a plant toward drought stress [8,39,40]. This has been further supported by Liu et al. (2016) [41], who reported that transgenic rice with accelerated drought-induced senescence exhibited higher sensitivity to drought stress than its nontransgenic parental line.
Further examination of the physio-morphological traits also revealed that the performance of both OsAbp57 overexpressing lines was superior to MR219 in most of the traits evaluated under both watering regimes. We noticed that the root dry weight of OsAbp57 overexpressing exhibited the greatest responsiveness towards drought conditions. Compared to its counterparts grown under the normal condition, the root dry weight of OsAbp57 overexpressing lines grown under drought conditions and the root weight of both OsAbp57 overexpressing lines grown under drought conditions exhibited more than 47% of increments (OE1: 47%; OE2: 52%). Being the primary organ involved in plant water uptake and the first organ to perceive drought stress, the root traits have long been known as one of the determining factors in plant productivity under drought stress [42]. This is particularly true for the plant species employing drought avoidance mechanisms, such as rice. Previous studies on rice have also reported that the root mass and length are good predictors of rice yield under drought due to improved contact between the root and the shrinking soil water [43]. Therefore, higher responsiveness of the root weight of OsAbp57 overexpressed in response to drought stress may be one of the factors contributing to the drought resistance of transgenic rice, which allows the transgenic plant to avoid a drastic reduction of plant water potential despite a shortage of soil moisture.
Although OsAbp57 overexpressing lines exhibited a higher drought tolerance than MR219, we also observed that the overexpression of OsAbp57 led to approximately a 23–48% reduction in the leaf photosynthetic rate compared to MR219. This implies that the OsAbp57 overexpression may have a negative effect on the photosynthetic activities of rice. Suboptimal performance of transgenic rice under well-irrigated conditions has also been reported in many previous studies. One of the examples was the transgenic plant overexpressing OsPYL/RCAR5 [44], whereby the overexpression had resulted in dwarf phenotype and yield reduction. In addition, the transgenic plant overexpressing OsNAC6 produced shoot growth retardation under control conditions [45]. Therefore, employing drought-inducible promoters may avoid the adverse effects imposed by the overexpression of OsAbp57 under well-irrigated conditions.
Our transcriptome data showed that OsAbp57 regulated redox metabolism in rice. The overexpressing of OsAbp57 led to changes in redox activity and increased iron ion uptake in transgenic rice. Iron is essential for plant growth, but excess Fe2+ can generate ROS via the Fenton reaction. These results signified the involvement of ROS metabolism in plants. OsAbp57 has been proven to bind to IAA and directly activate plasma membrane H+-ATPase. These findings agree with previous studies, whereby plant growth and development activities governed by auxin are closely associated with ROS. The application of auxin to cells rapidly induced ROS generation. Although ROS caused considerable cellular damage, these molecules are also important signalling molecules for stress tolerance. The possibility of utilising a gene involved in Fe2+ homeostasis in establishing drought-tolerant rice has been demonstrated by a recent journal. According to the author, the expression of the nicotianamine biosynthetic genes (OsNAS1 and OsNAS2) was upregulated significantly in several drought-tolerant transgenic rice. Previous ChIP-seq analysis showed that OsNAS1 and OsNAS2 are the direct targets of a stress-responsive transcription factor called OsNAC6, which is necessary for drought response. The overexpression of OsNAS1 and OsNAS2 has also demonstrated the importance of the accumulation of NA for drought tolerance in rice [46].
The ROS in plants must be kept at a safe level to avoid cellular damage and death. Previous studies showed that drought stress would lead to a burst of different ROS in different cellular compartments, such as mitochondria, chloroplast, and peroxisome [47]. Increasing evidence indicates that enhanced production of ROS may play a role in plant stress signalling, which can facilitate plants to perceive stress levels in different organs. However, the unregulated production of ROS is detrimental to the cell. Therefore, an increase in ROS production must be accompanied by upregulation of the ROS scavenging system. Our microarray data shows that biosynthesis of flavonoids was upregulated in transgenic rice overexpressing OsAbp57. Flavonoid has solid antioxidative properties by reducing the production and quenching ROS, especially those derived from photosynthetic apparatus. This is done through several mechanisms, such as suppression of singlet oxygen, inhibiting enzymes that generate ROS, and chelate ions of transition metals that may catalyse ROS production.
Decreased plant height and increased branching are essential characteristics for rice crop improvement and are also part of a plant’s acclimatisation strategy to diminish stress exposure (stress-induced morphogenic responses, SIMRs). The interactive network of auxin, ROS, and antioxidants has been proposed to form a redox signalling module that links plant development and environmental cues. According to Xia et al. (2020) [48], OsWUS plays a significant function in tiller development and weak apical dominance, and the loss of OsWUS function influenced rice plant morphology. Furthermore, auxin response is significantly enhanced due to the inhibition of auxin-associated gene ASP1, a physical interactor of OsWUS that suppressed the formation of tiller buds in OsWUS loss-of-function mutant, decreased culm number 1 (dc1).
Our results showed that overexpression of OsAbp57 enhanced drought tolerance in transgenic rice. This might be due to the altered auxin homeostasis in the plant. Previous studies indicated that endogenous and exogenous auxin positively regulated ROS metabolism and antioxidant activity. Likewise, transgenic potato overexpressing AtYUC6 (member of the YUCCA family of flavin-containing monooxygenase) showed high auxin and enhanced drought-tolerant phenotype through a regulated ROS homeostasis [8]. Enhanced ROS production or ROS signalling is also associated with various abiotic stresses, such as drought, salt stress, oxidative stress, UV-radiation stress, and heavy metal stress. The disturbed ROS homeostasis during stress conditions could act as a signal to activate a stress response pathway, such as mitogen-activated protein kinase (MAPK) cascades. Moreover, our microarray analysis also showed downregulation of gibberellin biosynthesis activity. According to Zawaski and Busov (2014) [49], gibberellin (GA) catabolism and repressive signalling mediate shoot growth inhibition and physiological adaptation in response to drought. The transgenic plants with GA-deficiency or GA-insensitive displayed more excellent resistance to drought. In addition, GA-deficiency in response to Fe homeostasis could also lead to dwarfism of the shoot, where Fe-deficient causes foliar chlorosis and decreased leaf biomass. The concentrations of Fe and CHL, an indicator of Fe status, were higher in the leaves of dwarfed transgenic rice [50].
The modular co-expression network (mGCN) constructed based on our microarray data, showed strong upregulation of module activity in OsAbp57. Modules M2 and M3 refer to transmembrane transport, which significantly adjusts water scarcity by allocating various molecules through the root, stomata, and cuticle [51]. Although the transport of several metal ions, including K+, Na+, and Cl-, has been reported to be critical in counteracting drought stress [51], the role of Fe3+ transport in rice is still not well understood. In fact, the presence of Fe causes the activation of reactive oxygen species (ROS) scavenging enzymes, such as catalase and peroxidase, which are known to regulate the expression of the stress-responsive gene to confer tolerance to environmental stress [52,53]. Also, GSEA revealed promising insights into the tolerance mechanisms of OsAbp57 against drought. For instance, the activity of most of the modules, which are associated with oxidative stress, suggests an intense regulation of ROS and ROS-mediated signalling pathways during drought. Our mGCN study revealed the dynamics of genes involved in drought tolerance due to the possible increase of reactive oxygen species (ROS) levels when oxidative stress is induced during water depletion. This leads to redox homeostasis, thus activating redox-dependent signalling that could initiate the adaptive plant response. To escape such water scarcity, membrane transport will take place to transfer molecules, metal ions, and water in the context of root response to drought. However, further experiments are much needed to assess the importance of Fe3+ transport during a water shortage.
Integration of mGCN with protein–protein interaction (PPI) data revealed the putative involvement of OsAbp57 hubs in drought stress tolerance. Interestingly, the origin hub that is unlikely present in the PPI data has shown to be upregulated under drought stress. Under drought conditions, Fe micronutrients play a key role in enhancing stress tolerance as it produces assimilates [52]. HRZ2 functions to negatively regulate the response of Fe deficiency and activate JA signalling at the early stages of Fe sufficiency [54,55]. The OsAbp57 tolerance of Fe-sufficient conditions may have incurred as manifest in module M3 by origin hub HRZ2, which was reported previously to increase the expression of genes involved in Fe uptake and translocation in the HRZ-knockdown shoots and roots [56]. The other predicted origin hub, AAO2, is specifically expressed in shoot and shows drastic changes in transcript accumulation under drought and salinity stress [57].
Meanwhile, OAT, controlled by a stress-responsive transcription factor, SNAC2, confers good tolerance to drought and osmotic stress through activation of ROS-scavenging enzymes and ABA-mediated pathways [58]. The regulation of origin hubs identifies new potential genes that may have functioned to increase drought tolerance in OsAbp57. The presence of MDH and PK further explains the possible occurrence of carbohydrate synthesis and glycolysis, respectively [59,60]. In contrast, TIG, a distant FKBP family, contains a targeting region that binds to ribosomes and helps to determine the subcellular localisation of mature protein during water deficit [61]. The presence of PTR infers the oligopeptide transport events [62] and explains possibilities for nutrient uptake and transport in rice, such as nitrogen and arsenic [63,64]. In rice, PRR1, a component of the circadian clock, plays a vital role in regulating the photoperiod of flowering response. However, a recent study by Wei et al. (2021) [65] reported that PRR73 positively regulated salt tolerance by co-joint with HDAC10 to repress the transcription of Na+ transporter HKT2;1 in transgenic rice.
We noticed several important hubs physically interacting with each other based on the PPI data. From the interesting modules, we discussed the results based on the upregulated hub associated with drought stress and hub interaction between the pathway maps.
In module M2, HSP70 functions in protein folding and preventing DNA degradation or fragmentation under stressed and unstressed conditions [66,67]. We found HSP70 to be upregulated in OsAbp57, considering this gene confers drought stress tolerance by maintaining the protein structure or DNA of the plant cell. The interaction of HSP70 with MDH and PK, which are involved in carbohydrate synthesis and glycolysis, may be regarded as a crucial trait for plant-life-sustaining activities. Drought causes changes in sucrose and amino acid content, which was revealed by an increased phosphoenolpyruvate carboxylase (PEPC) expression in starch and sucrose metabolism [68]. In poplar, the PPR gene may be involved in environmental adaptation as it was confirmed to respond to cold, salinity, and JA conditions [69] and under drought in Arabidopsis [70]. In M3, the interacted genes, HRZ2 and Os01g0655500, are related in function. As HRZ2 plays a dominant role in Fe uptake and translocation, Os01g0655500, a protein kinase-containing domain gene, is regulated in response to Fe deficiency and excess [71]. Among the MDH neighbours, ACP may suggest an essential role in type II fatty acid synthesis and mitochondrial protection against drought stress [72]. In mitochondrial protection, ACP has been identified as a transmitter for nutrient status concerning mitochondria biogenesis [73]. We found ACPs, including ACP1 and ACP3, were upregulated in OsAbp57, which has previously been reported to improve salt tolerance through alterations of fatty acid composition and control the concentration of Na+/K+ [74]. In addition, by scavenging ROS at higher concentrations of Na+, another interesting hub, CFR, may enable the protection of chloroplasts from chlorophyll degradation and photodamage of photosystem II [75].
Of all interesting hubs, the flavonoid biosynthesis pathway seems to be functionally correlated to porphyrin and chlorophyll metabolism through the correlation between 4CL1 and NOL genes. The relationship between these two pathways is likely to co-exist during adverse environmental conditions that cause leaf colour to shift due to changes in pigment ratios. In a study by Shen et al. (2018) [76], the synergistic effect of flavonoid reduction and porphyrin and chlorophyll enhancement resulted in a change in the leaf colour of tea plants. Hub genes encoding proteins of the MAPK signalling pathway were also associated with plant hormone signal transduction maps. Upon water scarcity or drought conditions, the accumulation of ABA and H2O2 activates the MAPK signalling pathway, thereby promoting the catalase activity, which is responsible for maintaining the optimal level of H2O2 in plant cells [77]. Our findings found that GH3 genes (i.e., GH3.11 and GH3.6) were involved in plant growth and development via the IAA signal transduction pathway. However, a GH3 family gene, GH3-2, modulated ET-IAA crosstalk to confer drought and cold tolerance in rice [78]. The interplay of the SA signal transduction pathway with the MAPK signalling pathway and IAA signal transduction pathway inferred the possible event of combined biotic and abiotic stresses. Abiotic stress weakens plant immunity and enhances plant susceptibility to pathogenic organisms [79].

5. Conclusions

This work provided new insight into the emergence of drought tolerance in OsAbp57. We presented a solid integration study that can analyse transcriptomics data to discover potential candidates for the drought-responsive gene via modular gene correlations. Integration of our present results and the literature search portrayed the hub gene function of mGCN involved in important biological processes associated with drought stress tolerance. We demonstrated possible hub genes underpinning potential drought tolerance by increased reactive oxygen species (ROS) level at the state of water depletion, therefore causing the occurrence of metal ion transport, redox homeostasis, and activation of redox-dependent signalling that may trigger the adaptive response in rice. The hub genes also link the chlorophyll and flavonoid metabolism pathways and feature the interplay between the MAPK signalling pathway with IAA and SA signal transduction pathways. These concurrent events might have occurred in OsAbp57 due to the effect of colour changes in plant cells, stimulated by 4CL and NOL genes, and the possible occurrence of combined stresses activated by GH3, CATC, and NPR genes through the pathogenic susceptibility via weakened immunity during drought stress. The hub genes discovered in our mGCN are crucial in rice breeding strategies to enhance yield and produce drought-tolerant rice varieties. Some of the hub genes and pathways indicated in this study are established candidates associated with drought stress, confirming the functional validity of these findings. However, other poorly investigated genes could necessitate novel mechanisms in OsAbp57, worthwhile of further investigations in future research.

Supplementary Materials

The following supporting information can be downloaded at: https://www.mdpi.com/article/10.3390/agronomy12081959/s1, Table S1: Primers used in this study for qPCR validation; Table S2: List of overrepresented biological processes in modules (M1–M12) determined by hypergeometric test; File S1: Detailed information on the hub genes of each module; File S2: Detailed information on modular genes mapped on KEGG pathways.

Author Contributions

Conceptualisation, M.-R.A.-Z. and Z.Z.; methodology, M.-R.A.-Z. and Z.Z.; formal analysis, M.-R.A.-Z. and L.-W.T.; investigation, M.-R.A.-Z. and L.-W.T.; writing—original draft preparation, M.-R.A.-Z.; writing—review and editing, M.-R.A.-Z., Z.A.R., I.I. and Z.Z.; supervision, Z.Z.; funding acquisition, Z.Z. All authors have read and agreed to the published version of the manuscript.

Funding

This research was funded by Geran Universiti Penyelidikan (GUP), grant number GUP-2021-044 awarded to Z.Z. by Universiti Kebangsaan Malaysia (UKM). The PhD scholarship to L.W.T. was funded by MyBrain15 from the Ministry of Higher Education Malaysia (MoHE).

Institutional Review Board Statement

Not applicable.

Informed Consent Statement

Not applicable.

Data Availability Statement

Not applicable.

Conflicts of Interest

The authors declare no conflict of interest.

References

  1. Ray, D.K.; Mueller, N.D.; West, P.C.; Foley, J.A. Yield trends are insufficient to double global crop production by 2050. PLoS ONE 2013, 8, e66428. [Google Scholar] [CrossRef] [PubMed]
  2. Li, Y.; Zhang, W.; Ma, L.; Wu, L.; Shen, J.; Davies, W.J.; Oenema, O.; Zhang, F.; Dou, Z. An analysis of China’s grain production: Looking back and looking forward. Food Energy Secur. 2014, 3, 19–32. [Google Scholar] [CrossRef]
  3. Pandey, S.; Bhandari, H. Drought: Economic costs and research implications. In Drought Frontiers in Rice: Crop Improvement for Increased Rainfed Production; Serraj, R., Bennett, J., Hardy, B., Eds.; World Scientific: Singapore, 2007; pp. 3–17. [Google Scholar]
  4. Swain, P.; Raman, A.; Singh, S.P.; Kumar, A. Breeding drought tolerant rice for shallow rainfed ecosystem of eastern India. Field Crops Res. 2017, 209, 168–178. [Google Scholar] [CrossRef] [PubMed]
  5. Woodward, A.W.; Bartel, B. Auxin: Regulation, action, and interaction. Ann. Bot. 2005, 95, 707–735. [Google Scholar] [CrossRef] [PubMed]
  6. Song, Y.; Wang, L.; Xiong, L. Comprehensive expression profiling analysis of OsIAA gene family in developmental processes and in response to phytohormone and stress treatments. Planta 2009, 229, 577–591. [Google Scholar] [CrossRef] [PubMed]
  7. Jain, M.; Khurana, J.P. Transcript profiling reveals diverse roles of auxin-responsive genes during reproductive development and abiotic stress in rice. FEBS J. 2009, 276, 3148–3162. [Google Scholar] [CrossRef]
  8. Kim, J.I.; Baek, D.; Park, H.C.; Chun, H.J.; Oh, D.H.; Lee, M.K.; Cha, J.Y.; Kim, W.Y.; Kim, M.C.; Chung, W.S.; et al. Overexpression of Arabidopsis YUCCA6 in potato results in high-auxin developmental phenotypes and enhanced resistance to water deficit. Mol. Plant. 2013, 6, 337–349. [Google Scholar] [CrossRef]
  9. Jung, H.; Lee, D.K.; Choi, Y.D.; Kim, J.K. OsIAA6, a member of the rice Aux/IAA gene family, is involved in drought tolerance and tiller outgrowth. Plant Sci. 2015, 236, 304–312. [Google Scholar] [CrossRef]
  10. Zhang, S.W.; Li, C.H.; Cao, J.; Zhang, Y.C.; Zhang, S.Q.; Xia, Y.F.; Sun, D.Y.; Sun, Y. Altered architecture and enhanced drought tolerance in rice via the down-regulation of indole-3-acetic acid by TLD1/OsGH3.13 activation. Plant Physiol. 2009, 151, 1889–1901. [Google Scholar] [CrossRef]
  11. Zhang, Q.; Li, J.; Zhang, W.; Yan, S.; Wang, R.; Zhao, J.; Li, Y.; Qi, Z.; Sun, Z.; Zhu, Z. The putative auxin efflux carrier OsPIN3t is involved in the drought stress response and drought tolerance. Plant J. 2012, 72, 805–816. [Google Scholar] [CrossRef]
  12. Kim, Y.S.; Kim, D.; Jung, J. Isolation of a novel auxin receptor from soluble fractions of rice (Oryza sativa L.) shoots. FEBS Lett. 1998, 438, 241–244. [Google Scholar] [CrossRef]
  13. Kim, Y.S.; Min, J.K.; Kim, D.; Jung, J. A soluble auxin-binding protein, ABP57. Purification with anti-bovine serum albumin antibody and characterization of its mechanistic role in the auxin effect on plant plasma membrane H+-ATPase. J. Biol. Chem. 2001, 276, 10730–10736. [Google Scholar] [CrossRef]
  14. Kim, Y.S.; Kim, D.; Jung, J. Two isoforms of soluble auxin receptor in rice (Oryza sativa L.) plants: Binding property for auxin and interaction with plasma membrane H+-ATPase. Plant Growth Regul. 2000, 32, 143–150. [Google Scholar] [CrossRef]
  15. Kim, D.H.; Lee, K.P.; Kim, M.I.; Kwon, Y.J.; Kim, Y.S. Gene encoding auxin receptor protein derived from rice and use thereof. US Patent 12/935,483, 24 May 2012. [Google Scholar]
  16. Kamarudin, Z.S.; Shamsudin, N.A.A.; Othman, M.H.C.; Shakri, T.; Tan, L.W.; Sukiran, N.L.; Isa, N.M.; Rahman, Z.A.; Zainal, Z. Morpho-physiology and antioxidant enzyme activities of transgenic rice plant overexpressing ABP57 under reproductive stage drought condition. Agronomy 2020, 10, 1530. [Google Scholar] [CrossRef]
  17. Hansen, B.O.; Vaid, N.; Musialak-Lange, M.; Janowski, M.; Mutwil, M. Elucidating gene function and function evolution through comparison of co-expression networks of plants. Front. Plant Sci. 2014, 19, 394. [Google Scholar] [CrossRef]
  18. Usadel, B.; Obayashi, T.; Mutwil, M.; Giorgi, F.M.; Bassel, G.W.; Tanimoto, M.; Chow, A.; Steinhauser, D.; Persson, S.; Provart, N.J. Co-expression tools for plant biology: Opportunities for hypothesis generation and caveats. Plant Cell Environ. 2009, 32, 1633–1651. [Google Scholar] [CrossRef]
  19. Allocco, D.J.; Kohane, I.S.; Butte, A.J. Quantifying the relationship between co-expression, co-regulation and gene function. BMC Bioinform. 2004, 5, 18. [Google Scholar] [CrossRef]
  20. Tan, L.W.; Rahman, Z.A.; Goh, H.H.; Hwang, D.J.; Ismail, I.; Zainal, Z. Production of transgenic rice (indica cv. MR219) overexpressing Abp57 gene through Agrobacterium-mediated transformation. Sains Malays 2017, 46, 703–711. [Google Scholar] [CrossRef]
  21. Tan, L.W.; Tan, C.S.; Rahman, Z.A.; Goh, H.H.; Ismail, I.; Zainal, Z. Microarray dataset of transgenic rice overexpressing Abp57. Data Brief 2017, 14, 267–271. [Google Scholar] [CrossRef]
  22. Barrett, T.; Edgar, R. Gene expression omnibus: Microarray data storage, submission, retrieval, and analysis. Methods Enzymol. 2006, 411, 352–369. [Google Scholar]
  23. Sayers, E.W.; Beck, J.; Bolton, E.E.; Bourexis, D.; Brister, J.R.; Canese, K.; Comeau, D.C.; Funk, K.; Kim, S.; Klimke, W.; et al. Database resources of the National Center for Biotechnology Information. Nucleic Acids Res. 2021, 49, D10–D17. [Google Scholar] [CrossRef]
  24. UniProt Consortium. UniProt: The universal protein knowledgebase in 2021. Nucleic Acids Res. 2021, 49, D480–D489. [Google Scholar] [CrossRef]
  25. Kawahara, Y.; de la Bastide, M.; Hamilton, J.P.; Kanamori, H.; McCombie, W.R.; Ouyang, S.; Schwartz, D.C.; Tanaka, T.; Wu, J.; Zhou, S.; et al. Improvement of the Oryza sativa Nipponbare reference genome using next generation sequence and optical map data. Rice 2013, 6, 4. [Google Scholar] [CrossRef]
  26. Ohyanagi, H.; Tanaka, T.; Sakai, H.; Shigemoto, Y.; Yamaguchi, K.; Habara, T.; Fujii, Y.; Antonio, B.A.; Nagamura, Y.; Imanishi, T.; et al. The Rice Annotation Project Database (RAP-DB): Hub for Oryza sativa ssp. japonica genome information. Nucleic Acids Res. 2006, 34, D741–D744. [Google Scholar] [CrossRef]
  27. Zhao, W.; Wang, J.; He, X.; Huang, X.; Jiao, Y.; Dai, M.; Wei, S.; Fu, J.; Chen, Y.; Ren, X.; et al. BGI-RIS: An integrated information resource and comparative analysis workbench for rice genomics. Nucleic Acids Res. 2004, 32, D377–D382. [Google Scholar] [CrossRef]
  28. Tian, T.; Liu, Y.; Yan, H.; You, Q.; Yi, X.; Du, Z.; Xu, W.; Su, Z. agriGO v2.0: A GO analysis toolkit for the agricultural community, 2017 update. Nucleic Acids Res. 2017, 45, W122–W129. [Google Scholar] [CrossRef]
  29. Schmittgen, T.D.; Livak, K.J. Analyzing real-time PCR data by the comparative C(T) method. Nat. Protoc. 2008, 3, 1101–1108. [Google Scholar] [CrossRef]
  30. Russo, P.S.T.; Ferreira, G.R.; Cardozo, L.E.; Bürger, M.C.; Arias-Carrasco, R.; Maruyama, S.R.; Hirata, T.D.C.; Lima, D.S.; Passos, F.M.; Fukutani, K.F.; et al. CEMiTool: A Bioconductor package for performing comprehensive modular co-expression analyses. BMC Bioinform. 2018, 19, 56. [Google Scholar] [CrossRef]
  31. Korotkevich, G.; Sukhov, V.; Budin, N.; Shpak, B.; Artyomov, M.N.; Sergushichev, A. Fast gene set enrichment analysis. bioRxiv 2021. [Google Scholar] [CrossRef]
  32. Yu, G.; Wang, L.G.; Han, Y.; He, Q.Y. clusterProfiler: An R package for comparing biological themes among gene clusters. Omics 2012, 16, 284–287. [Google Scholar] [CrossRef]
  33. Goodstein, D.M.; Shu, S.; Howson, R.; Neupane, R.; Hayes, R.D.; Fazo, J.; Mitros, T.; Dirks, W.; Hellsten, U.; Putnam, N.; et al. Phytozome: A comparative platform for green plant genomics. Nucleic Acids Res. 2012, 40, D1178–D1186. [Google Scholar] [CrossRef]
  34. Lin, C.T.; Xu, T.; Xing, S.L.; Zhao, L.; Sun, R.Z.; Liu, Y.; Moore, J.P.; Deng, X. Weighted Gene Co-expression Network Analysis (WGCNA) Reveals the Hub Role of Protein Ubiquitination in the Acquisition of Desiccation Tolerance in Boea hygrometrica. Plant Cell Physiol. 2019, 60, 2707–2719. [Google Scholar] [CrossRef] [PubMed]
  35. Doncheva, N.T.; Morris, J.H.; Gorodkin, J.; Jensen, L.J. Cytoscape StringApp: Network Analysis and Visualization of Proteomics Data. J. Proteome Res. 2019, 18, 623–632. [Google Scholar] [CrossRef] [PubMed]
  36. Szklarczyk, D.; Gable, A.L.; Lyon, D.; Junge, A.; Wyder, S.; Huerta-Cepas, J.; Simonovic, M.; Doncheva, N.T.; Morris, J.H.; Bork, P.; et al. STRING v11: Protein-protein association networks with increased coverage, supporting functional discovery in genome-wide experimental datasets. Nucleic Acids Res. 2019, 47, D607–D613. [Google Scholar] [CrossRef] [PubMed]
  37. Kanehisa, M.; Sato, Y.; Kawashima, M. KEGG mapping tools for uncovering hidden features in biological data. Protein Sci. 2022, 31, 47–53. [Google Scholar] [CrossRef] [PubMed]
  38. Guberman, J.M.; Ai, J.; Arnaiz, O.; Baran, J.; Blake, A.; Baldock, R.; Chelala, C.; Croft, D.; Cros, A.; Cutts, R.J.; et al. BioMart Central Portal: An open database network for the biological community. Database 2011, 2011, bar041. [Google Scholar] [CrossRef]
  39. Jan, A.; Maruyama, K.; Todaka, D.; Kidokoro, S.; Abo, M.; Yoshimura, E.; Shinozaki, K.; Nakashima, K.; Yamaguchi-Shinozaki, K. OsTZF1, a CCCH-tandem zinc finger protein, confers delayed senescence and stress tolerance in rice by regulating stress-related genes. Plant Physiol. 2013, 161, 1202–1216. [Google Scholar] [CrossRef] [PubMed]
  40. Sakuraba, Y.; Kim, Y.S.; Han, S.H.; Lee, B.D.; Paek, N.C. The Arabidopsis Transcription Factor NAC016 Promotes Drought Stress Responses by Repressing AREB1 Transcription through a Trifurcate Feed-Forward Regulatory Loop Involving NAP. Plant Cell 2015, 27, 1771–1787. [Google Scholar] [CrossRef]
  41. Liu, J.; Shen, J.; Xu, Y.; Li, X.; Xiao, J.; Xiong, L. Ghd2, a CONSTANS-like gene, confers drought sensitivity through regulation of senescence in rice. J. Exp. Bot. 2016, 67, 5785–5798. [Google Scholar] [CrossRef]
  42. Comas, L.H.; Becker, S.R.; Cruz, V.M.; Byrne, P.F.; Dierig, D.A. Root traits contributing to plant productivity under drought. Front. Plant Sci. 2013, 4, 442. [Google Scholar] [CrossRef]
  43. Fageria, N.K.; Moreira, A. The role of mineral nutrition on root growth of crop plants. In Advances in Agronomy; Sparks, D.L., Ed.; Elsevier Inc.: Amsterdam, The Netherlands, 2011; Volume 110, pp. 251–331. [Google Scholar]
  44. Kim, H.; Lee, K.; Hwang, H.; Bhatnagar, N.; Kim, D.Y.; Yoon, I.S.; Byun, M.O.; Kim, S.T.; Jung, K.H.; Kim, B.G. Overexpression of PYL5 in rice enhances drought tolerance, inhibits growth, and modulates gene expression. J. Exp. Bot. 2014, 65, 453–464. [Google Scholar] [CrossRef]
  45. Nakashima, K.; Tran, L.S.; Van Nguyen, D.; Fujita, M.; Maruyama, K.; Todaka, D.; Ito, Y.; Hayashi, N.; Shinozaki, K.; Yamaguchi-Shinozaki, K. Functional analysis of a NAC-type transcription factor OsNAC6 involved in abiotic and biotic stress-responsive gene expression in rice. Plant J. 2007, 51, 617–630. [Google Scholar] [CrossRef]
  46. Lee, D.K.; Chung, P.J.; Jeong, J.S.; Jang, G.; Bang, S.W.; Jung, H.; Kim, Y.S.; Ha, S.H.; Choi, Y.D.; Kim, J.K. The rice OsNAC6 transcription factor orchestrates multiple molecular mechanisms involving root structural adaptions and nicotianamine biosynthesis for drought tolerance. Plant Biotechnol. J. 2017, 15, 754–764. [Google Scholar] [CrossRef]
  47. Cruz de Carvalho, M.H. Drought stress and reactive oxygen species: Production, scavenging and signaling. Plant Signal. Behav. 2008, 3, 156–165. [Google Scholar] [CrossRef]
  48. Xia, T.; Chen, H.; Dong, S.; Ma, Z.; Ren, H.; Zhu, X.; Fang, X.; Chen, F. OsWUS promotes tiller bud growth by establishing weak apical dominance in rice. Plant J. 2020, 104, 1635–1647. [Google Scholar] [CrossRef]
  49. Zawaski, C.; Busov, V.B. Roles of gibberellin catabolism and signaling in growth and physiological response to drought and short-day photoperiods in Populus trees. PLoS ONE 2014, 9, e86217. [Google Scholar] [CrossRef]
  50. Wang, B.; Wei, H.; Xue, Z.; Zhang, W.H. Gibberellins regulate iron deficiency-response by influencing iron transport and translocation in rice seedlings (Oryza sativa). Ann. Bot. 2017, 119, 945–956. [Google Scholar] [CrossRef]
  51. Nieves-Cordones, M.; García-Sánchez, F.; Pérez-Pérez, J.G.; Colmenero-Flores, J.M.; Rubio, F.; Rosales, M.A. Coping with Water Shortage: An Update on the Role of K+, Cl, and Water Membrane Transport Mechanisms on Drought Resistance. Front. Plant Sci. 2019, 10, 1619. [Google Scholar] [CrossRef]
  52. Tripathi, D.K.; Singh, S.; Gaur, S.; Singh, S.; Yadav, V.; Liu, S.; Singh, V.P.; Sharma, S.; Srivastava, P.; Prasad, S.M.; et al. Acquisition and homeostasis of iron in higher plants and their probable role in abiotic stress tolerance. Front. Environ. Sci. 2018, 5, 86. [Google Scholar] [CrossRef]
  53. You, J.; Chan, Z. ROS Regulation during Abiotic Stress Responses in Crop Plants. Front. Plant Sci. 2015, 6, 1092. [Google Scholar] [CrossRef]
  54. Kobayashi, T.; Nagasaka, S.; Senoura, T.; Itai, R.N.; Nakanishi, H.; Nishizawa, N.K. Iron-binding haemerythrin RING ubiquitin ligases regulate plant iron responses and accumulation. Nat. Commun. 2013, 4, 2792. [Google Scholar] [CrossRef]
  55. Kobayashi, T.; Itai, R.N.; Senoura, T.; Oikawa, T.; Ishimaru, Y.; Ueda, M.; Nakanishi, H.; Nishizawa, N.K. Jasmonate signaling is activated in the very early stages of iron deficiency responses in rice roots. Plant Mol. Biol. 2016, 91, 533–547. [Google Scholar] [CrossRef] [PubMed]
  56. Aung, M.S.; Kobayashi, T.; Masuda, H.; Nishizawa, N.K. Rice HRZ ubiquitin ligases are crucial for response to excess iron. Physiol. Plant 2018, 163, 282–296. [Google Scholar] [CrossRef] [PubMed]
  57. Batth, R.; Singh, K.; Kumari, S.; Mustafiz, A. Transcript Profiling Reveals the Presence of Abiotic Stress and Developmental Stage Specific Ascorbate Oxidase Genes in Plants. Front. Plant Sci. 2017, 17, 198. [Google Scholar] [CrossRef] [PubMed]
  58. You, J.; Hu, H.; Xiong, L. An ornithine δ-aminotransferase gene OsOAT confers drought and oxidative stress tolerance in rice. Plant Sci. 2012, 197, 59–69. [Google Scholar] [CrossRef] [PubMed]
  59. Kim, S.G.; Lee, J.S.; Bae, H.H.; Kim, J.T.; Son, B.Y.; Kim, S.L.; Baek, S.-B.; Shin, S.; Jeon, W.-T. Physiological and proteomic analyses of Korean F1 maize (Zea mays L.) hybrids under water-deficit stress during flowering. Appl. Biol. Chem. 2019, 62, 32. [Google Scholar] [CrossRef]
  60. Rodrigues, F.A.; de Laia, M.L.; Zingaretti, S.M. Analysis of gene expression profiles under water stress in tolerant and sensitive sugarcane plants. Plant Sci. 2009, 176, 286–302. [Google Scholar] [CrossRef]
  61. Ahn, J.C.; Kim, D.W.; You, Y.N.; Seok, M.S.; Park, J.M.; Hwang, H.; Kim, B.G.; Luan, S.; Park, H.S.; Cho, H.S. Classification of rice (Oryza sativa L. Japonica nipponbare) immunophilins (FKBPs, CYPs) and expression patterns under water stress. BMC Plant Biol. 2010, 10, 253. [Google Scholar] [CrossRef]
  62. Newstead, S. Molecular insights into proton coupled peptide transport in the PTR family of oligopeptide transporters. Biochim. Biophys. Acta 2015, 1850, 488–499. [Google Scholar] [CrossRef]
  63. Tang, Z.; Chen, Y.; Chen, F.; Ji, Y.; Zhao, F.J. OsPTR7 (OsNPF8.1), a Putative Peptide Transporter in Rice, is Involved in Dimethylarsenate Accumulation in Rice Grain. Plant Cell Physiol. 2017, 58, 904–913. [Google Scholar] [CrossRef]
  64. Yang, X.; Xia, X.; Zeng, Y.; Nong, B.; Zhang, Z.; Wu, Y.; Tian, Q.; Zeng, W.; Gao, J.; Zhou, W.; et al. Genome-wide identification of the peptide transporter family in rice and analysis of the PTR expression modulation in two near-isogenic lines with different nitrogen use efficiency. BMC Plant Biol. 2020, 20, 193. [Google Scholar] [CrossRef] [PubMed]
  65. Wei, H.; Wang, X.; He, Y.; Xu, H.; Wang, L. Clock component OsPRR73 positively regulates rice salt tolerance by modulating OsHKT2;1-mediated sodium homeostasis. EMBO J. 2021, 40, e105086. [Google Scholar] [CrossRef] [PubMed]
  66. Cho, E.K.; Choi, Y.J. A nuclear-localized HSP70 confers thermoprotective activity and drought-stress tolerance on plants. Biotechnol. Lett. 2009, 31, 597–606. [Google Scholar] [CrossRef] [PubMed]
  67. Sarkar, N.K.; Kundnani, P.; Grover, A. Functional analysis of Hsp70 superfamily proteins of rice (Oryza sativa). Cell Stress Chaperones 2013, 18, 427–437. [Google Scholar] [CrossRef]
  68. Pan, L.; Zhang, X.; Wang, J.; Ma, X.; Zhou, M.; Huang, L.; Nie, G.; Wang, P.; Yang, Z.; Li, J. Transcriptional Profiles of Drought-Related Genes in Modulating Metabolic Processes and Antioxidant Defenses in Lolium multiflorum. Front. Plant Sci. 2016, 7, 519. [Google Scholar] [CrossRef]
  69. Xing, H.; Fu, X.; Yang, C.; Tang, X.; Guo, L.; Li, C.; Xu, C.; Luo, K. Genome-wide investigation of pentatricopeptide repeat gene family in poplar and their expression analysis in response to biotic and abiotic stresses. Sci. Rep. 2018, 8, 2817. [Google Scholar] [CrossRef]
  70. Jiang, S.C.; Mei, C.; Liang, S.; Yu, Y.T.; Lu, K.; Wu, Z.; Wang, X.F.; Zhang, D.P. Crucial roles of the pentatricopeptide repeat protein SOAR1 in Arabidopsis response to drought, salt and cold stresses. Plant Mol. Biol. 2015, 88, 369–385. [Google Scholar] [CrossRef]
  71. Bashir, K.; Hanada, K.; Shimizu, M.; Seki, M.; Nakanishi, H.; Nishizawa, N.K. Transcriptomic analysis of rice in response to iron deficiency and excess. Rice 2014, 7, 18. [Google Scholar] [CrossRef]
  72. Yang, X.; Liu, X.; Zhou, Y.; Zhang, F.; Huang, L.; Wang, J.; Song, J.; Qiu, L. New insights on the function of plant acyl carrier proteins from comparative and evolutionary analysis. Genomics 2021, 113, 1155–1165. [Google Scholar] [CrossRef]
  73. Masud, A.J.; Kastaniotis, A.J.; Rahman, M.T.; Autio, K.J.; Hiltunen, J.K. Mitochondrial acyl carrier protein (ACP) at the interface of metabolic state sensing and mitochondrial function. Biochim. Biophys. Acta Mol. Cell Res. 2019, 1866, 118540. [Google Scholar] [CrossRef]
  74. Huang, J.; Xue, C.; Wang, H.; Wang, L.; Schmidt, W.; Shen, R.; Lan, P. Genes of ACYL CARRIER PROTEIN Family Show Different Expression Profiles and Overexpression of ACYL CARRIER PROTEIN 5 Modulates Fatty Acid Composition and Enhances Salt Stress Tolerance in Arabidopsis. Front. Plant Sci. 2017, 8, 987. [Google Scholar] [CrossRef]
  75. Chatterjee, J.; Patra, B.; Mukherjee, R.; Basak, P.; Mukherjee, S.; Ray, S.; Bhattacharyya, S.; Maitra, S.; GhoshDastidar, K.; Ghosh, S.; et al. Cloning, characterization and expression of a chloroplastic fructose-1, 6-bisphosphatase from Porteresia coarctata conferring salt-tolerance in transgenic tobacco. Plant Cell Tissue Organ Cult. 2013, 114, 395–409. [Google Scholar] [CrossRef]
  76. Shen, J.; Zou, Z.; Zhang, X.; Zhou, L.; Wang, Y.; Fang, W.; Zhu, X. Metabolic analyses reveal different mechanisms of leaf color change in two purple-leaf tea plant (Camellia sinensis L.) cultivars. Hortic. Res. 2018, 5, 7. [Google Scholar] [CrossRef]
  77. Ye, N.; Zhu, G.; Liu, Y.; Li, Y.; Zhang, J. ABA controls H2O2 accumulation through the induction of OsCATB in rice leaves under water stress. Plant Cell Physiol. 2011, 52, 689–698. [Google Scholar] [CrossRef]
  78. Greco, M.; Chiappetta, A.; Bruno, L.; Bitonti, M.B. In Posidonia oceanica, cadmium induces changes in DNA methylation and chromatin patterning. J. Exp. Bot. 2012, 63, 695–709. [Google Scholar] [CrossRef]
  79. Pandey, P.; Irulappan, V.; Bagavathiannan, M.V.; Senthil-Kumar, M. Impact of Combined Abiotic and Biotic Stresses on Plant Growth and Avenues for Crop Improvement by Exploiting Physio-morphological Traits. Front. Plant Sci. 2017, 8, 537. [Google Scholar] [CrossRef]
Figure 1. qPCR validations on six randomly selected DEGs. The bar plot represents the mean ± standard error for two biological replicates and three technical replicates. The difference in gene expression between the control (WT) and Abp57-OE was determined by a one-way ANOVA method with a cut-off p-value < 0.05. The error bars indicate the standard error.
Agronomy 12 01959 g001
Figure 2. CEMiTool outputs for the OsAbp57-OE line microarray dataset. (A) Clustering dendrogram of genes based on the expression profiles. The turquoise colour indicates MR219, and the red colour represents the OsAbp57-OE line. (B) Scale-free topology (R2) and mean connectivity to identify the soft-threshold power (β) between 1 and 20. The scale-freeness of the network was determined at a soft threshold of 14, above the R2 threshold of 0.8. (C) Gene set enrichment analysis for module activity of the OsAbp57-OE line (OE) and MR219 (WT). The size and colour of the modules represent the normalised enrichment score (NES). All modules were upregulated in OE except M6, with downregulation in OE and upregulation in WT.
Agronomy 12 01959 g002
Figure 3. Bar graph for the top ten GO terms enriched between genes in modules (A) M2 and (C) M3, respectively, and gene sets from the Phytozome database. The dashed line represents the -log10 adjusted p-value of 0.01. Interaction network of modules (B) M2 and (D) M3. The top ten hubs’ colours are shown based on the originality of hubs present in the CEMiTool co-expression module (blue) or rice PPI dataset (red) on the STRING database.
Agronomy 12 01959 g003
Figure 4. Interaction network for all hub genes in OsAbp57-OE: (A) modules M1–M12; (B) stress-related hub genes: (i) MDH, (ii) HSP70, and (iii) HRZ2.
Agronomy 12 01959 g004
Figure 5. Pathway mapping analysis of OsAbp57-OE. (A) Classification of hub genes in the modular network into five main pathway maps: cellular processes, environmental information processing, genetic information processing, and organismal systems; (B) interaction between M7 hubs in the porphyrin and chlorophyll metabolism pathway, and phenylpropanoid biosynthesis maps are represented with red lines.
Agronomy 12 01959 g005
Figure 6. Interaction between hub genes in MAPK signalling pathway and plant hormone signal transduction maps. Interaction is represented in red lines.
Agronomy 12 01959 g006
Table 1. Functional classification of the differentially regulated genes (DEGs) in OsAbp57-overexpressing transgenic rice. GO term enrichment analysis was performed using the AgriGO analysis tool—Single Enrichment Analysis (http://bioinfo.cau.edu.cn/agriGO/analysis.php, accessed on 15 March 2020). The GO enrichment of biological process (B), molecular function (F), and cellular component (C) was generated based on a false discovery rate (FDR) and adjusted p-value cut-off of 1.0 × 10⁻⁵.
GO TermOntologyDescriptionNumber of DEGsFDR
GO:0050896PResponse to stimulus322.20 × 10−24
GO:0051234PEstablishment of localisation306.00 × 10−21
GO:0051179PLocalisation306.00 × 10−21
GO:0006810PTransport294.60 × 10−20
GO:0009987PCellular process518.40 × 10−18
GO:0009607PResponse to biotic stimulus148.50 × 10−18
GO:0006811PIon transport173.20 × 10−16
GO:0008152PMetabolic process471.70 × 10−15
GO:0006950PResponse to stress175.80 × 10−12
GO:0042592PHomeostatic process101.00 × 10−11
GO:0051704PMulti-organism process102.30 × 10−10
GO:0003824FCatalytic activity506.30 × 10−14
GO:0022857FTransmembrane transporter activity177.60 × 10−14
GO:0005488FBinding482.60 × 10−12
GO:0015075FIon transmembrane transporter activity132.60 × 10−12
GO:0005215FTransporter activity175.00 × 10−11
GO:0022891FSubstrate-specific transmembrane transporter activity135.00 × 10−11
GO:0046872FMetal ion binding256.60 × 10−11
GO:0043167FIon binding251.20 × 10−10
GO:0043169FCation binding251.20 × 10−10
GO:0022892FSubstrate-specific transporter activity132.80 × 10−10
Table 2. Hub genes from interesting modules M2 and M3.
Probe IDGene IDGene NameDescriptionGene OntologyTrait OntologyLog2FCUp or Down
16381052Os01g0100700RPS5-140S ribosomal protein S5-1Defence response to fungus, response to H2O2, ABA, salt stress, water deprivationOxidative stress, sheath blight disease resistance, drought and salt tolerance, ABA sensitivity0.04197709Down
16388768Os01g0686800RACK1AWD repeat-containing proteinShoot and root development, seed germination, circadian rhythm, detection of redox state, defence response to fungus, ET- and SA-activated signalling pathway, SA-mediated signalling pathway, photoperiodism, response to SA, ET, salt stress, H2O2, and Cd2+ABA content, blast disease, disease resistance, ET sensitivity, photoperiod sensitivity, salt tolerance0.0606787Down
16391508Os01g0840100HSP70Heat shock protein Hsp70Response to Cd2+ and stress0.09918908Up
16454811Os02g0797400MCM5MCM family proteinCell cycle, DNA replication0.0735361Down
16444532Os02g0805200PCNAProliferating cell nuclear antigenRegulation of DNA replication, double-stranded break repair, response to gamma ray, DNA damage stimulus, UV, radiation, and H2O2UV light sensitivity0.0467894Down
16457043Os03g0152900KINUAKinesin-like protein KIN-UAMicrotubule-based movement0.13444718Up
16471736Os03g0308800TPRTetratricopeptide-like helical domain containing proteinRNA processing, regulation of translation0.1440686Up
16484814Os04g0598200RPL1260S ribosomal protein L12Translation, ribosomal large subunit assembly, defence response to bacterium, response to heat, cold, SA, JA, H2O2, and water deprivationHeat, cold & drought tolerance, JA sensitivity, bacterial blight disease resistance, oxidative stress0.1768968Down
16545101Os08g0117200RPS1340S ribosomal protein S13Translation, defence response to fungus, response to water deprivation, salt stress, ABA, H2O2Drought & salt tolerance, oxidative stress, sheath blight disease resistance, ABA sensitivity.0.93240096Down
16545104Os08g0117300RPS1340S ribosomal protein S13Translation0.0503529Down
16551132Os09g0250700ABC-1ABC-1 domain containing protein.0.1204065Up
16414285Os10g0466700RPL1760S ribosomal protein L17Translation0.0262824Down
16417752Os11g0216000PKPyruvate kinase family proteinGlycolysis0.09241819Up
16388283Os01g0655500Os01g0655500Protein kinase, core domain containing protein.Protein phosphorylation0.27208653Up
16442445Os02g0618200PRR1Two-component response regulator-like PRR1 (Pseudo-response regulator 1)Phosphorelay signal transduction system, regulation of circadian rhythm0.10612373Up
16477082Os03g0773800MDHMalate dehydrogenaseResponse to ROS, metabolic processes of malate and carbohydrate, cell redox homeostasis, TCA cycle0.11776116Up
16503455Os05g0143800GH3.6GH3 auxin-responsive promoter domain containing proteinResponse to IAA, light stimulus, salt stressSalt tolerance0.2140365Down
16501757Os05g0551000HRZ2Hemerythrin motif-containing RING- and Zn-finger protein2Response to Fe3+ starvation, JA-mediated signalling pathwayFe3+ sensitivity0.24291249Up
16513254Os06g0308000TIGTrigger factor-like proteinProtein folding and transport0.09959792Up
16411623Os10g0111700PTRPOT family protein, peptide transporterOligopeptide transport0.20793006Up
16407843Os10g0323600PRF1Profilin ACytoskeleton organisation, sequestering of actin monomers0.16372392Up
16420775Os11g0106700FER1FERRITIN 1Response to Fe3+, Zn2+, H2O2, ABA, bacterdium and cold; leaf and flower development; Fe3+ transport and homeostasis; photosynthesis0.1615892Down
16430188Os12g0106000FER2FERRITIN 2Response to Fe3+, Zn2+, Cu2+, H2O2, cold, bacterium, ABA; leaf and flower development; Fe3+ transport and homeostasis; photosynthesisTemperature response trait, Cu2+ sensitivity0.1529454Down
16427113Os12g0242700KARBeta-ketoacyl reductaseFatty acid elongation0.48300481Up
Publisher’s Note: MDPI stays neutral with regard to jurisdictional claims in published maps and institutional affiliations.

