Article

The Effect of Transplant Date and Plant Spacing on Biomass Production for Floral Hemp (Cannabis sativa L.)

1
Department of Crop and Soil Sciences, North Carolina State University, Raleigh, NC 27695, USA
2
Department of Civil and Environmental Engineering, Utah State University, Logan, UT 84322, USA
3
Plants for Human Health Institute, North Carolina State University, Kannapolis, NC 28081, USA
4
Department of Plant and Microbial Biology, North Carolina State University, Raleigh, NC 27695, USA
*
Author to whom correspondence should be addressed.
Agronomy 2022, 12(8), 1856; https://doi.org/10.3390/agronomy12081856
Submission received: 12 July 2022 / Revised: 2 August 2022 / Accepted: 3 August 2022 / Published: 5 August 2022

Abstract

:
Floral hemp cultivated for the extraction of cannabinoids is a new crop in the United States, and agronomic recommendations are scarce. The objective of this study was to understand the effects of plant spacing and transplant date on floral hemp growth and biomass production. Field trials were conducted in North Carolina in 2020 and 2021 with the floral hemp cultivar BaOx. Transplant date treatments occurred every two weeks from 11 May to 7 July (±1 d). Plant spacing treatments were 0.91, 1.22, 1.52, and 1.83 m between plants. Weekly height and width data were collected throughout the vegetative period, and dry biomass was measured at harvest. Plant width was affected by transplant date and spacing. Plant height was affected by transplant date. Earlier transplant dates resulted in taller, wider plants, while larger plant spacing resulted in wider plants. Individual plant biomass increased with earlier transplant dates and larger plant spacing. On a per-hectare basis, biomass increased with earlier transplant dates and smaller transplant spacing. An economic analysis found that returns were highest with 1.22 m spacing and decreased linearly by a rate of −163.098 USD ha−1 d−1. These findings highlight the importance of earlier transplant timing to maximize harvestable biomass.

1. Introduction

Cannabis sativa L. is a short day, predominantly dioecious, and annual crop that initiates reproductive growth when the day length becomes shorter than the critical photo period (12–16 h depending on the cultivar; [1]). The American Agricultural Improvement Act of 2018 (2018 Farm Bill) categorized Cannabis into two legally distinguishable categories depending on the plant’s concentration of total tetrahydrocannabinol (THC). Total THC is calculated as Δ9-THC + 0.877 × tetrahydrocannabinolic acid (THCA) and is reported on a dry weight basis. Cannabis is classified as marijuana (federally illegal) if it produces more than 0.3% total THC on a dry weight basis and as hemp if it produces less than 0.3% total THC on a dry weight basis (federally legal). Hemp may be cultivated for either seed, fiber, or floral material for the secondary metabolites called cannabinoids. Traditionally, hemp has been cultivated for seed and fiber in Canada, parts of Europe, and Asian countries. In recent years, interest in the potential therapeutic and medicinal properties of non-psychoactive cannabinoids such as cannabidiol (CBD), cannabichromene (CBC), and cannabigerol (CBG) has led to an increase in domestic hemp production for the plant’s floral and leaf materials which contain these compounds [2,3]
Farmers growing floral hemp for extraction purposes are compensated based on total biomass and CBD concentrations. Thus, to maximize profitability, farmers can either produce the highest CBD concentration floral material and/or increase the amount of biomass produced on a per hectare basis. Cannabinoid concentrations are predominantly determined and limited by genetics and the time of harvest [4,5,6]. Additionally, post-anthesis total THC concentrations in floral hemp exceed the 0.3% threshold before the peak CBD concentration is attained [7]. Furthermore, Zirpel et al. [8] demonstrated that CBDA synthase is a promiscuous enzyme and produces approximately a 26:1 CBD:THC ratio. Taken together, farmers cannot increase profits based purely on maximum CBD production, as it comes with a non-compliant concentration of THC. Therefore, farmers should seek to implement cultural practices that maximize biomass production to increase profitability.
As a day-length-sensitive crop, earlier transplant dates may result in a prolonged vegetative growing period, allowing for increased biomass production. Research has shown that earlier planting dates result in taller plants for hemp cultivated for fiber production [9]. There is a scarcity of research on the effect of planting date on floral hemp; however, the effect of planting for other photoperiod-sensitive short-day crops such as rice (Oryza sativa L.) has been extensively studied. A study examining the effect of planting date on the agro-morphological traits of rice by Satapathy et al. [10] identified a decrease in grain yield, plant height, tiller production, and dry matter production (biomass) as the planting date was delayed.
Planting density may also improve total biomass production on a per hectare basis. Studies on hemp cultivated for fiber have demonstrated how variations in planting density influence fiber hemp’s morphology, growth rate, and stem yield. Higher planting densities with fiber hemp result in faster initial growth rates and an increased stem yield [11,12]. However, production systems for floral and fiber hemp are vastly different. Floral hemp is usually grown similarly to high-value vegetable crops at much lower densities (3589–7173 plant/ha) than fiber hemp (~2,000,000 seed/ha). Few scientific studies assessing the effect of planting density on floral hemp biomass production have been conducted. Da Silva Benevenute et al. [13] observed flower yield decreasing on a per plant basis with increasing planting density, but yield on a per-hectare base gradually increased. However, in this study, plants were transplanted relatively late in the growing season, and only flower yield was quantified, not the total marketable biomass (leaves and floral material).
There is a current knowledge gap for growers regarding the ideal agronomic production practices for floral hemp cultivated for cannabinoids. The objectives of this study were to develop farmer recommendations for plant spacing and transplant timing to maximize field-grown floral hemp biomass production in North Carolina.

2. Materials and Methods

2.1. Experimental Design

Field experiments were conducted during the 2020 and 2021 growing seasons. The trial locations in 2020 were in Kinston, NC at the Cunningham Research Station on a Norfolk loamy sand (fine-loam, kaolinitic, thermic-type Kandiudults) and in Salisbury, NC at the Piedmont Research Station on a clay loam (fine, kaolinitic, thermic-type Rhodic Kanhapludults). A third location was added in 2021 in Jackson Springs, NC at the Sandhills Research Station on a loamy sand (loamy, kaolinitic, thermic-type Arenic Kanhapludults), resulting in five unique year × location environments. Asexually propagated clones of the CBD hemp cultivar BaOx (Triangle Hemp, Durham, NC, USA) were used at all field locations for both growing seasons.
Fields were prepared with pre-bedding primary and secondary tillage according to the research station’s practices. Before bedding, and depending on soil test reports, all fields received a broadcast application of urea, diammonium phosphate, and potash (Weaver 17-17-17; Winston Weaver Co, Winston-Salem, NC, USA) (Utrasol MOP 0-0-60; Sociedad Quimica y Minera, Santiago, Chile) at a rate of up to 67 Kg N ha−1, 67 Kg P ha−1, and 134.5 Kg K ha−1. Simple on/off drip tape connector valves were placed at each connection point between the layflat and each section of drip tape so the plots could be independently irrigated or fertigated.
The Kinston and Salisbury locations utilized white 1.25 mm polyethylene plastic mulch on raised beds with a 1.5 m center-to-center row spacing with drip tape (Netafim Streamline 10 mil with 30.48 cm emitter spacing 0.908 LPH) laid underneath. Fertigation events supplying nitrogen and boron occurred every two weeks with calcium nitrate (Yaraliva Calcinit 15.5-0-0; Yara International, Oslo, Norway) and disodium boron (Borate 21%B; Borates Plus Inc., Apopka, FL, USA) until floral initiation. The season total fertilizer application was 134.5 Kg N ha−1, 67 Kg P ha−1, 134.5 Kg K ha−1, and 1.12 Kg B ha−1.
The Jackson Springs location utilized raised beds on bare ground with a row spacing of 1.5 m and was irrigated by an overhead linear track irrigation system at the discretion of the research station’s superintendent. Granular fertilizer was applied with three applications, a pre-plant application at 14 days after transplanting (DAT) and at 28 DAT by a side dressing application. The fertilizer was a custom blend containing urea, ammonium sulfate, mono-ammonium phosphate, muriate of potash, and calcium carbonate (17-17-17; FCI Fertilizer Division, Parkton, NC, USA). The season total fertilizer application was 133.8 Kg N ha−1.
After bedding and seven days before transplanting, a herbicide application of Paraquat (Gramoxone SL 3.0; Syngenta, Basel, Switzerland) at 1.55 kg active ingredient (ai) ha−1, Napropamide (Devrinol 2 XT; United Phosphorus, Inc., King of Prussia, PA, USA) at 1.68 kg ai ha−1, and Pendimethalin (Prowl H2O; BASF, Ludwigshafen, Germany) at 0.53 kg ai/ha−1 was applied to the bare ground. Transplants were hand planted at the appropriate spacing for all locations.

2.2. Experimental Design

Trials were arranged in a split-plot randomized complete block design with the transplant date as the main-plot and the plant spacing as the sub-plot. Each location contained four blocks. The study evaluated five transplant dates and four plant spacing treatments (n = 20 unique transplant date × plant spacing treatment combinations). The transplant dates were the same for 2020 and 2021: 11 May, 25 May, 8 June, 22 June, and 7 July (±1 d). 11 May was selected as the first planting date, as it represented the earliest time that nurseries would provide cuttings to farmers in the state. The four plant spacing treatments were 0.91, 1.22, 1.52, and 1.83 m between plants. The transplant date treatments were randomized to each block, and spacing treatments were randomized to plots within the unique block × transplant date main plot. The spacing treatment plots contained ten plants with a buffer space of 1.52 m between plots. The plant densities were 7176, 5382, 4306, and 3588 plants ha−1 for the 0.91, 1.22, 1.52, and 1.83 m between plant spacing, respectively.

2.3. Data and Sample Collection

Height and width data were collected weekly starting two weeks after transplant on five representative plants. To avoid any potential border effect, measurements were taken from plants within the plot, starting from the third plant in. Plant height was measured from the base of the plant to the tip of the apical meristem. Plant width was measured from the widest part of the plant, followed by a second width measurement perpendicular to the first. These two were averaged to provide an average plant width. The height and width data collection ceased once vegetative growth stopped and the plants shifted to the reproductive phase, which occurred during the third week in August (approximately 13.5 h of day length). Floral initiation was determined based on the onset of pre-terminal and terminal pistil development and internode shortening, as described by Carlson et al. [14]. A final set of height and width data was collected on two representative plants per plot 6 weeks after floral initiation, which was the standard harvest timing used by hemp farmers in the region.
At harvest, the plants were cut at the base of the stalk, approximately 5 cm above the soil line. The plants were placed in forced air tobacco curing barns at 48.8 °C for 5 days. Once dry, the floral and leaf material was stripped from the stalk by hand, and the resulting biomass was recorded. These biomass data were used to calculate individual plant biomass production and biomass production on a per hectare basis.

2.4. Statistical Analysis

Data were plotted and inspected for any outliers and to determine treatment response trends. The nlme and nlraa packages in R were utilized for all analyses [15,16,17]. The plant height and width data showed a distinct sigmoid trend, common for plant growth data [18]. Multiple sigmoid functions were fit to the data and compared using their respective corrected Akaike Information Criteria (AICc) and Bayesian Information Criteria (BIC). The model with the lowest AICc and BIC was selected. The best-fitting model for the height and width data was the four-parameter logistic model (Table 1), expressed as:
Y = A +   ( B A ) 1 + exp ( c x   m )
where A is the lower asymptote, B is the upper asymptote, C is the value of X at the inflection point, and M is a numeric scale parameter which describes the overall width of the fit curve [19].
For modeling plant height and width data, transplant date, plant spacing, and their interaction were treated as discrete fixed effects for all four model parameters. Year, location within year, block, and block × transplant date were treated as random effects. To account for the non-independent nature of the plant height data, the within-subject variance was modeled using a diagonal positive-definite variance-covariance matrix [19]. Tukey’s honestly significant difference test was employed for all fixed effects found to be significant (p < 0.05), using the emmeans package [20].
The plotted biomass data showed a linear response to transplant date. Similar to the plant height and width data, transplant date, plant spacing, and their interaction were treated as fixed effects. However, we treated transplant date as a continuous variable by transforming each date to its respective Julian date. Higher order polynomial regression models were fit to the data. The final model selection was based on the significant highest degree term as well as a lack-of-fit (LOF) test, resulting in the most parsimonious model fit for the data. This model was used to calculate economic returns. Hemp budgets [21] for a CBD plasticulture model were used to calculate variable and fixed costs on a per hectare basis. A price of USD 0.68% CBD−1 kg−1 was used, as this represents the price of floral hemp biomass at the time of reporting [22]. A harvest index of 95% was used to account for potential yield loss during the harvesting and processing of the crop. Specific changes made to the budget were an increase in the price of nitrogen fertilizer from USD 0.40 to USD 1.00 per unit and the removal of application and licensing fees. North Carolina hemp farmers do not have to pay for hemp licenses through the USDA but must pay for THC compliance testing (approximately USD 250 per field). Finally, transplant costs were calculated for each of the planting densities, using a price of USD 1 per cutting, resulting in prices of 7176, 5382, 4306, and 3588 USD ha−1. Cannabinoids were not analyzed in this study, so a value of 7.5% CBD, as provided in the enterprise budget, was used. This value represents the upper end of CBD production for a compliant crop given the enzymatic promiscuity of CBDA synthase and the resultant 26:1 ratio of CBD:THC [8]. Taken together, the total variable costs were USD 5195.92 ha−1 (excluding costs for cuttings), and the fixed costs were USD 176 ha−1.

3. Results and Discussion

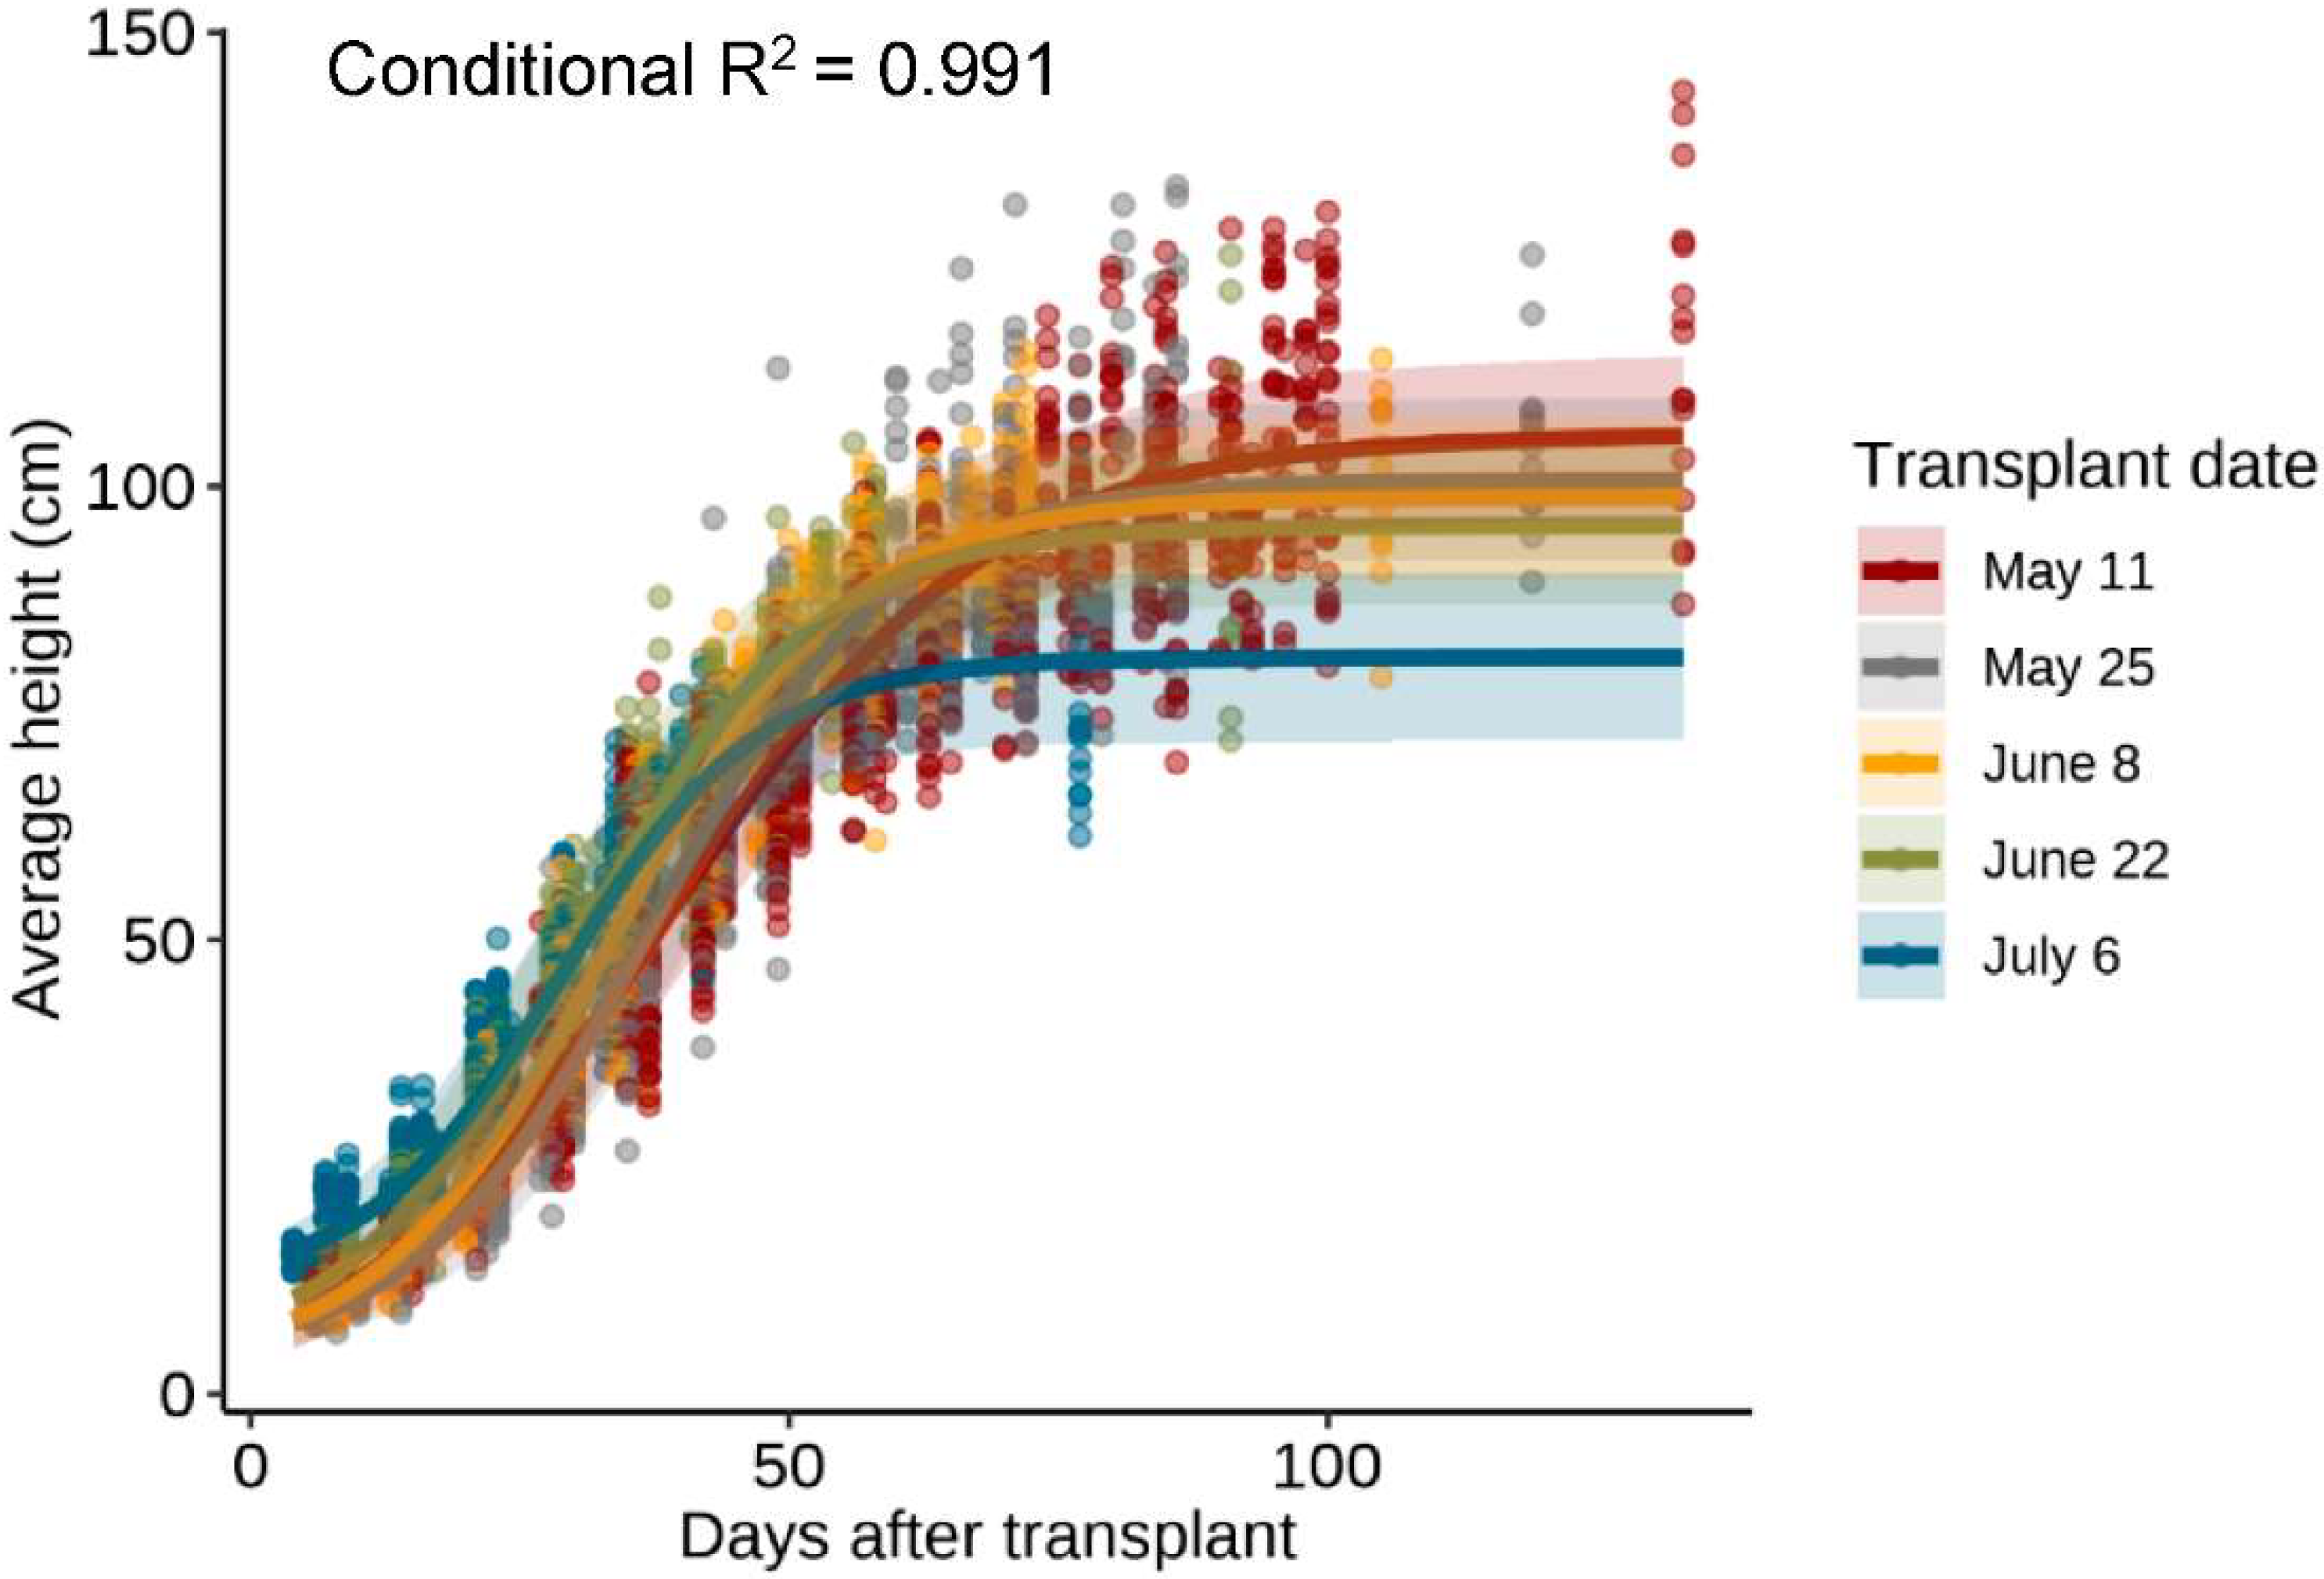
3.1. Transplant Date Affecting Plant Height

We did not observe a significant interaction between transplant date and plant spacing nor a main effect of plant spacing on plant height (p > 0.05). However, all four parameters of the four-parameter logistic model (FPLM) describing plant height over time were affected by transplant date (p < 0.0001; Figure 1, Table 2). The parameter estimate B, describing the upper asymptote or maximum height achieved during the growing season, was highest in the 11 May transplant date. The final plant height decreased as the transplant date was delayed. The final height of plants transplanted on 25 May was similar to the 8 June transplant date. Similarly, the 8 June final plant height was not different from the 22 June transplant date, with the July 6 transplant date resulting in the shortest final plant height (Figure 1, Table 2).
The effect of transplant date on C followed a similar trend to B (Table 2). The values were highest in the early transplant dates and decreased as the transplant date was delayed. The observed trend indicates that earlier transplant dates require more time to attain their maximum growth rate (M) in comparison to later transplant dates. The 11 May transplant date required the longest amount of time (38.23 d) to reach its maximum growth rate, while the latest transplant date (6 July) needed the least amount of time (28.95 d). The 11 May and 25 May transplant dates were statistically similar, while the 8 June transplant date required significantly less time. The 22 June and 6 July transplant dates were statistically comparable but required significantly less time than the 8 June, 25 May, and 11 May transplant dates to reach their maximum growth rate.
The M parameter followed a similar trend as that observed in the effect of transplant date on parameters B and C. The 11 May transplant date had the largest growth rate, while the 6 July transplant date had the smallest growth rate. The 25 May, 8 June, and 22 June transplant dates were statistically equivalent.
Unlike the three prior parameter estimates, the estimates for parameter A tended to increase with later transplant dates (Table 2). The 11 May transplant date had the lowest value (−1.87), and the 6 July transplant date had the highest value (11.48). The middle three transplant dates were all statistically similar. Height measurements began two weeks after transplanting. Since the lower asymptote occurs before the two-week mark, the model must extrapolate beyond the collected data to determine the height. We did not measure transplant height upon receiving the clones and thus cannot determine whether the differences in the estimates of A are due to differences from the clone producer or to the effects of the transplant date.
Hemp is a short-day crop; when day length shortens past a certain threshold (12–16 h depending on the cultivar), the plant transitions from vegetative to reproductive growth [1]. Later transplant date treatments exhibited a decrease in final plant height (Figure 1, Table 2), which is most likely due to these treatments receiving a truncated vegetative growth period before the day lengths reached the reproductive threshold. The shortened growing period that later transplant date treatments experienced impacted the length of the vegetative growing phase and the plants’ maximum growth rate. The earlier transplant dates had a longer growing season where they were exposed to a greater number of long days, which resulted in more vegetative growth and taller plants (parameter B; Table 2). Taller plants may exhibit an increased number of internodes and leaves, which could increase floral biomass production. Our observed response to transplant date agrees with Darby et al. [23], who conducted a one-year planting date and planting density trial in Vermont, where they observed taller plants with earlier planting dates.
Earlier transplant dates required more time (C) to reach the maximum growth rate (m; Table 2). This may be due to a combination of two factors. First, the relatively short days experienced by the 11 May and 25 May transplant dates early in the season could have resulted in slower initial growth rates compared to those experienced by later transplant dates. Second, the limited number of long days experienced by the later transplant date treatments resulted in truncated vegetative growth, thus reducing the time necessary to reach rate of growth.
Previous studies examining the effect of planting date on the growth and development of fiber hemp found similar trends with the growth parameters B, C, and M. Sengloung et al. [9] described the effect of a reduced maximum stem height, a shorter time until the maximum growth rate (inflection point), and a reduced maximum growth rate (slope at inflection point) for later sowing dates.

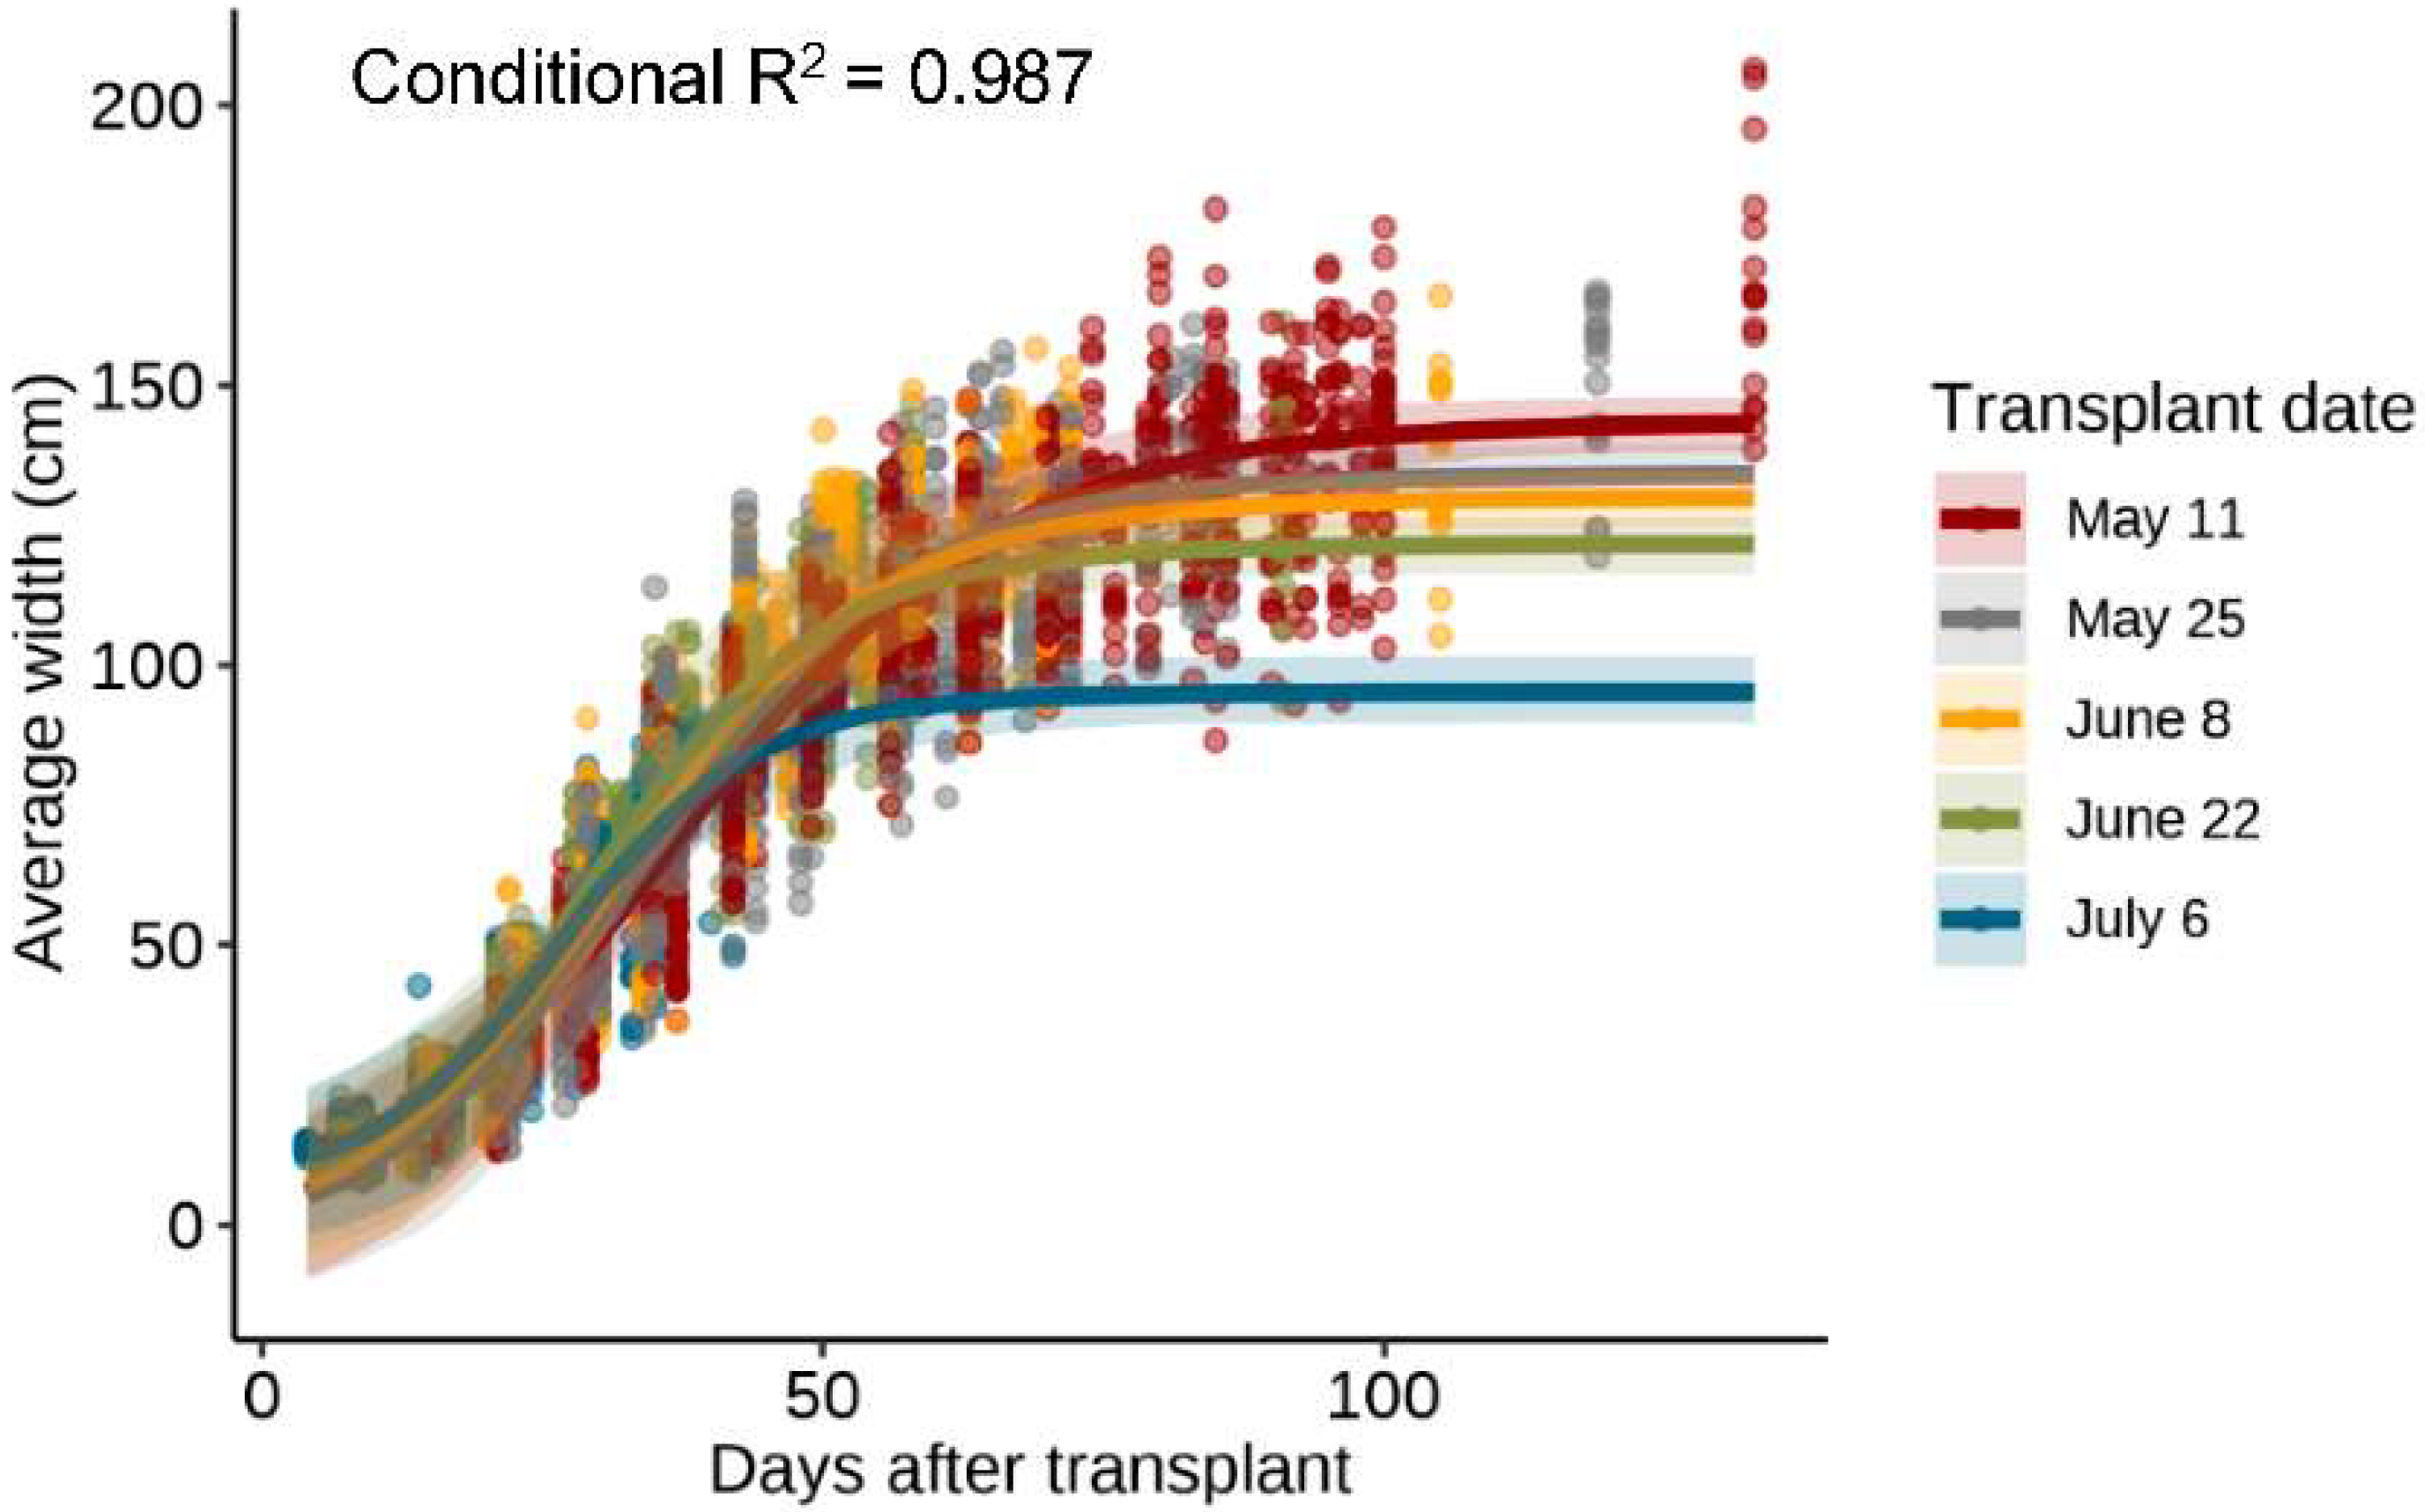
3.2. Transplant Date Affecting Plant Width

No significant interaction was observed between transplant date and plant spacing on plant width. However, both main effects had a significant effect on plant width.
All four parameters of the FPLM describing the plant width over time were affected by transplant date (Figure 2, Table 3). Estimates for parameter B, representing the maximum width attained during the growing season, were greatest for the 11 May transplant date (148.35 cm). The average plant width decreased with subsequent transplant dates. The final width of clones transplanted on 25 May was less than that of the 11 May transplant date. There was no significant difference in final plant width between the 8 June and 22 June transplant dates. The least wide plants were found in the last transplant date of 6 July (99.09 cm; Table 3).
Similar to parameter B, C exhibited a decreasing trend with later transplant dates (Table 3). Similar to the transplant date affecting the plant height, the results suggest that earlier transplant dates require more time to reach their maximum growth rate in contrast to later transplant dates. The 11 May and 26 May transplant dates were statistically similar, requiring the most amount of time to attain their maximum growth rate. The 8 June, 22 June, and 6 July transplant dates were all similar, requiring the least amount of time to reach their maximum growth rates.
The estimates for the M parameter exhibited similar trends as the B and C estimates. The maximum growth rate was greatest for earlier transplant dates and decreased with subsequent transplant dates. The 11 May transplant date had the greatest maximum growth rate. The 25 May, 8 June, and 22 June transplant dates were comparable. The final 6 July transplant date had the lowest growth rate. Parameter A, the height of the lower asymptote, exhibited an opposite trend to the three prior parameters. Values tended to increase with later transplant dates (Table 3). The initial 11 May transplant has the lowest value (−25.59), and the final 6 July transplant date had the highest value (−0.10). The 11 May, 25 May, and 8 June transplant dates were statistically equal. The 25 May, 8 June, and 22 June dates produced plants that were similar. For parameter A, the model is attempting to calculate the height of the lower asymptote before the two-week mark.
The effects of transplant date on plant width are similar to the effects of transplant date on plant height. The trends and statistical differences found among treatments for the effect of transplant date on plant height and width are nearly the same for all four parameters of the FPLM (Table 1 and Table 2). These relationships indicate that the factors regulating the growth potential for plant height and width with respect to transplant date are closely related.
Similar to the effect of transplant date on plant height, earlier transplant date treatments displayed the widest final plant width (Parameter B; Table 2, Figure 3).
This effect is most likely the due to the treatments receiving a longer vegetative growing period. Earlier transplant dates required more time (C) to reach the maximum growth rate (M) (Table 2, Figure 3). Temperature may be another factor affecting these parameters. Hemp’s rate of photosynthesis and cellular respiration can be significantly affected by day and night temperatures. A study in a controlled environment tested four fiber hemp cultivars and three THC-producing cultivars to determine the ideal temperatures for optimal photosynthetic rates. The optimal photosynthetic rates for six of the cultivars were at temperatures between 25–30 °C, while one of the cultivars had an optimal photosynthetic rate between 30–35 °C. All the cultivars showed a twofold increase in the cellular respiration rate with an increase in temperature from 20–40 °C [24]. The relatively cooler temperatures that earlier transplant dates experienced early in the growing season (Figure 4) may have delayed early season development, resulting in more time needed to reach the maximum growth rate

3.3. Plant Spacing Affecting Plant Width

The parameters B, C, and M of the FPLM, describing plant width over time, were affected by plant spacing (Figure 3, Table 4). Parameter A was not affected by plant spacing (p > 0.05). The widest plants (parameter B) were observed in the 1.83 m plant spacing treatment (142.38 cm; Table 3). Plant width decreased significantly as plant spacing was reduced. The 1.52 m spacing was comparable to the 1.83 m spacing. The 1.22 m spacing was similar to the 1.52 m spacing. The least wide plants were observed in the smallest plant spacing treatment of 0.91 m (118.94 cm; Table 4).
The parameter C estimates displayed a similar trend to parameter B. Wider plant spacing treatments exhibited higher values, which decreased with smaller plant spacing treatments. This trend suggests that plants with wider spacing treatments require additional time to obtain their maximum growth rate (M) in comparison to plants with narrower spacing treatments. The 1.83 m spacing required the most amount of time to attain maximum growth (33.38 d; Table 4). The 1.83 m, 1.52 m, and 1.22 m spacing treatments were statistically comparable; these treatments required the longest time to obtain the maximum growth rate. The 1.22 m and 0.91 m treatments were statistically similar. The 0.91 m treatment required the least amount of time to reach the maximum growth rate (29.22 d).
The estimates for parameter M exhibited a similar trend as the previous two parameters. As plant spacing decreased, so did the maximum growth rate. The 1.83 m spacing had the largest growth rate, which was statistically comparable to the 1.52 m and 1.22 m treatments. The 1.52 m, 1.22 m, and 0.91 m plant spacings had comparable growth rates. The 0.91 m treatment had the lowest maximum growth rate.
Larger plant spacing treatments resulted in wider plants, while smaller plant spacing treatments resulted in narrower plants (Figure 3, Table 4). This trend is likely an effect of inter-plant competition for light, water, and nutrients. During the growing season, nutrient and water availability were not directly measured; however, due to the fertilization rate and regular irrigation, interplant competition can mostly be attributed to light interception. Furthermore, we did not observe any nutrient deficiencies in the field, nor were the plants water stressed.
Inter-plant competition resulting from increasing planting density can influence plant morphology and growth rates. When fiber hemp is cultivated at higher planting densities, canopy closure occurs faster than for plantings at lower planting densities [12]. Amaducci et al. [11] fitted early season light interception data from multiple fiber hemp planting densities to a logistic model and reported that canopy closure was reached in less time with higher planting densities and that higher planting densities required significantly less time to reach the inflection point (maximum growth rate) than lower panting densities.
Narrower plant spacing treatments required less time (C) to reach their maximum growth rate (M; Figure 3, Table 4). Consequently, we observed smaller plant spacing treatments achieving canopy closure earlier than larger spacing treatments. Canopy closure for the 11 May 0.91 m spacing was achieved by 28 June at the Jackson Springs location, 7 July at the Kinston location, and 2 August at the Salisbury location. This effect may have potentially been induced by the increased light competition experienced by smaller plant spacing treatments. For bare ground systems, the reduced time needed for canopy closure may be advantageous for increasing the crop’s competitive ability with weed competition. Similar results have been found in fiber hemp planting density studies [25]. However, in a system utilizing plastic mulch, the weed-competitive benefits of crop canopy closure are not as relevant.

3.4. Biomass Affected by Transplant Date and Plant Spacing

There was no significant interaction between transplant date and plant spacing on per-plant biomass production. However, both main effects affected biomass production and followed a linear regression (p < 0.0001, LOF p = 0.6832; Figure 5).
The common slope of the regression represents the main effect of transplant date, which was −6.38 g plant−1 d−1 (Table 5). The slope implies that, for every day that planting is delayed after the initial 11 May transplant date, an average of 6.38 g of potential biomass is lost.
The different y intercepts represent the main effect of plant spacing. On a per plant basis, there is a decreasing trend with decreasing plant spacing (Figure 5, Table 5). The biomass yields were highest in the 1.83 m and 1.52 m treatments, which were not different from one another (Table 4). The 1.83 m spacing treatment yielded significantly more than the 1.22 m and 0.91 m treatments. By doubling the space from 0.91 m to 1.83 m, we saw a 14.2% increase in biomass yield.
The yield results on a per hectare basis showed the same linear trend with significant main effects (p < 0.0001, LOF p = 0.6751; Figure 6, Table 6). For all the planting date treatments and regardless of plant spacing, we observed a slope of −31.98 kg ha−1 d−1. The slope indicates that, regardless of plant spacing, we lost, on average, 31.98 kg of biomass for every day we delayed transplanting after 11 May.
We observed a reverse trend in the plant spacing treatment effect on per hectare yield compared to per plant yield; decreasing plant spacing resulted in significantly higher yields per hectare (Figure 6, Table 6). The 1.83 m spacing had the smallest y intercept (7049.04 kg ha−1); the 1.52 m spacing was slightly larger but statistically similar (7218.70 kg ha−1). The 0.91 m spacing treatment yielded the highest amount of biomass on a per hectare basis compared to all other treatments. Here, doubling the space between plants from 0.91 m to 1.83 m resulted in an 8.8% decrease in yield on a per hectare basis (Table 6). These results indicate that, while increased space between plants increases the amount of biomass produced on a per plant basis (Table 5), the drivers for maximum yield on a per-hectare basis are increasing plant density and early planting (Table 6).
Our planting spacing results concur with da Silva Benevenute et al. [13], who tested different planting densities (3000, 4000, 6000, 12,000 plants ha−1) with the day-length-sensitive cultivar Cherry Wine. We observed similar trends regarding biomass production, where lower planting densities resulted in more biomass on a per plant basis, while higher planting densities resulted in more biomass produced on a per-hectare basis. Additionally, a study conducted by Anderson et al. [26] identified a strong correlation between increased growth rates and taller final plant heights (r = 0.97); likewise, taller plants at flower initiation were correlated with an increase in final biomass. In our study, we observed the greatest growth rate for plant height and width with our earliest 11 May transplant date (Table 2 and Table 3). When compared to all other treatments, our 0.91 m plant spacing, and 11 May transplant date treatments yielded the greatest biomass on a per-hectare basis. Our results, along with those of da Silva Benevenute et al. [13] and Anderson et al. [26], reinforce the hypothesis that small plant spacing and an early transplant date are both key driving factors for maximizing biomass on a per-hectare basis.
Research regarding the effect of transplant date on floral hemp is limited. However, in other day-length-sensitive short-day crops such as rice, similar results were found. Satapathy et al. [10] conducted a trial examining the effect of planting date on the agro-morphological traits of rice. The trial utilized three planting dates over a 14 d period. Satapathy et al. [10] identified that earlier planting dates resulted in a higher grain yield, higher panicle weight, increased plant height, and increased biomass production. Bashir et al. [27] found similar results with a planting date study on rice. The authors observed a decrease in final plant height and aboveground biomass as the planting date was delayed, indicating that earlier planting dates produced taller plants as a result of experiencing a longer growing season due to the photoperiod response.
We did not quantify cannabinoids in our trial; however, da Silva Benevenute et al. [13] did not find any evidence of planting density influencing cannabinoid concentration. The cannabinoid synthesis of THC and CBD is primarily regulated by genotype. Campbell et al. [5] investigated the effect of genotype by environment for 13 hemp cultivars and found that 80% and 83% of variances for THC and CBD could be explained by the genotype, while 1.7% and 6% of variances could be explained by the environment. Additionally, field trials have shown that the cannabinoid content and the CBD:THC ratio in high-CBD hemp cultivars are regulated by genetics and are not influenced by environmental stress [6]. Therefore, maximum potential cannabinoid concentration will always be limited by plant genetics. Burgel et al. [4] demonstrated that cannabinoids are highly dependent on the genotype and growth stage. Yang et al. [7] tracked the development of cannabinoids in the inflorescence of hemp in a pilot study and observed a general increase in THC, CBD, and CBG as the flowers matured. In day-length-sensitive cultivars, THC exceeded the legal 0.3 percent threshold at about 4 weeks post-anthesis. Total CBD continued to increase, reaching its greatest concentration at 6 weeks post-anthesis. Since THC concentrations exceed 0.3% before maximum CBD production, the maximum CBD concentration growers could attain will always be limited by the legal threshold.
Plant nutrition can influence morphology and growth; however, it has a limited influence on cannabinoid production. In a study conducted in a controlled environment with five CBD hemp cultivars, Anderson et al. [26] observed optimal growth and biomass production at 50 mg L−1 nitrogen (N). Increasing fertilizer rates resulted in reduced growth and cannabinoid content. The observed reduction in cannabinoids was a response to the salinity stress associated with the overall plant decline. Caplan et al. [28] observed maximum plant growth and biomass production on a drug type cultivar with a fertilizer rate of 389 mg N L−1; however, there was no effect of the fertilizer rate on cannabinoid concentrations. Field studies in North Carolina have demonstrated that nitrogen fertility levels influence plant growth and biomass production but do not affect cannabinoid concentrations. Additionally, potassium levels impacted plant growth and cannabinoid concentrations differently depending on the environment and soil texture. In clay environments, a rate of 110 kg K2O ha−1 maximized the biomass yield but did not affect cannabinoids. In sand environments, potassium rates did not affect biomass; however, THC and CBD concentrations showed a linear decrease of less than one percent as the K2O rates increased from 0 to 224 kg K2O ha−1 [29]. Considering the results from these authors, there is a consensus that CBD production potential is largely regulated by genetics and harvest timing. Since compensation is based on a percent CBD pound basis, a grower’s main mode of increasing profitability would be to maximize marketable biomass production through cultural practices.

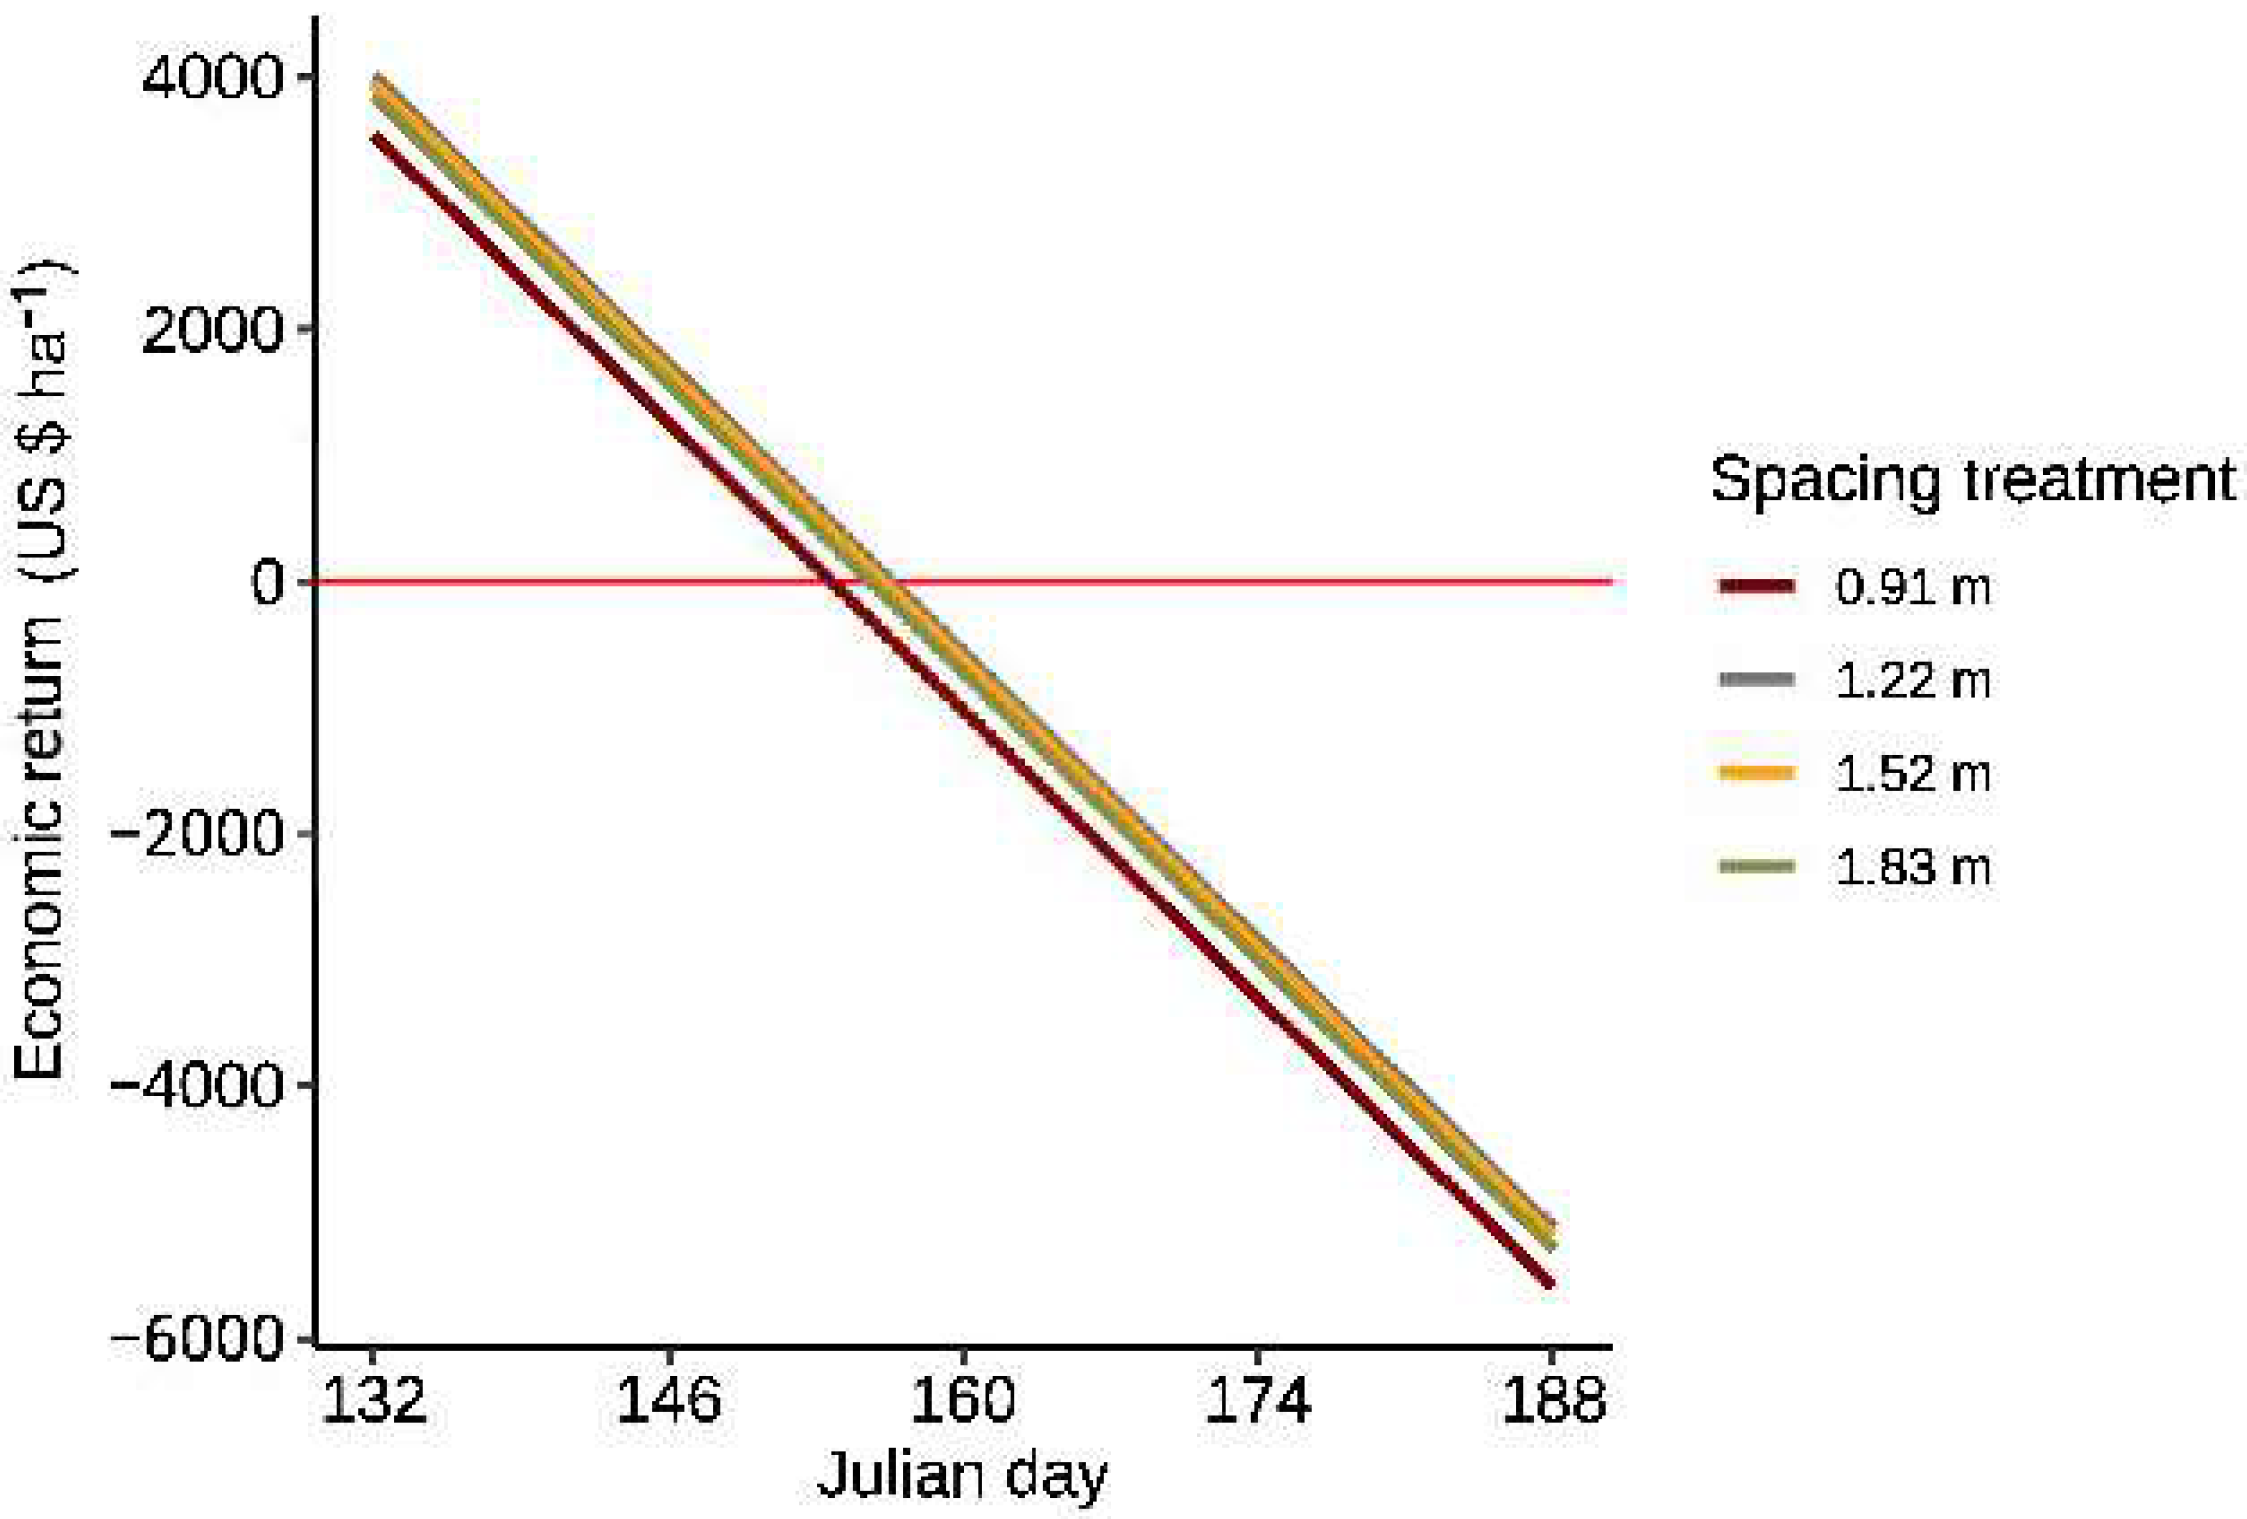
3.5. Economic Return

The floral hemp industry in the United States is still relatively young. There are many uncertainties and challenges facing the industry. As with most new alternative crop commodity markets, as the United States hemp market continues to develop and expand, it is expected that the market will also become increasingly volatile [30]. When incorporating current values for production, we found that hypothetical economic returns were highest at the 1.22 m spacing treatment, followed by the 1.52 m, 1.83 m, and 0.91 m spacing treatments (Table 7, Figure 7). Though the 0.91 m spacing treatment resulted in the highest biomass on a per hectare basis (Figure 6, Table 6), the increased expenditures on cuttings limited hypothetical economic returns. The economic returns generated by using 0.91 m spacing were USD 465.99 ha−1 less than those of the most profitable spacing (1.22 m; Table 6), regardless of the transplant date. All spacing treatments shared a common slope, which was −163.098 USD ha−1 day−1. The Julian date at which economic returns equaled 0 USD ha−1 day−1 ranged from 153 (0.91 m spacing) to 156 (1.22 and 1.52 m spacings). This corresponds to 2 June to 5 June. Consequently, to maximize profits, farmers should transplant early and utilize a 1.22 m spacing.

4. Conclusions

The objective of this study was to identify cultural practices that maximize floral hemp biomass production. Farmers growing floral hemp for extraction purposes are compensated based on total biomass and CBD concentrations. Since cannabinoid concentrations are largely determined and limited by genetics and the time of harvest [4,5,6], they cannot maximize CBD production. Consequently, to optimize biomass production, farmers should transplant early in the season to maximize vegetative growth. Narrow spacing improved biomass production on a per hectare basis; however, the cost of cuttings may result in reduced economic returns.
‘BaOx’ was the only cultivar examined in this study. It should be noted that the growth and structure of different hemp cultivars may vary; therefore, the effects of transplant date and planting density may differ. Furthermore, these studies were conducted in the Southeast at a latitude of approximately 35.7° N. Farmers in more southerly or northerly latitudes with differing summer day lengths may require earlier or later transplanting, respectively, based on their unique weather and day length conditions.

Author Contributions

Conceptualization, D.H.S.; methodology, D.H.S.; formal analysis, D.H.S.; investigation, E.R.L. and S.H.I.; resources, D.H.S.; data curation, E.R.L.; writing—original draft preparation, E.R.L.; writing—review and editing, D.H.S., S.Y. and S.L.; visualization, D.H.S.; supervision, D.H.S.; project administration, D.H.S., S.Y. and S.L.; funding acquisition, D.H.S. All authors have read and agreed to the published version of the manuscript.

Funding

This research received no external funding.

Institutional Review Board Statement

Not Applicable.

Informed Consent Statement

Not Applicable.

Data Availability Statement

The data presented in this study are available on request from the corresponding author. The data are not publicly available due to restrictions from the breeding company of the hemp clones used in the trials.

Acknowledgments

We would like to acknowledge the hard work and dedication of the station staff at the Piedmont Research Station, Cunningham Research Station, and Sandhills Research Station. We would also like to thank Fernando Miguez for aiding in statistical consulting.

Conflicts of Interest

The authors declare no conflict of interest.

References

  1. Hall, J.; Bhattarai, S.P.; Midmore, D.J. Review of flowering control in industrial hemp. J. Nat. Fibers 2012, 9, 23–36. [Google Scholar] [CrossRef]
  2. Abrams, D.I. The therapeutic effects of cannabis and cannabinoids: An update from the national academies of sciences, engineering and medicine report. Eur. J. Intern. Med. 2018, 49, 7–11. [Google Scholar] [CrossRef] [PubMed]
  3. Levinsohn, E.A.; Hill, K.P. Clinical uses of cannabis and cannabinoids in the United States. J. Neurol. Sci. 2020, 411, 116717. [Google Scholar] [CrossRef] [PubMed] [Green Version]
  4. Burgel, L.; Hartung, J.; Pflugfelder, A.; Graeff-Hönninger, S. Impact of growth stage and biomass fractions on cannabinoid content and yield of different hemp (Cannabis sativa L.) genotypes. Agronomy 2020, 10, 372. [Google Scholar] [CrossRef] [Green Version]
  5. Campbell, B.J.; Berrada, A.F.; Hudalla, C.; Amaducci, S.; McKay, J.K. Genotype × environment interactions of industrial hemp cultivars highlight diverse responses to environmental factors. AGE 2019, 2, 1–11. [Google Scholar] [CrossRef] [Green Version]
  6. Toth, J.A.; Smart, L.B.; Smart, C.D.; Stack, G.M.; Carlson, C.H.; Philippe, G.; Rose, J.K.C. Limited effect of environmental stress on cannabinoid profiles in high-cannabidiol hemp (Cannabis sativa L.). Glob. Chang. Biol. Bioenergy 2021, 13, 1666–1674. [Google Scholar] [CrossRef]
  7. Yang, R.; Berthold, E.C.; Mccurdy, C.R.; Da Silva Benevenute, S.; Brym, Z.T.; Freeman, J.H. Development of Cannabinoids in Flowers of Industrial Hemp (Cannabis sativa L.): A Pilot Study. J. Agric. Food Chem. 2020, 68, 6058–6064. [Google Scholar] [CrossRef]
  8. Zirpel, B.; Kayser, O.; Stehle, F. Elucidation of structure-function relationship of THCA and CBDA synthase from Cannabis sativa L. J. Biotechnol. 2018, 284, 17–26. [Google Scholar] [CrossRef]
  9. Sengloung, T.; Kaveeta, L.; Müssig, J. Physical Properties of Traditional Thai Hemp Fiber (Cannabis sativa L.). J. Ind. Hemp 2008, 13, 20–36. [Google Scholar] [CrossRef]
  10. Satapathy, S.M.; Srivastava, V.K.; Majhi, P.K.; Gond, S. Effect of Delayed Time of Planting on Grain Yield and Agro-morphological Traits of Elite Rice (Oryza sativa L.) Varieties. Int. J. Plant Soil Sci. 2021, 33, 68–79. [Google Scholar] [CrossRef]
  11. Amaducci, S.; Errani, M.; Venturi, G. Plant population effects on fibre hemp morphology and production. J. Ind. Hemp 2002, 7, 33–60. [Google Scholar] [CrossRef]
  12. Tang, K.; Struik, P.C.; Yin, X.; Calzolari, D.; Musio, S.; Thouminot, C.; Bjelková, M.; Stramkale, V.; Magagnini, G.; Amaducci, S. A comprehensive study of planting density and nitrogen fertilization effect on dual-purpose hemp (Cannabis sativa L.) cultivation. Ind. Crops Prod. 2017, 107, 427–438. [Google Scholar] [CrossRef]
  13. da Silva Benevenute, S.; Freeman, J.H.; Yang, R. How do pinching and plant density affect industrial hemp produced for cannabinoids in open field conditions? J. Agron. 2021, 114, 618–626. [Google Scholar] [CrossRef]
  14. Carlson, C.H.; Stack, G.M.; Jiang, Y.; Taskrian, B.; Cala, A.R.; Toth, J.A.; Philippe, G.; Rose, J.K.C.; Smart, C.D.; Smart, L.B. Morphometric relationships and their contribution to biomass and cannabinoid yield in hybrids of hemp (Cannabis sativa). J. Exp. Bot. 2021, 72, 7694–7709. [Google Scholar] [CrossRef] [PubMed]
  15. Miguez, F. NLRAA: Nonlinear Regression for Agricultural Applications. R Package Version 0.98. 2021. Available online: https://cran.r-project.org/web/packages/nlraa/nlraa.pdf (accessed on 13 May 2022).
  16. Pinheiro, J.; Bates, D.; DebRoy, S.; Sarkar, D.; R Core Team. NLME: Linear and Nonlinear Mixed Effects Models. R Package Version 3.1-153. 2021. Available online: https://cran.r-project.org/web/packages/nlme/nlme.pdf (accessed on 13 May 2022).
  17. R Core Team. R: A Language and Environment for Statistical Computing; R Foundation for Statistical Computing: Vienna, Austria, 2018; Available online: https://www.R-project.org/ (accessed on 14 July 2022).
  18. Archontoulis, S.V.; Miguez, F.E. Nonlinear regression models and applications in agricultural research. J. Agron. 2015, 107, 786–798. [Google Scholar] [CrossRef] [Green Version]
  19. Pinheiro, J.C.; Bates, D.M. Mixed-Effects Models in S and S-PLUS; Springer: New York, NY, USA, 2000. [Google Scholar]
  20. Lenth, R.V.; Buerkner, P.; Herve, M.; Love, J.; Miguez, F.; Riebl, H.; Singmann, H. EMMEANS: Estimated Marginal Means, Aka Least-Square Means. R Package Version 1.7.2. 2022. Available online: https://cran.r-project.org/web/packages/emmeans/index.html (accessed on 13 May 2022).
  21. Mark, T.; Shepherd, J. Industrial Hemp Budgets 2021. University of Kentucky. Available online: https://hemp.ca.uky.edu/sites/hemp.ca.uky.edu/files/hemp_budgets_2021.xlsx (accessed on 14 July 2022).
  22. Hemp Benchmarks. Monthly Biomass and Refined Hemp Oil Assessed Prices. 2022. Available online: https://hemp.ca.uky.edu/sites/hemp.ca.uky.edu/files/hemp_budgets_2021.xlsx (accessed on 30 May 2022).
  23. Darby, H.M.; Gupta, A.; Bruce, J.; Zieglar, S. Cannabidiol Hemp Plant Spacing x Planting Date Trial. Northwest Crops Soils Program 2018, 322. Available online: https://scholarworks.uvm.edu/cgi/viewcontent.cgi?article=1321&context=nwcsp (accessed on 14 July 2022).
  24. Chandra, S.; Lata, H.; Khan, I.A.; ElSohly, M.A. Temperature response of photosynthesis in different drug and fiber varieties of Cannabis sativa L. Physiol. Mol. Biol. Plants. 2011, 17, 297–303. [Google Scholar] [CrossRef] [Green Version]
  25. Van der Werf, H.M.G.; van Geel, W.C.A.; van Gils, L.J.C.; Haverkort, A.J. Nitrogen fertilization and row width affect self-thinning and productivity of fibre hemp (Cannabis sativa L.). Field Crops Res. 1995, 42, 27–37. [Google Scholar] [CrossRef]
  26. Anderson, S.L.; Pearson, B.; Kjelgren, R.; Brym, Z. Response of essential oil hemp (cannabis sativa L.) growth, biomass, and cannabinoid profiles to varying fertigation rates. PLoS ONE 2021, 16, e0252985. [Google Scholar] [CrossRef]
  27. Bashir, M.; Akbar, N.; Iqbal, A.; Zaman, H. Effect of different sowing dates on yield and yield components of direct seeded coarse rice (Oryza sativa L). Pak. J. Agric. Sci. 2010, 47, 361–365. [Google Scholar]
  28. Caplan, D.; Dixon, M.; Zheng, Y. Optimal rate of organic fertilizer during the vegetative-stage for cannabis grown in two coir-based substrates. HortScience 2017, 52, 1307–1312. [Google Scholar] [CrossRef] [Green Version]
  29. Short, M.M. Establishing Nitrogen and Potassium Fertility Recommendations for Floral Hemp Production. NC State University Electronic Thesis & Dissertation. Master’s Thesis, North Carolina State University, Raleigh, NC, USA, 2021. Available online: https://www.lib.ncsu.edu/resolver/1840.20/39177 (accessed on 14 July 2022).
  30. Mark, T.; Shepherd, J.; Olson, D.; Snell, W.; Proper, S.; Thornsbury, S. Economic Viability of Industrial Hemp in the United States: A Review of State Pilot Programs. United States Department of Agriculture. 2020. Available online: https://www.ers.usda.gov/webdocs/publications/95930/eib-217.pdf (accessed on 14 July 2022).
Figure 1. Four-parameter logistic regression of temporal plant height in floral hemp as affected by transplant date throughout the vegetative growing period. Shaded area represents the 95% confidence interval. Day 0 represents the initial day of transplant. Circles represent plot-level data points from two locations in 2020 and three locations in 2021 in North Carolina.
Agronomy 12 01856 g001
Figure 2. Four-parameter logistic regression of temporal plant width in floral hemp as affected by transplant date throughout the vegetative growing period. Shaded area represents the 95% confidence interval. Day 0 represents the initial day of transplant. Circles represent plot-level data points from two locations in 2020 and three locations in 2021 in North Carolina.
Agronomy 12 01856 g002
Figure 3. Four-parameter logistic regression of temporal plant width in floral hemp as affected by plant spacing throughout the vegetative growing period. Shaded area represents the 95% confidence interval. Day 0 represents the initial day of transplant. Circles represent plot-level data points from two locations in 2020 and three locations in 2021 in North Carolina.
Agronomy 12 01856 g003
Figure 4. Average daily air temperature for the 2020 and 2021 growing seasons (planting through harvest) at field trial locations in Kinston, Salisbury, and Jackson springs, NC.
Agronomy 12 01856 g004
Figure 5. Linear response to individual floral hemp plant biomass affected by transplant date and spacing. Dates are reported in Julian calendar days. 11 May transplant date = 132 Julian day, 25 May transplant date = 146 Julian date, 8 June transplant date = 160 Julian date, 22 June transplant date = 174 Julian date, and 6 July transplant date = 166 Julian date. Shaded area represents the 95% confidence interval. Circles represent plot-level data points from two locations in 2020 and three locations in 2021 in North Carolina.
Agronomy 12 01856 g005
Figure 6. Linear response to biomass yield per hectare in floral hemp affected by transplant date and spacing. Dates are reported in Julian calendar days. 11 May transplant date = 132 Julian day, 25 May transplant date = 146 Julian date, 8 June transplant date = 160 Julian date, 22 June transplant date = 174 Julian date, and 6 July transplant date = 166 Julian date. Shaded area represents the 95% confidence interval. Circles represent plot-level data points from two locations in 2020 and three locations in 2021 in North Carolina.
Agronomy 12 01856 g006
Figure 7. Effects of transplant date and plant spacing on hypothetical economic return. Values were generated using model estimates for biomass production (Table 6), variable costs of USD 5195.92 ha−1 (excluding costs for cuttings), and fixed costs of USD 176 ha−1. Dates are reported in Julian calendar days. 11 May transplant date = 132 Julian day, 25 May transplant date = 146 Julian date, 8 June transplant date = 160 Julian date, 22 June transplant date = 174 Julian date, and 6 July transplant date = 166 Julian date.
Agronomy 12 01856 g007
Table 1. Goodness-of-fit criteria for mixed nonlinear sigmoid models describing the relationship between floral hemp plant height and width over time.
ResponseModelGoodness-of-Fit Criteria z
AICcBIC
Plant heightLogistic23,776.6123,820.53
Four-Parameter Logistic23,761.8723,818.33
Gompertz24,498.3224,542.24
Beta growth function25,340.3725,384.29
Four-parameter beta growth function25,756.8125,813.27
Plant widthLogistic26,629.0226,672.68
Four-Parameter Logistic26,298.2126,341.87
Gompertz26,611.2626,667.38
Beta growth functionNC yNC
Four-parameter beta growth function27,376.0227,419.68
z AICc = Corrected Akaike’s Information Criterion; BIC = Bayesian Information Criterion; y NC = No convergence. Best-fitting model in bold.
Table 2. Parameters of the four-parameter logistic model for temporal floral hemp plant height as affected by transplant date.
Parameter
Transplant DateA
cm
B
cm
c
Days
m
cm Day−1
11 May−1.87 c z105.54 a38.23 a15.05 a
25 May3.02 b100.63 b37.42 a11.20 b
8 June2.36 b98.72 bc33.87 b10.88 b
22 June3.25 b95.64 c30.59 c10.78 b
6 July11.48 a80.98 d28.95 c9.15 c
p-value<0.0001<0.0001<0.0001<0.0001
z Letters indicate significant differences within a parameter estimate using Tukey’s HSD (α = 0.05).
Table 3. Parameters of the four-parameter logistic model for temporal floral hemp plant width as affected by transplant date.
Parameter
Transplant DateA
cm
B
cm
C
Days
M
cm Day−1
11 May−25.59 c z148.38 a36.20 a20.57 a
25 May−15.72 bc136.39 b35.59 a15.94 b
8 June−18.49 bc127.78 c28.76 b14.90 b
22 June−12.58 b124.99 c27.25 b14.07 b
6 July−0.10 a99.09 d26.84 b11.36 c
p-value<0.0001<0.0001<0.0001<0.0001
z Letters indicate significant differences within a parameter estimate using Tukey’s HSD (p < 0.05).
Table 4. Parameters of the four-parameter logistic model for temporal floral hemp plant width as affected by transplant plant spacing.
Spacing
m
Parameter
A
cm
B
cm
C
Days
M
cm Day−1
0.91−14.83118.94 c z29.22 b15.33 b
1.22−17.68133.09 b31.45 ab16.46 ab
1.52−15.94136.32 ab33.06 a16.65 ab
1.83−18.17142.38 a33.38 a17.49 a
p-valueNS<0.0001<0.00010.0158
z Letters indicate significant differences within a parameter estimate using Tukey’s HSD (p < 0.05).
Table 5. Linear regression model estimates for individual plant marketable biomass affected by transplant date and spacing.
SpacingInterceptSlope
(m)g plant−1g plant−1 day−1
0.911389.00 c z−6.38
1.221473.00 b−6.38
1.521530.99 ab−6.38
1.831585.71 a−6.38
z Letters indicate significant differences using Tukey’s HSD (p < 0.05).
Table 6. Linear regression model estimates for biomass yield per hectare affected by transplant date and spacing.
SpacingInterceptSlope
(m)kg ha−1kg ha−1 day−1
0.917727.8 a z−31.98
1.227453.7 b−31.98
1.527218.7 bc−31.98
1.837049.04 c−31.98
z Letters indicate significant differences using Tukey’s HSD (p < 0.05).
Table 7. Model estimates for hypothetical economic returns based on yield estimates as affected by transplant date and spacing.
SpacingInterceptSlope
(m)US$ ha−1US$ ha−1 day−1
0.9125,069.27−163.098
1.2225,535.26−163.098
1.5225,472.68−163.098
1.8325,368.68−163.098
Publisher’s Note: MDPI stays neutral with regard to jurisdictional claims in published maps and institutional affiliations.

