Abstract
Perennial groundcover (PGC) has great potential to deliver ecosystem service benefits and control weeds in annual row crop systems. Inadequately suppressed PGC, however, acts as an early-season weed, causing a shade avoidance response (SAR) in maize (Zea mays L.) before the critical period for weed control (CPWC) even with resource abundance. The SAR results from a low red to far-red light shift, impairing early season plant growth and decreasing yield. A field study was conducted in Ames, IA, USA to assess application timing of groundcover suppression chemicals on maize growth and development. Two suppression chemical treatments (paraquat or paraquat + glufosinate) were each applied to “Midnight” Kentucky bluegrass (Poa pratensis L.) PGC once on the day of maize planting (DOP) or consecutive maize stages from VE to V6 in a randomized complete block design with unsuppressed groundcover control. Response variables included maize plant height, maize phenological development stage, reflected red:far-red (R:FR) ratio above the PGC canopy, early vegetative and final maize plant density, maize yield and components, and weed communities. Suppression increased reflected R:FR ratio from the groundcover immediately after application. Where suppression was applied at later stages, low R:FR ratio during early vegetative growth stages triggered a maize SAR and maize plant etiolation. Final maize plant height and yield were greater in PGC suppressed at earlier maize stages, although no suppression treatment provided adequate suppression duration. Paraquat + glufosinate more effectively suppressed groundcover overall and limited groundcover competition, producing 8% greater maize grain yield than paraquat alone in year 1, and 13% greater stover and 8% greater total aboveground biomass (TAB) in year 2. Weather conditions influenced chemical suppression efficacy in year 2, emphasizing the importance of identifying reliable chemical suppression to support grain yield from the day of maize planting.
1. Introduction
Ecosystem degradation in conventional cropping systems, renewable fuel agendas, and private and public incentives for ecosystems services delivery have driven the development of alternative cropping systems that can both conserve natural resources and meet global demands for food, feed, fiber, and fuel. Without the development of such systems, natural resource degradation will ultimately compromise long-term agricultural productivity [1]. The integration of PGC into annual row crop systems is uniquely positioned to achieve production goals and regenerate marginal and fragile lands, as the PGC system recognizes infrastructure investments, market forces, and the existing federal agricultural policy framework. Perennial groundcover merges scalable soil and water conservation with high-yield row crop production by establishing perennial plant cover and delivery of associated benefits on the landscape. After perennial cover establishment in the first year, activities in subsequent years such as spring strip tillage and groundcover suppression in a PGC system may be coupled with existing management practices in an annual grain crop operation. The integration of low-growing, shallow-rooted, ecologically appropriate PGC into annual row cropping systems can alleviate negative consequences of the winter fallow period, including erosion, depletion of soil organic matter, and depletion of nutrients. Perennial plant species have a far more robust proportion of biomass concentrated belowground than annual plant species. The use of perennial species as cover crops in long-term rotations consequently enhances soil organic carbon [2,3] and provides improved soil structure over annual cropping systems [4]. Soil organic carbon impacts critical soil parameters, including organic matter [5,6], aggregation, and stability [7]. These structural features in turn affect water infiltration, movement, and storage [8,9]. Additionally, maize stover removal has negative ramifications for both short-term soil fertility and long-term productivity [10]. The integration of perennial cover crops into a maize-based cropping system can facilitate sustainable maize stover removal [11] for value-added opportunities and renewable fuel agenda fulfillment.
Refinement of the PGC system prior to broad deployment, however, is necessary to develop reliable groundcover suppression practices to support maize production. Prior experiments attribute maize yield declines in PGC to ineffective groundcover suppression or rapid post-suppression groundcover recovery, rendering groundcover suppression paramount for system success. This maize yield penalty is observed even when mechanical strip-tillage suppression eliminates early season resource competition for the maize seedling [12,13,14,15,16]. Furthermore, model analysis of the PGC system has shown that response to light was the primary PGC-related maize yield penalty factor [17]. The SAR is a well-documented phenomenon that results from a light quality shift [18,19,20,21]. Ineffectively suppressed groundcover produces a low R:FR ratio perceived by the maize plant as competition, which stimulates an SAR in maize before actual resource competition occurs [22,23,24] or with resource abundance [25]. The SAR begins at the V1 to V3 early maize vegetative stages and is characterized by etiolation and an increased shoot:root ratio [26]. The SAR precedes the well-documented CPWC during later vegetative maize stages [27,28].
We therefore designed an experiment to assess the impact of suppression timing on the maize SAR with two chemical combinations, each applied at one of seven consecutive early-season maize growth stages. We included mechanical strip-tillage in every PGC treatment to eliminate early-season resource competition for the developing maize seedlings. We measured the resultant effect on (i) R:FR ratio; (ii) maize developmental morphology, yield, and yield components; and (iii) weed community. Suppression chemicals included contact (limited translocation/locosystemic), nonselective, postemergence herbicides of paraquat [1,1′-dimethyl-4,4′-bipyridinium dichloride, Gramoxone SL 2.0, Syngenta Canada] and paraquat + glufosinate-ammonium [‘glufosinate’, Liberty 280 SL, Bayer CropScience LP]. The chemical suppression defoliates groundcover after strip-tillage mechanical suppression in a PGC system. The two contact herbicides cause tissue necrosis within 1–3 days for paraquat and 1 week for glufosinate-ammonium. Contact herbicides cannot be used in conjunction with systemic herbicides, which informed herbicide selection for this experiment. Contact herbicides burn green foliar tissue before a systemic herbicide can be translocated to the roots, decreasing systemic herbicide efficacy through herbicide antagonism.
While both contact herbicides, the two chemical suppressants control weeds through different modes of action. Glufosinate-ammonium (herbicide group 10; site of action, glutamine synthetase (photosynthesis inhibition)) inhibits the glutamine synthetase enzyme, glutamine production, and thereby photosynthesis due to of ammonium accumulation, as glutamine synthetase is critical for inorganic nitrogen metabolism and assimilation of ammonium [29,30,31,32,33]. Paraquat dichloride (herbicide group 22; site of action, Photosystem I) is ubiquitous as one of the most abundantly used herbicides in the USA [34]. Paraquat is rapidly absorbed by photosynthetically active green tissue, taking electrons from photosystem I to produce superoxide radicals, which ultimately break down the cell membrane and cause cell death [35,36,37].
2. Materials and Methods
A two site-year study was conducted in 2020 and 2021 at the Agronomy and Agricultural Engineering Sorenson Research Farm, 11.9 km southeast of Boone, IA (42°0′ N 93°44′ W). Climate data for the Sorenson Research Farm were obtained from the Ames-8-WSW Iowa Environmental Mesonet station, located 3 km northwest of the research site [38]. Growing degree days (GDD) were calculated from planting according to the following equation:
where 30 °C is the maximum and 10 °C is the base temperature for maize development.
GDD = Σ [(daily maximum temp. ≤ 30 °C + daily minimum temp. ≥ 10 °C)/2] − 10 °C
The experiment was located on soils dominated by Webster clay loam (0–2% slope, L107, fine-loamy, mixed, superactive, mesic Typic Endoaquoll) and Clarion loam (2–6% slope, L138B, fine loamy, mixed, superactive, mesic Typic Hapludoll).
The experiment design was a randomized complete block with four replicates. The 17 unique treatments were randomly assigned in each replicate (Table 1). Each plot was 3 m wide (4 rows × 0.76 m interrow spacing) and 6.1 m long. Cropping history of the site prior to PGC seeding included soybean, corn, and oats in 2017, 2018, and 2019, respectively. Pioneer P0574AM 105 Comparative Relative Maturity maize (Dupont Pioneer, Johnston, IA, USA) was planted as the maize hybrid in both years. Pioneer P0574AM maize is a relatively fixed ear type adapted to water-limited conditions with rapid emergence [39,40].

Table 1.
Treatments applied at Sorenson Research Farm in 2020 and 2021.
Tillage was conducted on 30 August 2019 prior to groundcover seeding. Kentucky bluegrass “Midnight” (Outsidepride Seed Source, LLC, Independence, OR, USA) was seeded as the PGC on 3 September 2019 with two passes at 5.6 and 7.8 kg ha−1 with a Tye 104-4204 Pasture Pleaser no-till seeder (AGCO Corporation, Duluth, GA, USA), for a total seeding rate of 13.4 kg ha−1. Multiple passes were completed to split the drill row spacings of 20 cm for a denser initial establishment. The seedbed was subsequently packed. Permanent tillage strips were created at maize planting in 2020 in the juvenile groundcover stand and re-tilled in 2021 in the established groundcover stand.
2.1. Site Management
Di-ammonium phosphate (18-46-0, N–P2O5–K) and potash (0-0-62, N–P–K2O) were broadcast with a Befco 209 HOP Fertilizer Spreader (Befco Inc., Rocky Mount, NC, USA), obtaining 35, 90, and 112 kg ha−1 of N, P, and K, respectively, on 7 April 2020 and 45, 112, and 123 kg ha−1 of N, P, and K, respectively, on 7 April 2021. Phosphorus and K levels were slightly greater than maintenance levels for maize grain and stover removal to ensure P and K were nonlimiting.
Perennial grass strips were sprayed with 2,4-D [2,4-dichlorophenoxyacetic acid] (Amine 400, PBI/Gordon Corporation, Kansas City, MO, USA) to control broadleaf weeds at 159 L ha−1 water and 1.18 kg active ingredient (a.e.) ha−1 on 23 April 2020 and at 1.57 kg a.e. ha−1 on 26 May 2021 with an Enduraplas Land Champ broadcast sprayer (Enduraplas, Neche, ND, USA). All applications in both years were completed at 207 kPa.
Plots were strip tilled at 38 cm width and 20 to 25 cm depth on 28 April 2020 and 13 April 2021 with an Unverferth 330 Ripper Stripper (Unverferth Manufacturing Co., Inc., Shell Rock, IA, USA). A Maschio gang tiller (Maschio Gaspardo North America Inc., Dewitt, IA, USA) was used to make an additional pass at 10 to 15 cm depth on 28 April 2020, 13 April 2021, and again on 20 April 2021 to pulverize surface clods from strip tillage and create a seedbed for uniform seed depth at planting. Large soil clods from strip tillage were hand raked from perennial grass strips on 29 April 2020. The raking of soil clods prevented smothering of the grass strips and interference of the hooded band sprayer, which is operated at 2.5–5.0 cm above the soil’s surface. On 29 March 2021, remaining residues in plots were mowed to a uniform 6 cm height.
Maize was planted on 7 May 2020 at 79,100 seeds ha−1 and on 30 April 2021 at 80,300 seeds ha−1. For groundcover suppression on the day of maize planting, plots were sprayed according to treatment assignment after maize planting in both years with paraquat (1,1′-dimethyl-4,4′-bipyridinium dichloride, Gramoxone SL 2.0, Syngenta Crop Protection, LLC, Greensboro, NC, USA) at 0.56 kg a.i. ha−1 and glufosinate-ammonium (Liberty 280 SL, Bayer CropScience LP, ‘Glufosinate’) at 0.47 kg a.i. ha−1 with 140 L ha−1 water. A custom Fimco ATV sprayer (Fimco Industries, North Sioux City, SD, USA) with a 4.6 m boom and TeeJet XR 8002 flat fan tips (Spraying Systems Company, Wheaten, IL, USA) applied DOP suppressants. Nitrogen as S-coated urea (43–0–0–4, N–P–K–S) was banded on 8 May 2020 at 168 kg N ha−1 and on 4 May 2021 at 169 kg ha−1 N.
Perennial groundcover was chemically suppressed on 21 May 2020 at the VE maize stage according to treatment assignment with 0.56 kg a.i. ha−1 paraquat and 0.47 kg a.i. ha−1 Liberty 280 SL with a custom four-row Redball hooded band sprayer (Willmar Fabrication, LLC, Benson, MN, USA) at 51 cm width and 112 L ha−1 water. The same methods at VE were used for subsequent year 1 applications on 30 May at V2, 3 June at V3, 8 June at V4, 12 June at V5, and 16 June at V6. The same methods as year 1 were used for PGC suppression applications in 2021 on 24 May at V2, 26 May at V3, 7 June at V4, 9 June at V5, 17 June at V6. Applications were not possible at V1 in year 1 or at VE and V1 in year 2 because of weather conditions that made the soil too muddy for machinery use and would cause destruction of the PGC and soil structure.
Glyphosate [N-phosphonomethyl)glycine] (Roundup PowerMAX, Monsanto, St. Louis, MO) was applied to the maize on 3 June 2020 and on 1 June 2021 at 1.26 kg acid equivalent (a.e.) ha−1 and 140 L ha−1 water on maize rows at a 25 cm width with a custom four-row Redball hooded band sprayer. The hooded band sprayer directed the chemical application to the 25 cm width over each maize row, not applying chemical to the 51 cm interrow spacing to protect the PGC.
Because of Japanese beetles (Popillia japonica L.) observed in all plots in both years, 0.22 kg ha−1 permethrin was sprayed in a 159 L ha−1 solution on 24 July 2020 and 18 July 2021. On 12 October 2020, 90% of stover was removed from all plots with a flail harvester and forage wagon.
2.2. Measurement Procedures
Maize stand density was taken at V2 and R6 in both years. Maize maturity and height were collected on a weekly basis from the V2 to R1 stage when final height was recorded. Reproductive maturity was assessed on a bi-weekly basis from R1 to R6. Maize maturity was determined by the leaf collar method [41]. Six plants per plot were tagged between the V5 and V6 leaves from the center two rows from which the mean plot growth stage was obtained. The highest point on each tagged plant was recorded as the plant height. Husks from one ear in each plot were peeled back during the reproductive stages to assess kernel development and maturity. The reflected R:FR ratio was obtained weekly as possible from the V2 until V8 maize stage with uninterrupted sunshine by holding a Field Scout Red/Far Red Meter (Spectrum Technologies, Inc., Aurora, IL, USA) in the center interrow of each plot 1.2 m above the PGC canopy or bare soil surface. The meter calculates the R:FR ratio [42] using the standard equation [43]:
R:FR ratio = [photon fluence rate in 10 nm band centered on 660 nm]/[photon fluence rate in 10 nm band centered on 730 nm]
A 1.5 m row of maize (equivalent to 1.15 m2 area) was hand-harvested at physiological maturity from the two center maize rows in each plot on 28 and 29 September 2020 and 21 September. Plant number, ear number, fresh weight of stover (husks, stalks, and leaves), and fresh weight of ears were recorded for the 1.5 m row. Stover from a random two-plant sample and all hand-harvested ears were dried at 70 °C until a constant weight was achieved [44]. The remainder of the two center rows per plot were combine-harvested on 8 October 2020 and 1 October 2021 with a modified John Deere 9450 combine with weigh system and moisture sensor. As with hand-harvested grain yield, combine-harvested maize grain yield was adjusted to 150 g kg−1 moisture and added to the hand-harvested grain yield for each plot to determine average grain yield for each treatment.
In both years, the grain was separated from the cobs, and cobs were added back to dried stover for total stover weight (husks, stalks, leaves, and cobs) [6]. Grain moisture was analyzed using a grain moisture analyzer (Model GAC 2000, DICKEY-john, Auburn, IL, USA). Stover yield, TAB, and harvest index (HI) were calculated from the dried weights obtained for each treatment. Harvest index is defined as:
HI = grain dry weight/TAB dry weight
Kernel rows ear−1, kernels row−1, and kernels ear−1 were obtained from each hand-harvested ear prior to separation of kernels from cobs both years, plus ear length in 2021. Average kernels ear−1 for each treatment was obtained using a seed counter (Old Mill Model 900-2, International Marketing and Design Corp., San Antonio, TX, USA) by dividing total kernels by ear number. Hand-harvested total kernel weight at 150 g kg−1 moisture was divided by hand-harvested kernel count for average individual kernel weight.
A 10 by 10 frequency grid (7.5 by 7.5 cm per square) was used after harvest on 5 October 2020 and 19 October 2021 to assess groundcover persistence under maize with 200 cells counted per plot. To better estimate the frequency of the cool season turfgrass, the 5 by 5 frequency grid for warm season rangeland grasses [45] was refined to contain smaller 10 by 10 squares. The number of squares with green grass foliage was counted out of total squares possible to produce the percent presence of cover, yielding plant frequency. Plants m−2 was not estimated because of the rhizomatous reproduction of the groundcover species planted the previous fall.
Fall weed density was measured in both years post-harvest on 6 October 2020 and 5 October 2021. The number of weeds per species in five randomly distributed 0.1 m2 hoops per plot were counted. The number of weeds per species were totaled for all five hoops per plot to estimate the weed density (weeds m−2) and number of weeds by species per square meter.
2.3. Statistical Analysis
Data were analyzed with the PROC GLM procedures in SAS version 9.4 [46]. ANOVA was used to assess significant effects in the linear additive model. Since the treatment structure of the experiment was an incomplete factorial, custom contrasts and differences of least square means were used for comparisons of treatments at α = 0.05. Fisher’s least significant difference (LSD) was used as a post hoc means comparison test. Because of the weather-related variations in treatment applications between years, data were analyzed within each site-year with treatment as a fixed effect and block as a random effect and presented as such. In both years, the intended V1 treatments were included as controls in custom contrasts because the suppressant was not applied. In 2021, the intended VE treatment was not included in custom contrasts because of observed legacy effects from the VE suppressant applied in the first year.
2.4. Weather Conditions
In 2020, the Boone research site logged 2795 growing degree days (GDD) from maize planting to maize harvest, exceeding the 30-year trailing average during the summer months by 110 and 59 GDD in June and July, respectively, with 58 and 79 fewer GDD in May and September, respectively (Figure 1). The research site logged 347 mm precipitation during the growing season, less than the 30-year trailing average from June through August but consistent with the 30-year trailing average in May and September. The site logged 3058 GDD from maize planting to maize harvest in 2021, with greater heat unit accumulation in June, August, and September (73, 95, 117 GDD, respectively) than the 30-year trailing average (Figure 1). The site logged 292 mm precipitation during the growing season in 2021, less in every month compared to the trailing average through September (Figure 1).
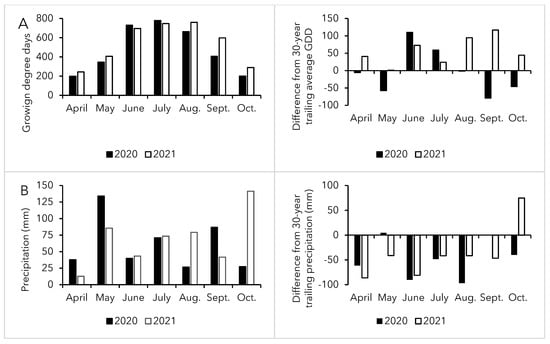
Figure 1.
(A) Growing degree days (GDD) and departure from the 30-year trailing average by month in 2020 and 2021 at NWS COOP site Ames−8−WSW, 3 km from the Sorenson Research Farm and (B) total precipitation and departures from the 30-year trailing average by month in 2020 and 2021 at NWS COOP site Ames−8−WSW. Aug., Sept., and Oct. are abbreviations for August, September, and October.
3. Results
3.1. Perennial Groundcover Persistence and R:FR Ratio
3.1.1. Frequency of Perennial Groundcover (End of Season)
In year 1, the earliest DOP suppression application for both chemical combinations was least effective, and paraquat and paraquat + glufosinate had similar efficacy on groundcover suppression overall. In 2020, end-of-season PGC frequency for DOP paraquat, DOP paraquat + glufosinate, and V6 paraquat was similar to the unsuppressed controls. The PGC frequency for all other application dates and both suppression combinations was 36–94% less than the controls (p < 0.05) (Figure 2). Chemical combinations applied from DOP to V5 produced similar groundcover frequency between combinations at each stage.
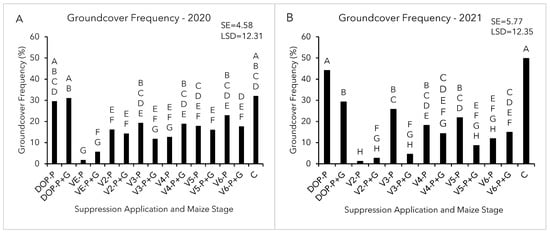
Figure 2.
(A) End-of-season groundcover frequency for treatments at the Sorenson Research Farm in 2020 and (B) end-of-season groundcover frequency for treatments at the Sorenson Research Farm in 2021. The standard error (SE) and least significant difference (LSD) are presented for each year, and uppercase letters above the treatment denote the LSD ranking for that treatment. Abbreviations are as follows: P, paraquat; P + G, paraquat + glufosinate; DOP, day of maize planting; VE, VE maize stage; V2, V2 maize stage; V3, V3 maize stage; V4, V4 maize stage; V5, V5 maize stage; V6, V6 maize stage; C, Control.
In contrast to the first year, more pronounced differences were observed for the effect of chemical treatment combination and timing of application on PGC recovery. In 2021, the paraquat alone produced greater end-of-season PGC frequency than the paraquat + glufosinate overall, and specifically at the DOP, V3, and V5 applications. The PGC frequency was less than the controls for both suppressants at all application dates, except the DOP paraquat, which was similar (Figure 2).
3.1.2. R:FR Ratio (Reflectance above Cover and Crop Canopy Weekly)
In both years, the reflected R:FR ratio from the groundcover canopy was greater for the chemical treatments than the controls immediately after the suppression application and for all collection dates thereafter (Table 2). An exception in year 1 was the DOP application, for which the R:FR ratio was similar to the controls by the second collection date. Earlier suppressed groundcovers began to recover and delivered decreased R:FR ratio near the end of the data collection period, although they were still significantly greater than the control. Paraquat and paraquat + glufosinate produced similar light quality overall in 2020.
Table 2.
Reflected R:FR ratio above perennial groundcover at the Sorenson Research Farm in 2020.
The same general trend observed in 2020 carried into 2021 with increased R:FR ratio after each application. The R:FR ratios for earlier suppressed treatments for both chemical combinations (DOP-V3) were similar to the controls by the last collection date on 23 June at V7. Unlike the first year, R:FR ratio in the later-suppressed treatments was greater than the controls prior to the suppression application, except the V3 Paraquat treatment. In contrast to year 1, paraquat + glufosinate produced better light quality than paraquat alone on the first three collection dates at maize stages V2, V3, and V5 in year 2 (p < 0.05) (Table 3).
Table 3.
Reflected R:FR ratio above perennial groundcover at the Sorenson Research Farm in 2021.
3.2. Maize Maturity, Plant Density, and Plant Height
3.2.1. Maize Maturity
In both years, maize in suppressed groundcover matured more rapidly than maize in the unsuppressed controls. In 2020, maize development was similar until stage V8 on 24 June. Thereafter, faster-maturing maize was observed in treatments with earlier applications of paraquat and paraquat + glufosinate (especially at DOP, VE, and V2 application stages) than the controls through the later maize vegetative stages. Reproductive stages, however, progressed similarly across treatments. In 2021, maize in suppressed groundcover was generally more mature than the controls from the V5 stage on 9 June until reproductive onset, whereafter reproductive stages progressed similarly. The maize plant maturity in the DOP paraquat was similar to the controls at all collection dates, while maize in the DOP paraquat + glufosinate was more mature at most collection dates than the control maize.
3.2.2. Maize Plant Density
In both years, maize stand was generally similar for treatments. In 2020, V2 maize plant density was 74,000 plants ha−1. At R6, the paraquat applied at V3 averaged 60,800 plants ha−1 (p ≤ 0.05), 15% less than the average of 71,400 plants ha−1 for all other treatments. In 2021, maize plant density averaged 73,000 and 78,600 plants ha−1 at V2 and R6, respectively.
3.2.3. Maize Plant Height
In both years, maize in unsuppressed groundcover was initially shorter than maize in suppressed groundcover during early maize vegetative stages, but final plant height was greater for maize in earlier suppressed groundcover than the unsuppressed controls. In 2020, maize plant height was greater for the VE, V2, and V3 applications than the controls, except at the earliest two collection dates. On 3 June (V3 maize stage with DOP, VE, and V2 applications completed), maize in the VE paraquat and VE paraquat + glufosinate applications was shorter than the control maize (p < 0.001) at 13, 15, and 17 cm, respectively. On 11 June (V5 maize stage, with DOP, VE, V2, V3, and V4 applications completed), maize in the VE, V2, and V3 paraquat (37, 36, and 33 cm, respectively) and VE, V2, and V3 paraquat + glufosinate (37, 38, and 38 cm, respectively) was shorter than the control maize (40 cm) (p < 0.05). This trend reversed beginning 24 June (V8 maize stage), when maize plant height in the VE paraquat and VE paraquat + glufosinate applications was greater than the controls (p < 0.05) at 103, 102, and 93, respectively. At final plant height on 22 July at R1, maize was taller in the paraquat and paraquat + glufosinate applications at VE, V2, and V3 (247, 232, 232, respectively) than the control maize (221 cm) (p < 0.05).
In 2021, the maize in the earlier suppressed groundcover was shorter than the unsuppressed groundcover through the V5 stage on 9 June. On 25 May (V2 maize stage, with DOP and V2 applications completed), maize in the DOP and V2 paraquat + glufosinate (14 cm) and V2 paraquat (15 cm) applications was shorter than the unsuppressed controls (18 cm) (p < 0.01). On 2 June (V3 maize stage with DOP, VE, V2, and V3 applications completed), plant heights were similar for all treatments, averaging 28 cm. By 15 June (V6 maize stage with DOP, VE, V2, V3, V4, and V5 applications completed) and thereafter, chemical suppression treatments through the V5 maize stage produced taller maize than the controls for the rest of the season, excepting the paraquat DOP application.
3.3. Maize Grain Yield, Stover Yield, Total Aboveground Biomass, Yield Components, and Harvest Index
3.3.1. Maize Grain Yield
In both years, maize in suppressed groundcover produced greater grain yield than in unsuppressed groundcover. In 2020, suppression produced greater maize grain than the controls, except paraquat applied at DOP, V3, and V6 (Table 4). Paraquat + glufosinate yielded 8% more maize grain than paraquat alone across treatments, at 10.89 and 10.11 Mg ha−1, respectively. In 2021, both chemical combinations applied at all maize stages produced greater maize yields than the controls, except for the DOP applications, which were similar to the controls (Table 4). Unlike 2020, paraquat + glufosinate and paraquat alone produced similar grain yield overall in 2021.
Table 4.
Treatment means and significance for maize measurements, including grain yield (GY), stover yield (Stover), total aboveground biomass (TAB), and harvest index (HI), at Sorenson Research Farm in 2020 and 2021. Grain yield was obtained from hand and combine harvest and is expressed at 150 g kg−1 moisture content. Total aboveground biomass, stover yield, and HI are expressed on an oven-dry basis.
3.3.2. Maize Stover Yield
In both years, earlier suppression produced greater maize stover. In 2020, stover yield from the paraquat and paraquat + glufosinate at the earlier application dates of VE (8.57 and 8.23 Mg ha−1, respectively) and V2 (8.07 and 7.98 Mg ha−1, respectively) was greater than the controls (6.22 Mg ha−1) (Table 4). In 2021, the paraquat + glufosinate applied at the V2, V3, and V5 maize stages yielded more stover than the controls, as did the paraquat applied at the V4 maize stage (Table 4). Paraquat + glufosinate yielded 13% more maize stover than the paraquat alone across treatments, at 6.43 and 7.25 Mg ha−1, respectively.
3.3.3. Maize Total Aboveground Biomass
In 2020, suppression produced greater TAB than the controls except the DOP and V3 paraquat and both paraquat and paraquat + glufosinate at V6 (Table 4). Total aboveground biomass for DOP paraquat + glufosinate was 19% greater than for DOP paraquat, at 16.26 and 13.69 Mg ha−1, respectively. In 2021, suppression produced greater TAB than the controls except for the DOP applications, which were similar (Table 4). Paraquat + glufosinate yielded 8% more TAB than paraquat alone, at 15.86 and 14.75 Mg ha−1, respectively.
3.3.4. Maize Yield Components and Harvest Index
Earlier suppression generally produced greater maize yield components. In 2020, rows ear−1 was greater for the earlier applications at VE and V2 paraquat and paraquat + glufosinate and DOP paraquat + glufosinate (Table A1). In 2021, suppression produced greater rows ear−1 than the controls except for the earliest and latest applications of paraquat at DOP, V5, V6, and paraquat + glufosinate at V6 (Table A2). In 2021, maize ear length in all treatments was greater than the controls, except for the DOP and V6 applications (Table A2).
In 2020, kernels row−1 was greater for both chemical combinations at all dates, except for paraquat at V4 and paraquat + glufosinate at V6 (Table A1). In 2021, kernels row−1 was greater for both chemical combinations applied at V2, V3, and V4 and for paraquat at V5 (Table A2).
In 2020, kernels ear−1 was greater for paraquat and paraquat + glufosinate applied at DOP–V3, V5, and V6 paraquat than the controls (421 kernels ear−1), but not for the V4 applications and V6 paraquat + glufosinate. In 2021, kernels ear−1 was greater for paraquat and paraquat + glufosinate applied at V2–V4 and paraquat + glufosinate applied at V5 than the controls (376 kernels ear−1) (Table A2).
In 2020, kernel weight was greater for all applications at all dates than the controls (0.22 g kernel−1), except for DOP paraquat (Table A1). In 2021, kernel weight was largely similar between the suppression applications and controls, except paraquat + glufosinate at V3, V4, and V5 (0.30, 0.29, and 0.29 g kernel−1, respectively), which were greater than the controls (0.25 g kernel−1) (Table A2).
3.4. Weed Community
In both years, treatments with greater groundcover frequency produced fewer weeds. In 2020, the paraquat produced fewer fall weeds than paraquat + glufosinate overall, at 11.4 and 15.4 weeds m−2, respectively (p < 0.05). Greater weed density was observed in the paraquat and paraquat + glufosinate at VE (22.0 and 30.0, respectively) and paraquat and paraquat + glufosinate at V2 (20.0 and 26.6, respectively) than the controls (8.3 weeds m−2) (p < 0.01). The weed community was comprised of 71% grass species and 29% broadleaf species. The top three dominant weed species included foxtail (Sertaria spp.) species (67%), dandelion (Taraxacum sp. L.) (16%), and red clover (Trifolium pratense L.) (6%). In 2021, greater weed density was observed in the suppression treatments than the unsuppressed controls (6.6 weeds m−2). Treatments with greater weed density than the controls included paraquat + glufosinate at DOP, V2, V3, V4, and V5, at 17.6, 22.6, 16.0, 16.6, and 15.6 weeds m−2, respectively, (p < 0.05), and paraquat at V2 and V3, at 18.0 and 24.4 weeds m−2, respectively (p < 0.05). In 2021, 69% of the weed community was comprised of grasses and 31% of broadleaf species, with the top three weed species by density being green foxtail [Setaria italica (L.) P. Beauv.] (47%), dandelion (Taraxacum sp. L.) (24%), and yellow foxtail [Setaria pumila (Poir.) Roem. & Schult] (13%).
4. Discussion
The greater end-of-season frequency observed in the controls in year 2 indicates post-establishment stand development, even under abnormally to severely dry conditions in central Iowa [47]. The paraquat + glufosinate suppressed groundcover more effectively than paraquat alone in year 2, producing better light quality to support maize growth and development with reduced end-of-season PGC frequency. The R:FR ratio indicated that groundcover suppressed at the earliest maize stages began post-suppression recovery before the end of the maize CPWC in both years [27,48], similar to other reports of rapid post-suppression recovery after chemical suppression [12,14,15,49]. The decreased R:FR ratio recorded after suppression resulted from groundcover regrowth and green tissue recovery that absorbs red light and concurrently reflects most far-red light [23,43,50,51]. Specifically, the groundcover suppressed at DOP by paraquat initiated regrowth by the V3 maize stage in both years and for the DOP paraquat + glufosinate by the V5 stage in year 1, when the reflected R:FR ratio from the groundcover canopy was similar to the unsuppressed controls. The established groundcover suppressed by the DOP paraquat + glufosinate and both V2 and V3 combinations in year 2 initiated regrowth by the V7 maize stage, when these treatments produced a similar R:FR ratio to the unsuppressed controls. In addition to lower light quality, the DOP paraquat in both years and DOP paraquat + glufosinate in year 1 produced similar end-of-season groundcover frequency to the controls. However, the year 2 end-of-season groundcover frequency in the DOP paraquat + glufosinate, V2, and V3 applications was still less than the controls, indicating less robust recovery.
The inconsistent suppression efficacy of the two chemical combinations between years was largely weather-dependent. We reviewed weather-related factors influencing glufosinate activity to explain the increased paraquat + glufosinate groundcover suppression efficacy in year 2, including maximum and average relative humidity, maximum and minimum temperature, and solar radiation at each application date in both years. While there were no meaningful trends observed regarding maximum relative humidity, temperature, or solar radiation, the average relative humidity was 23, 104, and 86% greater at the DOP, V3, and V5 application dates, respectively, in year 2 than year 1. Relative humidity increases translocation at least marginally and thereby increases glufosinate-ammonium efficacy [52,53], producing decreased end-of-season groundcover frequency in year 2 where glufosinate was applied. There are also confounding issues for suppression efficacy of a juvenile stand in the first year versus an established stand in the second year with active vegetative growth, as well as a legacy effect in the second year from first-year suppression.
Earlier suppression produced shorter maize plant height at the earliest collection dates and greater final maize plant height resulting from better light quality and conservative groundcover recovery. As previously reported, the early season maize plant elongation in later suppressed groundcover diminished 30 days after maize plant emergence [54]. Strip-tillage reduces early season resource competition in proximity to the maize plant in a PGC system, singling out the effect of light quality on this plant response. However, groundcover competition may have amplified the SAR effect and reduction in final maize plant height in PGC treatments where groundcover more strongly recovered. The SAR induces maize plant etiolation, larger leaves or rapidly developing leaves, and greater shoot to root ratio during early maize vegetative growth stages [24,25]. While restricted light quantity can elicit this response in plants [43], the light quantity available to the maize in PGC was likely unaffected by the low-growing groundcover in this experiment. We therefore attribute results to decreased light quality from the adjacent groundcover, resulting in physiological changes to the maize plant from perceived competition. Final maize plant height was greater than controls for VE, V2, and V3 applications in year 1, with lower end-of-season groundcover frequency and greater R:FR ratio than controls after suppression. These findings indicate that an insufficient suppression duration was achieved in year 1 for maize development when suppressants were applied at the earliest (DOP) and later (≥V4) maize stages. In year 2, while DOP and V2 paraquat + glufosinate and V2 paraquat produced the most conservative end-of-season groundcover frequency, the R:FR ratio suggests groundcover recovery from the V7 maize stage for earlier applications. Suppression at all stages, however, produced taller terminal maize plant height than controls in year 2, except for DOP paraquat. Moderate-to-severe drought conditions in year 2 likely impacted maize height response, as final maize plant height was 5% less in year 2 than year 1 across treatments. Future research can investigate internode length as a response metric for the SAR.
Our results for maize growth and development are consistent with previous research, which shows a delay in maize maturity after early exposure to weeds [25]. We believe the greater average plant density from V2 to R6 is a result of delayed emergence caused by the moderate drought conditions at that time [47], which caused uneven germination and emergence.
Maize yield was similar to the controls where suppression was less effective at the earliest applications or shorter in duration when applied at the later maize stages. In Iowa, early postemergence application at the V2 maize stage still resulted in reductions to conventional maize shoot dry weight and produced less yield than the weed-free control [55]. Weeds decrease the proportion of biomass partitioned to the grain and can account for most dry matter loss [26]. The earliest suppression applications at DOP should therefore have produced greater maize yield than the controls, which was not the case largely because of rapid post-suppression recovery. The greater grain yield in the first year and greater stover and TAB in the second year in the paraquat + glufosinate treatments resulted from enhanced efficacy of the paraquat + glufosinate over paraquat alone, producing better light quality and longer groundcover suppression duration. The more severe drought that occurred in year 2 also caused moisture stress affecting maize grain yield that year, and maize yield potential was unrealized.
Maize yield components were reduced by the SAR in PGC suppressed at later maize stages or groundcover competition during reproductive stages, with severe moisture stress in year 2. Row number is determined early in the maize growing season, by the V7 maize stage after ear initiation [41]. The V2 applications in both years plus earlier applications in year 1 and slightly later applications in year 2 produced greater rows ear−1 than the controls. The treatments producing greater rows ear−1 generally produced greater final maize plant height and better light quality than the controls after suppression in year 1 and after suppression until the V7 maize stage in year 2. In our experiment, greater maize kernels ear−1 was produced within a narrower and earlier suppression window in year 2 than year 1. In year 2 with severe drought stress, kernel weight was greater where paraquat + glufosinate better suppressed the groundcover and decreased competition, while in year 1, almost all suppression treatments produced greater kernel weight than the control when moisture insufficiency was less acute. Other researchers have found that the SAR amplified early-season environmental stressors, such as drought, further reducing maize kernel number per plant [26]. Additionally, maize silking and grain fill are also sensitive to environmental stressors, such as drought, that attenuate plant growth rate and decrease kernel set and kernel weight [26,56]. Where the SAR decreases kernels ear−1, kernel weight compensates for potential grain yield losses where nutrients and water are nonlimiting [54], potentially occurring in our experiment where groundcover was more effectively suppressed. Where weed control is delayed, reduced biomass partitioning to the ear accounts for much of the grain yield reduction [26]. Reductions in plant dry matter lead to declines in both kernel number and kernel weight [57].
Weed density and groundcover frequency were negatively correlated in both years, consistent with prior reports [58,59]. In year 2 in particular, where the paraquat alone produced greater end-of-season PGC frequency than the paraquat + glufosinate, greater weed density than the unsuppressed controls was recorded in five paraquat + glufosinate treatments versus two paraquat treatments. With weed resistance to all current herbicide modes of action [60,61], the PGC system is a weed control option that is not dependent on the discovery of new modes of action. Without herbicide control, crop yield losses are estimated at over 50% of maize and soybean [Glycine max (L.) Merr.] in the US and Canada, totaling USD 43 billion in lost annual revenue [62]. Consistent with our findings, groundcovers that minimize weed pressure usually require management to reduce competition with the grain crop [63]. Subsequent studies might include data collection on both weed biomass and weed density as predictors of crop yield in the system.
5. Conclusions
Earlier suppression produced greater maize grain, stover, and TAB than the unsuppressed controls, and suppression treatments produced greater maize yield components than the unsuppressed controls. However, the reflected R:FR ratio recorded for the groundcover suppressed at earlier maize stages indicates groundcover recovery before the end of the CPWC. Furthermore, the efficacy of the paraquat + glufosinate in the second year was weather-dependent. These findings underscore the need to develop reliable suppression practices and groundcover species compatibility to support maize production. To achieve similar yields in PGC to conventional production, chemical suppression should turn the groundcover brown from the day of maize planting until the end of the CPWC, limit recovery through silking and early grain fill, with biomass regrowth to provide soil cover at row crop harvest. Chemical or mechanical suppression could be coupled with summer dormancy to circumvent the R:FR ratio light quality shift, eliminating both the SAR and resource competition in the system. Further screening and development of PGC varieties that are receptive to the required suppression duration are an integral part of PGC system development, as is identifying reliable suppression chemistries.
Author Contributions
Conceptualization, C.A.B., K.J.M., S.-z.F., A.W.L. and R.L.H.; methodology, C.A.B., K.J.M., S.-z.F., A.W.L. and R.L.H.; formal analysis, C.A.B., K.J.M. and S.M.K.; investigation, C.A.B., K.J.M., S.-z.F., A.W.L., R.L.H. and S.M.K.; writing—original draft preparation, C.A.B.; writing—review and editing, C.A.B., K.J.M., S.-z.F. and A.W.L.; project administration, K.J.M.; funding acquisition, K.J.M., S.-z.F. and A.W.L. All authors have read and agreed to the published version of the manuscript.
Funding
This research was funded by the Agriculture and Food Research Initiative Competitive Award No. 2017-67019-26370, from the United States Department of Agriculture National Institute for Food and Agriculture.
Data Availability Statement
All data are provided in this article within the format of tables and figures.
Conflicts of Interest
The authors declare no conflict of interest. The funders had no role in the design of the study; in the collection, analyses, or interpretation of data; in the writing of the manuscript; or in the decision to publish the results.
Appendix A
Table A1.
Treatment means and significance for maize yield components of rows per ear (RE), kernel weight, kernels per ear (KE), and kernels per row (KR) at Sorenson Research Farm in 2020.
Table A1.
Treatment means and significance for maize yield components of rows per ear (RE), kernel weight, kernels per ear (KE), and kernels per row (KR) at Sorenson Research Farm in 2020.
| Treatment | RE | Kernel Weight | KE | KR |
|---|---|---|---|---|
| no. ear−1 | g kernel−1 | no. ear−1 | no. row−1 | |
| 2020 | ||||
| DOP-P | 14.5 | 0.24 | 482 | 33.4 |
| DOP-P + G | 14.6 | 0.25 | 467 | 33.0 |
| VE-P | 15.1 | 0.27 | 529 | 33.8 |
| VE-P + G | 14.9 | 0.28 | 495 | 33.6 |
| V2-P | 14.6 | 0.28 | 520 | 35.1 |
| V2-P + G | 15.0 | 0.28 | 515 | 33.8 |
| V3-P | 13.8 | 0.29 | 490 | 35.7 |
| V3-P + G | 14.1 | 0.27 | 487 | 34.0 |
| V4-P | 13.7 | 0.28 | 443 | 32.6 |
| V4-P + G | 13.8 | 0.28 | 459 | 34.2 |
| sV5-P | 14.5 | 0.27 | 486 | 33.8 |
| V5-P + G | 14.2 | 0.27 | 478 | 33.8 |
| V6-P | 13.7 | 0.26 | 475 | 35.2 |
| V6-P + G | 13.7 | 0.26 | 437 | 32.0 |
| C | 13.9 | 0.22 | 421 | 30.5 |
| SE | 0.27 | 0.01 | 17.84 | 0.93 |
| Pr > F | ||||
| Treatment | 0.0009 | <0.0001 | 0.0003 | 0.0020 |
| P vs. P + G | 0.7378 | 0.7975 | 0.2009 | 0.1655 |
| P vs. C DOP | 0.0570 | 0.1466 | 0.0051 | 0.0121 |
| P + G vs. C DOP | 0.0452 | 0.0043 | 0.0330 | 0.0250 |
| P vs. C VE | 0.0004 | <0.0001 | <0.0001 | 0.0041 |
| P + G vs. C VE | 0.0031 | <0.0001 | 0.0009 | 0.0064 |
| P vs. C V2 | 0.0264 | <0.0001 | <0.0001 | 0.0001 |
| P + G vs. C V2 | 0.0009 | <0.0001 | <0.0001 | 0.0038 |
| P vs. C V3 | 0.6641 | <0.0001 | 0.0019 | <0.0001 |
| P + G vs. C V3 | 0.4611 | <0.0001 | 0.0027 | 0.0022 |
| P vs. C V4 | 0.5934 | <0.0001 | 0.2892 | 0.0651 |
| P + G vs. C V4 | 0.8042 | <0.0001 | 0.0734 | 0.0014 |
| P vs. C V5 | 0.0566 | 0.0002 | 0.0030 | 0.0041 |
| P + G vs. C V5 | 0.3641 | <0.0001 | 0.0089 | 0.004 |
| P vs. C V6 | 0.5025 | 0.0002 | 0.0131 | <0.0001 |
| P + G vs. C V6 | 0.4915 | 0.0013 | 0.4556 | 0.1715 |
Abbreviations are as follows: P, paraquat; P + G, paraquat + glufosinate; DOP, day of maize planting; VE, VE maize stage; V2, V2 maize stage; V3, V3 maize stage; V4, V4 maize stage; V5, V5 maize stage; V6, V6 maize stage; C, Controls; SE, standard error.
Table A2.
Treatment means and significance for maize yield components of rows per ear (RE), kernel weight, kernels per ear (KE), kernels per row (KR), and ear length at Sorenson Research Farm in 2021.
Table A2.
Treatment means and significance for maize yield components of rows per ear (RE), kernel weight, kernels per ear (KE), kernels per row (KR), and ear length at Sorenson Research Farm in 2021.
| Treatment | RE | Kernel Weight | KE | KR | Ear Length |
|---|---|---|---|---|---|
| no. ear−1 | g kernel−1 | no. ear−1 | no. row−1 | cm | |
| 2021 | |||||
| DOP-P | 12.8 | 0.25 | 388 | 31.1 | 13.2 |
| DOP-P + G | 13.4 | 0.24 | 403 | 31.6 | 13.5 |
| V2-P | 13.8 | 0.26 | 465 | 34.3 | 14.4 |
| V2-P + G | 13.9 | 0.27 | 480 | 35.4 | 15.2 |
| V3-P | 13.6 | 0.26 | 450 | 33.9 | 14.4 |
| V3-P + G | 14.2 | 0.30 | 449 | 35.2 | 15.0 |
| V4-P | 13.7 | 0.27 | 456 | 34.8 | 14.7 |
| V4-P + G | 13.6 | 0.28 | 456 | 34.2 | 14.7 |
| V5-P | 12.9 | 0.28 | 416 | 33.5 | 14.3 |
| V5-P + G | 13.7 | 0.29 | 436 | 32.7 | 14.4 |
| V6-P | 13.2 | 0.27 | 415 | 32.3 | 13.8 |
| V6-P + G | 12.5 | 0.28 | 405 | 32.1 | 13.7 |
| C | 12.6 | 0.25 | 376 | 30.4 | 13.3 |
| SE | 0.29 | 0.01 | 19.47 | 1.03 | 0.38 |
| Pr > F | |||||
| Treatment | 0.0001 | 0.0305 | 0.0007 | 0.0022 | 0.0022 |
| P vs. P + G | 0.2569 | 0.0824 | 0.5634 | 0.7139 | 0.2042 |
| P vs. C DOP | 0.4806 | 0.8988 | 0.5852 | 0.5658 | 0.8378 |
| P + G vs. C DOP | 0.0209 | 0.4297 | 0.2233 | 0.3087 | 0.6057 |
| P vs. C V2 | 0.0004 | 0.5591 | 0.0002 | 0.0021 | 0.0143 |
| P + G vs. C V2 | 0.0002 | 0.1467 | <0.0001 | 0.0001 | 0.0001 |
| P vs. C V3 | 0.0035 | 0.4384 | 0.0014 | 0.0050 | 0.0154 |
| P + G vs. C V3 | <0.0001 | 0.0012 | 0.0018 | 0.0002 | 0.0003 |
| P vs. C V4 | 0.0013 | 0.1648 | 0.0007 | 0.0006 | 0.0025 |
| P + G vs. C V4 | 0.0045 | 0.0206 | 0.0007 | 0.0027 | 0.0032 |
| P vs. C V5 | 0.2784 | 0.0583 | 0.0727 | 0.0120 | 0.0274 |
| P + G vs. C V5 | 0.0018 | 0.0095 | 0.0087 | 0.0642 | 0.0149 |
| P vs. C V6 | 0.0888 | 0.2270 | 0.0818 | 0.1166 | 0.3069 |
| P + G vs. C V6 | 0.7338 | 0.0611 | 0.1928 | 0.1671 | 0.3547 |
Abbreviations are as follows: P, paraquat; P + G, paraquat + glufosinate; DOP, day of maize planting; VE, VE maize stage; V2, V2 maize stage; V3, V3 maize stage; V4, V4 maize stage; V5, V5 maize stage; V6, V6 maize stage; C, Controls, SE, standard error.
References
- Foley, J.A.; DeFries, R.; Asner, G.P.; Barford, C.; Bonan, G.; Carpenter, S.R.; Chapin, F.S.; Coe, M.T.; Daily, G.C.; Gibbs, H.K.; et al. Global consequences of land use. Science 2005, 309, 570–574. [Google Scholar] [CrossRef] [PubMed] [Green Version]
- Follett, R.F. Soil management concepts and carbon sequestration in cropland soils. Soil Tillage Res. 2001, 71, 77–92. [Google Scholar] [CrossRef]
- Reicosky, D.C.; Forcella, F. Cover crop and soil quality interactions in agroecosystems. J. Soil Water Conserv. 1998, 53, 224–229. [Google Scholar]
- Perfect, E.; Kay, B.D.; van Loon, W.K.P.; Sheard, R.W.; Posajok, T. Rates of change in soil structural stability under forages compared to corn. Soil Sci. Soc. Am. J. 1990, 54, 179–186. [Google Scholar] [CrossRef]
- Johnson, J.M.-F.; Allmaras, R.R.; Reicosky, D.C. Estimating Source Carbon from Crop Residues, Roots and Rhizodeposits Using the National Grain-Yield Database. Agron. J. 2006, 98, 622–636. [Google Scholar] [CrossRef] [Green Version]
- Wilhelm, W.W.; Johnson, J.M.F.; Hatfield, J.L.; Voorhees, W.B.; Linden, D.R. Crop and soil productivity response to maize residue removal: A literature review. Agron. J. 2004, 96, 1–17. [Google Scholar] [CrossRef]
- Tisdall, J.M.; Oades, J.M. Organic matter and water-stable aggregates in soils. J. Soil Sci. 1982, 33, 141–163. [Google Scholar] [CrossRef]
- Bharati, L.; Lee, K.-H.; Isenhart, T.M.; Schultz, R.C. Soil-water infiltration under crops, pasture, and established riparian buffer in Midwestern USA. Agrofor. Syst. 2002, 56, 249–257. [Google Scholar] [CrossRef]
- Franzluebbers, A.J. Water infiltration and soil structure related to organic matter and its stratification with depth. Soil Tillage Res. 2001, 66, 197–205. [Google Scholar] [CrossRef]
- Blanco-Canqui, H.; Lal, R. Corn stover removal for expanded uses reduces soil fertility and structural stability. Soil Sci. Soc. Am. J. 2009, 73, 418–426. [Google Scholar] [CrossRef]
- Kim, S.; Dale, B.E. Life cycle assessment of various cropping systems utilized for producing biofuels: Bioethanol and biodiesel. Biomass Bioenerg. 2005, 29, 426–439. [Google Scholar] [CrossRef]
- Bartel, C.A.; Banik, C.; Lenssen, A.W.; Moore, K.J.; Laird, D.A.; Archontoulis, S.V.; Lamkey, K.R. Living mulch for sustainable maize stover biomass harvest. Crop Sci. 2017, 57, 3273–3290. [Google Scholar] [CrossRef] [Green Version]
- Bartel, C.A.; Banik, C.; Lenssen, A.W.; Moore, K.J.; Laird, D.A.; Archontoulis, S.V.; Lamkey, K.R. Establishment of perennial groundcovers for maize-based bioenergy production systems. Agron. J. 2017, 109, 822–835. [Google Scholar] [CrossRef] [Green Version]
- Flynn, E.S.; Moore, K.J.; Singer, J.W.; Lamkey, K.R. Evaluation of grass and legume species as perennial ground covers in corn production. Crop Sci. 2013, 53, 1–10. [Google Scholar] [CrossRef]
- Elkins, D.M.; Vandeventer, J.W.; Xapusta, G.; Anderson, M.R. No-tillage maize production in chemically suppressed grass sod. Agron. J. 1979, 71, 101–105. [Google Scholar] [CrossRef]
- Wiggans, D.R.; Singer, J.W.; Moore, K.J.; Lamkey, K.R. Response of continuous maize with stover removal to living mulches. Agron. J. 2012, 104, 917–925. [Google Scholar] [CrossRef] [Green Version]
- Bartel, C.A.; Archontoulis, S.V.; Lenssen, A.W.; Moore, K.J.; Huber, I.L.; Laird, D.A.; Dixon, P.M. Modeling perennial groundcover effects on annual maize grain crop growth with APSIM. Agron. J. 2020, 112, 1895–1910. [Google Scholar] [CrossRef]
- Wenig, C. Differing selection in alternative competitive environments: Shade-avoidance responses and germination timing. Evolution 2000, 54, 124–136. [Google Scholar] [CrossRef]
- Ruberti, I.; Sessa, G.; Ciolfi, A.; Possenti, M.; Carabelli, M.; Morelli, G. Plant adaptation to dynamically changing environment: The shade avoidance response. Biotechnol. Adv. 2012, 30, 1047–1058. [Google Scholar] [CrossRef]
- Devlin, P.F. Plants wait for the lights to change to red. Proc. Natl. Acad. Sci. USA 2016, 116, 7301–7303. [Google Scholar] [CrossRef] [Green Version]
- Wille, W.; Pipper, C.B.; Rosenqvist, E.; Andersen, S.B.; Weiner, J. Reducing shade avoidance responses in a cereal crop. AoB Plants 2017, 9, plx039. [Google Scholar] [CrossRef] [PubMed] [Green Version]
- Ballaré, C.L.; Sanchez, R.A.; Scopel, A.L.; Casal, J.J.; Ghersa, C.M. Early detection of neighbour plants by phytochrome perception of spectral changes in reflected sunlight. Plant Cell Environ. 1987, 10, 551–557. [Google Scholar]
- Ballaré, C.L.; Scopel, A.L.; Sanchez, R.A. Far-red radiation reflected from adjacent leaves: An early signal of competition in plant canopies. Science 1990, 247, 329–331. [Google Scholar] [CrossRef]
- Rajcan, I.; Chandler, K.J.; Swanton, C.J. Red–far-red ratio of reflected light: A hypothesis of why early-season weed control is important in corn. Weed Sci. 2004, 52, 774–778. [Google Scholar] [CrossRef]
- Page, E.R.; Tollenaar, M.; Lee, E.A.; Lukens, L.; Swanton, C.J. Does the shade avoidance response contribute to the critical period for weed control in maize (Zea mays)? Weed Res. 2009, 49, 563–571. [Google Scholar] [CrossRef]
- Page, E.R.; Cerrudo, D.; Westra, P.; Loux, M.; Smith, K.; Foresman, C.; Wright, H.; Swanton, C.J. Why early season weed control is important in maize. Weed Sci. 2012, 60, 423–430. [Google Scholar] [CrossRef]
- Hall, M.R.; Swanton, C.J.; Anderson, G.W. The critical period of weed control in grain corn (Zea mays). Weed Sci. 1992, 40, 441–447. [Google Scholar] [CrossRef]
- Knezevic, S.Z.; Evans, S.P.; Blankenship, E.E.; Van Acker, R.C.; Lindquist, J.L. Critical period for weed control: The concept and data analysis. Weed Sci. 2002, 50, 773–786. [Google Scholar] [CrossRef] [Green Version]
- Dekker, J.; Duke, S.O. Herbicide-resistant field crops. Adv. Agron. 1995, 54, 69–116. [Google Scholar] [CrossRef] [Green Version]
- Masclaux-Daubresse, C.; Daniel-Vedele, F.; Dechorgnat, J.; Chardon, F.; Gaufichon, L.; Suzuki, A. Nitrogen uptake, assimilation and remobilization in plants: Challenges for sustainable and productive agriculture. Ann. Bot. 2010, 105, 1141–1157. [Google Scholar] [CrossRef] [Green Version]
- Xu, G.; Xiaorong, F.; Miller, A.J. Plant nitrogen assimilation and use efficiency. Annu. Rev. Plant Biol. 2012, 63, 153–182. [Google Scholar] [CrossRef] [PubMed] [Green Version]
- Duke, S.O. Biotechnology: Herbicide-resistant crops. In Encyclopedia of Agriculture and Food Systems; Van Alfen, N., Ed.; Elsevier: San Diego, CA, USA, 2014; Volume 2, pp. 94–116. [Google Scholar]
- Burke, I.C.; Bell, J.L. Plant health management: Herbicides. Encycl. Agric. Food Syst. 2014, 4, 425–440. [Google Scholar]
- US EPA. Paraquat Dichloride. Available online: https://www.epa.gov/ingredients-used-pesticide-products/paraquat-dichloride (accessed on 2 January 2022).
- Mehler, A.H. Studies on reactions of illuminated chloroplasts. II. Stimulation and inhibition of the reaction with molecular oxygen. Arch. Biochem. Biophys. 1951, 33, 339–351. [Google Scholar] [CrossRef]
- Apel, K.; Hirt, H. Reactive oxygen species: Metabolism, oxidative stress, and signal transduction. Annu. Rev. Plant Biol. 2004, 55, 373–399. [Google Scholar] [CrossRef] [Green Version]
- Duke, S.O.; Pan, Z.; Bajsa-Hirschel, J. Proving the mode of action of phytotoxic phytochemicals. Plants 2020, 9, 1756. [Google Scholar] [CrossRef]
- Iowa Environmental Mesonet Network. National Weather Service Cooperative Observer Program. Iowa Environ. Mesonet Network. 2021. Available online: https://mesonet.agron.iastate.edu/COOP/ (accessed on 1 November 2021).
- Pioneer.com. 18D-1182 Northern Iowa Product Guide. Available online: www.pioneer.com/corn (accessed on 1 May 2020).
- Pioneer. Product Spotlight P0574AM and P0574AMXT. 2018. Available online: https://www.youtube.com/watch?v=dISMb9x2Tiw (accessed on 1 May 2020).
- Abendroth, L.J.; Elmore, R.W.; Boyer, M.J.; Marlay, S.K. Corn Growth and Development; Ext. Publ. PMR-1009; Iowa State University: Ames, IA, USA, 2011; Available online: https://store.extension.iastate.edu/Product/Corn-Growth-and-Development (accessed on 22 April 2022).
- Spectrum Technologies, Inc. Red/Far-Red Light Meter Product Manual Item # 3412. 2018. Available online: https://www.specmeters.com/assets/1/22/3412_Red_-_Far_Red_Meter_(Web)2.pdf (accessed on 2 April 2020).
- Smith, H. Light quality, photoperception, and plant strategy. Annu. Rev. Plant Physiol. 1982, 33, 481–518. [Google Scholar] [CrossRef]
- Dobermann, A. Procedure for Measuring Dry Matter, Nutrient Uptake, Yield and Components of Yield in Maize. Researchgate. 2005. Available online: https://www.researchgate.net/file.PostFileLoader.html?id=56a89ca57eddd3b3618b45aa&assetKey=AS%3A322455225208832%401453890724796 (accessed on 22 April 2022).
- Vogel, K.P.; Masters, R.A. Frequency grid: A simple tool for measuring grassland establishment. J. Range Manag. 2001, 54, 653–655. [Google Scholar] [CrossRef]
- SAS Institute. SAS/STAT 9.3 User’s Guide; SAS Institute: Cary, NC, USA, 2011. [Google Scholar]
- National Drought Mitigation Center. US Drought Monitor Comparison Slider. 2021. Available online: https://droughtmonitor.unl.edu/Maps/ComparisonSlider.aspx (accessed on 3 January 2022).
- Tursun, N.; Datta, A.; Sakinmaz, M.S.; Kantarci, Z.; Knezevic, S.Z.; Chauhan, B.S. The critical period for weed control in three corn (Zea mays L.) types. Crop Prot. 2016, 90, 59–65. [Google Scholar] [CrossRef]
- Elkins, D.; Frederking, D.; Marashi, R.; McVay, B. Living mulch for no-till corn and soybeans. J. Soil Water Conserv. 1983, 38, 431–433. [Google Scholar]
- Kasperbauer, M.J. Far-red reflection from green leaves and effects on phytochrome-mediated assimilate partitioning under field conditions. Plant Phys. 1987, 85, 350–354. [Google Scholar] [CrossRef] [Green Version]
- Matthews, S. Phytochrome-mediated development in land plants: Red light sensing evolves to meet the challenges of changing light environments. Mol. Ecol. 2006, 15, 3483–3503. [Google Scholar] [CrossRef] [PubMed]
- Anderson, D.M.; Swanton, C.J.; Hall, J.C.; Mersey, B.G. The influence of temperature and relative humidity on the efficacy of glufosinate-ammonium. Weed Res. 1993, 33, 139–147. [Google Scholar] [CrossRef]
- Coetzer, E.; Al-Khatib, K.; Loughin, T.M. Glufosinate efficacy, absorption, and translocation in Amaranth as affected by relative humidity and temperature. Weed Sci. 2001, 49, 8–13. [Google Scholar] [CrossRef]
- Page, E.R.; Tollenaar, M.; Lee, E.A.; Lukens, L.; Swanton, C.J. Shade avoidance: An integral component of crop–weed competition. Weed Res. 2010, 50, 281–288. [Google Scholar] [CrossRef]
- Hartzler, R.G.; Early-Season Weed Competition in Corn. Iowa State Research Farm Progress Reports. 2009. Available online: http://lib.dr.iastate.edu/farms_reports/582 (accessed on 17 May 2022).
- Borrás, L.; Gambín, B.L. Trait dissection of maize kernel weight: Towards integrating hierarchical scales using a plant growth approach. Field Crops Res. 2010, 118, 1–12. [Google Scholar] [CrossRef]
- Cerrudo, D.; Page, E.R.; Tollenaar, M.; Stewart, G.; Swanton, C.J. Mechanisms of yield loss in maize caused by weed competition. Weed Sci. 2012, 60, 225–232. [Google Scholar] [CrossRef]
- Ateh, C.M.; Doll, J.D. Spring-planted winter rye (Secale cereale) as a living mulch to control weeds in soybean (Glycine max). Weed Technol. 1996, 10, 347–353. [Google Scholar] [CrossRef]
- Echtenkamp, G.W.; Moomaw, R.S. No-till corn production in a living mulch system. Weed Technol. 1989, 3, 261–266. [Google Scholar] [CrossRef]
- Duke, S.O. Why have no new herbicide modes of action appeared in recent years? Pest Manag. Sci. 2012, 68, 505–512. [Google Scholar] [CrossRef] [Green Version]
- Green, J.M. Current state of herbicides in herbicide-resistant crops. Pest Manag. Sci. 2014, 70, 1351–1357. [Google Scholar] [CrossRef]
- Soltani, N.; Dille, J.; Burke, I.; Everman, W.; VanGessel, M.; Davis, V.; Sikkema, P. Potential corn yield losses from weeds in North America. Weed Technol. 2016, 30, 979–984. [Google Scholar] [CrossRef]
- Teasdale, J.R. Contribution of cover crops to weed management in sustainable agricultural systems. J. Prod. Agric. 1996, 9, 475–479. [Google Scholar] [CrossRef]
Publisher’s Note: MDPI stays neutral with regard to jurisdictional claims in published maps and institutional affiliations. |
© 2022 by the authors. Licensee MDPI, Basel, Switzerland. This article is an open access article distributed under the terms and conditions of the Creative Commons Attribution (CC BY) license (https://creativecommons.org/licenses/by/4.0/).